Bearing Capacity of Breakwater Subjected to Tsunami-Induced Scour
Publication: Journal of Geotechnical and Geoenvironmental Engineering
Volume 149, Issue 6
Abstract
Physical models have suggested a large reduction in bearing capacity of simple foundations due to overtopping tsunami scour. We use the results of these tests to create scoured foundation geometries for simple breakwater-type structures and investigate the change in the system’s capacity due to scour through the use of simple two-dimensional (2D) numerical analysis using an advanced constitutive model. The particular aspects of the construction of such models and the general applicability of the method are also discussed. A simple method for estimating the reduction in capacity due to scour is proposed through the use of modified vertical, horizontal force, and moment (VHM) failure surfaces. The general method for creating such simplified scour-dependent failure surfaces is described thoroughly, such that the process can be replicated for other foundation configurations or scour problems. Results indicated that even a small amount of scouring can lead to a substantial reduction in the horizontal and moment capacity of a foundation, the effect of scour is shown to be a nonuniform contraction of the failure envelope, where both the ultimate vertical capacity as well as the relative ratios between vertical, horizontal and moment capacity are strongly affected by the presence of scour. Such a conclusion demonstrates clearly how simply increasing the unscoured factor of safety of such structures is not sufficient to guarantee stability in the event of scouring. The presented methodology for determining the scoured failure surfaces provides a simple, logical means to estimate the performance of such systems undergoing scour.
Introduction
Scouring (loss of soil material due to water flow) can have a major impact on the performance of structures, and has been held responsible for a great number of failures, particularly breakwaters, during the 2011 Tohoku earthquake and tsunami (Kato et al. 2012). It has been speculated that tsunami overtopping, and so-called joint scour between breakwater blocks, can reduce the contact area of the soil–foundation interface, leading to a reduction of the apparent friction coefficient, resulting in sliding failure of caisson-type breakwaters (Arikawa et al. 2012). Such a mechanism has been used to explain the dramatic failure of the Kamaishi breakwater, which was designed to be tsunami-resistant, having a sliding capacity well in excess of the expected peak hydrodynamic force imposed by the tsunami. However, this speculated mechanism is inconsistent with the current understanding of interface friction, which is not a function of the contact area.
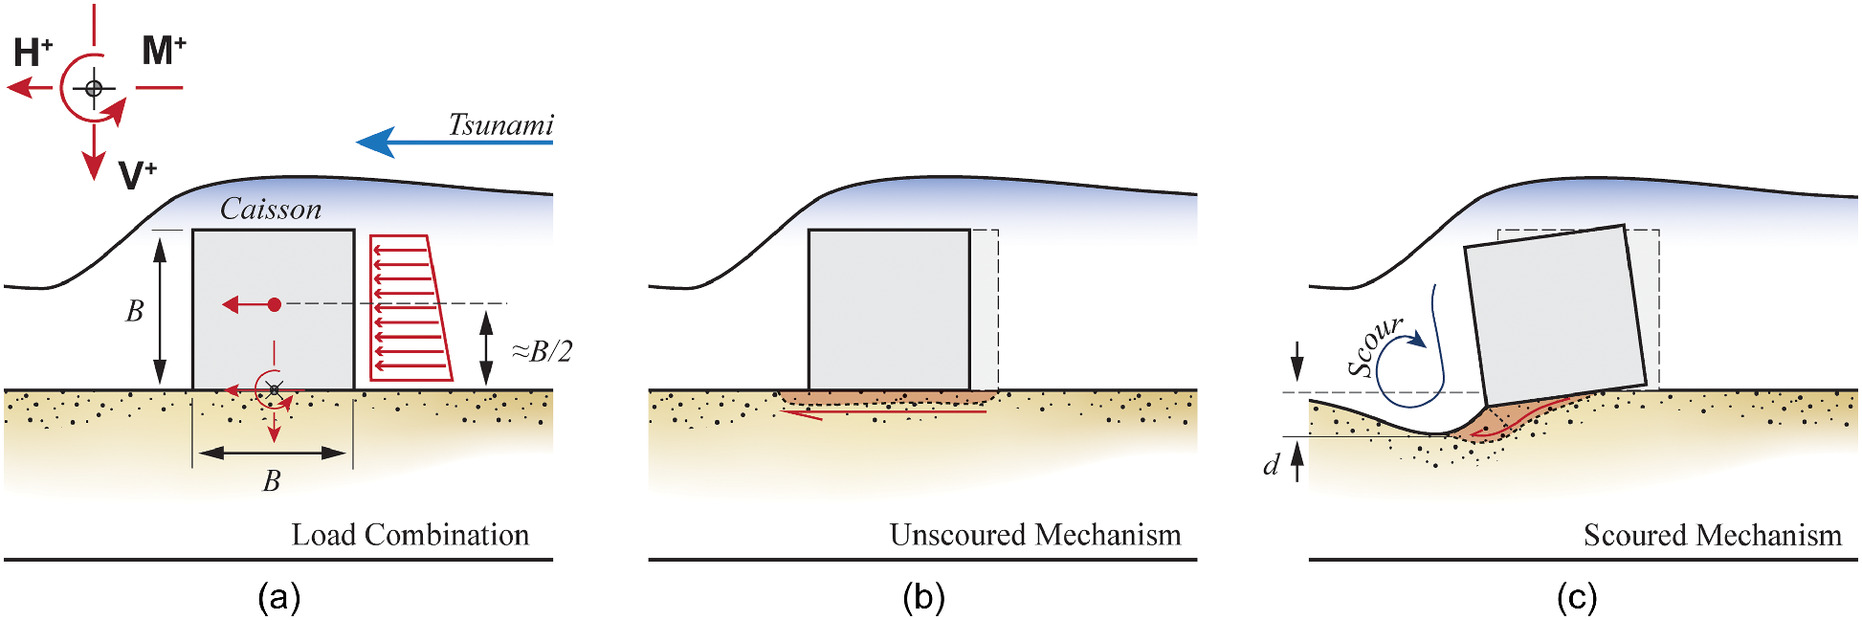
Recent physical model tests (Jones and Anastasopoulos 2022) have revealed that scouring can lead to failure of similar, extremely robust systems through the removal of foundation soil. Analysis of the failure of these structures using high-speed photography revealed significant build-up of shear-strains within the soil before failure, and a significantly different failure mechanism for the same vertical and horizontal force, and moment (VHM) load combination in the scoured and unscoured cases (Fig. 1). In combination with direct measurements of the forces acting on the structure, the experimental results pointed to a deeper bearing capacity failure mechanism rather than pure sliding. Such a mechanism could be promoted through a reduction in the combined bearing capacity of the system through removal of foundation soil. The reduction of foundation bearing capacity due to scour is more plausible than a direct reduction in interface friction coefficient. Although centrifuge model studies (Sassa et al. 2015; Ueda et al. 2016) have identified piping, breaching, and internal erosion due to high pore-water flows as failure-contributing mechanisms, the direct removal of foundation soil appears to play a critical role in failure.
The interpretation of these findings is complicated by the choice of foundation material used in the physical model: a real breakwater is typically founded on a compacted gravel bed, often with a protective armor layer. The use of fine sand rather than gravel in a previous study (Jones and Anastasopoulos 2022) has led to a decrease of the (unscoured) bearing capacity, and to an increased susceptibility to foundation scour compared with the prototype problem. Hence, the physical model was possibly biased toward a bearing capacity failure, rather than the sliding, which has been previously proposed. On the other hand, previous observations of sliding were largely based on reduced-scale physical models (e.g., Esteban et al. 2008; Arikawa et al. 2012; Hazarika et al. 2015), where the peak friction angle (and thus the bearing capacity) was overpredicted relative to the prototype problem, making sliding easier to promote compared with bearing capacity failure. Additionally, the prototype gravel/armor had an extremely large grain size, calling for careful scaling in terms of particle size. Based on previous studies (De Beer 1965; Kimura et al. 1985), such grain scaling could again lead to significant overprediction of foundation bearing capacity, leading to a bias toward sliding-dominated failure (Taylor 2019; Cerato and Lutenegger 2007).
This leads directly to the objective of this study, which is to ascertain exactly what is the effect of the loss of foundation soil due to overtopping scour on the combined (VHM) bearing capacity of a breakwater foundation, independent of the specific soil strength. For reasonable factors of safety against vertical loading, is it possible for a relatively small amount of scour to sufficiently reduce the combined bearing capacity, promoting foundation failure, without the need to assume any (nonphysical) loss of interface friction?
The effect of scouring on foundations has been studied through the lens of scour around bridge piers, which is commonly accepted to be a leading cause of bridge failures (Lin et al. 2014). Methods to account for the loss of bearing capacity due to scour have been developed, based on modifying the bearing capacity equation (Federico et al. 2003). Recent centrifuge tests have also investigated the effect of both local and global scour on bridge piled foundations, concluding that scouring can significantly alter foundation response (Kariyawasam et al. 2020). A key limitation of previous experimental and analytical studies lies in the assumed grossly idealized scour geometry. Employing a two-step experimental methodology, the problem of scour around bridge piers was recently investigated, considering the real scour hole geometry (Ciancimino et al. 2021). In a first step, the hydraulic problem of local scour around a bridge pier was experimentally modeled at using the recently developed miniaturized tsunami generator (MTG) (Jones and Anastasopoulos 2022). Using three-dimensional (3D) scanning and 3D printing, this geometry was reproduced in an model and subsequently tested in the drum centrifuge of the Swiss Federal Institute of Technology in Zürich (ETHZ). This highlighted the importance of simulating the real scour hole geometry, as well as the prototype stresses.
This paper employs a similar two-step methodology; the real scour geometry is obtained from physical model tests using the MTG, and then reproduced in a numerical model in order to investigate the combined bearing capacity. The results of parametric finite-element (FE) analyses are used to derive dimensionless failure envelopes, in function of scour depth. The work culminates by outlining a rational methodology to assess the vulnerability of a breakwater to tsunami loading due to scour development. An example application is offered, highlighting the key aspects of the proposed method and its limitations.
Failure Surfaces
The combined (VHM) bearing capacity of a shallow foundation is a function of soil properties and loading conditions. The vertical bearing capacity () is a function of the combined horizontal and moment loading, and its moment and lateral capacity is a function of the vertical load. The contact area and failure mechanism are a function of the applied load path. A simple method to capture such effects involves modification of the bearing capacity equation (Chen and McCarron 1991) with the addition of an inclination factor and the use of an effective foundation breadth () as follows:
(1)
(2)
(3)
(4)
(5)
(6)
The inclination factor accounts for the rotation of the vertical force vector, and the effective width accounts for the reduced contact area due to the load eccentricity. Both analytical and empirical expressions for and are available in the literature.
For pure moment-vertical or pure horizontal-vertical loading, the available expressions fit reasonably well to experimental data (Georgiadis and Michalopoulos 1985). However, there are two major limitations. Firstly, for cohesionless materials, the calculation of requires selection of a friction angle (), which is, however, a function of confining stresses (and shear strain within the resisting mechanism). Because the vertical force at failure is a function of the applied and , the same applies to the confining pressure and the corresponding value of . It therefore is often recommended to select a stress-compatible , based on an iterative procedure (e.g., Hettler and Gudehus 1988; Kutter et al. 1988; De Beer 1965). This complicates the selection of a stress-compatible for use in the bearing capacity equation. The second problem is that available methods do not account for the relative directions of and . If the two are acting in opposite directions, is larger than if they are acting in the same direction (Butterfield and Gottardi 1996).
Initially developed for offshore foundations, the combined failure surface addresses these issues. Any combination of vertical (), horizontal (), and moment () can be expressed as a 3D surface in the VHM space. , , and are normalized with respect to the ultimate vertical bearing capacity under pure vertical loading , and presented in dimensionless form: , , and . The normalization with for all failure states mitigates the issue of selection of a stress-compatible for each load combination, provided that itself can be well estimated. One such surface is the one developed by Butterfield and Gottardi (1994, 1996). Based on the results of physical model tests, the failure surface (or envelope) takes the form of an oblique paraboloid (Zeppelin-shape), which is described as follows:
(7)
The proposed equation captures the general shape of the failure surface, fitting well to experimental results, and using only four parameters: , , , and . It captures the change in capacity with load path, while discriminating between positive and negative load/moment combinations through parameter . Additionally, thanks to the form of the equation, all possible VHM combinations collapse to a single two-dimensional (2D) curve in the MH space, where the failure surface takes the form of an inclined ellipse. This makes the process of fitting the surface to experimental data much more convenient. The parameters and control the size of the surface in the and planes, respectively. For pure or loading, the failure surface reduces to the simple form
(8)
(9)
The relationship can be further simplified by defining the following ratios:
(10)
(11)
(12)
(13)
(14)
Combining these with Eq. (7) produces the following elliptical equation:which allows all possible failure states to be plotted on a single ellipse in the plane.
(15)
The main limitation of this approach is that it relies on accurate prediction of , which often relies on the use of the bearing capacity equation [Eq. (1)], which is still subject to the previously discussed issues of selection of a stress-compatible . However, provided that can be well captured, the failure surface provides a very good fit to experimental data. We will therefore use this failure surface to define the combined (VHM) bearing capacity of a shallow foundation on sand, subjected to scouring. The failure surface will initially be derived for the unscoured case, and then modified to account for scouring using the scoured geometry obtained from the MTG experiments.
Combined Experimental-Numerical Methodology
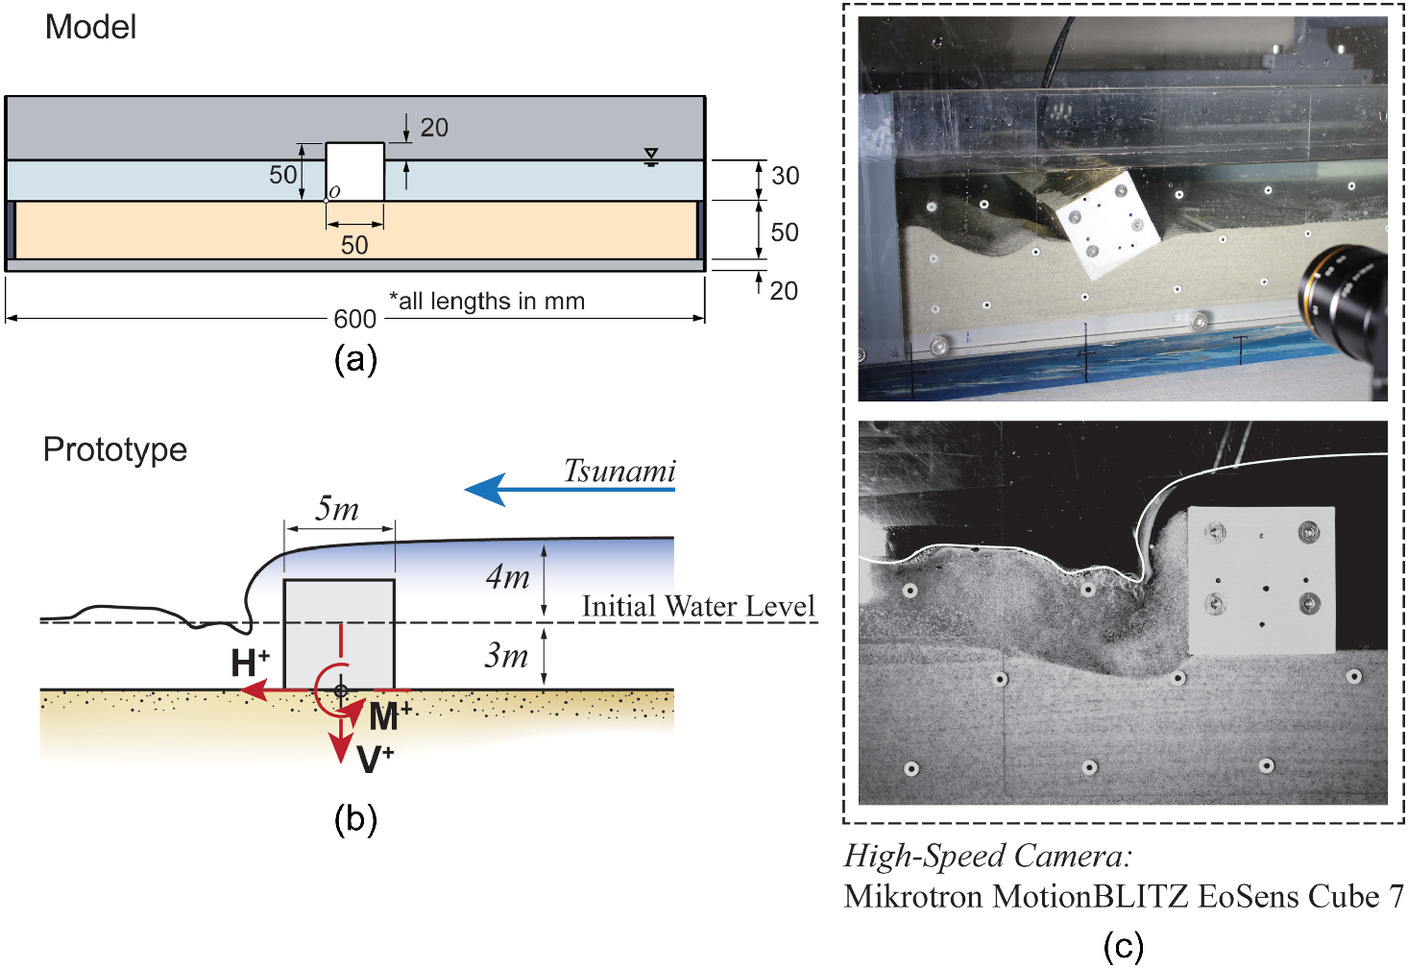
From the previously described physical models (Jones and Anastasopoulos 2022), an indicative reference experiment was selected, for which we have both the high-speed photography and force/moment measurements from the instrumented model breakwater. The reference experiment was obtained from a series of MTG experiments, modeling a 5-m-square breakwater at a geometric scale of 1:100 (Fig. 2). Unless otherwise stated, all measurements are discussed in prototype scale. Assuming plane strain conditions, the 5-m-tall breakwater lies on a level dense sand bed and is submerged to a depth of 3 m from the base, giving an initial freeboard of 2 m. Using the MTG, it is subjected to a large tsunami-type wave of 4 m maximum inundation depth and 200-s period. The response was recorded using a high-speed camera [at 250 frames per second (fps)], which captures the position of the breakwater and scoured soil surface profile through the side window of the tank [Fig. 2(c)].
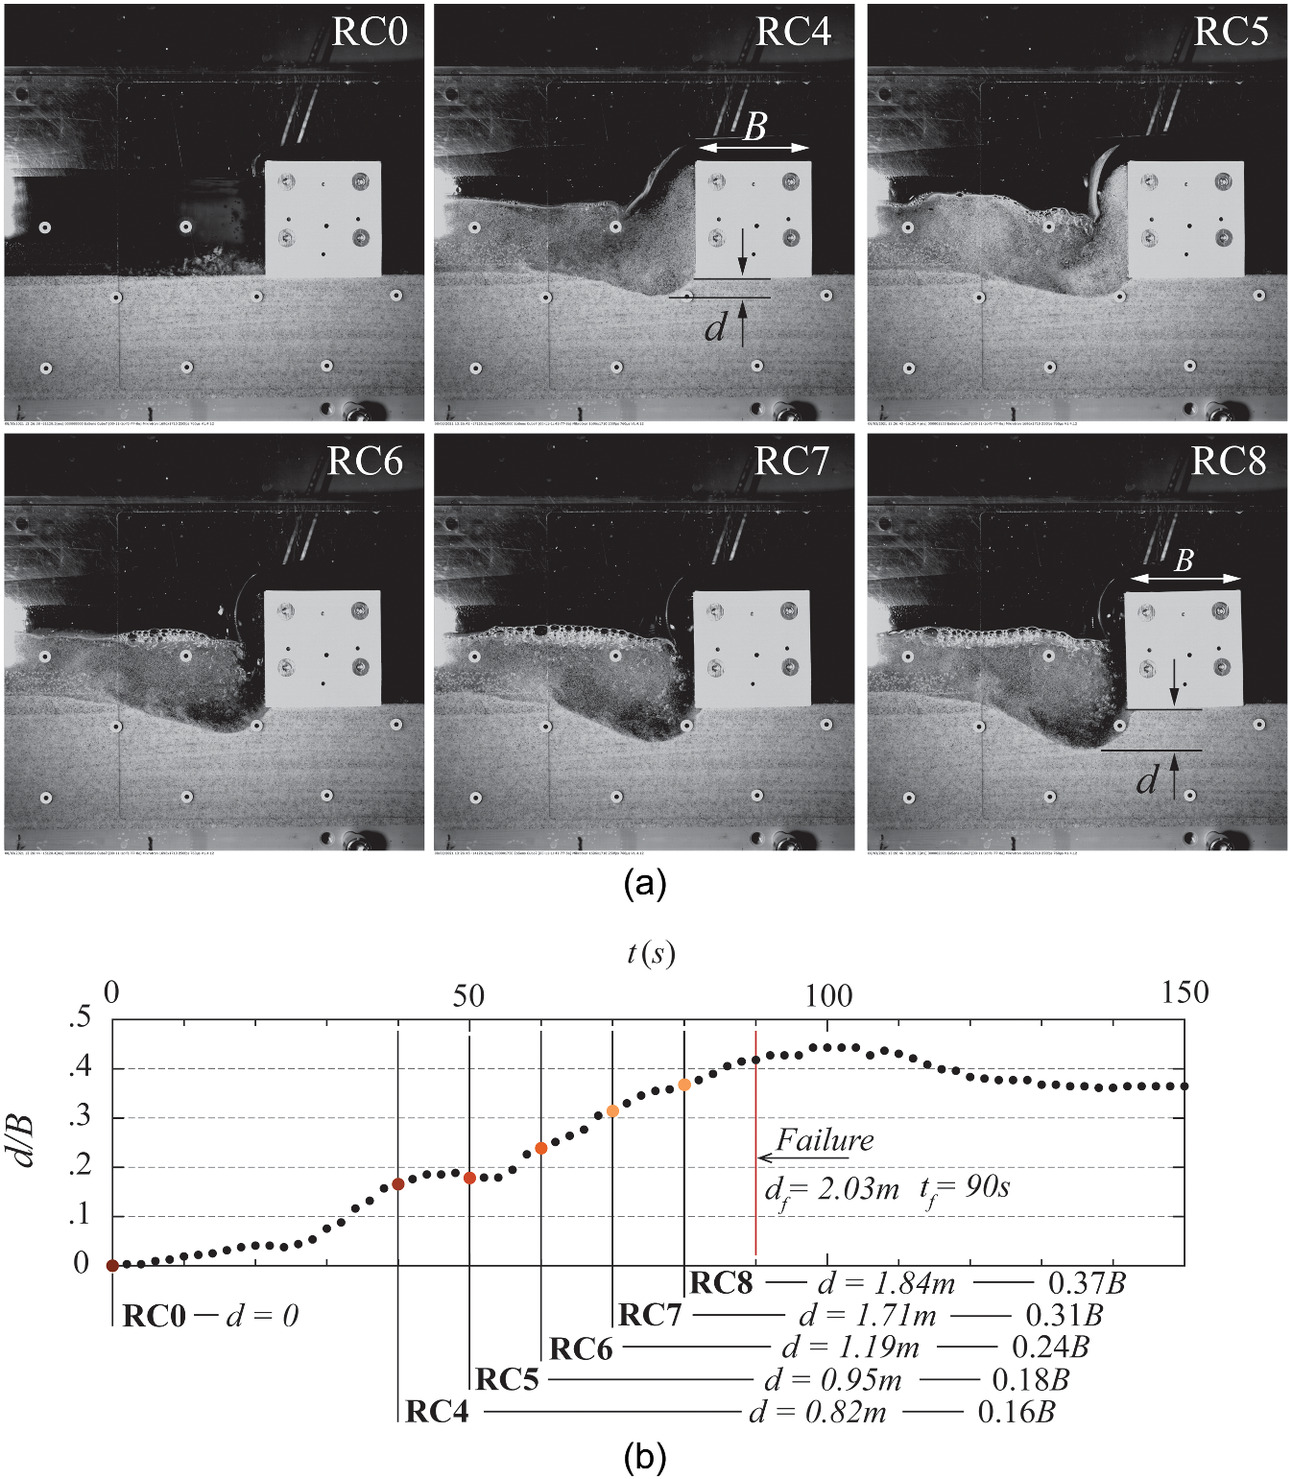
From the reference experiment, five snapshots, or reference cases (RCs) were chosen (Fig. 3). These RC are equally spaced images taken at 0, 40, 50, 60, 70, and 80 s from the start of the experiment, and are numbered according to the time taken (RC0, RC4, …, RC8). The selected series focus on the build-up of scour depth () just before failure, which occurs at time in the specific experiment.
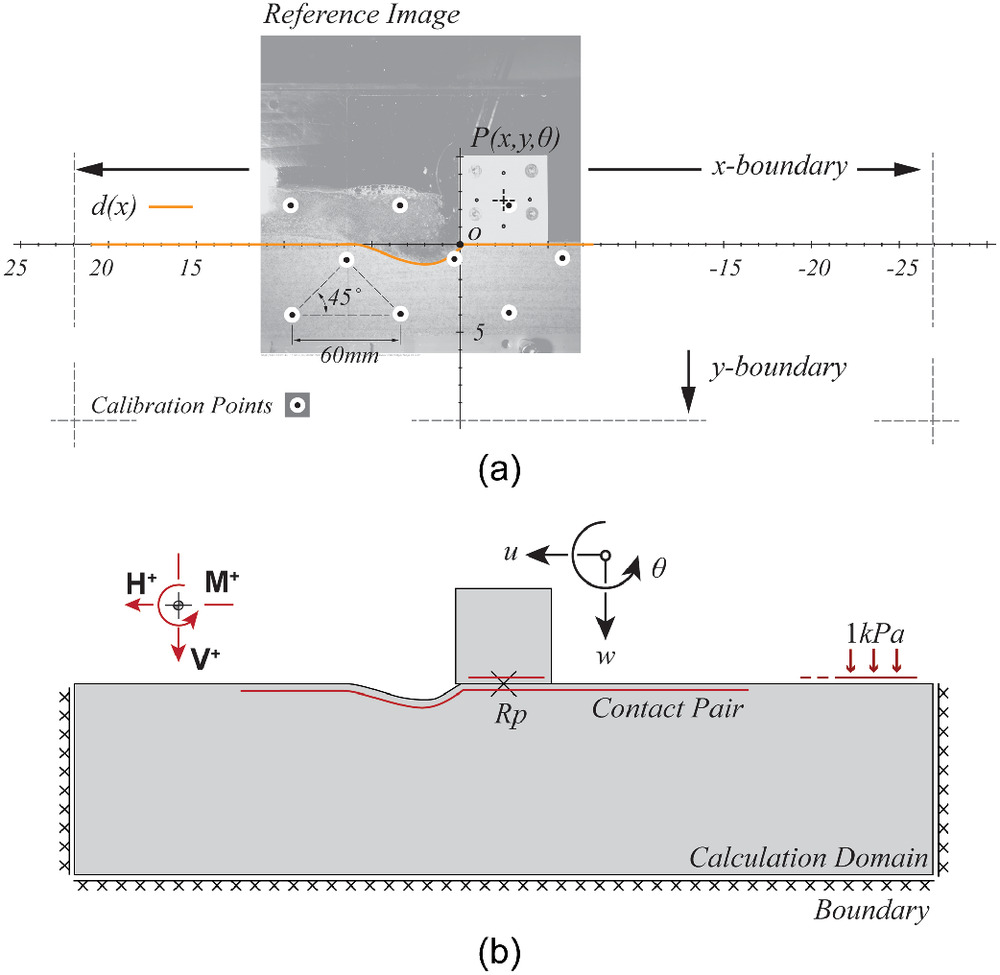
The soil surface profile and the position of the breakwater was obtained from these reference cases, using the reference markers from the images to translate from pixels to meters. The soil surface profile is represented by a fitted curve of (Fig. 4) and the position of the breakwater is represented by the coordinates of its centroid . The soil surface profile was then used to create the calculation domain (FE model) by selecting appropriate boundaries in the - and -directions. This is done for each reference case, producing six individual models.
The numerical analysis was conducted assuming plane-strain (2D) conditions, using the FE code ABAQUS version 2021 (SIMULIA 2021). With respect to nonlinear soil response, two constitutive models were investigated: (1) a simple Mohr-Coulomb (MC) model, available in ABAQUS; and (2) an improved constitutive model with Mohr-Coulomb yield criterion, incorporating postyield isotropic frictional hardening and softening, referred to hereafter as MC-HS (Agalianos et al. 2020, 2021) (Fig. 5). In combination with a user subroutine, the MC-HS captures both the hardening and the softening behavior in function of mean effective stress and plastic shear strain . For each calculation increment, the user subroutine updates the mobilized friction and dilation angles ( and ) and the elasticity (), based on the values of and . Such stepwise updating may lead to noisy results. This can be avoided by using a very small time increment, which is possible for the relatively simple 2D models of this study. Despite these limitations, the MC-HS model can capture the effects of stress and strain dependency of sands in a straightforward manner, while being computationally stable. This directly addresses the problem of the selection of a compatible value of described previously.
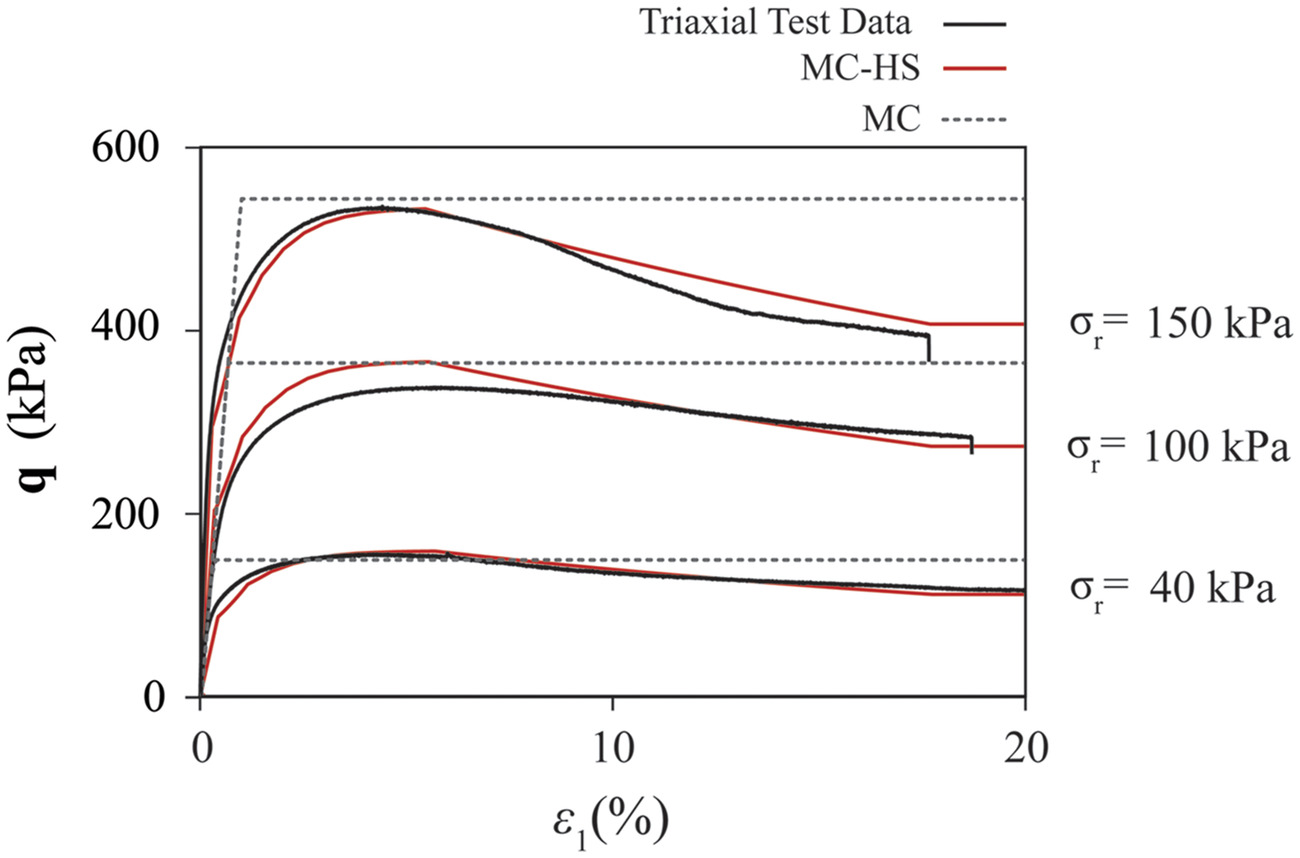
Both models (MC and MC-HS) were calibrated on the basis of triaxial tests of the Perth sand used for the MTG experiments, conducted at the ETHZ soil testing laboratory. The triaxial tests were conducted for a small range of relative densities , consistent with the experimental models. Different cell pressures were investigated (40 to 250 kPa), consistent with the stress level of the prototype problem (triaxial tests at a model-scale stress level were not possible).
Using the triaxial tests, the MC-HS model can be calibrated by determining (1) the average value of and with , represented as an exponential curve in space (consistent with Bolton 1986); (2) the average value of with ; and (3) the average values of with plastic shear strain . The onset of plastic shear strain in each triaxial test was determined as the point of inflection in the response, at which point the soil exhibits dilative behavior, and was calculated using the axial strain and at this point. We assumed a constant Poisson’s ratio, which was determined from an average value across all tests. The results of the model calibration in terms of a single element under triaxial stress conditions is shown in Fig. 6, compared with the results of three element tests at 40-, 100-, and 150-kPa cell pressure. The model captures both the hardening and softening response, as well as the effect of the confining stress .
The calibration of the MC model is simpler, requiring a single value of , , , and . However, the mobilized values were changing throughout the triaxial test, and therefore average values were chosen from the middle of the range of : , , , and . As described previously, the selection of compatible values of and is an area of considerable debate, but an investigation of such a process is beyond the scope of this work.
Generation of Numerical Models
The FE models were generated from experimental images, and both the shape of the soil domain (the surface profile) and the position of the breakwater varied arbitrarily. Our goal is to semiautomatically generate a FE model from any arbitrary experimental image, capable of reliably reproducing a wide range of combined load paths. Modeling complexity is increased because the generated FE model must accommodate semiarbitrary geometries. Moreover, because each generated model (representing one scoured geometry) is employed to analyze 34 different displacement paths, computational efficiency and reliability are both essential.
After testing different configurations, it was concluded that the best balance of stability, reliability, and accuracy was achieved with linearly interpolated triangular elements, with hybrid formulation (having an extra degree of freedom for hydrostatic pressure). Such elements are applicable to a wide range of geometries, while being computationally efficient, allowing adequate mesh refinement. The hard contact interface formulation was employed, combined with a rough tangential behavior, using the surface-to-surface formulation (SIMULIA 2021). The latter was required because of the need to accurately model both the contact and the subsequent separation of the foundation from the soil when subjected to moment loading. Although numerically convenient, softened contact formulations did not accurately reproduce such effect. The surface-to-surface contact reduces the sensitivity to changes in the position of the foundation. Rough tangential interaction (i.e., no slip between foundation and soil) was used because interface sliding is not the dominant failure mode for most load paths, and therefore there is no reason to increase complexity. However, a frictional interface can be used to more accurately reproduce potential sliding failure modes.
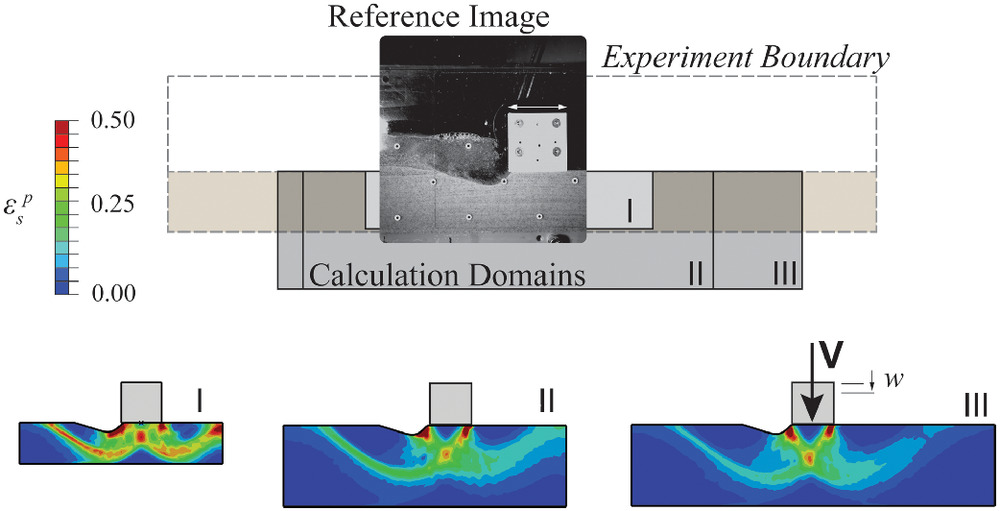
Although the breakwater was modeled as a rigid body, a very fine mesh was employed (with the foundation discretized in 50 elements) to provide an adequate number of contact nodes. Boundary effects were investigated through an initial sensitivity study, exploring three different FE model sizes. These are depicted in Fig. 6, also compared with the boundaries of the MTG experiment. The boundary effect is a function of material parameters, soil constitutive model, and applied displacement path. Ultimately, it was found that a domain having a depth of and a width of (Configuration C in Fig. 6) was sufficient to avoid boundary effects. However, in the case of the Mohr-Coulomb model, vertical loading–dominated failure mechanisms were found to come quite close to the bottom boundary.
The element size is also critical. Ideally, there should be sufficient elements to accurately reproduce the real strain field. Because we are using a model with softening (MC-HS), the absolute size of the elements may affect the results of the analysis. With such softening models, strain localization takes place with the deformation concentrated in a shear band, having a width of one element. In reality, the width of the shear band is invariant with scale, normally of the order of (Vardoulakis and Graf 1985). Not only does this lead to more diffused shear zones, but it also effects the volumetric behavior and thus the build-up of , which is important in bearing capacity analysis.
For the studied model on Perth sand (), the element size should be approximately 5 mm () to match the size of the real shear band. This is not only computationally impossible, but would also lead to severe convergence problems due to excessive element distortion. A compromise was made by choosing the smallest element size that can tolerate distortion due to penetration of the foundation into the soil. Ultimately, an element size of /20 was selected for the analyses, which also coincided approximately with the triaxial element size used for model calibration. By matching the finite-element size to the triaxial element size, the volumetric response under shear loading was well matched, even if the shear zone was more diffuse.
Definition of Failure and Load Paths
The goal is to construct a failure surface for the scoured foundation. This requires firstly defining a means of probing the VHM space in order to produce a complete picture of the 3D failure surface. To do this, a vector () of vertical (), horizontal (), and rotational () displacement was applied to the foundation, using the center of the foundation as reference point (). The applied displacement path produces vertical, horizontal, and moment loading (load-path), from which a point of failure can be derived, signifying a single point on the failure surface. Known as the radial method, this process requires a single analysis step.
An alternative approach is to first apply a vertical load to achieve a factor of safety against purely vertical loading, followed by a load or displacement path in the horizontal-rotational space (a so-called swipe test) to reach and then follow (swipe) the failure surface. Because the vertical bearing capacity is a function of the degree of scouring, it is not possible to a priori define such a factor of safety, and therefore an additional set of analyses is required.
Using the unscoured reference case (RC0) as an example, the failure surface in the pure space was probed using both the radial and swipe methods (Fig. 7). The applied displacement paths are shown in Fig. 7(a): the radial path is from (O) to (A), and the swipe method first establishes a vertical force from (O) to (B), followed by a rotation from (B) to (C). The maximum vertical bearing capacity () is defined using the pure vertical displacement path (O) to (F). The failure of each system is depicted by a solid circle.
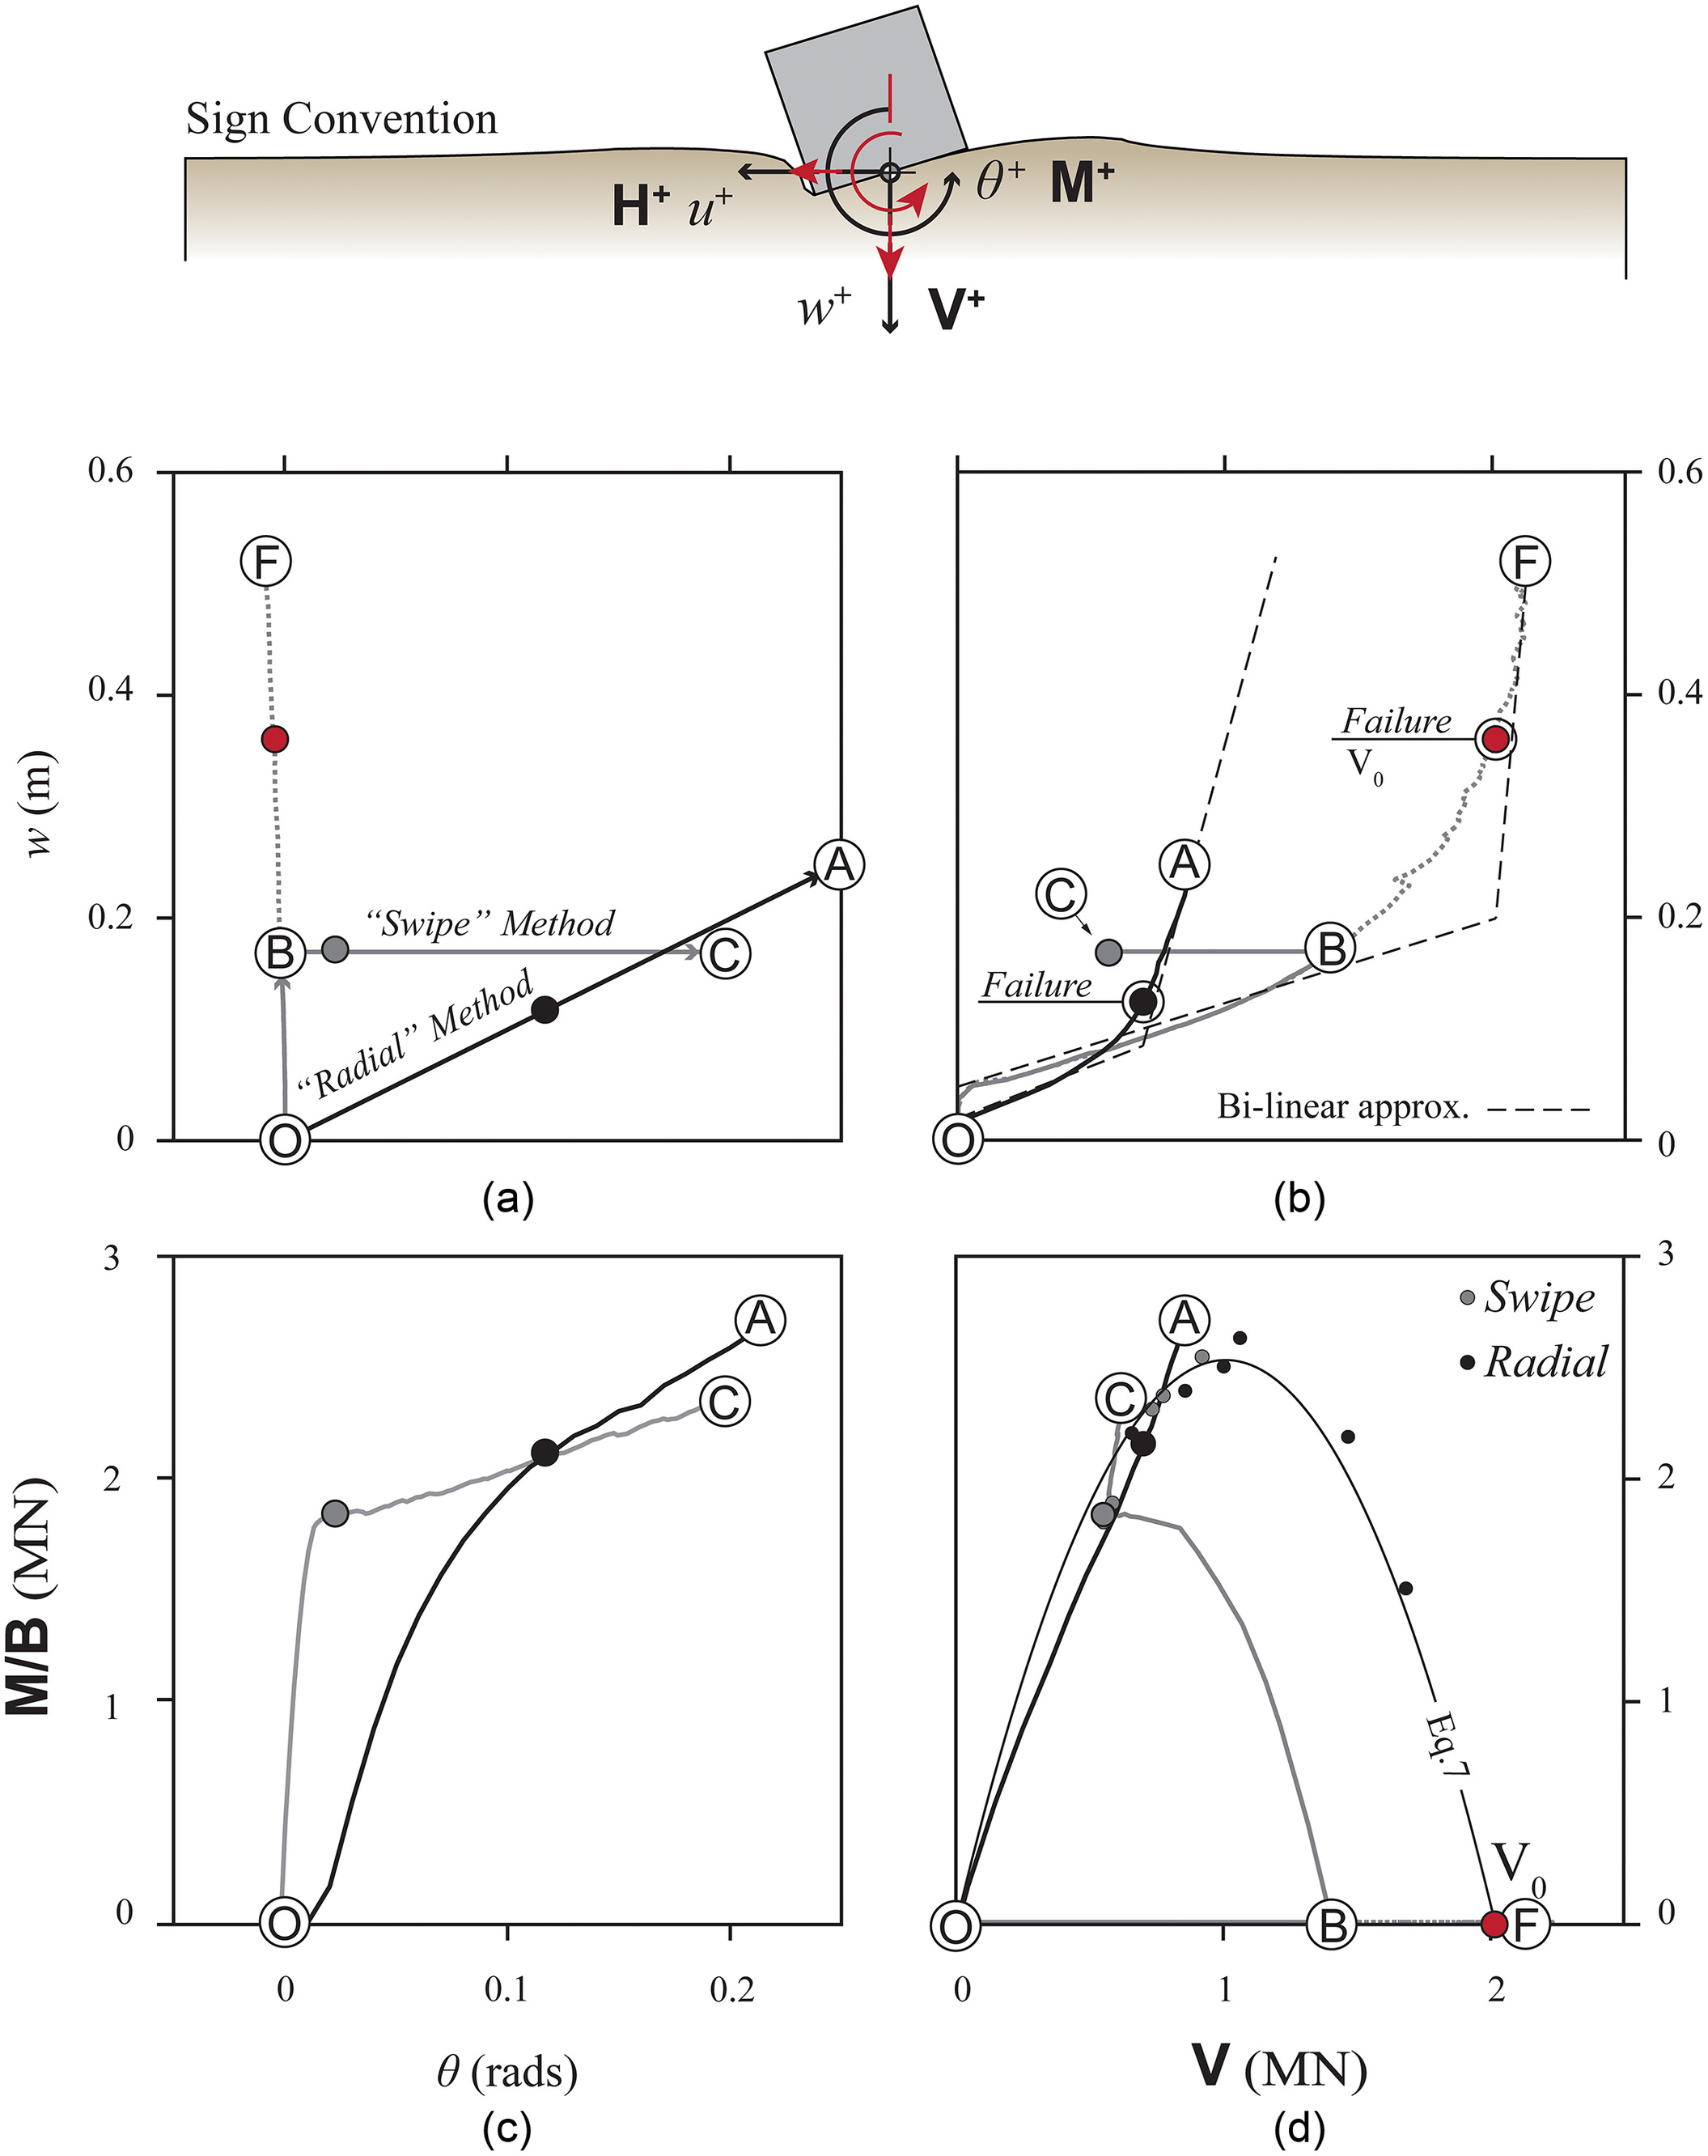
Evidently, the force-displacement relationships of the two approaches are different [Figs. 7(a and c)]. However, the calculated and at failure are very similar. Plotted in the space [Fig. 7(d)], the failure points almost coincide, matching well the ellipse of Eq. (8), with . This is also true for other displacement trajectories, the failure points of which are also plotted in Fig. 7(d), for both the swipe and the radial displacement paths. Interestingly, the points in the vertical-dominated envelope [points on the curve of Fig. 7(d) with ] were difficult to probe using pure displacement paths because the force trajectories in the space tended to curve to left because the foundation is unloaded when rotation is applied, which reduces the contact area with the soil. The failure surfaces derived by the radial and the more common swipe method coincided, which is consistent with numerical analysis results for foundations on clay (Suryasentana et al. 2020) and centrifuge model tests on sand (Bienen et al. 2006).
The radial method is convenient because it helps to combat the numerical instability introduced by the use of a strain-softening constitutive model. The trade-off is that failure is more difficult to identify because the restricted displacement makes the mobilized forces sensitive to the volumetric behavior of the soil. For numerical stability reasons, the residual dilation angle cannot be set exactly equal to zero, leading to an increase of confining pressures at very large deformation. This manifests as a hardening response in the postfailure regime, where the mobilized forces keep increasing even after failure. The analysis was therefore limited to producing a single point (, , ) for each model-displacement path, which denotes the intersection with the failure surface.
It is therefore necessary to devise a consistent and objective method for obtaining the failure point. Due to the previously discussed hardening, for most displacement combinations, there is no clear plateau in the load-displacement path that can be used to objectively define the ultimate capacity. However, the force-displacement/moment-rotation response can be approximated with a bilinear fit for all cases examined: an initial quasi-elastic regime (), followed by a hardening regime and postfailure hardening response () (Fig. 8). Both the quasi-elastic and postfailure regions were fitted with a simple linear function. The intersection of these two linear functions produces a point () that approximately denotes the onset of hardening. This point is then projected on to the actual force-displacement relationship to determine the displacement compatible with this force (), from which the other components [ and ] can be determined. The same process can be alternatively carried out, using the or response.
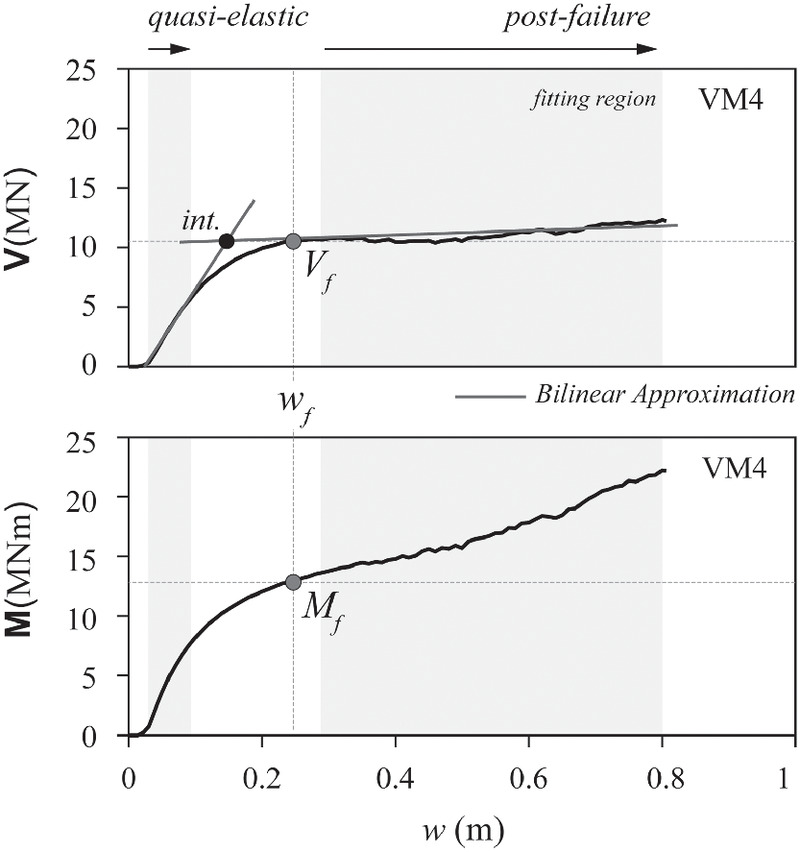
This bilinear approximation method allows consistent and objective determination of the failure point, and can be rapidly applied for the processing of a very large number of tests. An example of the process is shown in Fig. 8, applied to displacement path VM4 (described subsequently), which is a combined vertical displacement and rotation. The derived failure points can then be used to construct the failure surface in the space.
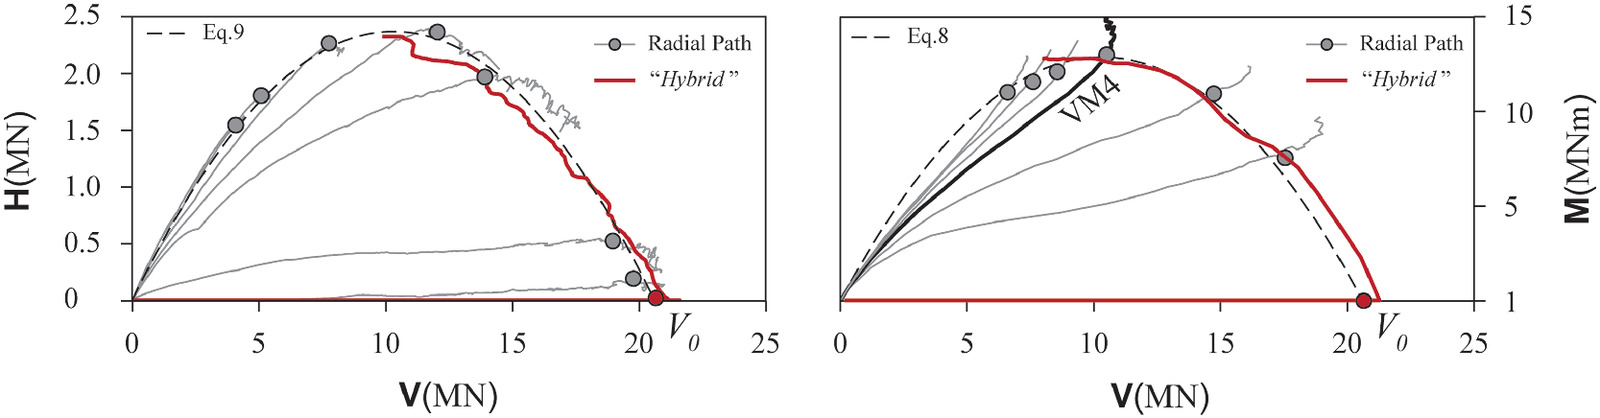
The validity of the bilinear approximation method can also be verified against a hybrid load/displacement path, first applying vertical displacement () to establish a vertical force (), followed by a horizontal force () or moment () loading to probe and track the failure surface. Because the second part of such hybrid analysis is load-controlled, the definition of the failure surface is straightforward and can be used to verify the previously discussed approximate method.
As shown in Fig. 9, the failure surface derived using the hybrid load/displacement path matches perfectly with the one derived using the failure points obtained from pure displacement paths, employing the bilinear approximation method. Such a hybrid load/displacement path was not used for all models investigated herein, due to the aforementioned numerical stability issues and the associated computational cost (such analysis is possible, but requires an excessively small analysis increment). Nevertheless, the hybrid path will be used to verify the validity of the derived failure surfaces constructed using the radial displacement paths and the bilinear approximation method.
Comparison of Soil Constitutive Models
To demonstrate the importance of modeling hardening and postfailure softening, the MC-HS model was compared with a simple MC model. The two models were subjected to 12 displacement paths with trajectories in the and space. The failure points are plotted in normalized [Fig. 10(a)] and [Fig. 10(b)] space [Eqs. (10)–()], and compared with the failure envelope of Georgiadis and Michalopoulos (1985) and the general relationship of Butterfield and Gottardi (1996) using Eqs. (8) and (9) with and . The modification proposed by Bienen et al. (2006) was also included, where the vertical load is corrected to account for the expansion of the failure surface due to vertical penetration through inversion of Eq. (7) to derive a compatible maximum vertical load () for the given combination of , , and .
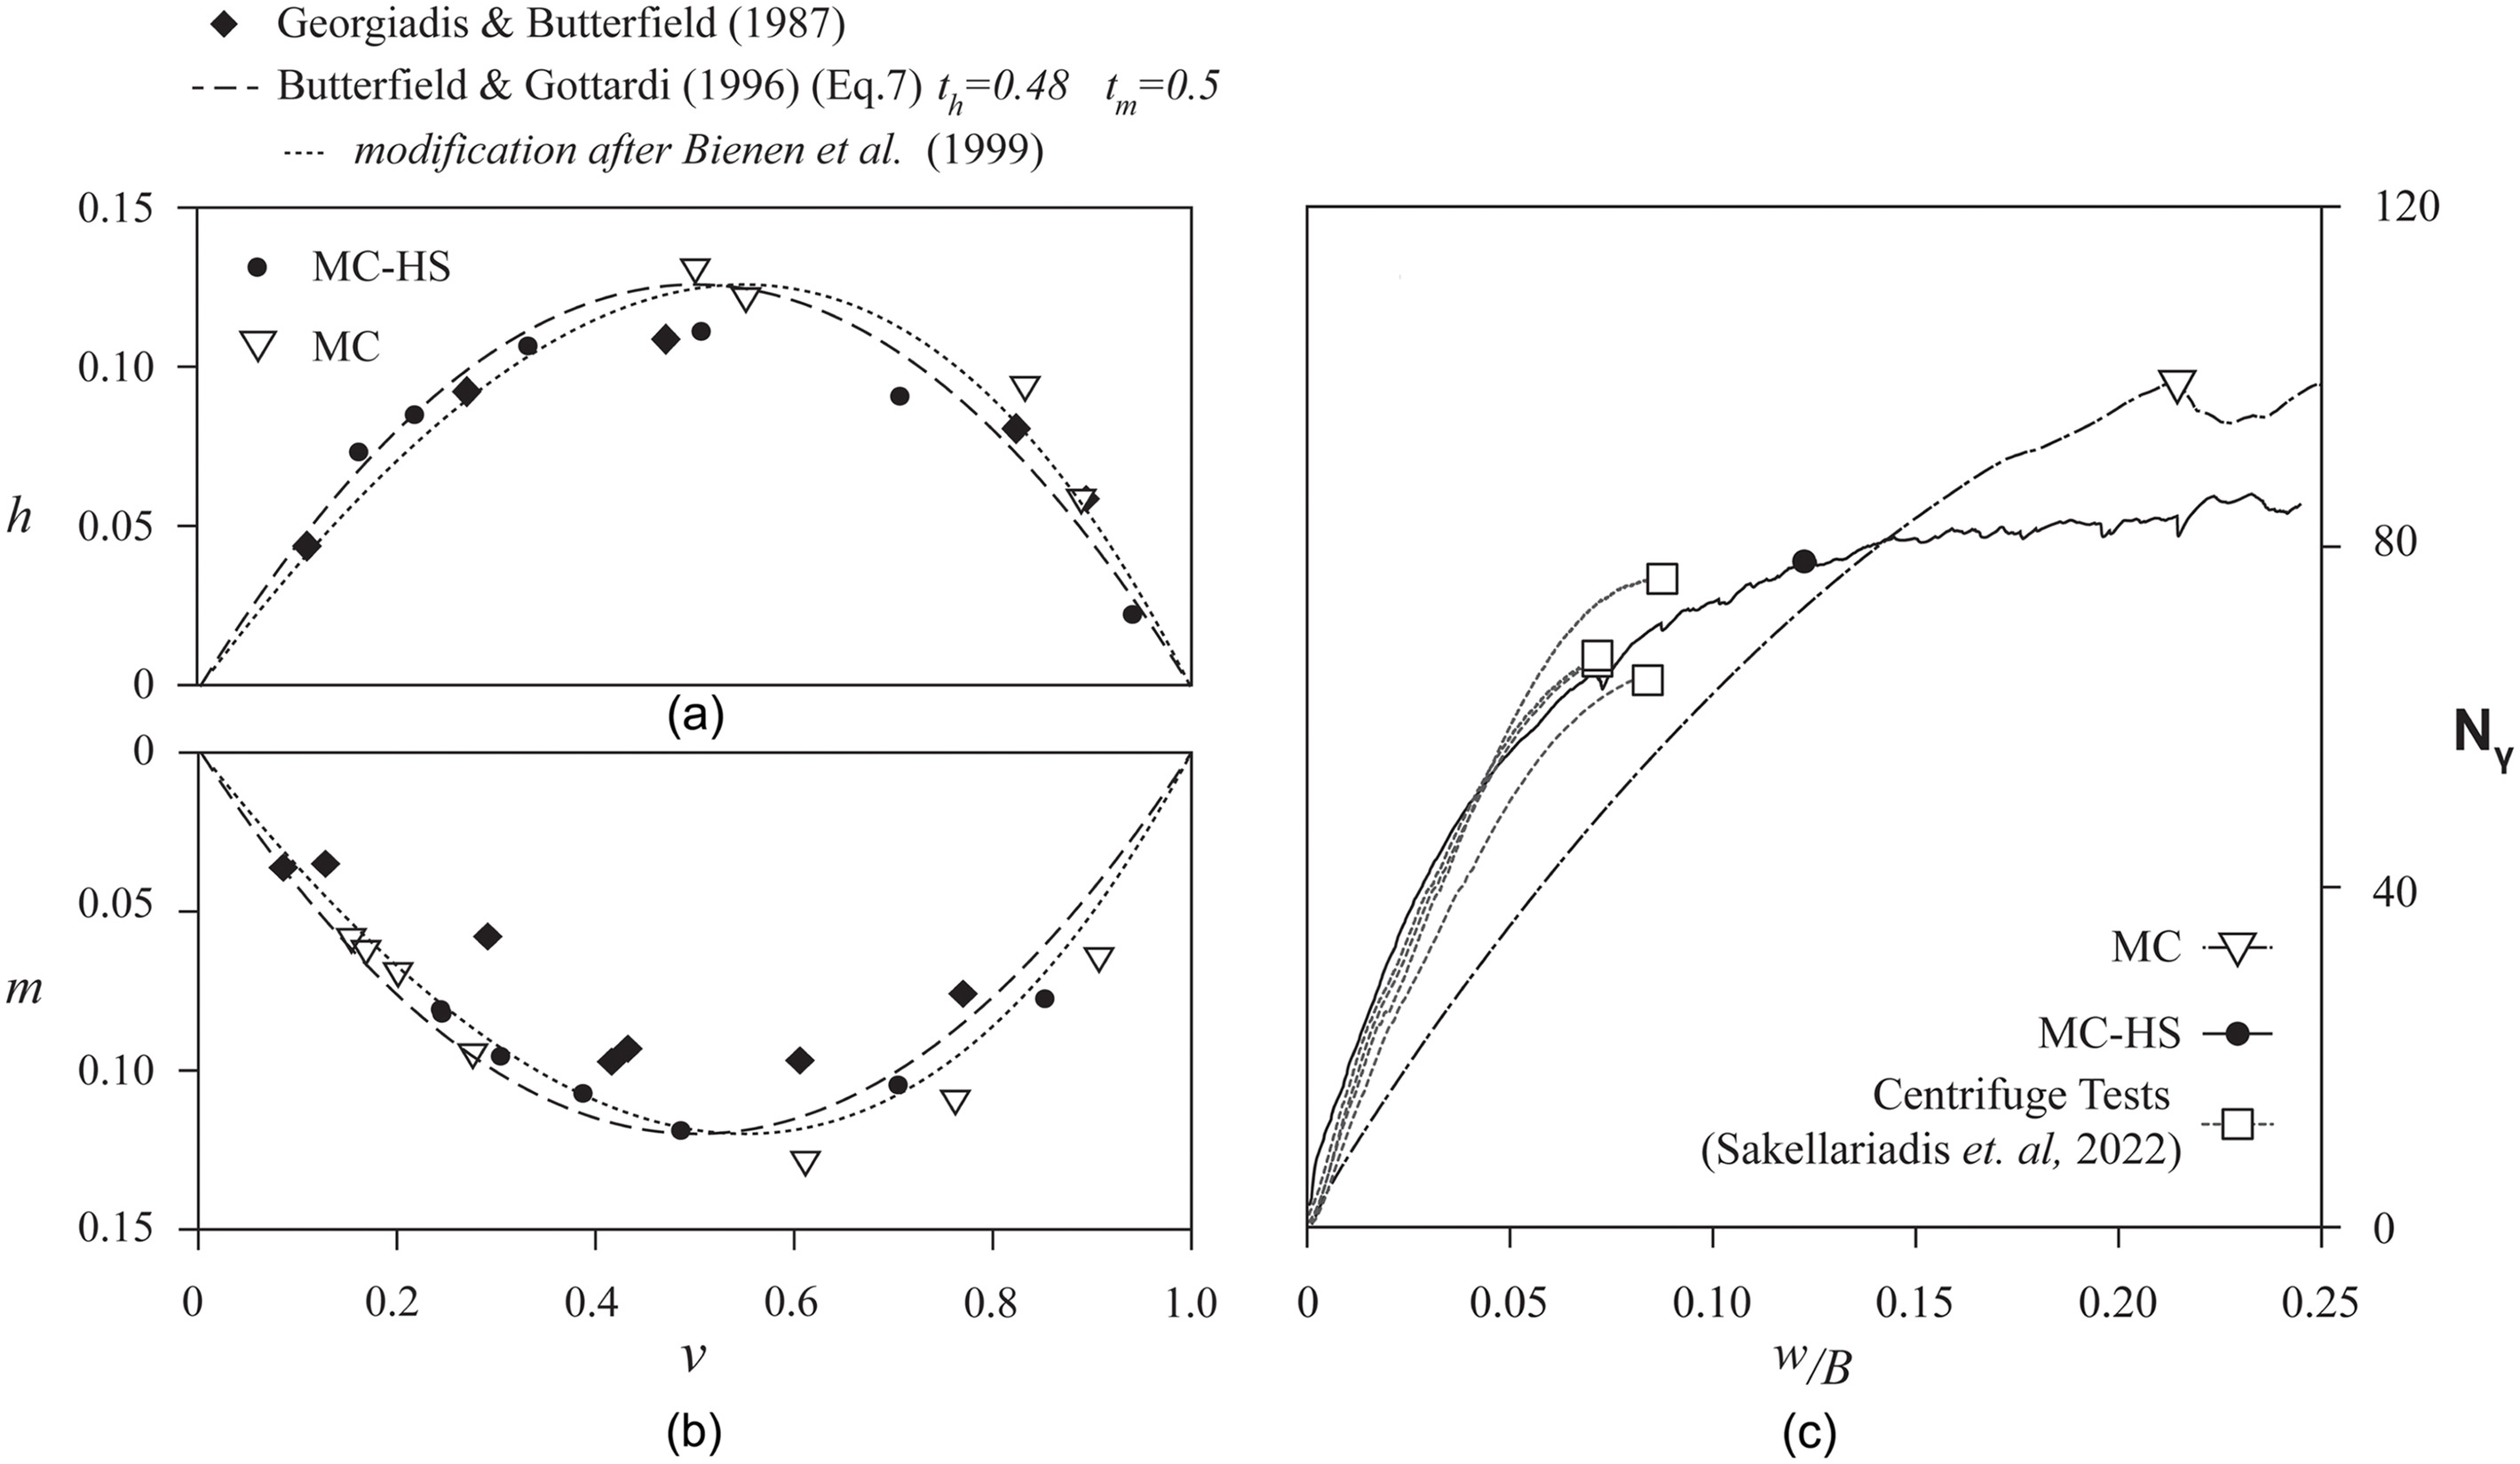
For each model, was determined from a vertical push analysis, the results of which are shown Fig. 10(c) in terms of , derived using Eq. (1). The calculated was also compared with the results of four centrifuge tests of a rigid square foundation of width (prototype scale), subjected to pure vertical loading, conducted at with the same Perth sand at similar relative densities ( =0.75–0.85) as the calibrated model (Sakellariadis et al. 2022).
The results were compared for a pure vertical displacement path, where the vertical displacement () was normalized to the foundation area ( in the case of the 2D analysis; in the case of the centrifuge test). The MC-HS model compares very well to the centrifuge model test [Fig. 10(c)] because it is able to capture both the stiffness and the ultimate capacity of the foundation. As previously discussed, the numerical model has a nonzero residual dilation angle for numerical stability reasons, leading to a small increase of the vertical force after full mobilization of bearing capacity. However, using the previously outlined bilinear approximation method, the failure point of the analysis agreed fairly well with the one from the centrifuge model test. In stark contrast, the MC model overpredicted the ultimate value of , but underpredicted the stiffness. This is not surprising because the peak friction angle was used in this case. The stiffness and postfailure behavior were poorly captured because the model assumed an elastic response (no hardening), and did not account for strain softening.
The MC model could theoretically be tuned to capture the vertical bearing capacity by selecting compatible values of , , and . However, its inability to capture the hardening and postpeak softening response significantly affects the results during combined loading. As shown in the comparisons of Fig. 11, the MC-HS model is in good agreement with the literature (which refers to similar Leighton-Buzzard sand at similar relative density). Because the moment and the vertical force are both normalized with , the overprediction of by the MC model is mitigated, and its predictions are reasonable for loading in the normalized and space at low vertical forces. However, the MC model significantly overpredicts the moment capacity for large ratios. The additional shearing due to the imposed rotation alters the buildup of mean effective stress before failure, whereas it leads to a reduction of the mobilized friction and dilation angle due to postpeak softening. With constant and , the MC model is unable to capture such effects.
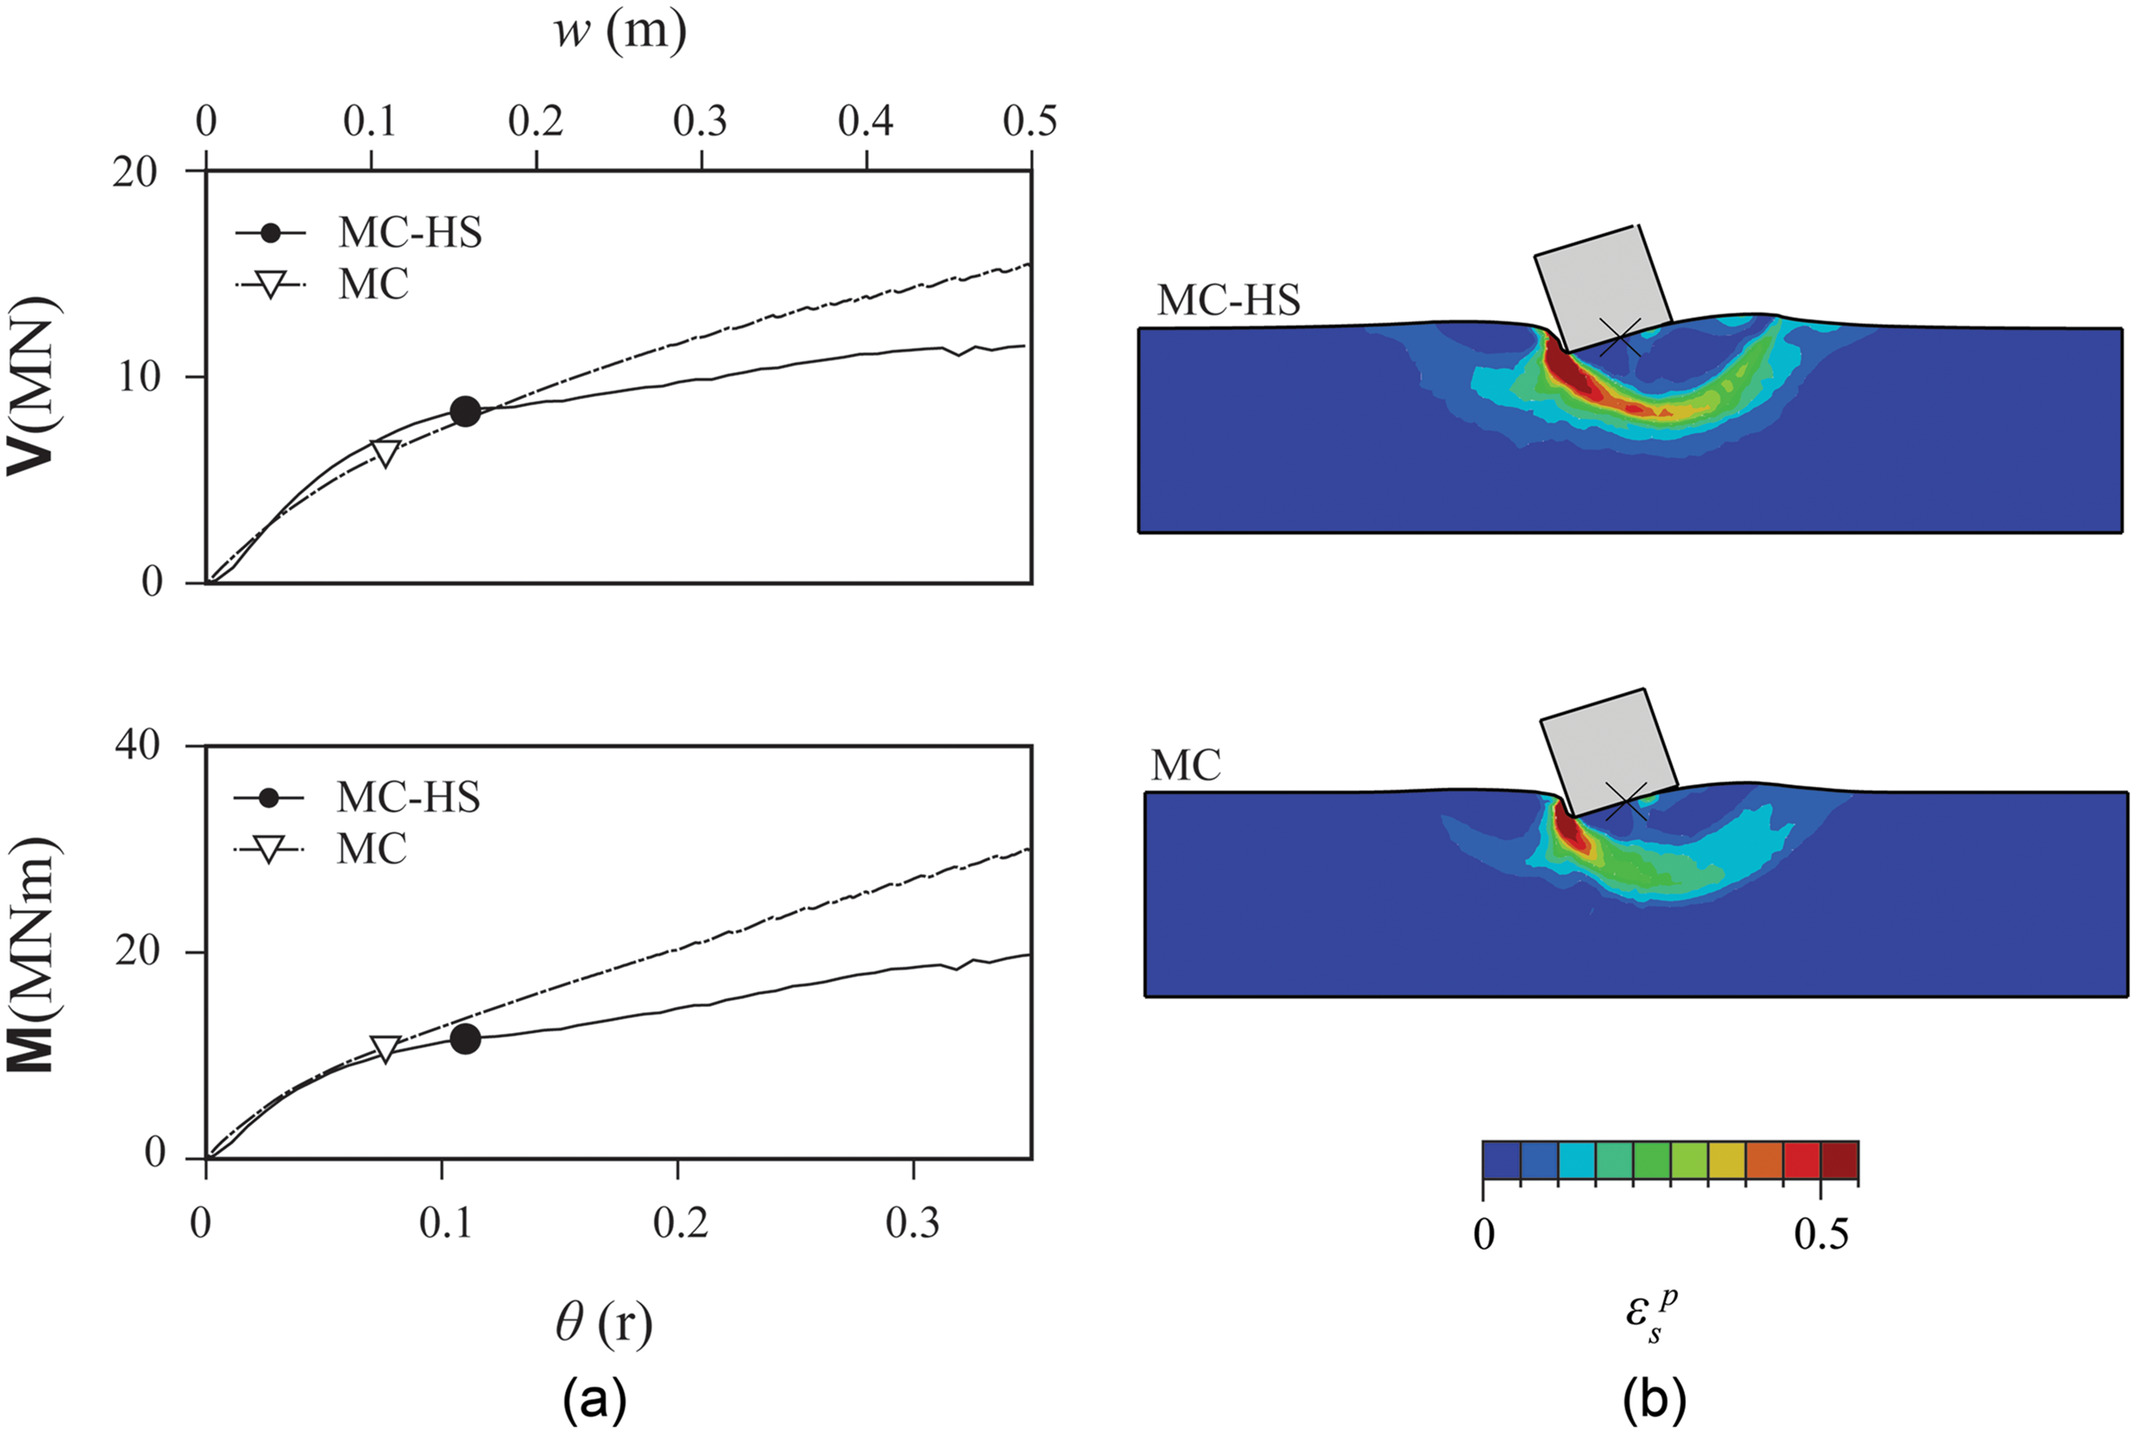
This subtle difference between the two models is further elucidated by looking at the displacement paths for moment-dominated failure. Fig. 11(a) compares the force-displacement and moment-rotation () response of the two models for a single displacement path in the space, and Fig. 11(b) illustrates the deformed mesh with contours of plastic shear strain right after failure. Unable to capture strain softening, the MC model does not produce a well-defined failure mechanism as the MC-HS model. In the absence of strain softening, the mobilized shear resistance, and thus and , keeps increasing with , leading to a continuous hardening response, making failure less obvious in Fig. 11(a). There are also differences in initial stiffness due to the inability of the MC model to capture the prefailure hardening response.
It is concluded that the MC-HS model outperforms the MC model. Accounting for prefailure hardening and postpeak softening response, the MC-HS reproduces a realistic failure surface, matching adequately well the ultimate bearing capacity measured by centrifuge model tests (Sakellariadis et al. 2022), as well as published failure envelopes (Georgiadis and Michalopoulos 1985; Butterfield and Gottardi 1996; Gottardi et al. 2015). It can thus be used to in combination with the relationship of Butterfield and Gottardi (1996) to produce a generalized failure envelope that accounts for scouring.
Effect of Scour on Foundation Response
Based on the reference MTG experiments, a parametric study was conducted with the MC-HS model. Each of the six reference case models was subjected to 34 different displacement paths in the , , and space. As summarized in Table 1, the displacement paths ranged from pure vertical to pure horizontal and pure moment loading. A total of 204 models were analyzed, each comprising 15,000 elements. Running in parallel over 20 cores, the foundation could be fully characterized in 4 days, accounting for all possible loads and scour combinations.
| Series | No. of variations | (m) | (m) | () |
|---|---|---|---|---|
| V | 1 | 1 | — | — |
| HV 1-5 | 5 | 0.2–1 | 1 | — |
| VM 1-7 | 7 | — | 1 | 0.1–1.2 |
| VMR1-7 | 7 | 0 | 1 | 0.1–1.2 |
| VHM | 14 | 0.5–1 | 1 | 0.1–1.2 |
Note: A dash denotes that the degree of freedom is unrestricted (free).
Failure Mechanisms
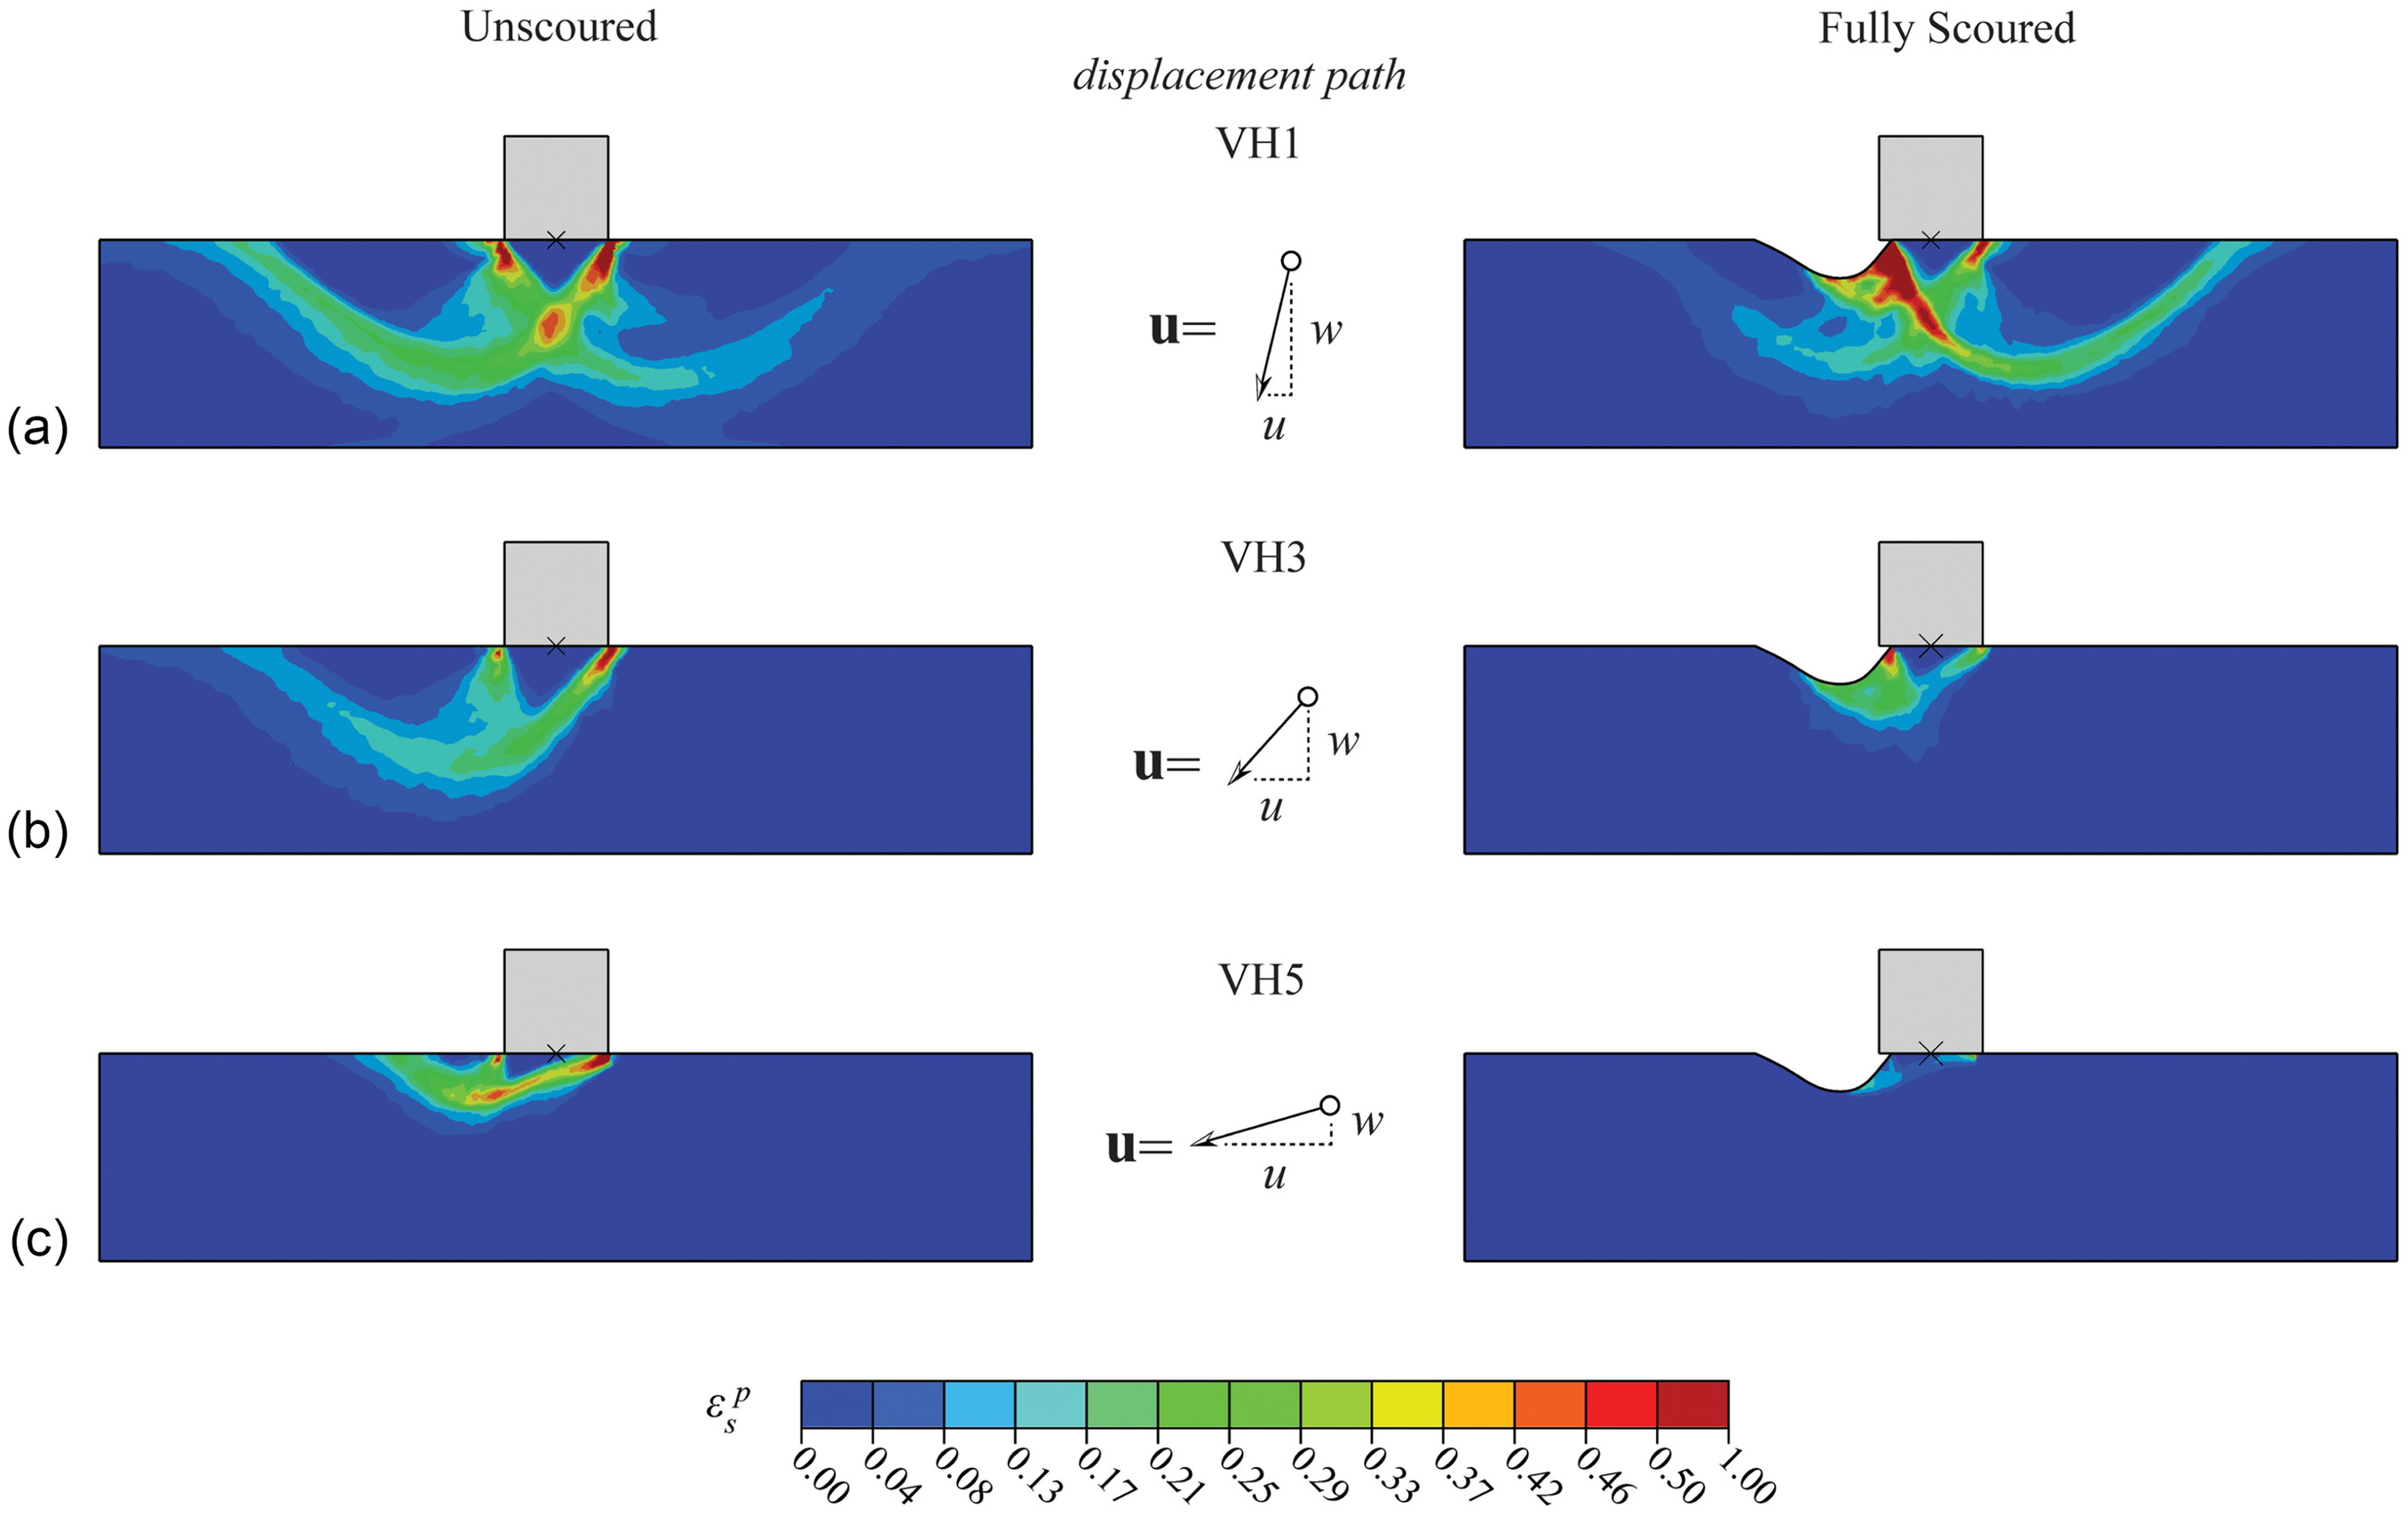
The developing failure mechanisms reveal the effect of the scoured geometries on foundation response. Figs. 12–15 compare the contours of plastic shear strain (superimposed on the undeformed FE mesh) for the unscoured and the scoured models under various displacement paths ranging from pure vertical, (Fig. 12), to vertical-horizontal, VH (Fig. 13), to vertical-moment, VM (Fig. 14), to combined loading, VHM (Fig. 15). Specifically, Fig. 13 compares the unscoured with the scoured case (due to tsunami loading) for three VH loading scenarios, ranging from vertical-dominated, VH1 [Fig. 13(a)], to intermediate, VH3 [Fig. 13(b)], to horizontal-dominated, VH5 [Fig. 13(c)].
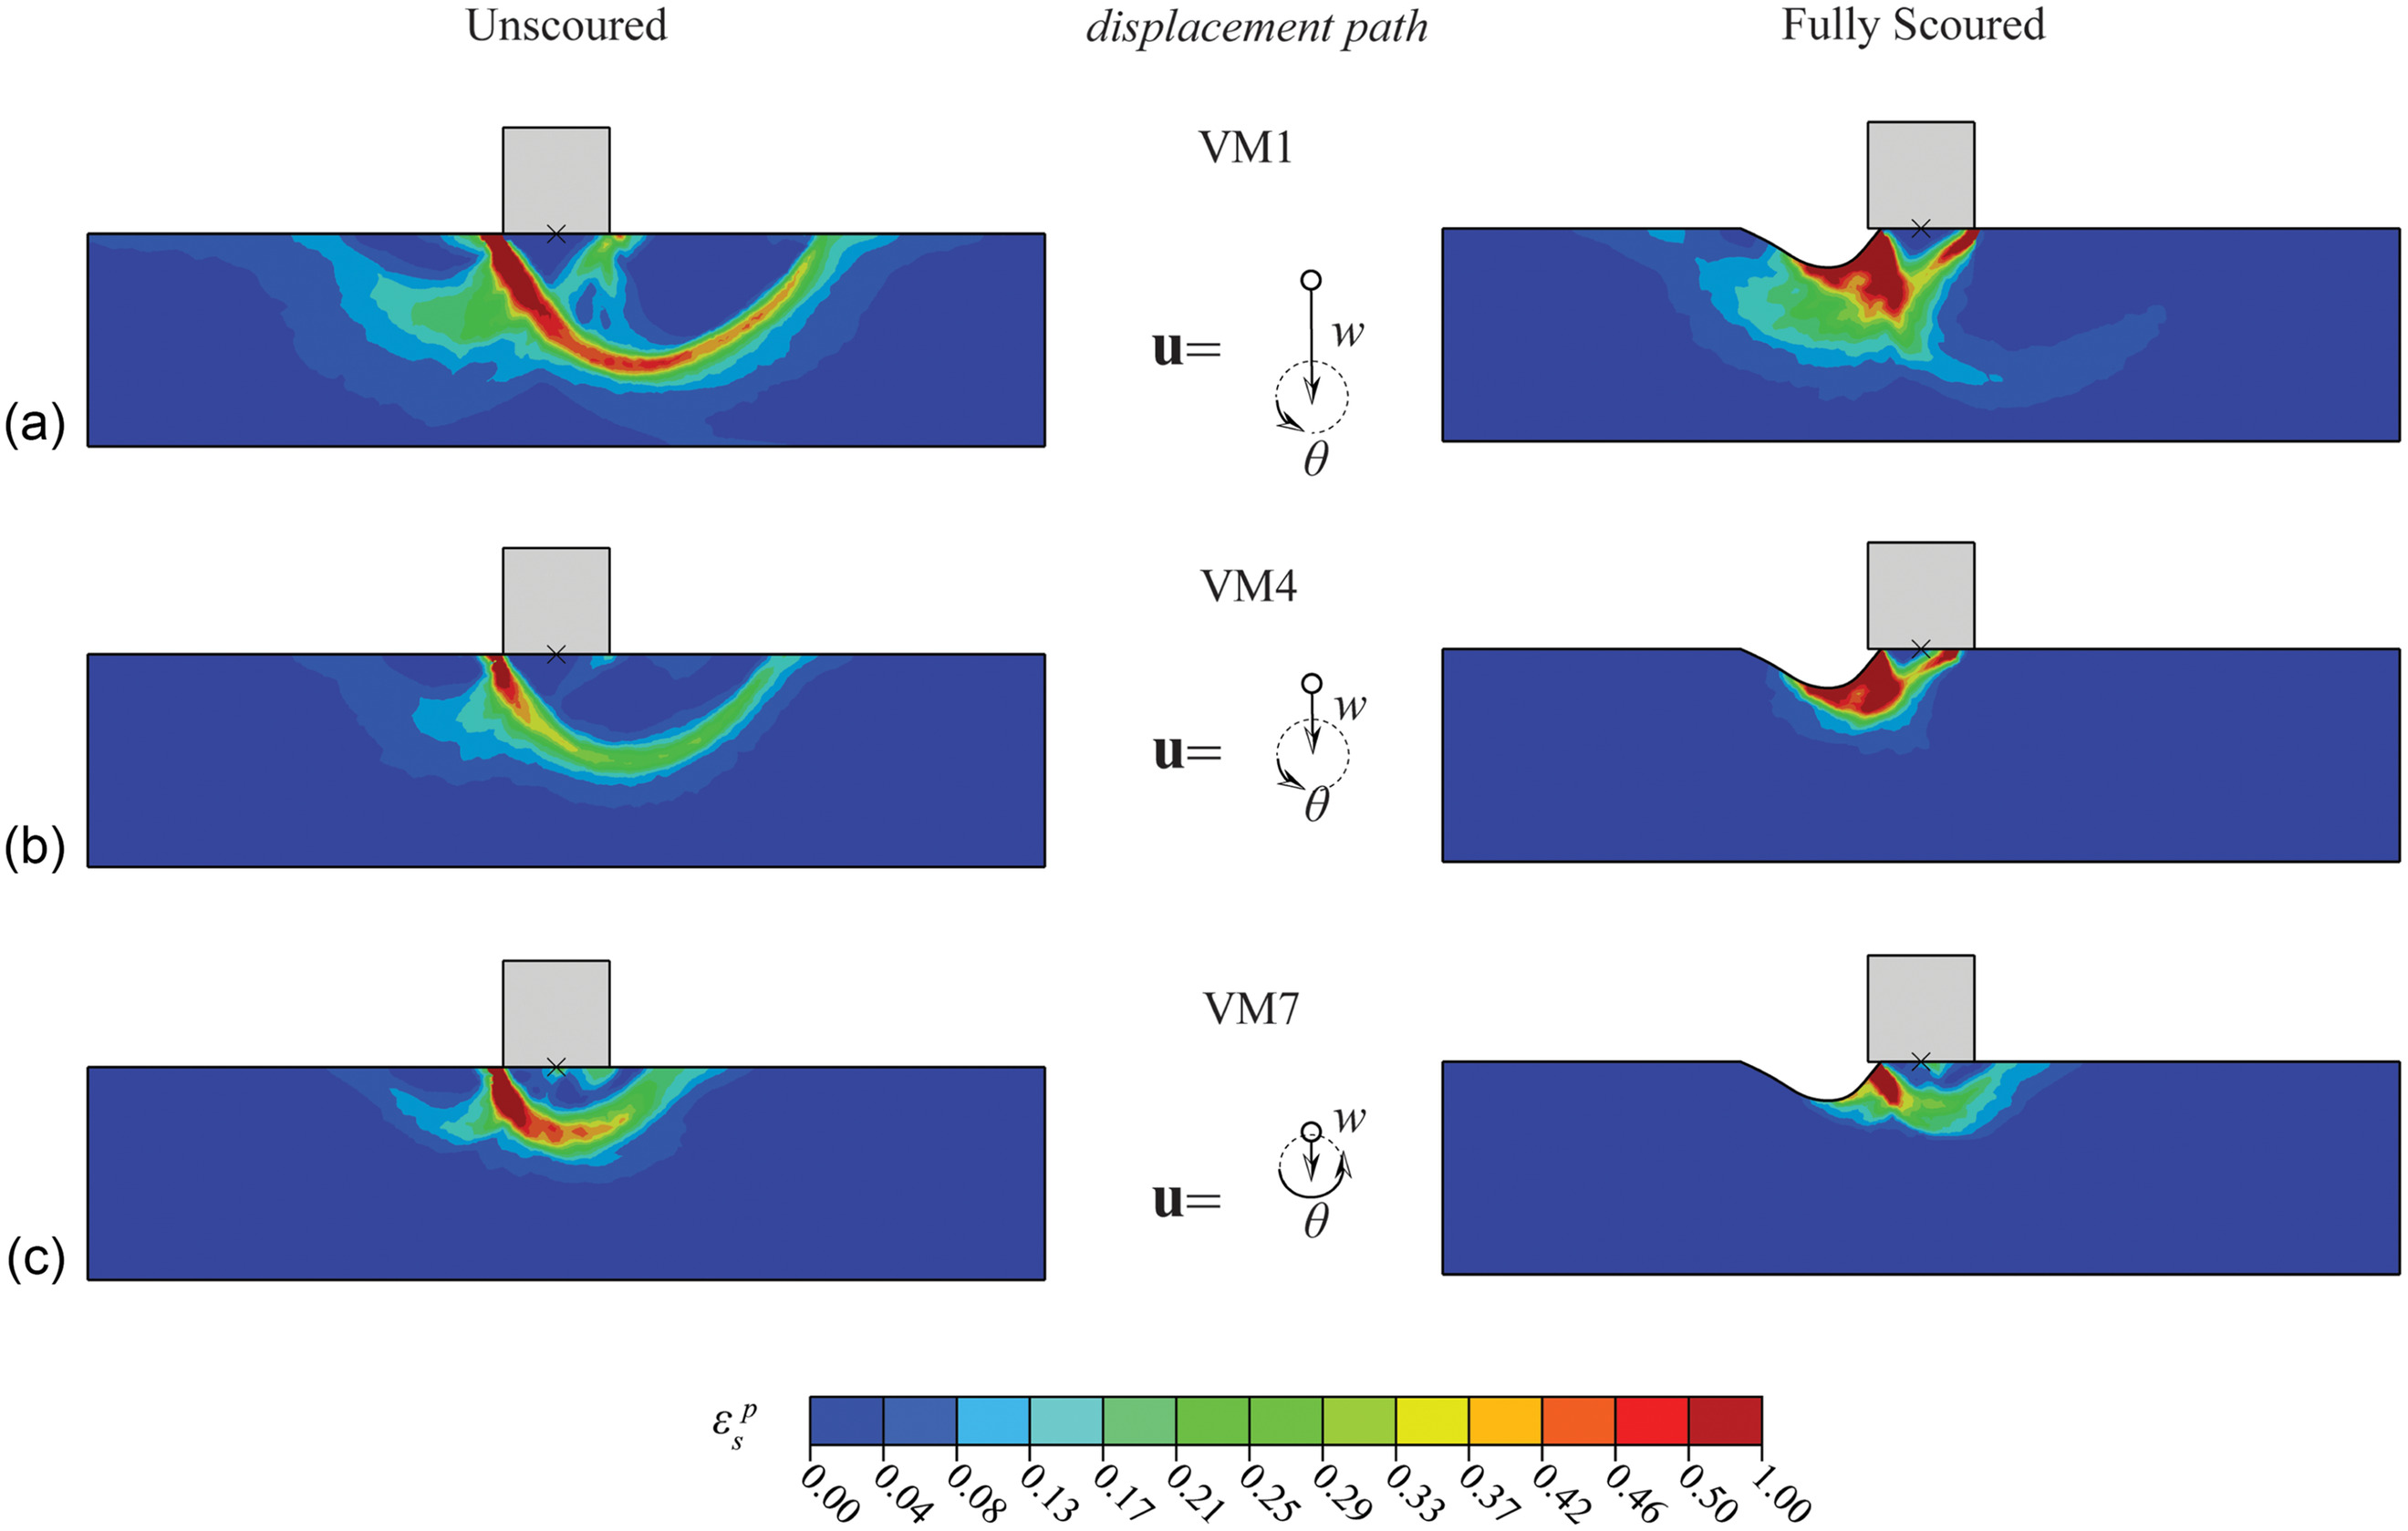
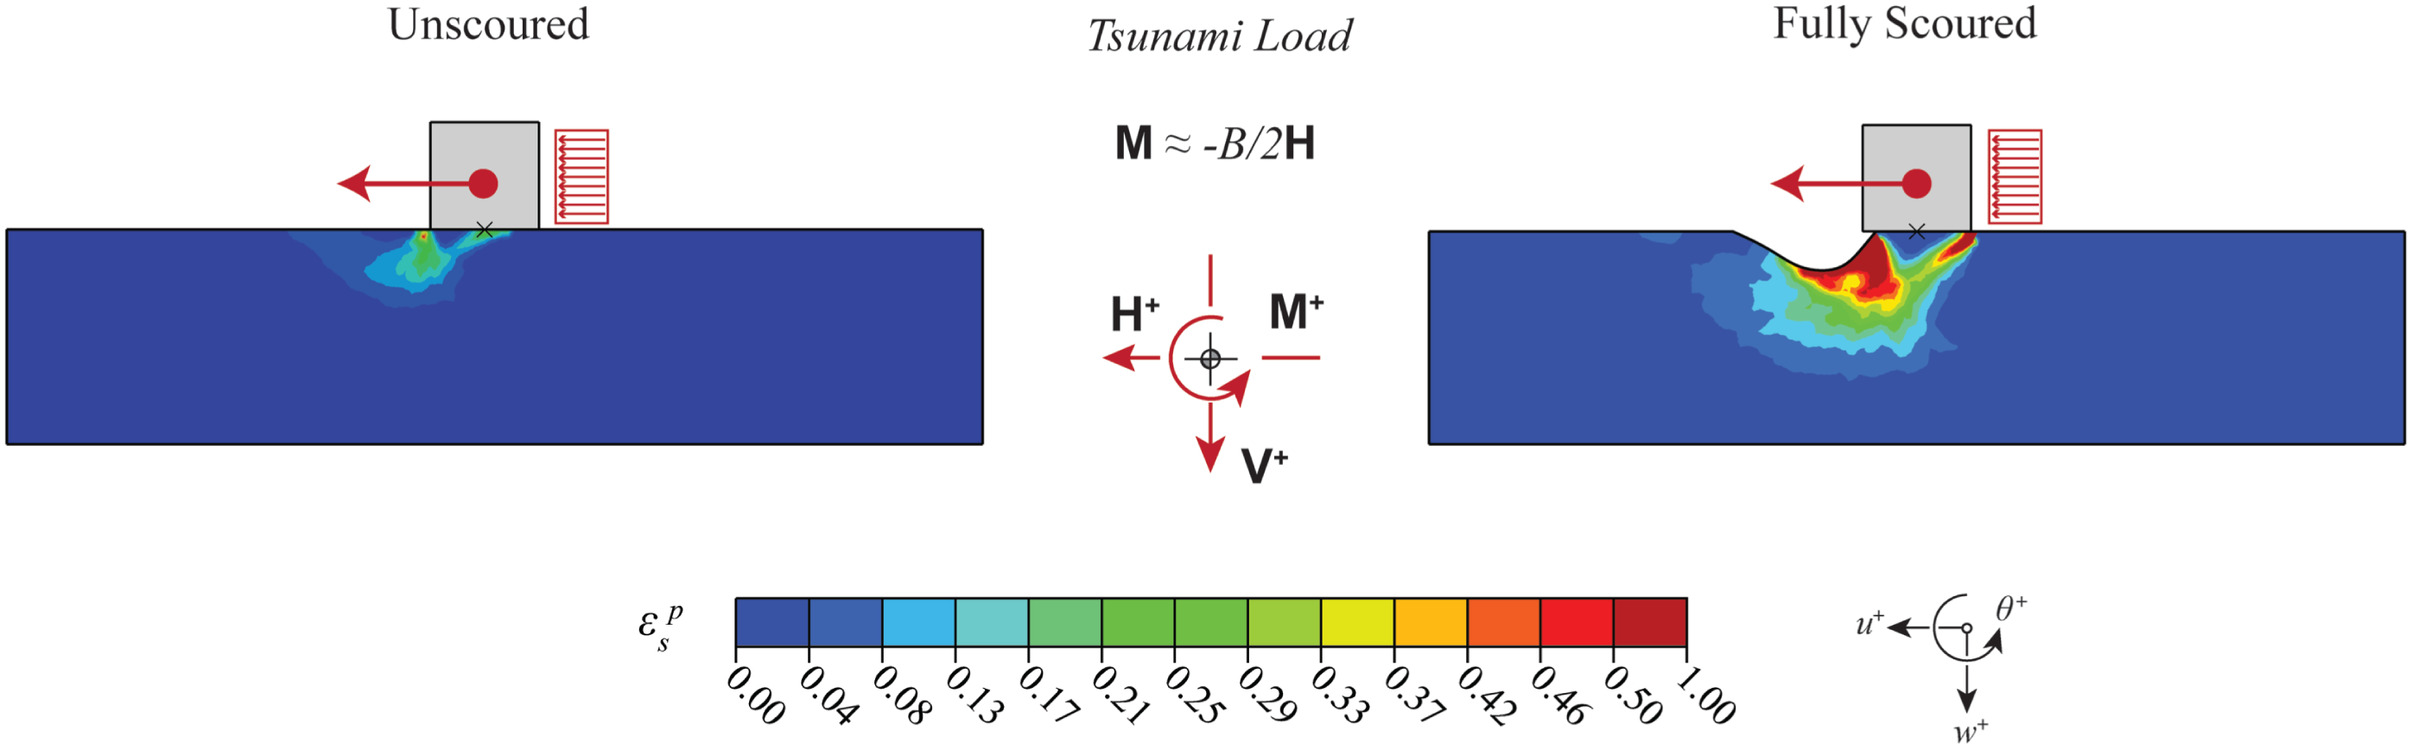
Similarly, Fig. 14 shows the same comparison for three VM loading scenarios, ranging from vertical-dominated, VM1 [Fig. 14(a)], to intermediate, VM4 [Fig. 14(b)], to moment-dominated, VM7 [Fig. 14(c)]. The combined loading of Fig. 15 corresponds approximately to the expected hydrodynamic loading due to the tsunami.
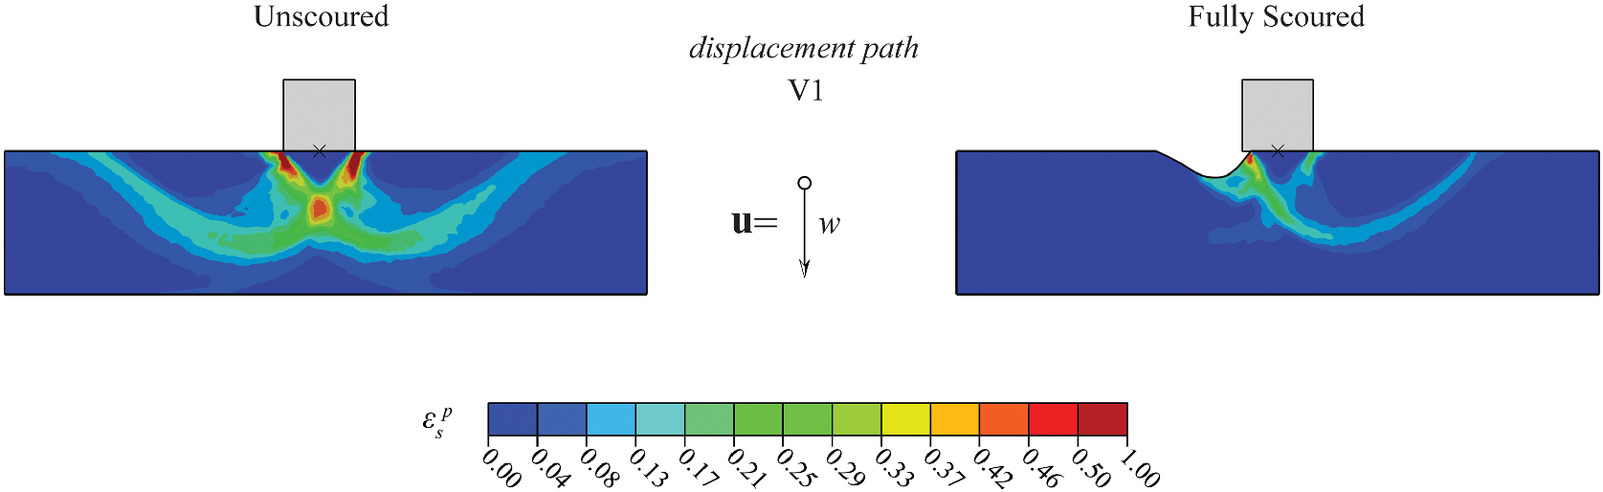
The unscoured case exhibited the typical failure mechanisms for pure vertical, (Fig. 12), horizontal-dominated, VH5 [Fig. 13(c)], and moment-dominated, VM7 [Fig. 14(c)] loading. In all cases examined, the mobilized failure mechanism changed drastically in the presence of scouring, becoming more asymmetric and considerably shallower compared with the unscoured case. For the case that most closely matched the hydrodynamic tsunami-loading scenario (VM1), with (Fig. 15), the difference between the scoured and the unscoured mechanism was rather pronounced, matching very well the mechanism that was observed in the physical model tests. In the unscoured case, the failure mechanism was relatively shallow and took place largely because of sliding (failure of the first row of elements, not along the interface) and rotation of the foundation. In the presence of scour, a deeper failure mechanism developed within the soil, leading to the foundation collapsing into the scour hole.
Fig. 16 performs the same comparison for vertical-dominated VM loading (VM1), in function of scour depth () progression. As the scour depth increased from to 1.84 m, the failure mechanism changed subtly from the unscoured case, becoming more asymmetric and mobilizing a larger soil wedge to the right (unscoured) side of the foundation [Fig. 16(a)]. As revealed by the displacement vectors of Fig. 16(b), between and 1.19 m, the failure mechanism suddenly flipped direction, being dominated by the shallow failure of the soil on the left (scoured) side of the foundation.
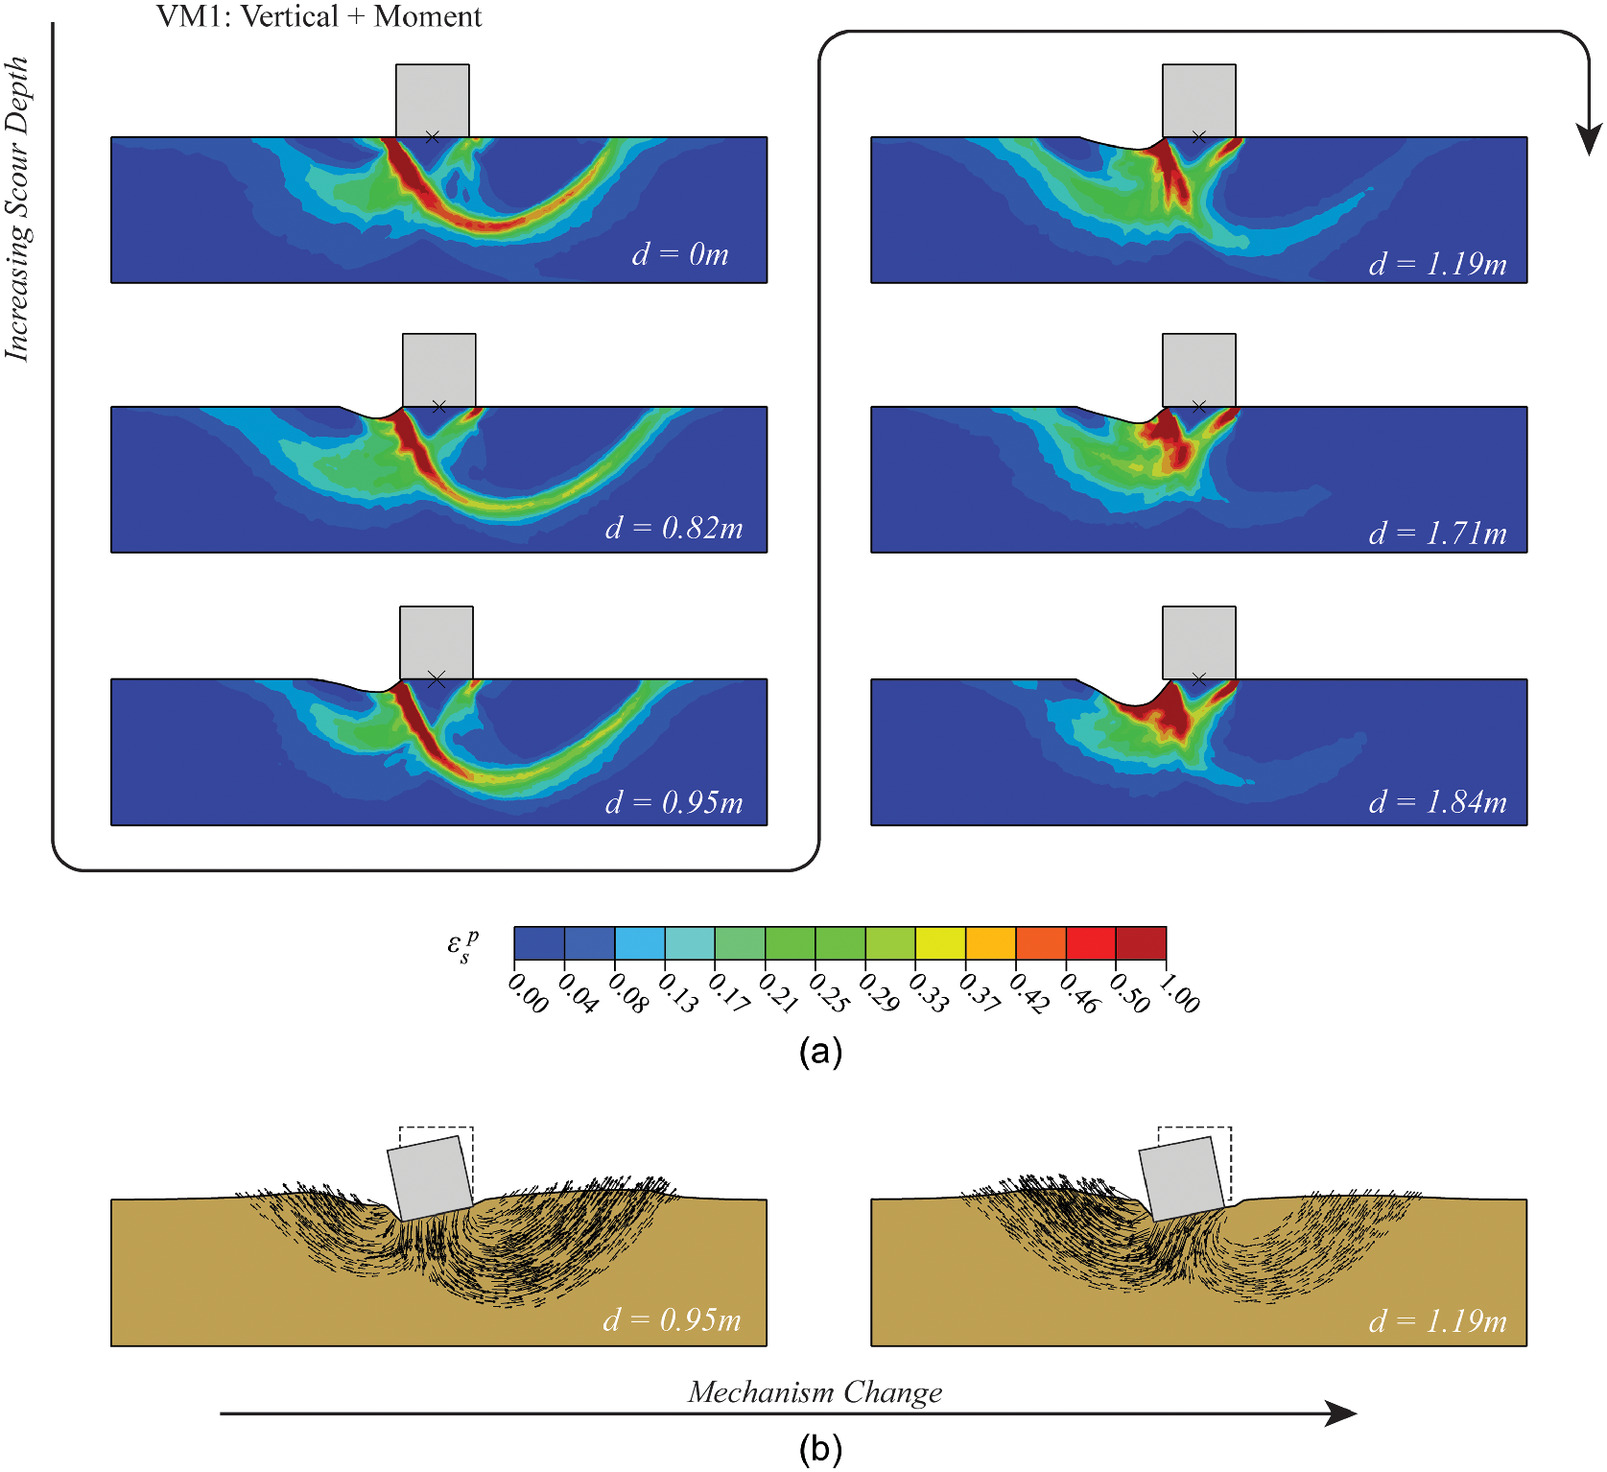
This change of mechanism can be explained by considering the change of stiffness with the progression of scour depth. As increased from 0 to 0.9 m, the progressive increase of the size of the scour hole led to a difference in stiffness to the left (scoured) and right (unscoured) side of the foundation. The removal of soil to the left side of the foundation led to loss of confinement, effectively reducing the stiffness of the remaining soil. Due to its relatively larger stiffness, the soil on the right side of the foundation then attracted larger stresses, leading to the development of a failure mechanism toward that side. As the scour further progressed, at some point, a sufficient amount of soil was removed and a more shallow mechanism on the left side of the foundation became critical. Such a transition is possible because of the use of displacement rather than load paths; although the displacement path is the same, asymmetry of stiffness means the ratio of vertical to horizontal force changes with scour depth, leading to a change in mechanism.
The transition between failure mechanisms with the increase of scour depth was also observed for the pure vertical and the paths, but to a lesser extent. In the case of loading (Fig. 14), the transition from a deeper failure mechanism on the right to a more shallow mechanism on the left was due to (1) the reduction of vertical bearing capacity with the increase of scour depth, due to which vertical-dominated bearing capacity failure became critical (developing before a horizontal-dominated mechanism could develop); and (2) the increase of asymmetry with the increase of scour depth, which led to nonnegligible foundation rotation even before imposing the initial part of pure vertical loading. Under pure vertical loading, this asymmetry-induced rotation leads to development of a secondary shear force at the soil–foundation interface; in the case of loading, it leads to an increase of the imposed shear force.
Scoured Failure Envelopes
The complexity of the failure process makes the analytical solution of the problem challenging: the failure mechanism needs to be compatible with the load combination and the scour geometry. The problem is simplified by extending the previously discussed widely used failure envelopes to account for the effect of scour. Using the previously outlined bilinear approximation, the failure points were detected for each combination of load path and scour state, and the results were plotted in the space to define the failure envelope. Employing the method of Butterfield and Gottardi (1996), the 3D failure envelope was defined by four parameters, , , , and , all of which vary with scour depth .
Fig. 17 plots the failure points and the derived scoured failure envelopes in the normalized and space in function of scour depth [Fig. 17(a)], along with the vertical load-displacement response for pure vertical loading [Fig. 17(b)]. The increase of scour depth led to a contraction of the failure surface. The maximum vertical force () that can be mobilized under pure vertical loading reduced significantly with the progression of the scour process. As it can be seen in Fig. 17(b), besides the reduction of , the postpeak response was also affected by the increase of . For large scour depths , the initial failure was followed by a noticeable hardening regime. After the foundation reached its initial failure, it moved and slid into the scour hole, progressively mobilizing a deeper and larger failure mechanism, leading to the observed hardening. This is similar to the observed hardening response when subjecting a shallow foundation to pure vertical loading, simply because of its progressive embedment in the soil (Gottardi et al. 2015).
In order to describe the contraction of the failure envelopes with the increase of scour depth, we define new scoured parameters , , and , which vary with . The maximum mobilized vertical force in the presence of scour is termed and is used to define the scour-normalized parameters as follows:
(16)
(17)
(18)
(19)
The initial value of the maximum mobilized vertical force for the unscoured case is used for normalization. The parameters are fitted for each scour depth by first selecting based on the results of the pure vertical path, [Fig. 17(b)]. The results of the and paths are then used to derive and [Fig. 17(a)]. Finally, the eccentricity is fitted using the combined paths by plotting the failure points in the normalized space [Fig. 18(b)].
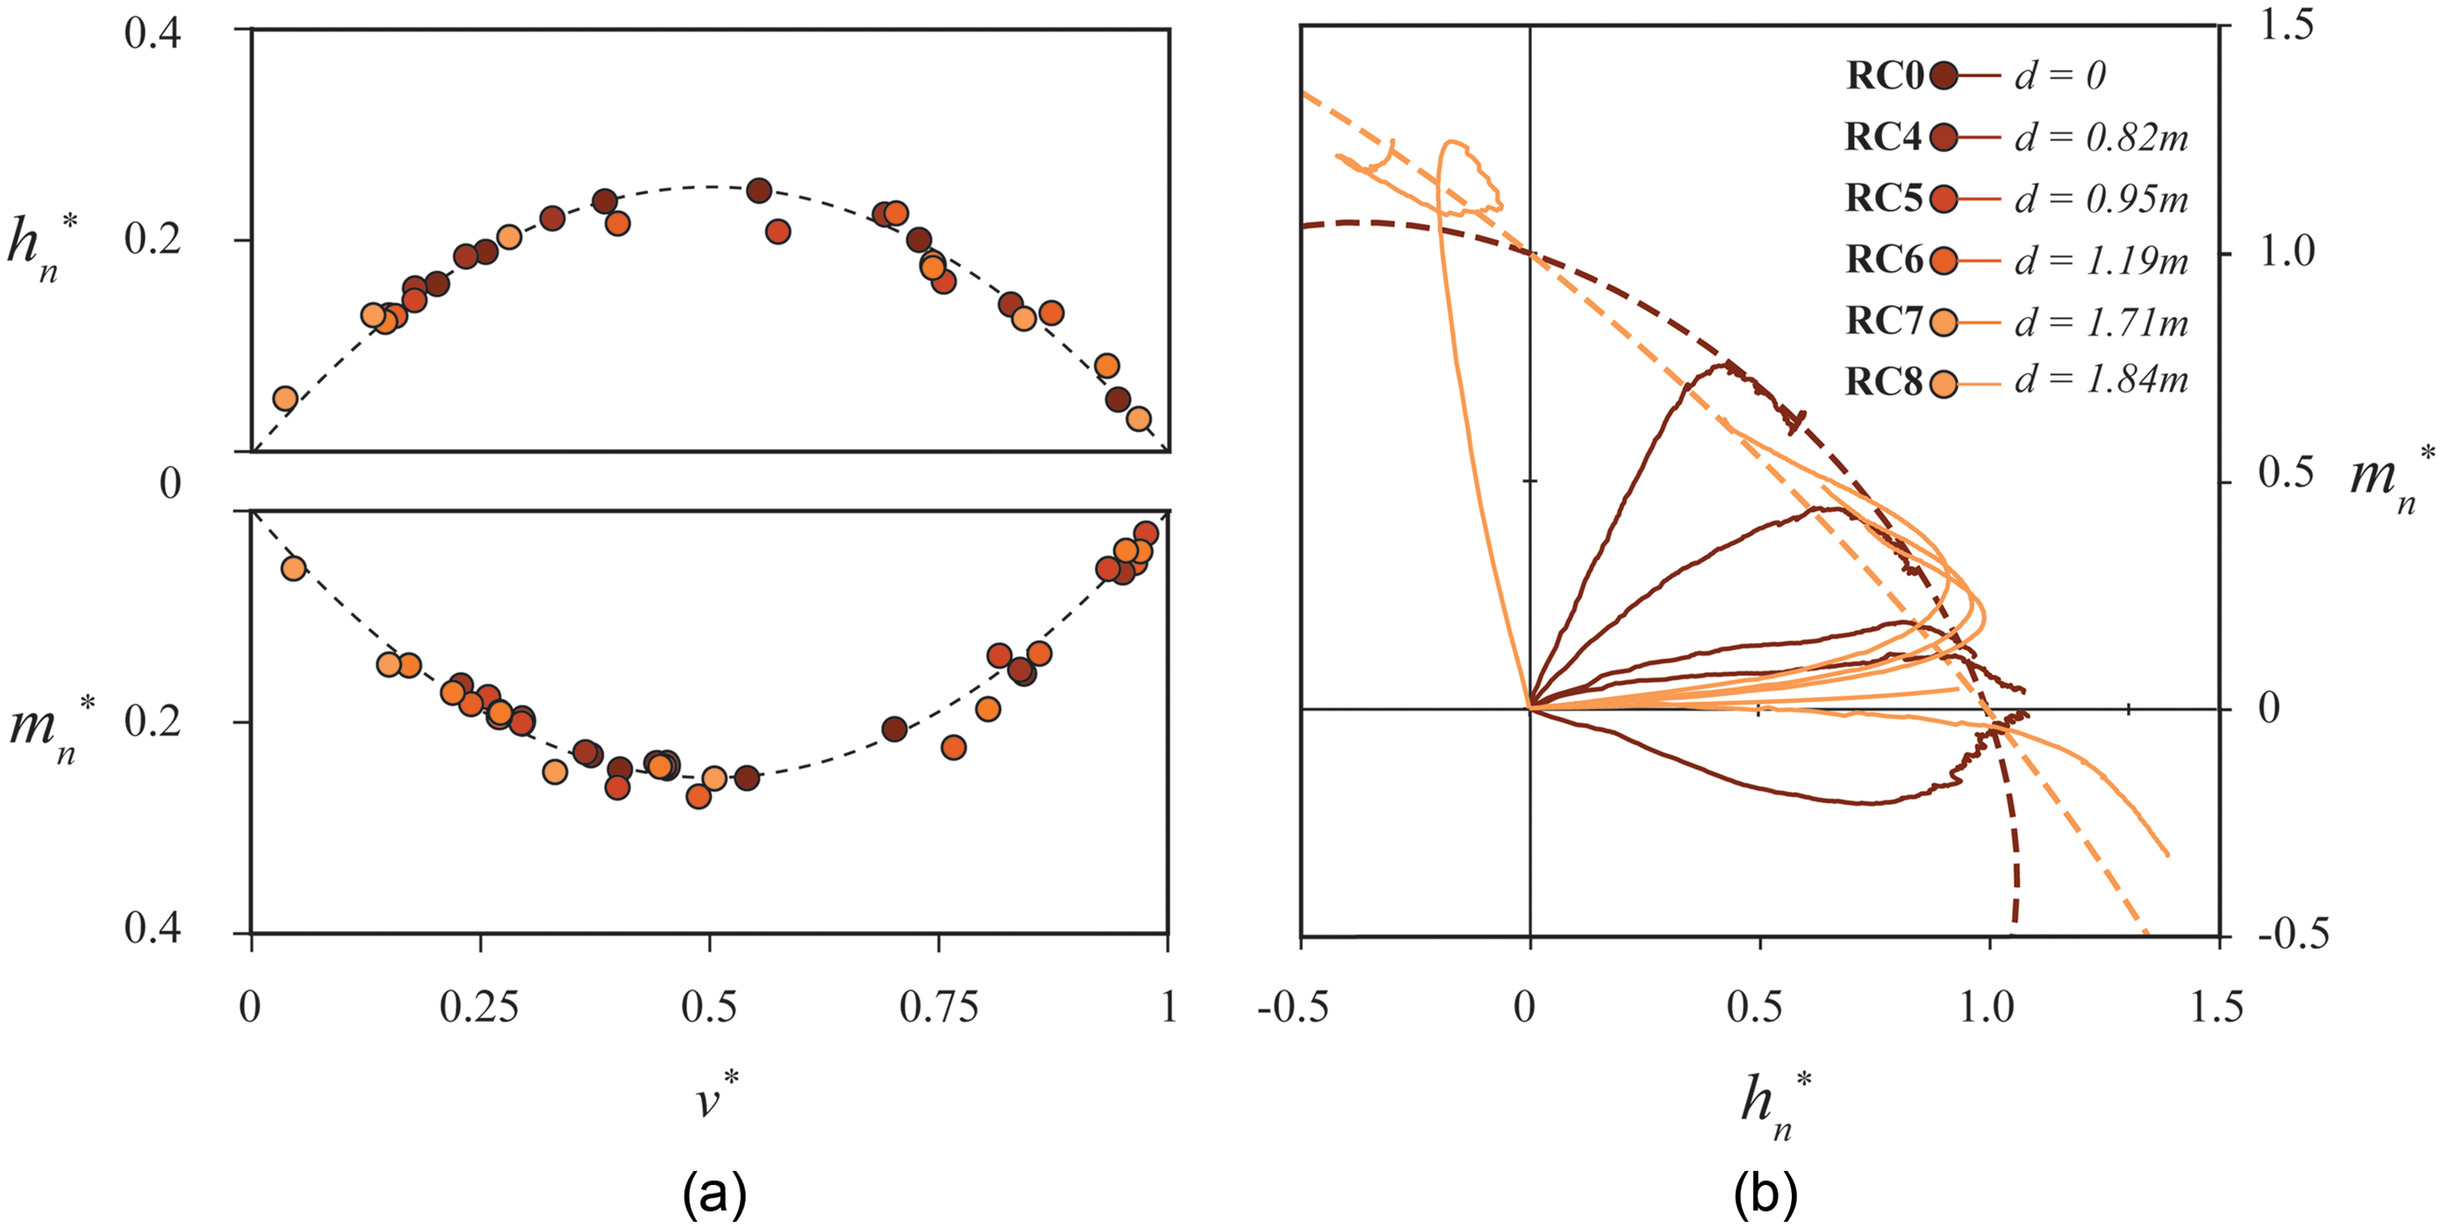
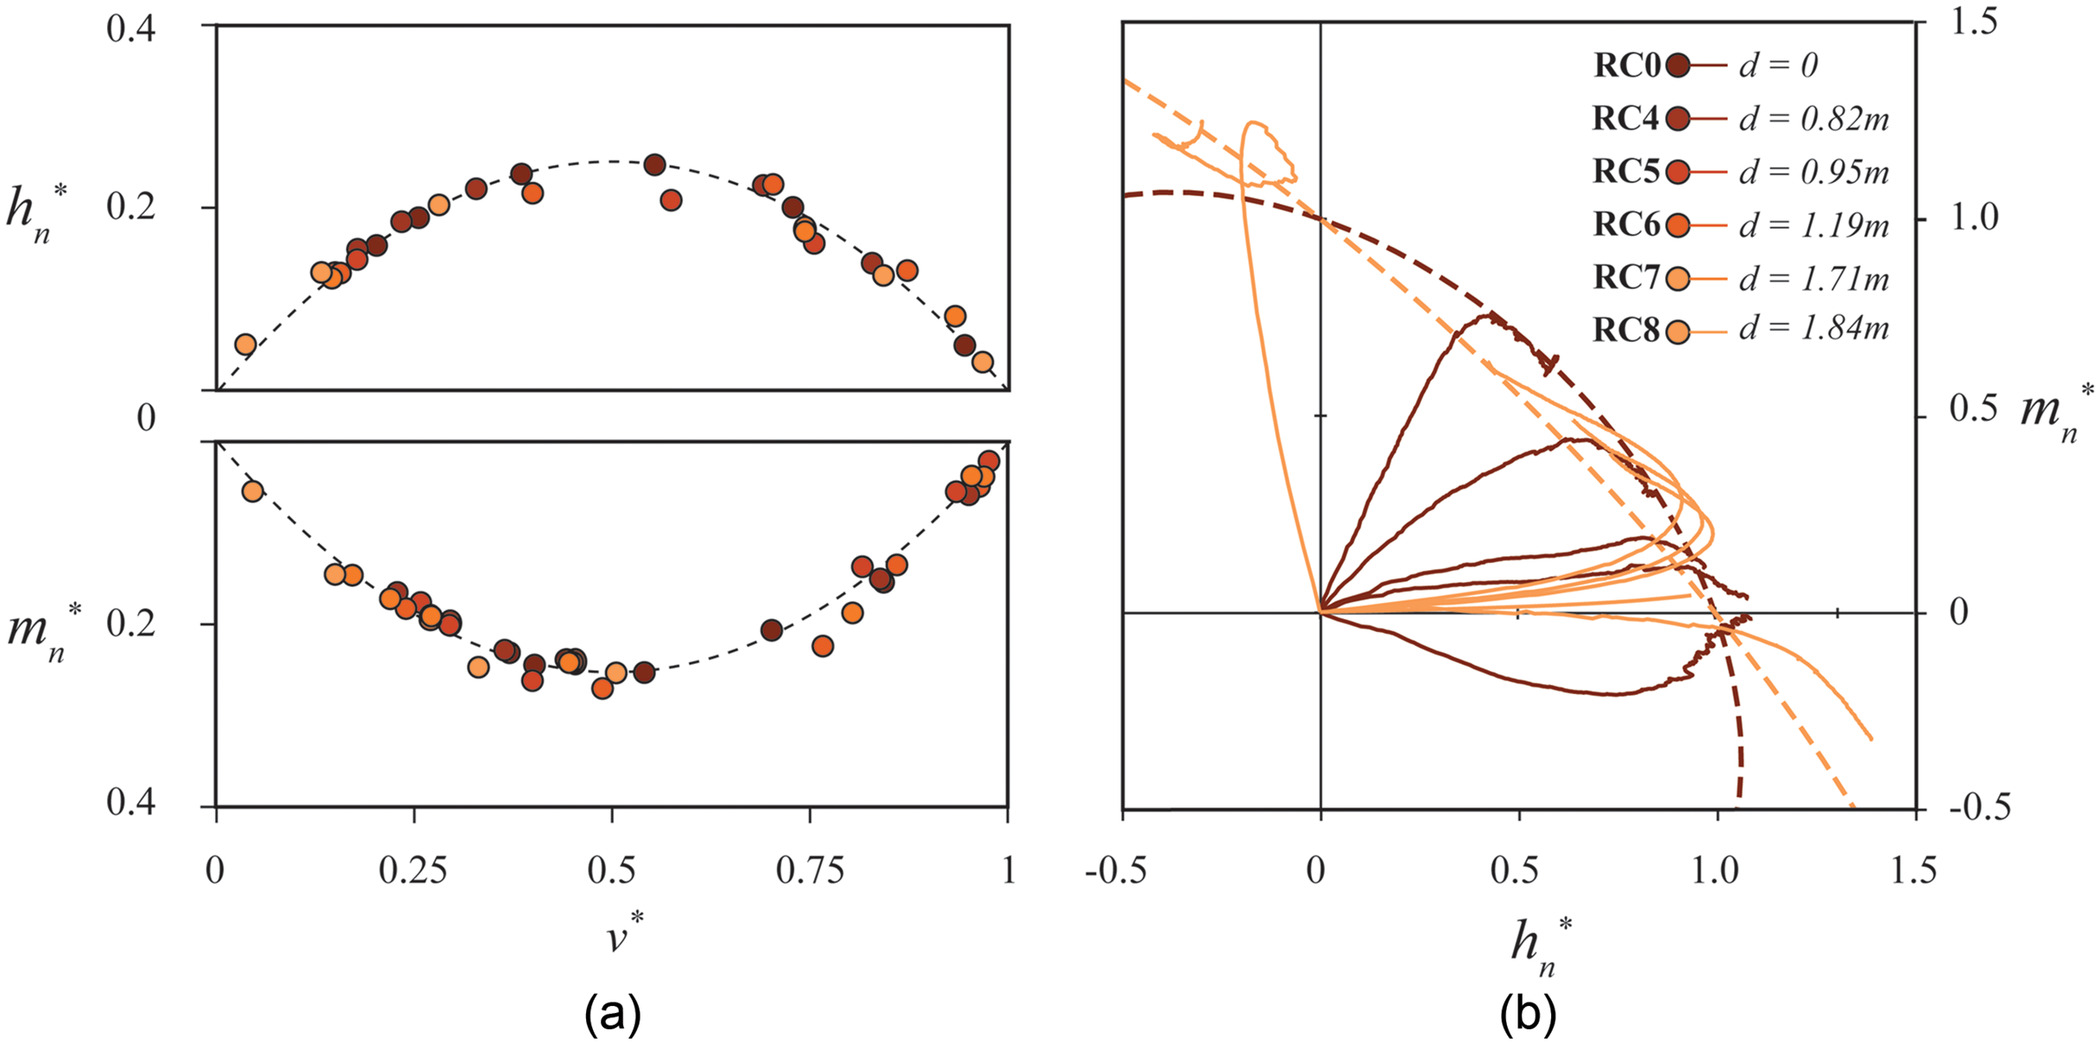
Plotted in the normalized , , space [Fig. 18(a)], the general contraction of the failure surface with increasing scour depth is rather evident. The failure surface dramatically reduced in size as scour depth progressed. This contraction occurred both in terms of the total size of the failure surface (through ) and the shape of the failure surface, through decreasing and . Plotted in the normalized space [Fig. 18(b)], the failure surface can be seen to become more and more elongated with the increase of scour depth . Only positive values of moment have been investigated; the curves plotted for negative in Fig. 18 are given only for illustration purposes.
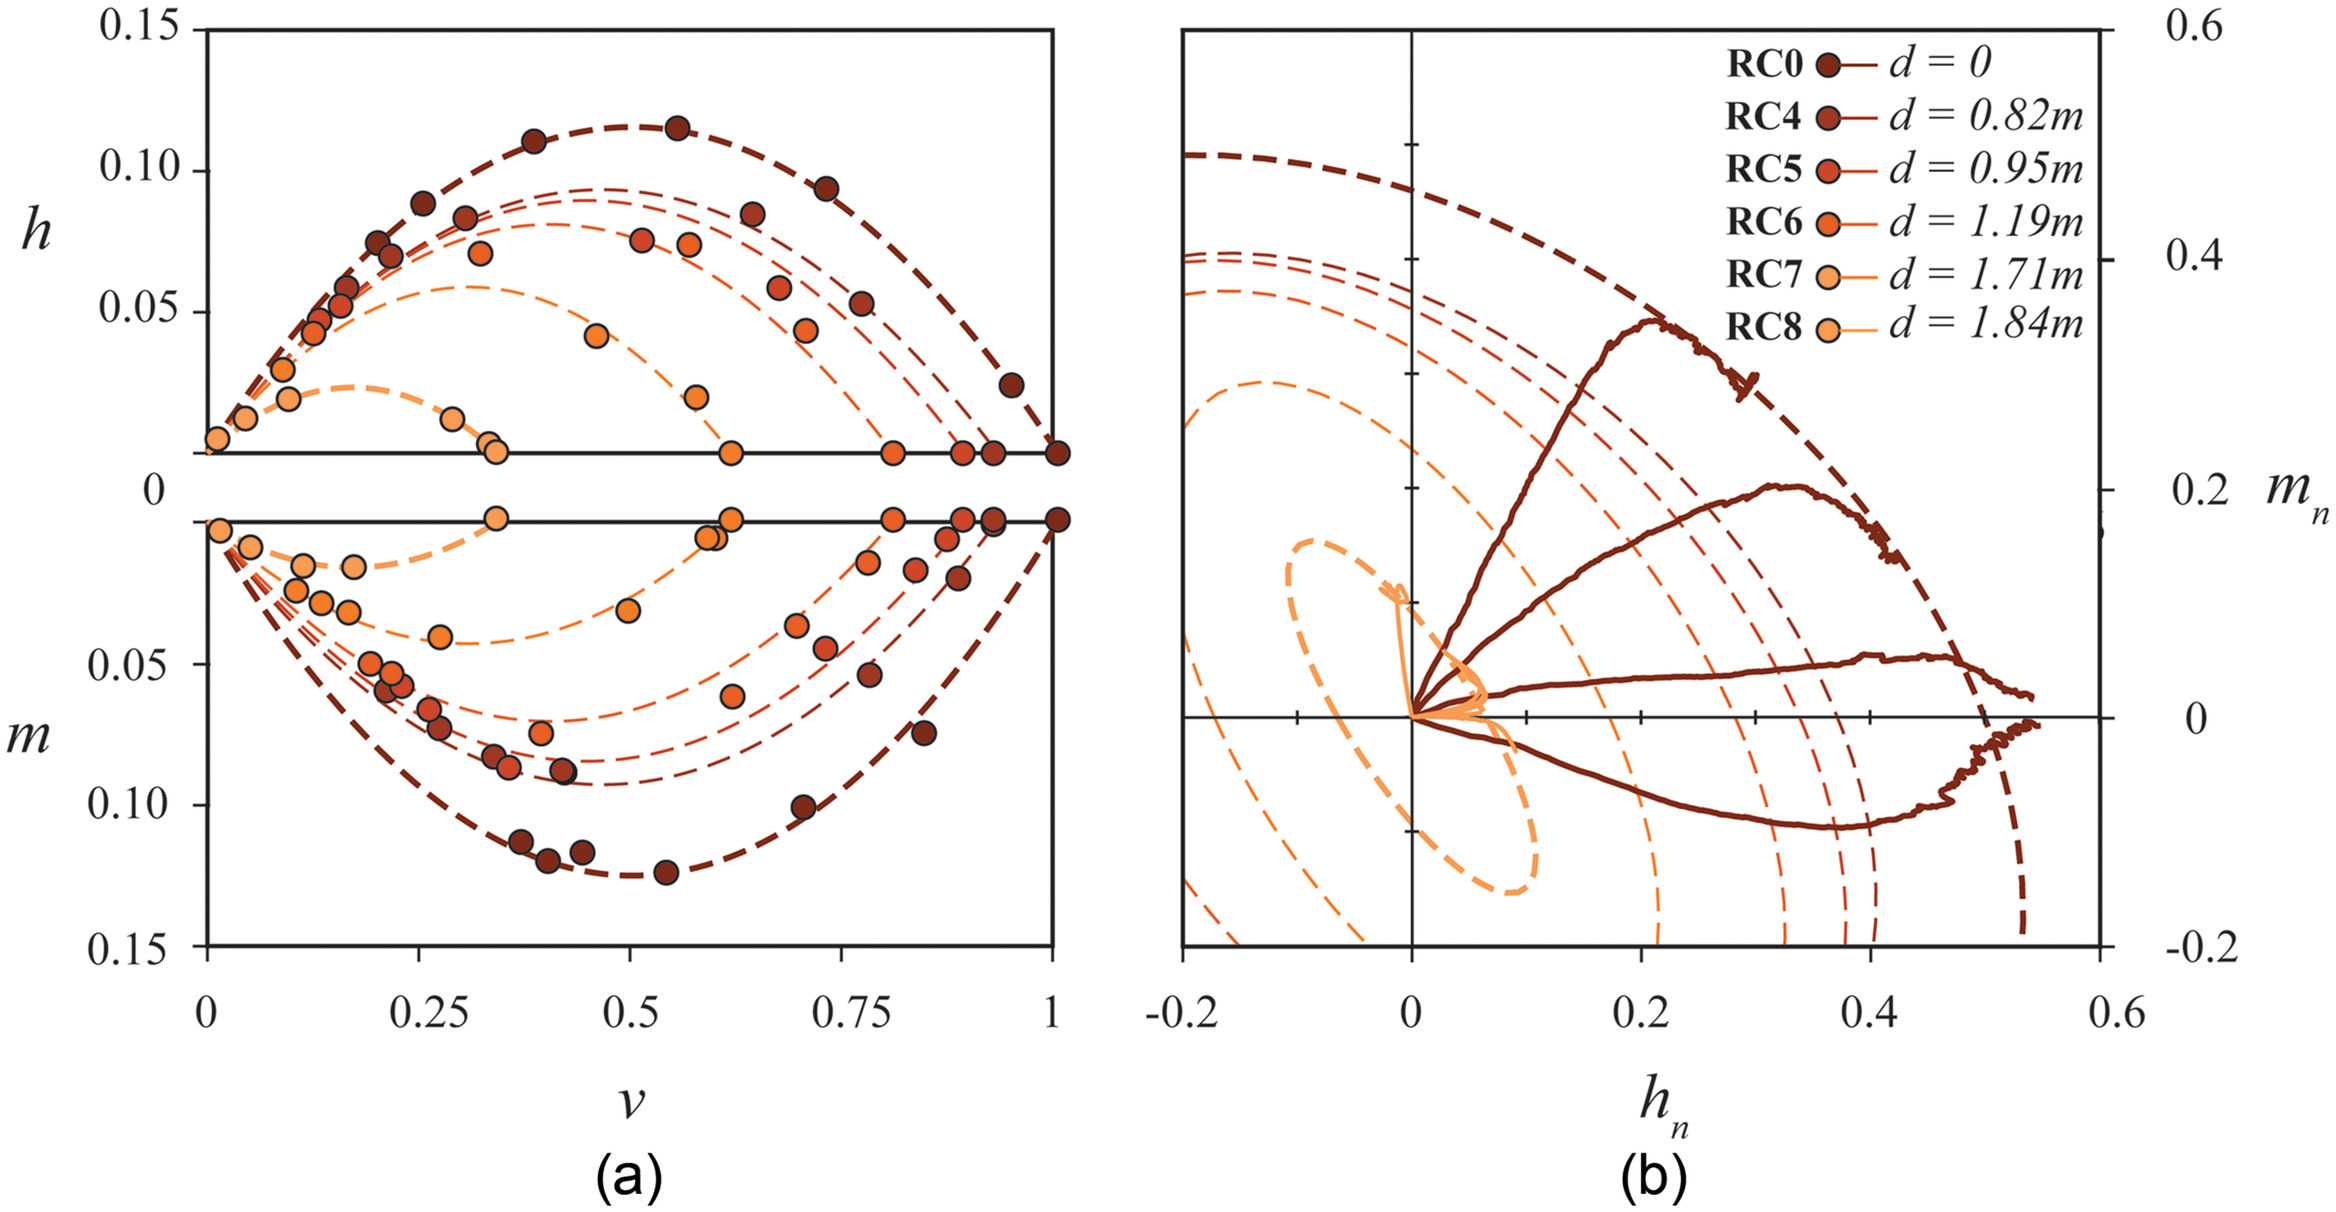
Fig. 19 plots the complete set of failure envelopes in the fully normalized and space [Fig. 19(a)] and the space [Fig. 19(b)], where all failure points lie on a single curve governed by Eq. (19). Coupled with the values of , , , and , these curves completely describe the failure surface for any scour depth . The variations of , , , and are plotted in Fig. 20, where is normalized with (pure vertical bearing capacity of the unscoured foundation). The reduction of parameters and was gradual with scour depth and approximately linear, with reducing more intensely than . The value of reduced approximately in proportion to the square of the scour depth , whereas the eccentricity increased linearly.
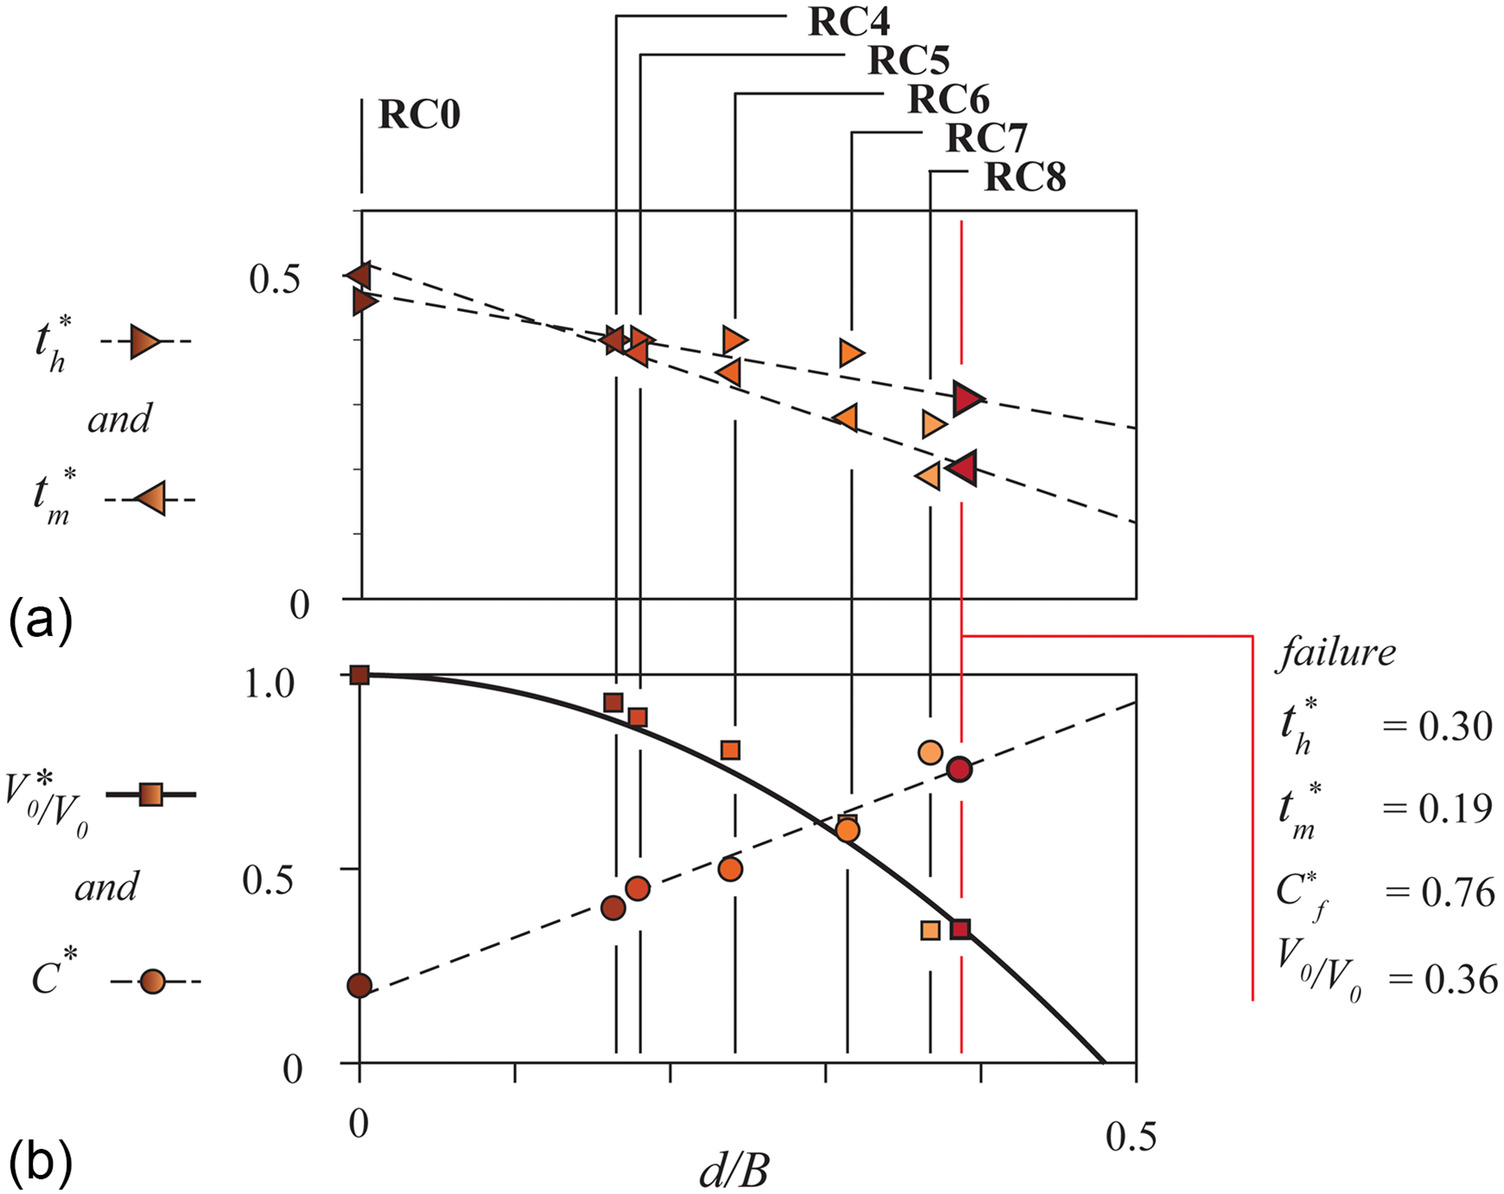
As revealed by the relationships plotted in Fig. 20, the horizontal bearing capacity is much more sensitive to the scouring process because the presence of the scour hole leads to the development of a more shallow mechanism [Fig. 13(c)]. This was clearly observed in the MTG experiments, where a shallow slopelike failure was produced at large scour depths. The moment capacity was apparently much less affected by the scour depth, which is reasonable when observing the mechanism of Fig. 14(c): under loading, most of the soil in the resisting mechanism lies to right (unscoured) side of the foundation. The increase in eccentricity () also reinforces the hypothesis that the behavior of the foundation becomes increasingly asymmetric with scouring as the relative direction of horizontal force and moment becomes more pronounced.
The reduction in maximum vertical bearing capacity was rather intense, with being reduced by up to 60% for the largest scour depth. This reduction of was proportional to the volume of the scour hole, which can be correlated with . The removal of soil directly affects both the mobilized shear surface and the weight of the soil acting on it. Its effect can therefore be thought of as a reduction of the bearing capacity factor . The contraction of the failure surface in all dimensions shows that it was not simply the vertical bearing capacity that was reduced, but also the relative magnitudes of vertical, horizontal, and moment capacity were affected by the scour process.
Based on these results, it is possible to describe the failure envelope for any scour depth, by defining equations for the surface parameters as follows, first by defining the normalized scour depth:
(20)
Eq. (20) is used to define the parameters needed to construct the failure surface. The unscoured parameter and scoured parameter are as follows. is calculated
(21)
Then, is calculated as follows:
(22)
Next, is calculated
(23)
Finally, is calculated as follows:
(24)
Using the preceding parameters, it is possible to construct the scoured failure envelopes for any strip foundation under similar conditions. To elucidate the process, we constructed the failure surface for the reference experiments described previously. At failure, a scour depth was recorded, giving , , , , and . Using the bearing capacity equation [Eq. (1)] to determine , with (consistent with ) (Fig. 10) and the buoyant weight of the soil () gives .
Using these values, the failure surface was constructed and compared with the measured forces on the instrumented breakwater from the experiment Fig. 21. The results of another set of experiments are also included, with smaller scour depths and larger tsunami forces, along with failure envelopes produced with Eq. (19) and the relationships of Eqs. (21)–(24). The result of a simple pull test is also included, where the breakwater was pulled horizontally ( direction). This test yields the sliding-type failure that is often used for design: the sliding failure surface is simply the interface friction , where was found to fit well with the data.
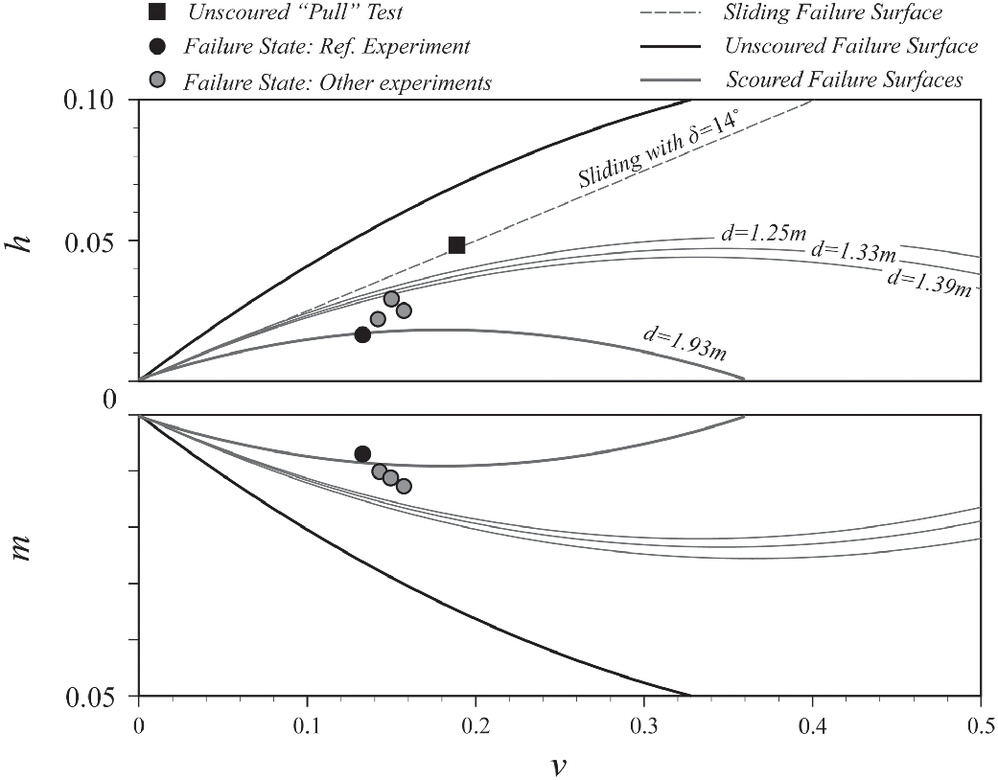
The calculated failure load using the scoured failure envelopes was in good agreement with the experimentally measured, confirming that the simple expression of Eq. (19) and the relationships Eqs. (20)–(23) can reliably predict the effect of scouring for the reference case. For the other experiments, which all had higher values of horizontal force and moment at failure while having smaller scour depths, the foundation capacity was overpredicted. This may be due to the fact that these experiments were subjected to a larger tsunami load. Under such intense loading, nonnegligible excess pore-water pressures may develop within the soil, leading to reduction of its shear strength. This was not the case for the reference experiment, but can be of importance for larger tsunami loads, as was also been observed in the centrifuge tests of Takahashi et al. (2014). Such effects can be captured through modification of , because the effective stresses are reduced by pore fluid flow within the soil, either through a modification of or the buoyant unit weight of the soil. It is a limitation of the work presented here.
Design Example
In order to illustrate the applicability of the derived expressions, a design example is presented. Similarly to the reference experiment, a = 8 m square breakwater was considered, lying on dense sand. The breakwater is subjected to an overtopping tsunami of , above freeboard [Fig. 22(a)]. Using the derived scoured failure envelopes, the safety of the breakwater can be assessed.
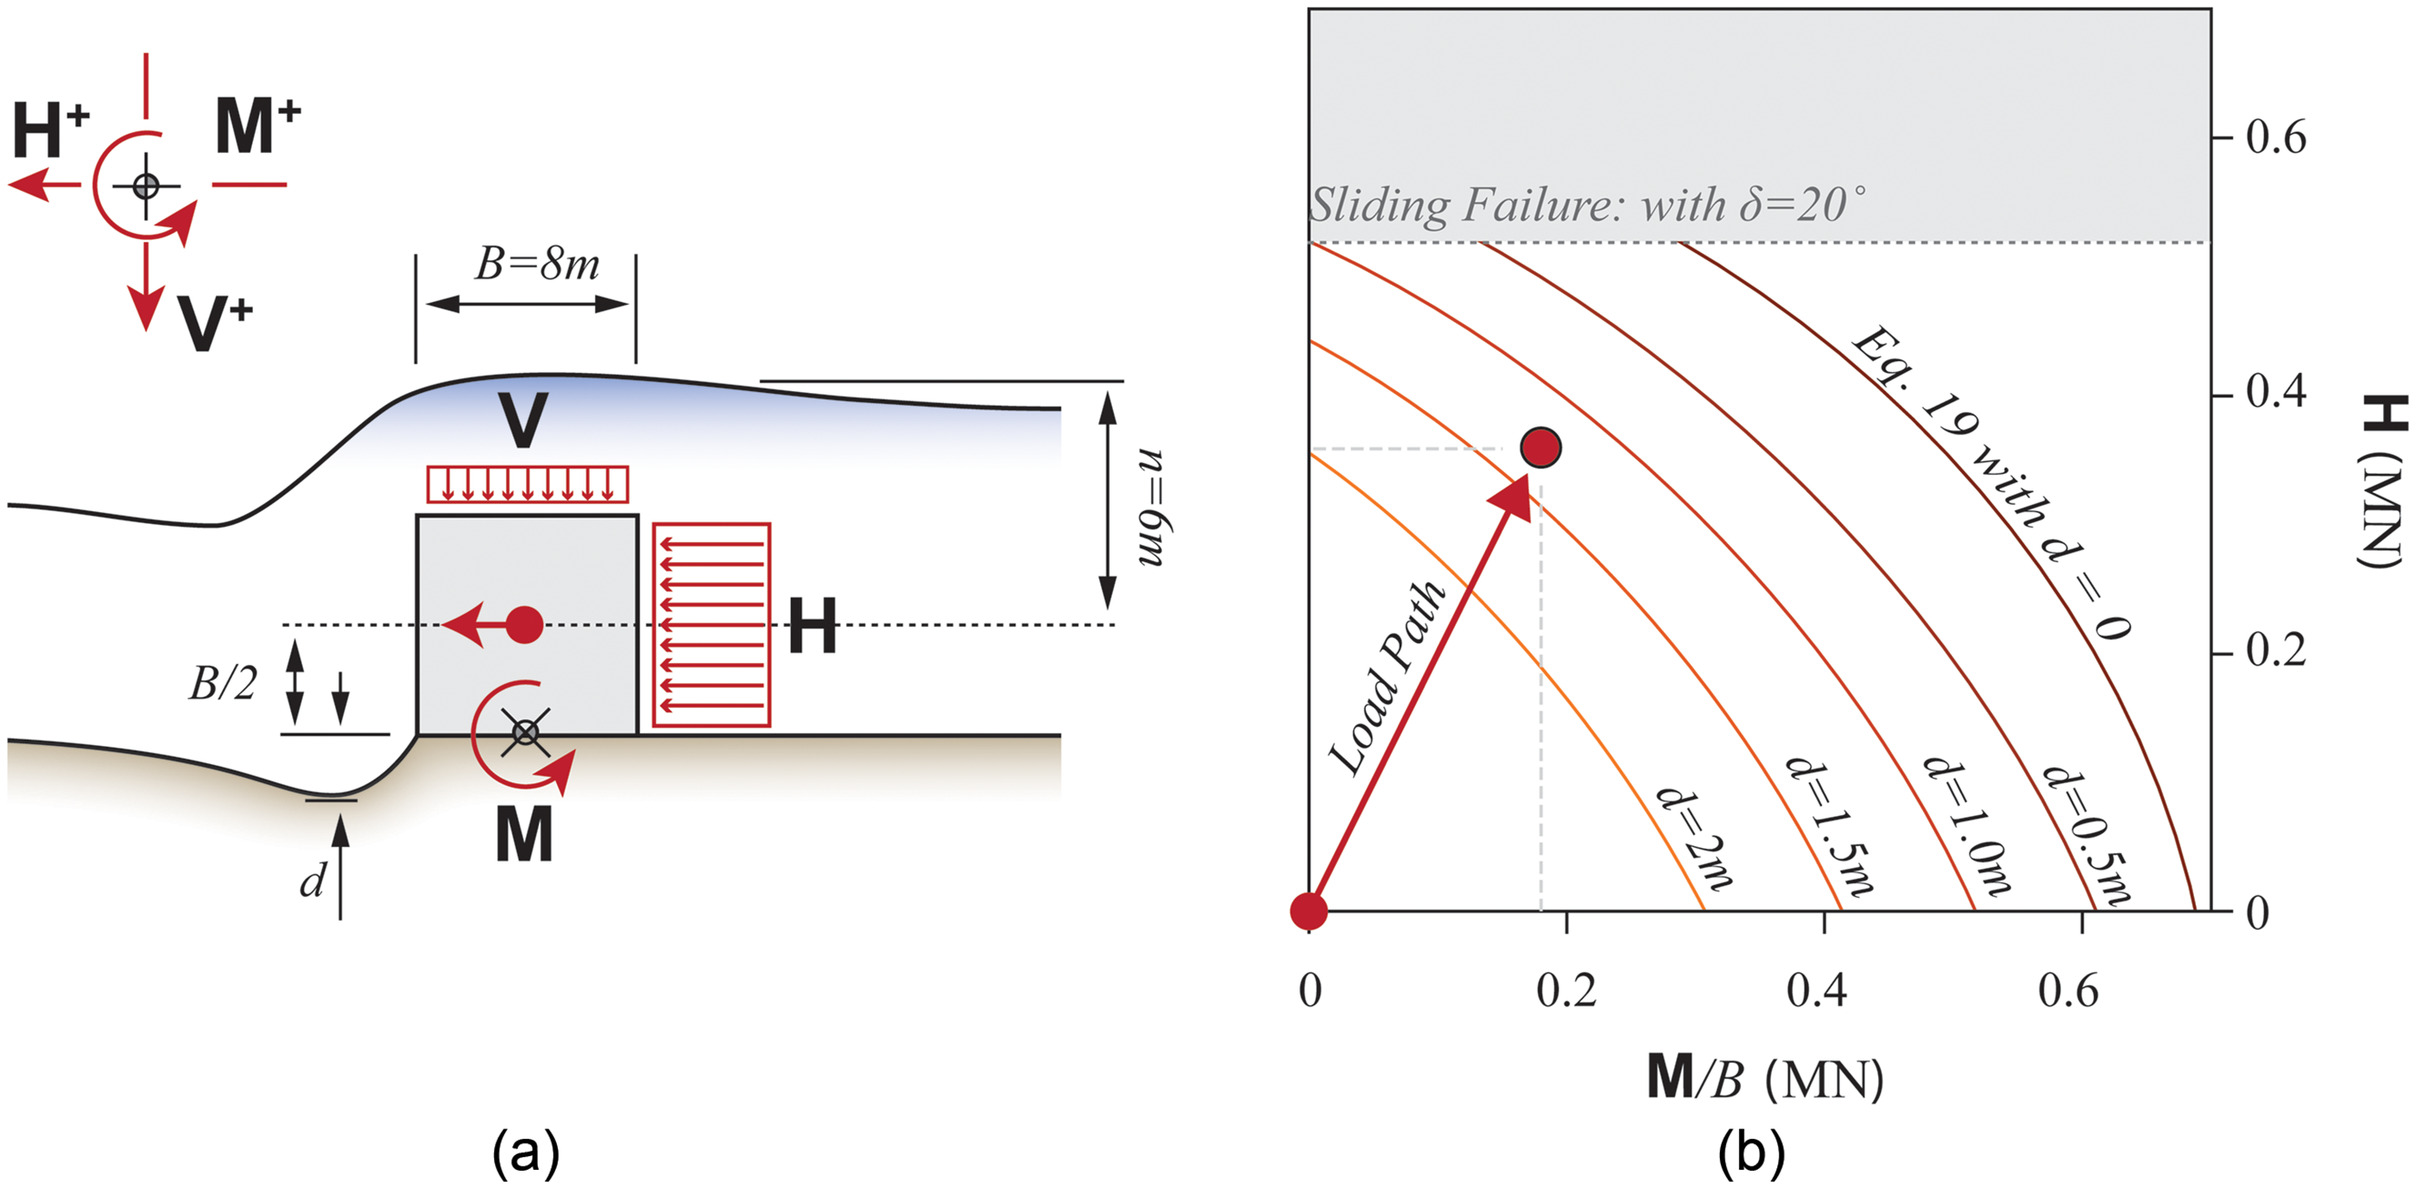
The first step is to calculate the bearing capacity under pure vertical loading. Using Eq. (1) and assuming a buoyant unit weight and mobilized friction angle yields MN. The working vertical load () is defined as the buoyant weight of the breakwater (, ), plus the weight of the overtopping flow, , giving , yielding .
Having calculated , Eq. (7) in conjunction with the fitted parameters , , and can be used to define the initial failure surface in the plane [Fig. 22(b)]. These parameters can either be derived directly for the specific soil through the numerical method outlined here or obtained from the literature for various soils and foundation systems (e.g., Bienen et al. 2006; Butterfield and Gottardi 1996). Additionally, the sliding failure surface given by with can be defined as the limit at which the foundation will fail in sliding before bearing capacity failure is reached [Fig. 22(b)].
Eqs. (20)–(23) can now be used to derive the scoured surface parameters , , , and for various scour depths, and Eq. (19) can be solved for and for different values of normalized scour depth . The solution is shown in Fig. 22(b), expressed in terms of absolute values of and .
The horizontal tsunami loading was idealized as twice the hydrostatic force arising from the maximum overtopping wave height, distributed over the height of the breakwater [Fig. 22(a)], . This assumption matched the conducted experiments, but regional building codes (eg., ASCE 2017; OCDI 2020) give slightly different recommendations for magnitude/distribution based on inundation height. More precise descriptions of the real tsunami pressure for different structural configurations can be found in the literature, such as the ones proposed by Goda (1975, 2010) or the modified hydrostatic overtopping forces proposed by Arikawa et al. (2012). This produces an overturning moment , which increases with , denoted by the load path shown in Fig. 22(b).
Based on the derived failure envelopes and the tsunami-induced load path, it is clear that the breakwater is safe under unscoured conditions: the acting tsunami load does not intersect the (unscoured) failure envelope. If the relationship between horizontal force and moment holds true (), and the horizontal force can be calculated as , the breakwater has a safety factor , where would be the tsunami height required to reach the failure surface of Fig. 22. It is also apparent that under most loading conditions, sliding failure was unlikely for a reasonable interface friction coefficient ( was assumed herein). It also becomes apparent that tsunami-induced failure of the breakwater can be induced once the scour depth reaches : this is the first failure envelope that is intersected by the acting tsunami load . Without scour, no failure can occur. The expected scour depth is a function of both the maximum tsunami height, as well as its duration. It can be estimated either from the results of laboratory testing (e.g., Chen et al. 2016; McGovern et al. 2019), or based on observations from past events (e.g., Bricker et al. 2012; Jayaratne et al. 2014).
Therefore, the developed methodology allows two assessments to be made: (1) whether the structure is likely to fail purely due to tsunami-induced hydrodynamic loading (using the unscoured failure envelope); and (2) whether the expected scour due to a design tsunami event may sufficiently reduce the bearing capacity of the structure to induce failure (using the scoured failure envelopes). Additionally, the scoured failure envelopes can be used to assess the postdisaster state of the structure. It is possible that the tsunami-induced scour is not sufficient to lead to failure, but the new values of and the contracted failure surface may suggest that the breakwater can no longer safely carry its design loads.
Conclusions
Employing a combined experimental-numerical methodology, this paper has developed failure envelopes that account for tsunami-induced scour. The scour geometry was obtained from model testing, using a recently developed MTG, and subsequently used to numerically analyze the effect of scour on the combined bearing capacity of the foundation. Parametric FE analyses were conducted to derive dimensionless failure envelopes in function of scour depth. A design example was presented, applying the developed scoured failure envelopes to assess the safety of breakwaters subjected to tsunami loading. The key conclusions of the study are summarized next.
For the experiments described herein, the scoured failure envelopes can be completely described using coefficients , , , and and the simple expression of Eq. (19). These parameters can be correlated to the scour depth through the fitted curves of Eqs. (21)–(24). This is considered an important finding and a key contribution of the work presented herein. The reduction in combined bearing capacity of such a simple system can be captured through the derived scoured failure envelopes. In addition to the results presented here, this finding opens up the possibility to derive similar failure envelopes for a variety of systems subjected to scouring due to tsunami or extreme flood events, ranging from breakwaters to bridge piers (such as the ones previously discussed), employing the same methodology. Provided that the scour geometry can be well reproduced experimentally, it is possible to derive realistic predictions of the scoured bearing capacity of such systems.
The failure envelops exhibited nonuniform contraction with the increase of , which has knock-on effects on the design of such systems. In response to failures of breakwaters that were specifically designed to be tsunami-resistant during the 2011 Tohoku earthquake, tsunami design loads have been increased, and new tenacious breakwater designs employ very large factors of safety (Raby et al. 2015). However, the nonuniform contraction of the failure envelopes implies that simply increasing the initial factor may not necessarily lead to a proportional increase of safety. Reducing the scour potential is an obvious countermeasure, but as evidenced by failures of structures designed to be scour-resistant (Mori and Takahashi 2014), it is not justifiable to assume that scour can be fully mitigated. Therefore, the effect of (even small amounts of) scour on the performance of such structures needs to be critically assessed, something that is facilitated by the developed methodology.
A key limitation of the study is the assumed simplified geometry, in combination with the derivation of the scour-hole geometry under testing. Due to testing, the initial factor of safety against vertical loading was very high in the experiments, allowing for large scour features to develop. A real breakwater is typically founded on an armor layer and would be more resistant to scour. However, it was shown that even a relatively small amount of scour can have a major effect on foundation bearing capacity. The presence of an armor layer may reduce the amount of scour, but the initial is much lower in reality. Due to the low stress level (increased ), the initial was roughly 14 in the experiments, allowing for up to 80% reduction of bearing capacity before reaching failure, corresponding to . For a real structure, the initial would likely be of the order of 3, and therefore much less scour would be required to lead to bearing capacity failure.
Notation
The following symbols are used in this paper:
- foundation breadth;
- effective breadth;
- scour hole depth;
- scour hole depth at failure;
- passing particle diameter;
- , ,
- Young’s modulus, shear modulus, Poisson’s ratio;
- freeboard = height difference between initial water level and top of breakwater;
- gravitational acceleration;
- relative density of soil;
- inclination factor;
- , ,
- normalized moment and horizontal and vertical force (unscoured);
- , ,
- normalized moment and horizontal and vertical force (scoured);
- bearing capacity factor;
- wave height above initial water level;
- ultimate bearing pressure;
- , , ,
- deviator stress, mean effective stress, radial stress, and axial strain in triaxial tests;
- shape factor;
- , ,
- surface fitting parameters in , , and combined space (unscoured);
- , ,
- surface fitting parameters in , , and combined space (scoured);
- , ,
- displacement in , , and rotation about axis (rads);
- vertical force, horizontal force, and moment (nonrotated);
- , ,
- vertical force, horizontal force, and moment at foundation failure (nonrotated);
- ultimate vertical bearing capacity (unscoured);
- ultimate vertical bearing capacity (scoured);
- , ,
- world reference frame, horizontal, vertical, and out-of-plane directions;
- , ,
- unit weight of soil, water, concrete;
- buoyant unit weight;
- ,
- shear strain, plastic shear strain;
- ,
- strain, plastic shear strain;
- , ,
- friction angle, peak friction angle, constant volume friction angle; and
- , ,
- dilation angle, peak dilation angle, residual dilation angle.
Data Availability Statement
Some or all data, models, or code that support the findings of this study are available from the corresponding author upon reasonable request.
Acknowledgments
The authors would like to gratefully acknowlege the hard work and enthusiasm of our technicians, including in particular, Andreas Kieper, Ernst Bleiker, and Ralf Herzog, without whom this work would have been impossible. Additional thanks go to our esteemed collegue Dr. Andrea Ciancimino, whose pioneering work paved the way for this study.
References
Agalianos, A., O. de Caudron De Coquereaumont, and I. Anastasopoulos. 2020. “Rigid slab foundation subjected to strike–slip faulting: Mechanisms and insights.” Géotechnique 70 (4): 354–373. https://doi.org/10.1680/jgeot.18.P.280.
Agalianos, A., E. Korre, T. Abdoun, and I. Anastasopoulos. 2021. “Surface foundation subjected to strike-slip faulting on dense sand: Centrifuge testing versus numerical analysis.” Géotechnique 73 (2): 165–182. https://doi.org/10.1680/jgeot.21.00083.
Arikawa, T., M. Sato, K. Shimosako, I. Hasegawa, G. S. Yeom, and T. Tomita. 2012. “Failure mechanism of Kamaishi breakwaters due to the Great East Japan earthquake tsunami.” Coastal Eng. Proc. 1 (33): 16. https://doi.org/10.9753/icce.v33.structures.16.
ASCE. 2017. Minimum design loads and associated criteria for buildings and other structures. ASCE 7-16. Reston, VA: ASCE.
Bienen, B., B. W. Byrne, G. T. Houlsby, and M. J. Cassidy. 2006. “Investigating six-degree-of-freedom loading of shallow foundation on sand.” Géotechnique 56 (6): 367–379. https://doi.org/10.1680/geot.2006.56.6.367.
Bolton, M. D. 1986. “The strength and dilatancy of sands.” Géotechnique 36 (1): 65–78. https://doi.org/10.1680/geot.1986.36.1.65.
Bricker, J. D., M. Francis, and A. Nakayama. 2012. “Scour depths near coastal structures due to the 2011 Tohoku tsunami.” J. Hydraul. Res. 50 (6): 637–641. https://doi.org/10.1080/00221686.2012.721015.
Butterfield, R., and G. Gottardi. 1994. “A complete three-dimensional failure envelope for shallow footings on sand.” Géotechnique 44 (1): 181–184. https://doi.org/10.1680/geot.1994.44.1.181.
Butterfield, R., and G. Gottardi. 1996. “Simplified failure-load envelopes for shallow foundation on dense sand.” Int. J. Offshore Polar Eng. 6 (1): 62–67.
Cerato, A. B., and A. J. Lutenegger. 2007. “Scale effects of shallow foundation bearing capacity on granular material.” J. Geotech. Geoenviron. Eng. 133 (10): 1192–1202. https://doi.org/10.1061/(ASCE)1090-0241(2007)133:10(1192).
Chen, J., C. Jiang, W. Yang, and G. Xiao. 2016. “Laboratory study on protection of tsunami-induced scour by offshore breakwaters.” Nat. Hazard. 81 (2): 1229–1247. https://doi.org/10.1007/s11069-015-2131-x.
Chen, W.-F. 1975. Limit analysis and soil plasticity: Developments in geotechnical engineering 7. Amsterdam, Netherlands: Elsevier Scientific.
Chen, W.-F., and W. O. McCarron. 1991. “Bearing capacity of shallow foundations.” In Foundation engineering handbook, 144–165. London: Chapman & Hall.
Ciancimino, A., L. Jones, L. Sakellariadis, I. Anastasopoulos, and S. Foti. 2021. “Experimental assessment of the performance of a bridge pier subjected to flood-induced foundation scour.” Géotechnique 72 (11): 998–1015. https://doi.org/10.1680/jgeot.20.P.230.
De Beer, E. E. 1965. “Bearing capacity and settlement of shallow foundation on sand.” In Proc., of Symp. held at Duke University, 15–34. Durham, NC: Duke Univ.
Esteban, M., N. D. Thao, H. Takagi, and T. Shibayama. 2008. “Analysis of rubble mound foundation failure of a caisson breakwater subjected to tsunami attack.” In Proc., 18th Int. Offshore and Polar Engineering Conf. Mountain View, CA: International Society of Offshore and Polar Engineers.
Federico, F., G. Silvagni, and F. Volpi. 2003. “Scour vulnerability of river bridge piers.” J. Geotech. Geoenviron. Eng. 129 (10): 890–899. https://doi.org/10.1061/(ASCE)1090-0241(2003)129:10(890).
Georgiadis, M., and A. P. Michalopoulos. 1985. “Bearing capacity of gravity bases on layered soil.” J. Geotech. Eng. 111 (6): 712–729. https://doi.org/10.1061/(ASCE)0733-9410(1985)111:6(712).
Goda, Y. 1975. “New wave pressure formulae for composite breakwaters.” In Coastal engineering 1974, 1702–1720. Reston, VA: ASCE.
Gōěda, Y. 2010. Vol. 33 of Random seas and design of maritime structures: Advanced series on ocean engineering. 3rd ed. Hackensack, NJ: World Scientific.
Gottardi, G., G. T. Houlsby, and R. Butterfield. 2015. “Plastic response of circular footings on sand under general planar loading.” Géotechnique 49 (4): 453–469. https://doi.org/10.1680/geot.1999.49.4.453.
Hazarika, H., K. Nishimura, and B. Chaudhary. 2015. “Model testing on resilient solution for breakwater protection against tsunami.” Jpn. Geotech. Soc. Spec. Publ. 3 (2): 40–44. https://doi.org/10.3208/jgssp.v03.j05.
Hettler, A., and G. Gudehus. 1988. “Influence of the foundation width on the bearing capacity factor.” Soils Found. 28 (4): 81–92. https://doi.org/10.3208/sandf1972.28.4_81.
Jayaratne, R., A. Abimola, T. Mikami, S. Matsuba, M. Esteban, and T. Shibayama. 2014. “Predictive model for scour depth of coastal structure failures due to tsunamis.” Coastal Eng. Proc. 1 (34): 56. https://doi.org/10.9753/icce.v34.structures.56.
Jones, L., and I. Anastasopoulos. 2022. “Breakwater Subjected to tsunami impact: Physical modelling of geotechnical phenomena.” Soil Dyn. Earthquake Eng. 159 (Aug): 107344. https://doi.org/10.1016/j.soildyn.2022.107344.
Kariyawasam, K. D., C. R. Middleton, G. Madabhushi, S. K. Haigh, and J. P. Talbot. 2020. “Assessment of bridge natural frequency as an indicator of scour using centrifuge modeling.” J. Civ. Struct. Health Monit. 10 (5): 861–881. https://doi.org/10.1007/s13349-020-00420-5.
Kato, F., Y. Suwa, K. Watanabe, and S. Hatogai. 2012. “Mechanisms of coastal dike failure induced by the Great East Japan Earthquake tsunami.” Coastal Eng. Proc. 1 (33): 40. https://doi.org/10.9753/icce.v33.structures.40.
Kimura, T., O. Kusakabe, and K. Saitoh. 1985. “Geotechnical model tests of bearing capacity problems in a centrifuge.” Géotechnique 35 (1): 33–45. https://doi.org/10.1680/geot.1985.35.1.33.
Kutter, B. L., A. Abghari, and J. A. Cheney. 1988. “Strength parameters for bearing capacity of sand.” J. Geotech. Eng. 114 (4): 491–498. https://doi.org/10.1061/(ASCE)0733-9410(1988)114:4(491).
Lin, C., J. Han, C. Bennett, and R. L. Parsons. 2014. “Case history analysis of bridge failures due to scour.” In Proc., Int. Symp. of Climatic Effects on Pavement and Geotechnical Infrastructure 2013, 204–216. Reston, VA: ASCE.
McGovern, D. J., D. Todd, T. Rossetto, R. J. Whitehouse, J. Monaghan, and E. Gomes. 2019. “Experimental observations of tsunami induced scour at onshore structures.” Coastal Eng. 152 (Oct): 103505. https://doi.org/10.1016/j.coastaleng.2019.103505.
Mori, N., and T. Takahashi. 2014. “Nationwide post event survey and analysis of the 2011 Tohoku earthquake tsunami.” Coastal Eng. J. 54 (1): 1250001. https://doi.org/10.1142/S0578563412500015.
OCDI (Overseas Coastal Area Development Institute of Japan). 2020. Technical standards and commentaries for port and harbour facilities in Japan Part III: Facilities. Edited by Ministry of Land and Infrastucture. Tokyo: Overseas Coastal Area Development Institute of Japan.
Raby, A., J. Macabuag, A. Pomonis, S. Wilkinson, and T. Rossetto. 2015. “Implications of the 2011 Great East Japan Tsunami on sea defence design.” Int. J. Disaster Risk Reduct. 14 (Dec): 332–346. https://doi.org/10.1016/j.ijdrr.2015.08.009.
Sakellariadis, L., E. Bleiker, M. Iten, H. Buschor, A. Kieper, R. Herzog, A. Marin, O. Adamidis, and I. Anastasopoulos. 2022. “Testing pile foundations at the ETH Zurich drum centrifuge: Recent developments.” Int. J. Phys. Modell. Geotech. https://doi.org/10.1680/jphmg.21.00067.
Sassa, S., H. Takahashi, Y. Morikawa, and D. Takano. 2015. ‘Tsunami overflow-seepage-coupled centrifuge experiment for the mound scour.” In Proc., 7th Int. Conf. on Scour and Erosion, Scour and Erosion ICSE 2014, 651–656. Boca Raton, FL: CRC Press.
SIMULIA. 2021. ABAQUS user’s manual v 2021. Providence, RI: Dassault Systems.
Suryasentana, S. K., H. P. Dunne, C. M. Martin, H. J. Burd, B. W. Byrne, and A. Shonberg. 2020. “Assessment of numerical procedures for determining shallow foundation failure envelopes.” Géotechnique 70 (1): 60–70. https://doi.org/10.1680/jgeot.18.P.055.
Takahashi, H., S. Sassa, Y. Morikawa, D. Takano, and K. Maruyama. 2014. “Stability of caisson-type breakwater foundation under tsunami-induced seepage.” Soils Found. 54 (4): 789–805. https://doi.org/10.1016/j.sandf.2014.07.002.
Taylor, R. N. 2019. “Centrifuges in modelling: Principles and scale effects.” In Geotechnical centrifuge technology, edited by R. N. Taylor, 1st ed., 19–33. London: Taylor and Francis.
Ueda, K., S. Iai, and T. Tobita. 2016. “Centrifuge model tests and large deformation analyses of a breakwater subject to combined effects of tsunami.” Soil Dyn. Earthquake Eng. 91 (Dec): 294–303. https://doi.org/10.1016/j.soildyn.2016.09.009.
Vardoulakis, I., and B. Graf. 1985. “Calibration of constitutive models for granular materials using data from biaxial experiments.” Géotechnique 35 (3): 299–317. https://doi.org/10.1680/geot.1985.35.3.299.
Information & Authors
Information
Published In

Journal of Geotechnical and Geoenvironmental Engineering
Volume 149 • Issue 6 • June 2023
Copyright
This work is made available under the terms of the Creative Commons Attribution 4.0 International license, https://creativecommons.org/licenses/by/4.0/.
History
Received: Jun 28, 2022
Accepted: Jan 3, 2023
Published online: Mar 25, 2023
Published in print: Jun 1, 2023
Discussion open until: Aug 25, 2023
Authors
Metrics & Citations
Metrics
Citations
Download citation
If you have the appropriate software installed, you can download article citation data to the citation manager of your choice. Simply select your manager software from the list below and click Download.