Defect Change Detection in Masonry Structures Using Image-Based 3D Photogrammetry
Publication: Journal of Architectural Engineering
Volume 29, Issue 3
Abstract
Masonry structures are deteriorating due to environmental and man-made factors, which cause damages such as cracks in the structures. Periodic inspection is required to determine if cracks have changed in appearance over time. In this paper, an image-based system is proposed to detect changes in cracks on the surface of a masonry structure. The system can detect changes in images taken from different viewpoints. In the proposed method, an image-based 3D modeling technique is applied to rectify images taken from different viewpoints via an image synthesis technique. The system deploys a drone to collect images to create a realistic 3D surface model and camera calibration to obtain a reference model. Queried images around the damaged regions are taken at a later time, in which a 3D model from this region is reconstructed and registered onto the reference 3D model. The queried and reference images are synthesized via a 3D model and compared by a threshold-based algorithm to detect changes between the images. Different methods of image synthesis were compared to find the most accurate change masks. It was shown that the proposed system can rectify and detect changes in images accurately, even though images are from different viewpoints and a complex surface.
Introduction
Visual inspection is a common technique to examine and assess the current state of structures. However, this technique is cumbersome and time-consuming as it typically involves inspectors traveling to interested sites to evaluate the structures’ conditions based on their visual appearance. Hence, this procedure cannot be conducted frequently due to problems, including high labor costs, proneness to human error, and site inaccessibility. Failure to detect structural damages can lead to disastrous effects, especially in historic buildings, as they may collapse if many of the existing damages are not identified. In Thailand, many masonry structures have visible damages, such as cracks on the surface, vegetation, and masonry degradation. These structures require frequent monitoring and inspection to assess structural integrity and determine if they need repair. Some structures with severe damages may require close monitoring, as changes in these damages may have a significant impact on the structures. Fig. 1 shows example pictures of cracks on masonry structures in Thailand. These structures have been deteriorating due to aging from environmental factors and human-made effects, such as vibration from nearby traffic. As can be seen from the figures, the large opening cracks require close monitoring to ensure that the structures are stable and healthy. In general, noncontact sensing techniques are preferred methods for monitoring historical structures, since invasive techniques may damage the structures. Therefore, in this work, a noncontact image-based method with a drone is proposed to monitor changes in historic structures. An image-based change detection system requires accurate geometrical correction techniques to remove noise from images that are not real changes (Radke et al. 2005). In many previous change detection systems, a camera is typically fixed at one location to monitor changes on a structural surface to avoid errors from different image viewpoints. However, using many cameras as sensors may not be practical to monitor all damages around structures. In this project, the proposed system applies an image-based 3D photogrammetry technique to remove geometrical errors from images so that temporal images from different viewpoints can be compared. The proposed system uses a drone to acquire several images, which are used to create a realistic reference 3D model of a historic structure. Then, many queried images taken at a later time will be registered by the photogrammetry technique. The registration process includes the registration between temporal 3D models as well as 2D image registration. Then, both reference and queried images are synthesized by their 3D models using selected camera parameters, whereby the reference images are synthesized from the reference 3D surface, and the queried images are synthesized from the queried 3D model. Both synthesized images are compared by a threshold-based algorithm to find changes between them. As will be seen later in this paper, the proposed work can detect cracks in masonry structures with a high accuracy.
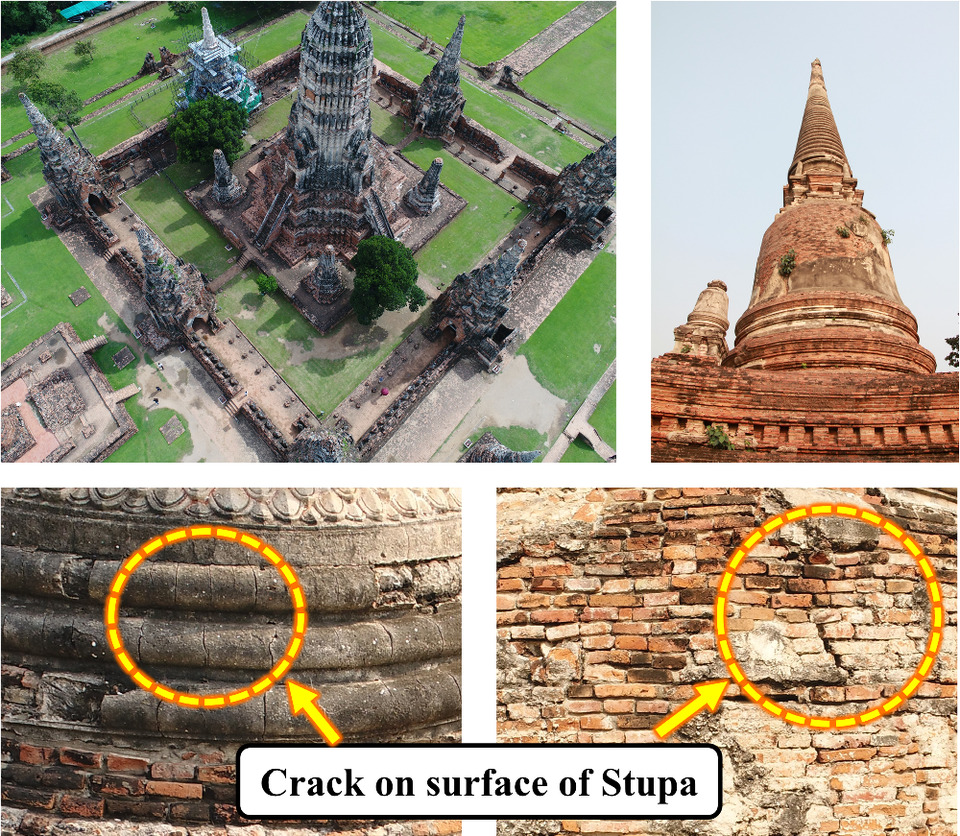
Fig. 1. Example images showing cracks on the surface of stupas. These cracks are visible in many locations around Wat Chai Wattanaram and Wat Yai Chaimongkol, two temples located in the historical province of Ayutthaya, Thailand.
(Images by Apichat Buatik.)
The main contribution of this paper is a novel damage change detection method that can cope with multiple image viewpoints. The method is demonstrated with a high accuracy using image-based 3D modeling and image synthesis techniques. The system proves its suitability as a noncontact sensor for detecting and monitoring damage on masonry structures, which is preferred as a noninvasive technique.
Related Work
Image-Based 3D Inspection
Three-dimensional digital technologies, such as 3D laser scanners, have been used in the conservation of historical sites. The techniques are commonly applied in surveying, archiving, and damage inspection, as they can offer many advantages, including speed, efficiency, cost-effectiveness, and accuracy. For inspection and damage assessment, Armesto-González applied a terrestrial laser scanner (TLS) in a masonry bridge to estimate the bridge deformation based on arch symmetry (Armesto-González et al. 2010). Fregonese also used a TLS to monitor the out-of-plane displacement of an ancient building by registering two sets of laser scan data to several georeference control points, and then monitoring the difference in displacements (Fregonese et al. 2013). Pieraccini measured the tilt angle of the “Torre del Mangia” (Mangia’s tower) in Siena (Italy) using the 3D information from a TLS (Pieraccini et al. 2014). Costanzo presented a methodology that combined a TLS and infrared thermal imaging for the inspection of the St. Augustine Monumental Compound in Calabria (South Italy) (Costanzo et al. 2015). Kouimtzoglou applied image data from a DSLR camera to create an architectural plan to restore the Plaka Bridge, an ancient heritage site in Greece (Kouimtzoglou et al. 2017).
Digital images are beneficial in providing information about the current state of structural systems during visual inspections. However, obtaining images in inaccessible areas where abnormalities are usually present can be challenging. This problem may be overcome by using unmanned aerial vehicles (UAVs) as imaging acquisition tools. Achille applied an image-based photogrammetry technique and used a drone to survey a masonry structure in Santa Barbara, Mantua (Italy) (Achille et al. 2015). Bhadrakom used a 3D model created from the photogrammetry technique to estimate the tilt angle of Wat Yai Chai Monkol in Ayutthaya, Thailand, where the images were obtained using a drone. It can be seen that UAVs have been applied in the inspection work of historical sites to aid with the data collection process, which can be cumbersome (Bhadrakom and Krisada 2016). Liu proposed an advanced image-based crack assessment methodology for bridge piers using UAVs and 3D scene reconstruction. Their research on the digital image processing (DIP) method for crack detection and projection has proven useful in plotting crack segments from individual images onto a meshed 3D surface model, thereby correcting both the perspective and geometric distortion of uneven structural surfaces (Liu et al. 2020).
Image-Based Crack Detection
For inspections, photographs can be used as a means to record defects from inspection sessions. Photos provide valuable information, such as texture, color, and 3D cues about the surface of assessed structures. For example, water ingress can cause changes in the color of masonry surfaces. The light detection and ranging (LiDAR) system cannot provide realistic texture information since its color spectrum is limited, unlike photographs (Omer et al. 2019). Therefore, pictures are useful tools in detecting changes in structural components. For crack detection, Miyamoto computed the difference in intensity between each pixel and the average intensity of each row in an image matrix (Miyamoto et al. 2007). A pixel that differs considerably from the average intensity is deemed to belong to a crack region on a concrete structure. Fujita applied a line filter using the Hessian matrix, and a threshold was applied to extract the crack regions on a concrete surface (Fujita et al. 2006). Zhu proposed an algorithm for detecting concrete columns based on texture using artificial neural networks (Zhu et al. 2010). Liu applied a support vector machine classifier to classify if crack features appear in an image patch, which was preprocessed to extract potential crack features based on intensity (Liu et al. 2002). Abdel-Qader applied a principal component analysis (PCA) algorithm, which was used to reduce the dimensions of feature vectors based on eigenvalues, to extract cracks from concrete bridge decks (Abdel-Qader et al. 2006). The images were first preprocessed by line filters in three directions: vertical, horizontal, and oblique, and they were further processed by the PCA algorithm, which was classified by a K-nearest neighbor algorithm. Mukherjee proposed a technique called tubularity flow field (TuFF), which was an effective method to segment filamentous structures in digital images to identify the location of the crack (Mukherjee et al. 2015). This technique performed segmentation via propagation of an active geometric contour, which was implemented using level sets. Dung proposed a crack detection method based on fully convolutional networks (FCN) for semantic segmentation on a public concrete crack dataset of 40,000 images (227 × 227). Here, the feature extraction layer uses three different pretrained network architectures (VGG16, InceptionV3, and ResNet). The training results indicate that VGG16 offered the best performance (Dung 2019). These are examples of previous attempts to detect damages in the structural system.
Image-Based Change Detection
Change detection is a technique used to detect anomalies such as cracks on the surface of structures. A change detection system typically consists of preprocessing steps, including geometrical and photometric adjustments, and a change detection step. The preprocessing steps remove unwanted noise, which is not a real change, from images before the change detection step is applied. Sohn proposed a system for monitoring changes in cracks from multitemporal images based on a 2D projective transformation that accurately extracts the size of cracks, which are then monitored in the images as they propagate (Sohn et al. 2005). Delaunoy applied a structure from motion (SfM) system to synthesize new views to compute geometric adjustment for change detection in a coral reef (Delaunoy et al. 2008), concluding that SfM systems can provide an accurate method for synthesizing new views for change detection. Guo proposed that the change detection process was the main component in image interpretation for pipe inspection to monitor crack changes (Guo et al. 2009). Chen proposed a framework for concrete surface crack monitoring and quantification based on optical flow that tracks the movement of cracks (Chen et al. 2008). Regions where cracks become larger are labeled as having changed. Chaiyasarn proposed a system for multiview change detection using images to detect crack changes on a concrete beam with the use of SfM for geometrical adjustment (Chaiyasarn 2014). Saur presented a change detection system using images obtained from a UAV to detect changes between image pairs from video frames (Saur and Krüger 2016). Chen proposed a transformer-based network for change detection by combining the strengths of convolutions and transformers, which can effectively model context information. This approach provides an attention-based tool to expand the model’s receptive field, thereby enhancing its ability to represent change detection features efficiently (Chen et al. 2021). It can be seen that preprocessing steps are essential for change detection systems, which this project aims to tackle.
Methodology
In this paper, a novel damage change detection method is proposed, as shown in Fig. 2. The system starts with an image acquisition step in which a set of images is collected periodically. Let the first set of images, S0, taken at time t0, be the images of monitoring areas. Here, S0 is called a reference set, and the subsequent sets, S1, …, Sn, taken at times t1, …, tn, are queried images. The images from S0 were used to create a referenced 3D model via the image-based 3D modeling module. The images from S1, …, Sn are registered onto the reference 3D model via the camera registration module. In the image synthesis step, a 3D model is rendered using camera parameters from a queried image, Iq, from the sets Sn, to create a synthesized image, Is. This process is called geometrical adjustment, which is an essential part of the preprocessing process in change detection to remove noise due to the effect of different camera viewpoints. In the change detection module, a change mask is created from Is and Iq to see if there are changes between the two images.
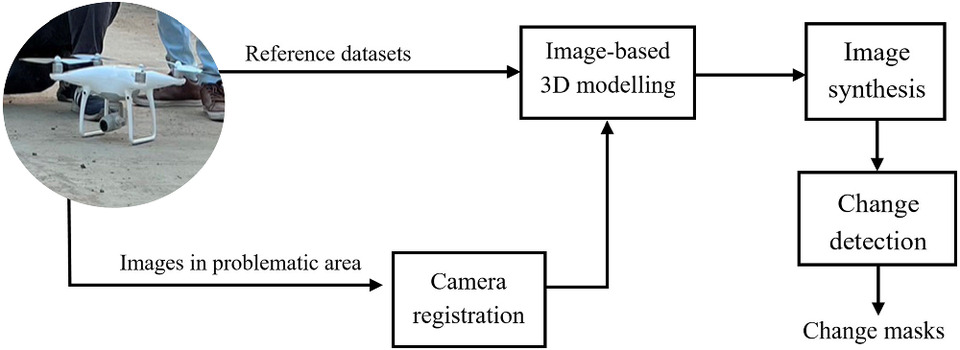
Fig. 2. Outline of the proposed system.
(Images by Apichat Buatik.)
Image Acquisition
First, images are collected to create a reference set, S0, for creating a 3D model. Images were collected by a drone using the point of interest (POI) flight strategy to ensure full coverage of a stupa and to obtain a highly detailed 3D model. Fig. 3(a) shows the POI strategy, in which the drone flew around an object of interest in a circular motion. The flight strategy can be preprogrammed by specifying the radius and height of the object of interest. The UAV’s camera was programmed to fixate its viewing angle on the stupa. The UAV was programmed to collect images every 2–3 s as it moved around the stupa, and images were collected from three different heights, i.e., high, mid, and ground levels. The ground level was collected manually, as the POI could not be applied since it was too low, and the drone might hit an obstruction at ground level. Example images obtained from the UAV are shown in Fig. 3(b). In this work, the UAV flight path was preprogrammed in an iOS application, and a DJI Phantom 4 Pro was used (Hisyam 2005). The GPS data of each image were also recorded to improve the accuracy of the estimation of image positions and a reconstructed 3D model.
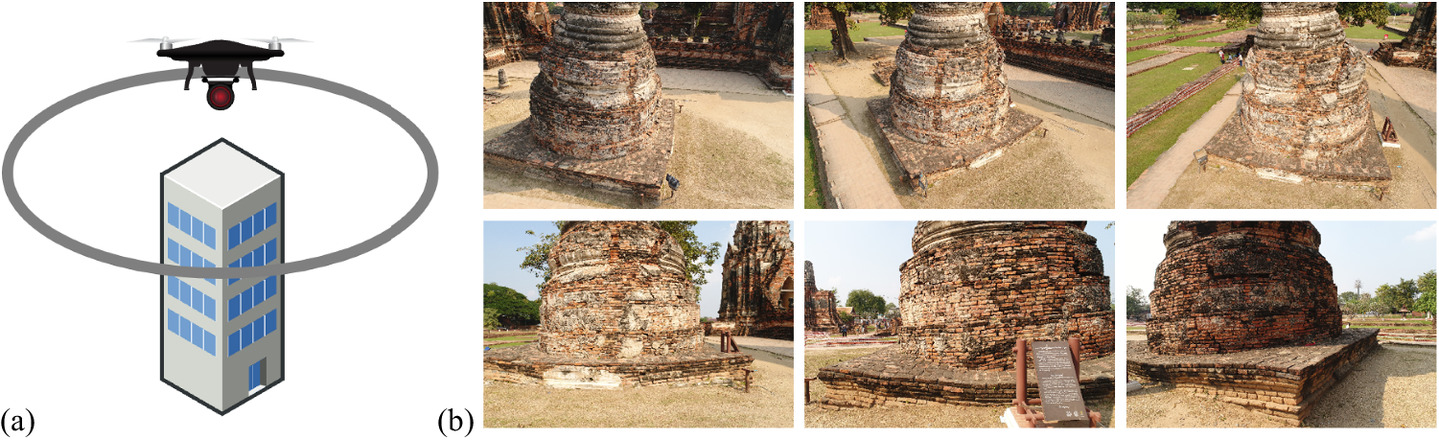
Fig. 3. (a) Point of interest flight path for a UAV to collect images around a stupa; and (b) example images of a stupa from Wat Chai Wattanaram.
(Images by Apichat Buatik.)
Image-Based 3D Modeling
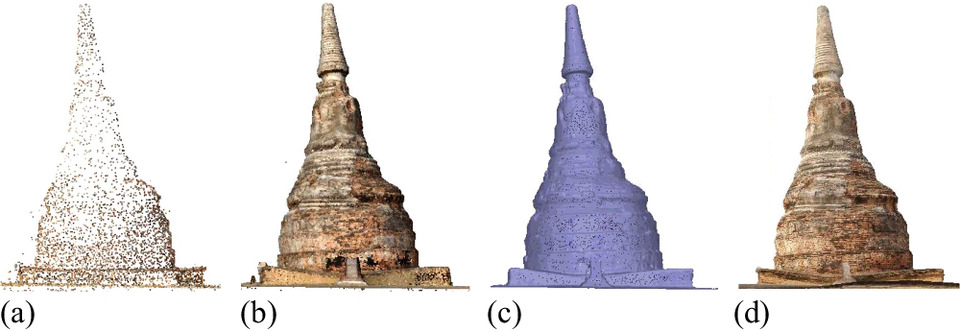
The images from the reference set, S0, are used to create a 3D model of the stupa of Wat Chai Wattanaram using the Agisoft Photoscan software package (Agisoft 2022), which is based on structure from motion (Snavely et al. 2006). Fig. 4(a) shows a sparse point cloud model of the stupa, and Fig. 4(b) shows a dense point cloud model with the positions of all images. As shown in Fig. 4(b), each camera also has latitude and longitude information, which helps when creating the 3D model. To obtain a watertight model, a mesh is created to provide a more realistic 3D model, as shown in Fig. 4(c). The mesh is composed of a collection of triangular meshes, in which texture from 2D images is projected. The realistic textured model is shown in Fig. 4(d).
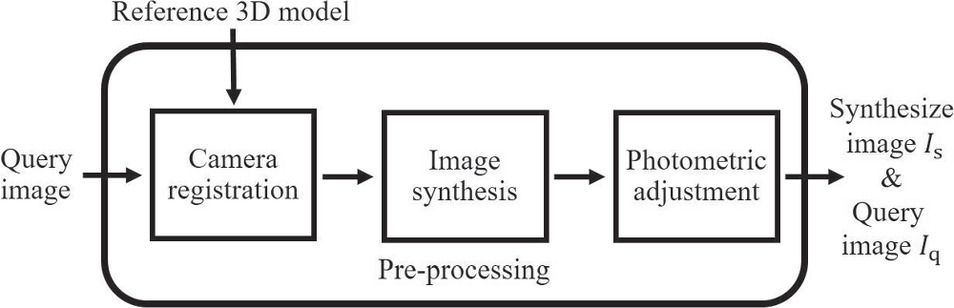
Preprocessing Module
The reference images from S0 and queried images from S1, …, Sn are preprocessed before the change detection module is applied. Fig. 5 summarizes the preprocessing steps applied in the proposed system. For camera registration, the queried images from S1, …, Sn are registered onto the model in S0. For image synthesis, a textured 3D model and camera parameters are used to synthesize images from the interested area. For photometric adjustment, a histogram matching algorithm is applied. These steps are described in detail below.
Camera Registration
The interested region was identified manually from the reference set S0. In this project, the interested area was where cracks appeared. Once the region was identified, we used the latitude and longitude of images from this region from S0 to program a drone to collect more images from this region, which became the queried images S1, …, Sn. The new set of images from S1, …, Sn were registered onto S0 by matching the similarity between images and by using GPS information via the Agisoft program. The 3D model was then reoptimized to update the camera parameters. As exemplified in Fig. 6, images from S2 were registered onto S0. The registration of new images used the structure from motion technique.
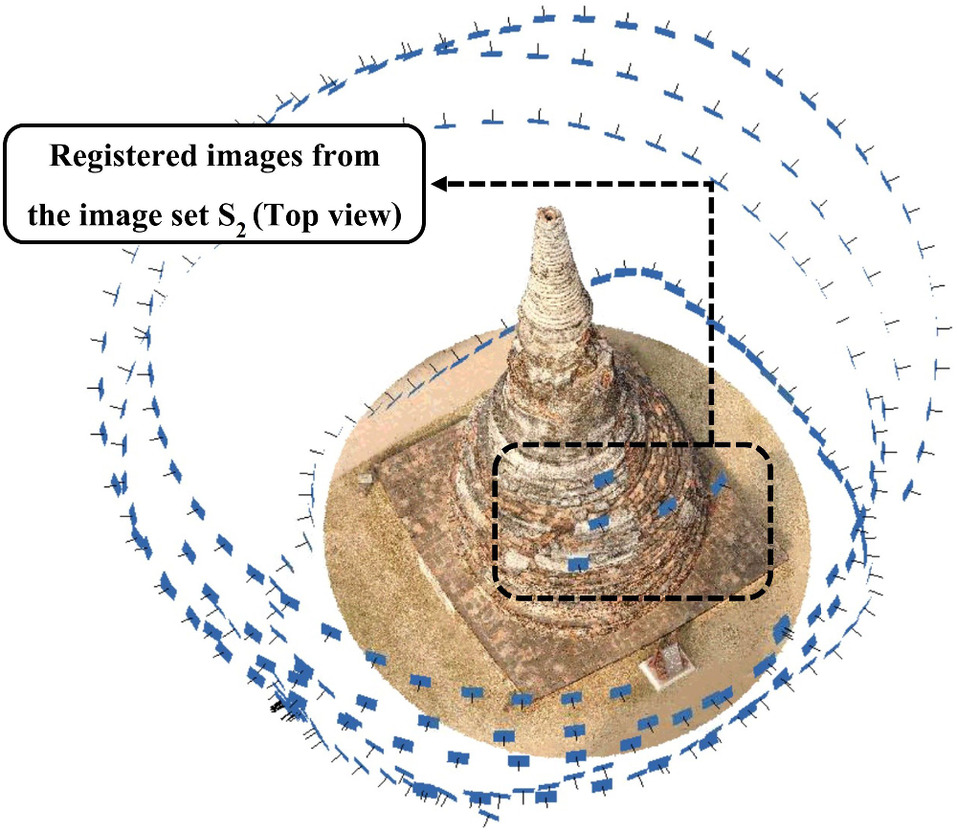
Image Synthesis
A textured 3D model and camera parameters can be used to synthesize an image through a geometrical adjustment process, which rectifies images taken from different viewpoints so that they have identical viewpoints. Image synthesis is achieved by reprojecting a textured surface onto image planes, given camera parameters. This process is shown in Eq. (1), where a synthesized image is created using a rotation matrix R, a translation vector t, a camera matrix (or a matrix of intrinsic parameters) K, and a 3D texture . A queried image Iq can either be a real image or a synthesized image from S1, …, Sn, but the reference image is always synthesized. To create synthesized queried images, we replace the texture on the reference 3D model with images from Sn and use this texture to create the synthesized images. Eq. (1) can be further represented as shown in Eq. (2).where (X, Y, Z) are the coordinates of a 3D point in the world coordinate space, (u, v) are the coordinates of the projection point in pixels, (cx, cy) is a principal point that is usually at the image center, and f is the focal length expressed in pixel units. The rotation-translation matrix is called an extrinsic matrix. It is used to describe the camera motion around a scene.
(1)
(2)
Photometric Adjustment
Reference and queried images are adjusted by the photometrical adjustment technique using the histogram matching method. Fig. 7(a) shows an example of a real queried image Iq and synthesized image Is (reference image). We also applied a mask to black out the background on Iq such that the two images are as similar as possible. Fig. 7(b) shows a queried image after applying the histogram matching technique, and the background is also masked. As shown in Figs. 7(b and c), Iq and Is appear to have identical viewpoints and similar lighting.
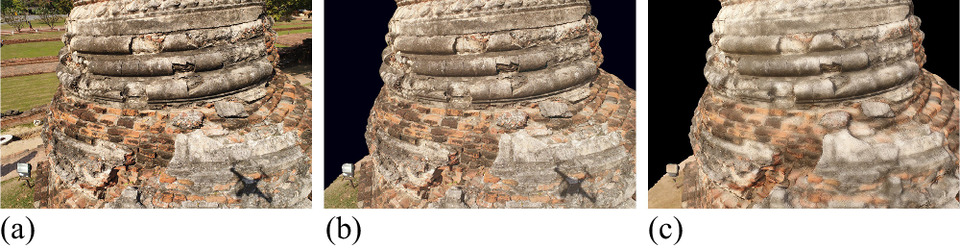
Fig. 7. (a) Original queried image Iq from S1; (b) queried image Iq after applying the photometrical adjustment process and the background mask; and (c) synthesized image Is from S0.
(Images by Apichat Buatik.)
Change Detection Module
Queried image Iq and synthesized image Is are input to a change detection module. We applied a threshold-based technique to create change masks. For the change detection process to work, queried and reference images must be as similar as possible. Therefore, we applied similarity measures to determine the similarity between images. For the change mask, we compared gray pixel intensities between images and applied a threshold to determine if the change pixels are real change. We applied the receiver operating characteristic (ROC) curve to compare the estimated change masks with manual masks (done manually).
Similarity Measure
This process measures the similarity between images when the images have been preprocessed by geometrical and photometrical adjustments. We applied two methods: (1) mean squared error (MSE) and (2) structural similarity measure (SSIM). MSE is simple to implement and an MSE of 0 indicates perfect similarity. A value higher than one implies less similarity and continues to grow as the average difference between pixel intensities increases, as shown in Eq. (3). SSIM requires more calculation than the MSE method, but it attempts to model the perceived change in the structural information of the image, whereas MSE estimates perceived errors (Wang et al. 2004, 2015; Zeng and Wang 2012). There is a subtle difference between the two methods, although we use both methods in this paper. Eq. (3) can be defined aswhere I(i, j) is a pixel value at i, j of image 1 and J(i, j) is a pixel value of image 2, m and n are the dimension of images. SSIM can be defined asIn Eq. (4), the SSIM index is calculated on various windows of an image (Wang et al. 2003). The measure between two windows, x and y, of common size N × N (this paper used an 11 × 11 window), is determined. Let x and y be two discrete nonnegative signals that have been aligned with each other (e.g., two image patches extracted from the same spatial location from two images being compared, respectively). Here, μx is the pixel sample mean of x, μy is the pixel sample mean of y, is the variance of x, is the variance of y, and σxy is the covariance of x and y. In addition, c1 = (k1L)2 and c2 = (k2L)2 are two variables used to stabilize the division with weak denominators for the dynamic range of the pixel values. By default, k1 = 0.01, k2 = 0.03, and L = 255. The SSIM values vary between 0 and 1, where 1 indicates perfect similarity.
(3)
(4)
Change Mask
To create a change mask D(k), we compared pixel values between Is and Iq by subtracting grayscale values between the two images using the following equation:where k are the coordinates of the point in pixels. Then, the change mask B(k) is generated according to the following decision rules using the following equation:where 1 is the pixel detected as a change, 0 is the pixel detected as a nonchange, and τ is a specified threshold. A low threshold value will typically cause noise or false detection, while an excessively high threshold value will cause the actual change mask to be lost. The threshold value is usually chosen empirically to produce the change mask that gives the best result. In this study, the threshold is currently chosen manually.
(5)
(6)
Receiver Operating Characteristic Curve
The change masks are binary masks in which 0 or black indicates change, and 1 or white means no change. We quantitatively evaluate the accuracy of the change masks using receiver operating characteristic (ROC) curves. This method is an addition to the evaluation method that only compares results visually (Mukherjee et al. 2015; Mukherjee and Acton 2015; Jacob and Unser 2004; Osher and Sethian 1988; Chen et al. 2008). An ROC curve is a plot between true-positive rate (TPR) and false-positive rate (FPR) computed by comparing two different change masks. In this work, we compared ground truth masks obtained by manual labeling with change masks from the proposed method. TPR and FPR are computed from the frequency of the occurrences of different outcomes when comparing a predicted mask against a ground truth mask. This comparison is a two-class prediction problem in which there are four possible outcomes: true positive (TP), false positive (FP), false negative (FN), and true negative (TN). The values of TPR and FPR can be estimated as
(7)
(8)
The definition of TP, FP, FN, and TN are:
(i)
TP is when a predicted mask correctly detects a change pixel as changed;
(ii)
FP is when a predicted mask incorrectly detects a changed pixel as unchanged;
(iii)
FN is when a predicted mask incorrectly detects an unchanged pixel as changed;
(iv)
TN when a predicted mask correctly detects an unchanged pixel as unchanged.
The area under curve (AUC) of an ROC curve close to 1 indicates the results from the proposed system is perfectly accurate.
Experiments and Results
Image-Based 3D Modeling
In our experiment, images of a reference set S0 were collected using a drone. Circular POI flight paths at heights of 30, 35, and 40 m were applied. Some images were also manually collected at ground level to ensure full coverage, as the drone could not fly too close to the ground due to obstructions. The drone was preprogrammed to take pictures every 2–3 s, ensuring that the overlap between consecutive images was at least 50%. A total of 520 images, sized 5,472 × 3,642, were collected from a stupa. For the experiment, we collected five images for the queried set S1, which were close-up views of an interested region.
The reference 3D model of the stupa consists of 6,658 points for a sparse model, 5,195,908 points for a dense model, and 10,848,033 meshes for a mesh model. Fig. 4 displays the results of our work. As demonstrated in Fig. 4, the dense and textured models offer high-quality details for 3D visualization.
For the camera registration process, we used the SfM technique (Agisoft 2022) to register images both with and without GPS. Table 1 displays the results of registration errors when GPS was applied. As seen in the table, all error values from S1 images are significant, exceeding 10 meters. Such errors are unacceptable for the proposed system. These errors can occur since our starting positions during the collection of dataset S1 were not similar to the original starting position when the S0 data were collected. In addition, registration errors may result from GPS inaccuracy. Therefore, in our experiment, GPS was not employed in the registration module. Nevertheless, using GPS information may provide better camera parameter estimation.
| Example of dataset | Picture name | Accuracy (m) | Error (pixels) |
|---|---|---|---|
| S0 | DJI_0576 | 10 | 1.519775 |
| S0 | DJI_0577 | 10 | 1.477171 |
| S1 | DJI_0646 | 10 | 27.562193 |
| S1 | DJI_0662 | 10 | 27.063962 |
| S1 | DJI_0697 | 10 | 26.596530 |
When GPS is not used, images from set Sn can be registered onto the 3D model in S0 using the SfM technique. This technique employs an image matching algorithm that automatically detects keypoints, such as scale invariant feature transform (SIFT) keypoints, and camera locations are estimated using triangulation methods (Snavely et al. 2006). Table 2 demonstrates an example of the registration errors in the 3D model from set S0 without GPS. As listed in Table 2, the errors from image S1 are small and almost equal to the errors from other images in set S0. The maximum error is slightly greater than 2, indicating high accuracy in the registration process.
| Example of dataset | Picture name | Error (pixels) |
|---|---|---|
| S0 | DJI_0576 | 1.210 |
| S0 | DJI_0577 | 1.451 |
| S0 | DJI_0578 | 1.683 |
| S0 | DJI_0579 | 1.554 |
| S1 | DJI_0697 | 2.011 |
Change Detection
In this experiment, we employed the change detection technique for queried and reference images. As changes in cracks can be slow in real datasets, we implemented an inpainting technique to simulate crack changes on the surface, which is explained in detail below. Let Ir be reference images, Iq be the queried images, and Ir and Iq can either be real or synthetic images. We conducted five cases to synthesize images to enable a comprehensive comparison in our change detection system.
(i)
Case 1: Ir is synthesized by homography, and Iq is a real image. Homography is a planar transformation, commonly used in image mosaicing (Szeliski 2010).
(ii)
Case 2: Ir is synthesized by the reference 3D model whose resolution is 4,096 texture size/count, and Iq is a real image.
(iii)
Case 3: Ir is synthesized by the reference 3D model whose resolution is 8,192 texture size/count, and Iq is a real image.
(iv)
Case 4: Ir is synthesized by the reference 3D model whose resolution is 16,384 texture size/count, and Iq is a real image.
(v)
Case 5: Ir is synthesized by the reference 3D model whose resolution is 16,384 texture size/count, and Iq is synthesized with an updated texture of the resolution 16,384 texture size/count. The texture is updated on the areas where queried images are available.
Cases 2, 3, and 4 will demonstrate how the resolution of the 3D model can impact the model’s trend, and Case 5 presents the proposed method for this study.
Change Simulation by Inpainting
Inpainting is a technique used to restore lost details in an image by adding synthesized information from surrounding pixels to fill in missing details. The area of interest is identified to indicate the area that needs to be retouched. Inpainting techniques estimate the damaged part of the image and repair it using texture synthesis techniques, which use surrounding pixels to synthesize texture in the most similar areas (Pushpalwar and Bhandari 2016; Lee et al. 2015).
Table 3, for Scenes 1 and 2, presents a summary of the similarity between the reference and queried images. The images from both scenes were taken at similar distances from the stupa. To create changes in the dataset, we applied the inpainting technique to remove some defects on the queried images, as the images from this dataset were taken on the same day, and hence there was no real change. Table 3 indicates that Case 5 has the smallest MSE, and SSIM and AUC are closest to 1 in both scenes. This means that synthesizing by Case 5 offers the best similarity between the images. For Cases 2, 3, and 4, it can be seen that the MSE decreases, and SSIM and AUC increase as the model resolution increases. This means that increasing the resolution of the texture model can improve change detection results. Case 1 gives the worst results, which means that synthesizing by homography transformation does not provide the best image similarity. Case 5 offers the best image similarity because both queried and reference images are synthesized with a greater level of detail, which makes the reference and queried images very similar.
| Scenes | Case | MSE | SSIM | AUC |
|---|---|---|---|---|
| Scene 1 (inpainting) | Case 1 | 1421.8 | 0.64 | 0.69249 |
| Case 2 | 516.66 | 0.7 | 0.68179 | |
| Case 3 | 449.44 | 0.75 | 0.70698 | |
| Case 4 | 430.97 | 0.8 | 0.73673 | |
| Case 5 | 29.71 | 0.97 | 0.99363 | |
| Scene 2 (inpainting) | Case 1 | 998.67 | 0.72 | 0.63481 |
| Case 2 | 410.81 | 0.77 | 0.65221 | |
| Case 3 | 358.79 | 0.81 | 0.65221 | |
| Case 4 | 323.46 | 0.84 | 0.62955 | |
| Case 5 | 25.28 | 0.98 | 0.98999 | |
| Scene 3 (real changes) | Case 1 | 3124.88 | 0.26 | 0.62701 |
| Case 2 | 857.16 | 0.33 | 0.83209 | |
| Case 3 | 790.24 | 0.38 | 0.83522 | |
| Case 4 | 733.93 | 0.41 | 0.85471 | |
| Case 5 | 643.19 | 0.57 | 0.89203 | |
| Scene 4 (real changes) | Case 1 | 6920.79 | 0.07 | 0.61783 |
| Case 2 | 1020.25 | 0.24 | 0.79902 | |
| Case 3 | 920.47 | 0.26 | 0.81668 | |
| Case 4 | 918.96 | 0.28 | 0.82301 | |
| Case 5 | 761.68 | 0.57 | 0.88218 |
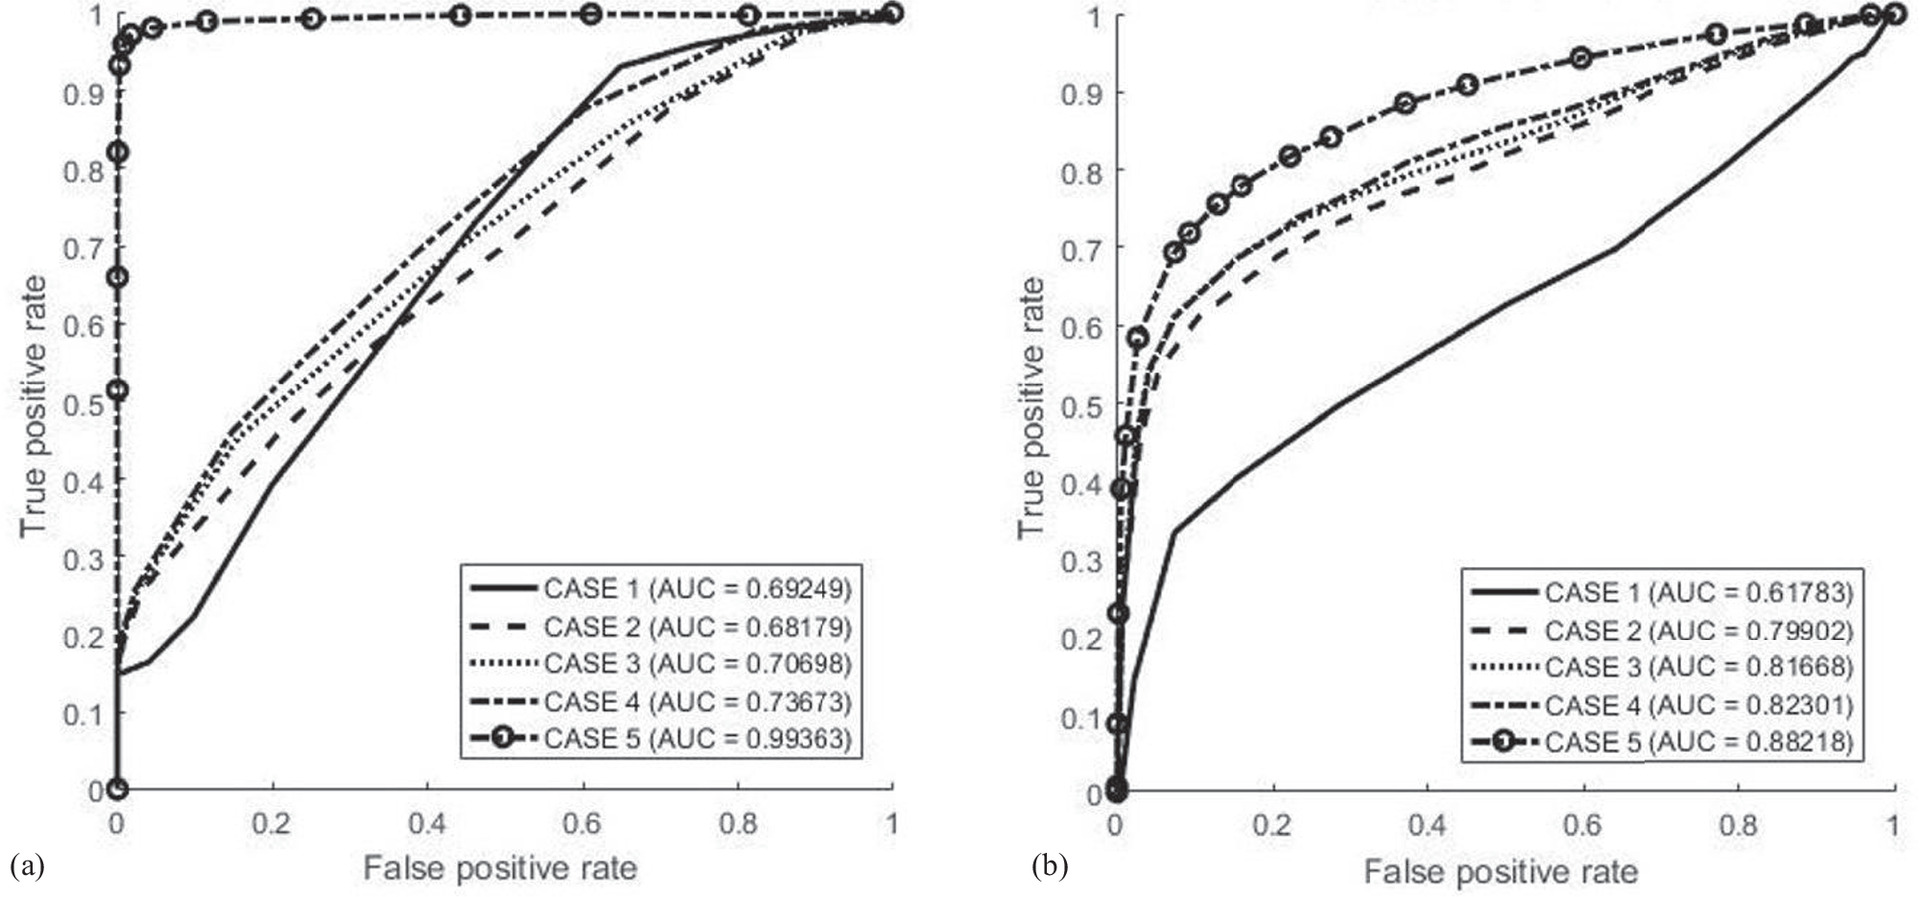
Fig. 8 shows the example results of change detection between image pairs for all cases of Scene 1 from Table 3, in which the threshold was set to 30. The changed pixels are in black, and nonchanged pixels are in white. As mentioned, we simulated the changes between image pairs using the inpainting technique. As shown in Fig. 8, column 1 is Iq, column 2 is synthesized images Ir, column 3 is change masks, and column 4 shows change masks overlaid onto Iq. Rows 1 to 5 represent the results for each case, respectively. It can be seen that Case 5 (the last row) gives the best change mask with minimum noise, which corresponds well with the results of Scenes 1 and 2 from Table 3. The results from Fig. 8, rows 2 to 4, show that change masks improve as we increase the resolution of the 3D model. Nevertheless, the results are best when we synthesize both queried and reference images. Fig. 10(a) shows the result of an ROC curve from Fig. 8. Correspondingly, Case 5 can offer an AUC that is very close to 1, which confirms our proposed method as an accurate change detection system.
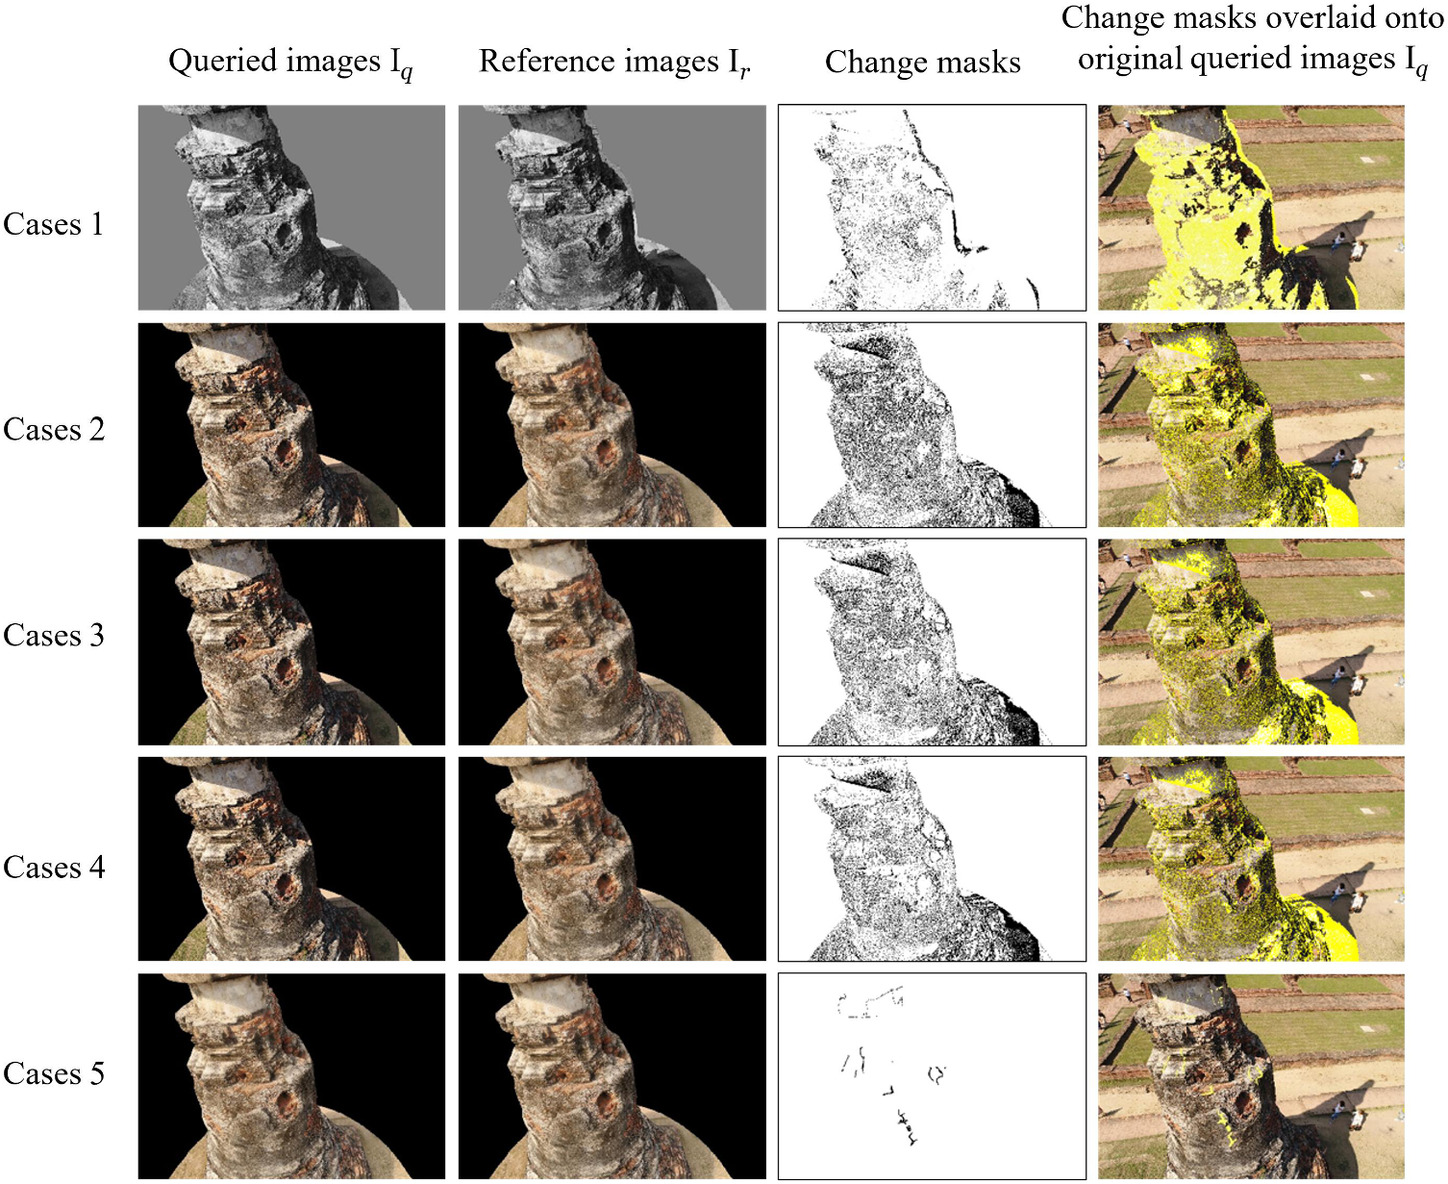
Fig. 8. Example results of change detection between image pairs in all cases for Scene 1 (referred to quantitative result from Table 3, the threshold is set at 30).
(Images by Apichat Buatik.)
Real Change Data
We collected queried images (S2) six months after collecting the first set of data, S0 (reference data), and S1 (queried data). We collected images at two distances from the region of interest, close-up and medium distances (i.e., 0.5 and 3 meters from the surface of the stupa, respectively). The images from this set (S2) contain cracks with a width of approximately 3 to 5 mm.
Table 3 presents the summary results from real changes in Scenes 3 and 4. Similar to the results from Scenes 1 and 2, it can be seen that Case 5 gives the smallest MSE and the highest values of SSIM and AUC. For these data, the proposed system does not perform as well as the previous data from Scenes 1 and 2, as all similarity values become worse. Nevertheless, it can be noticed that Case 5 gives the best change detection results, and the proposed system can be used to detect changes in historical buildings.
Fig. 9(a) is a synthesized reference image, and Fig. 9(b) is a synthesized queried image before passing onto the photometric adjustment stage. The change mask is shown in Fig. 9(c), and the change mask overlaid onto the queried image is shown in Fig. 9(d). It can be seen that our proposed algorithm can provide an accurate change mask, although some noise pixels can still be seen in the change mask. Although some noise is present in the result of the photometric adjustment process applied to a synthesized queried image, this noise can arise from smudges or scratches that are not actual damage changes, which can be solved by using an automatic damage detection. However, this is beyond the scope of this paper. Fig. 10(b) shows the result of an ROC curve from Fig. 9 and Table 3 (Scene 4), which confirms that our proposed method can provide the most accurate change mask with an AUC of approximately 0.88. The results confirm that to obtain the most accurate change mask, we should synthesize both reference and queried images.
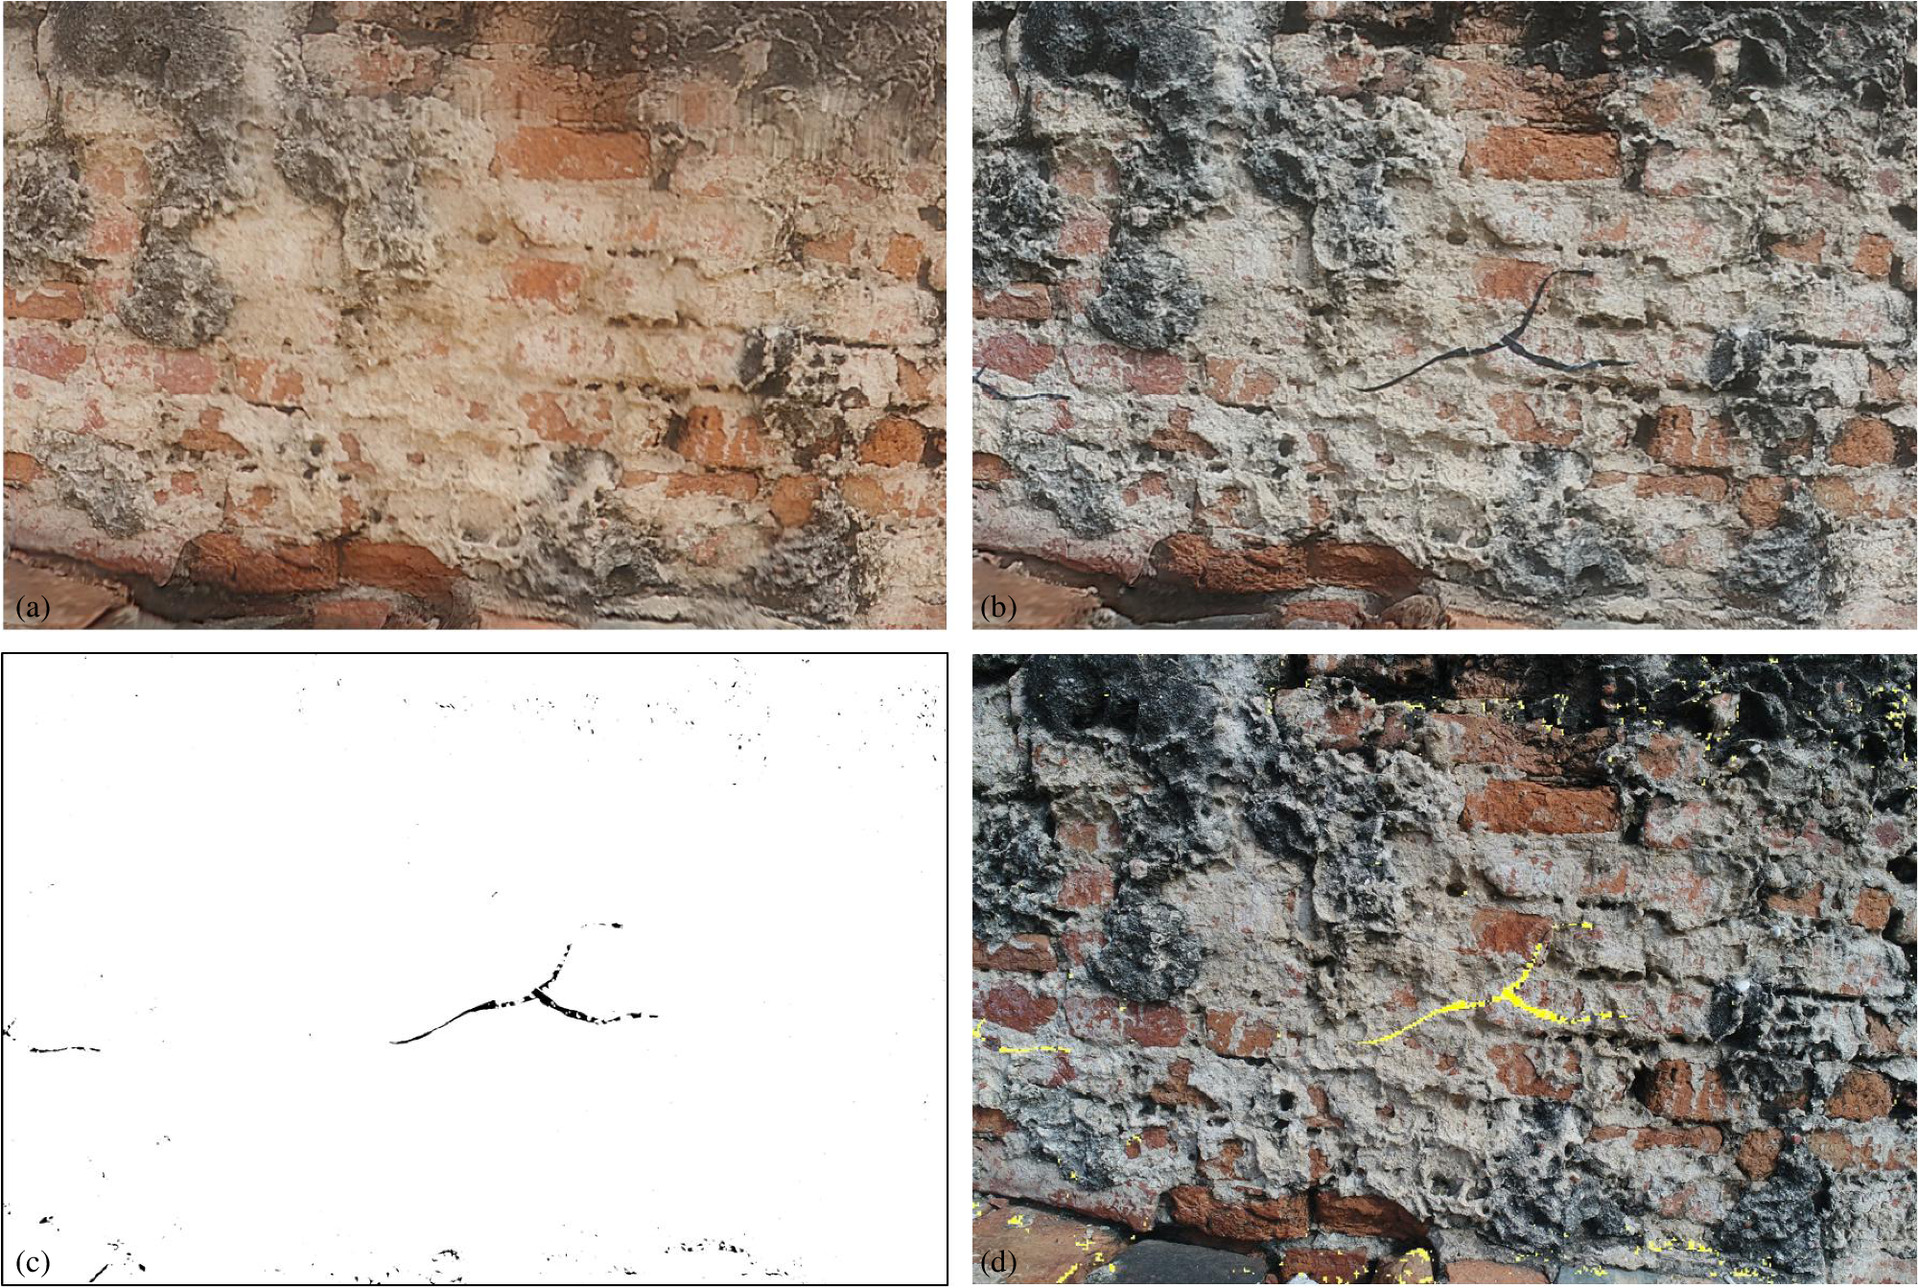
Fig. 9. Example results of change between image pairs for Case 5 in Scene 4 from Table 3, the threshold is set at 60: (a) Ir is the synthesized image from the reference 3D model S0; (b) Iq is the synthesized image from the updated surface texture; (c) a change mask between Iq and Ir; and (d) a change mask from the proposed system overlaid onto Iq to localize the locations of defects on the stupa.
(Images by Apichat Buatik.)
Discussion
We propose a novel damage change detection method that can be used to monitor problematic areas in historical buildings. Masonry structures require frequent monitoring, which must be noninvasive. The proposed method demonstrates the use of an image-based system for monitoring historic buildings as an alternative to visual inspection. It offers several advantages, including the ability to obtain data from high altitudes with the use of a drone, a 3D database of historical buildings, and automatic detection of changes or defects in structures.
The proposed system applies an image-based photogrammetry method to remove geometrical errors, enabling the detection of changes from any viewpoint. Image-based 3D models are easier to operate than laser scanning techniques, as they are more cost-effective and provide more realistic texture to the 3D models. Unlike laser scanning, photogrammetry allows later-acquired images to update existing 3D models, resulting in more detailed and realistic models. While the system can be combined with a deep-learning-based crack detection system for automatic identification of problematic areas, this is beyond the scope of the paper. The future plan is to include automatic damage detection to identify problematic areas. In addition, the system can be integrated with building information modeling (BIM) models to report change results for existing structures, which is also part of our future plan. Obtaining more accurate 3D models requires collecting more images. Nevertheless, this research project demonstrates the feasibility of using 3D model-based photogrammetry for monitoring using a drone as a sensing equipment.
Our system relies on creating more realistic 3D models. To improve our results, we require better 3D models, which can be achieved by capturing more close-up images. However, we have demonstrated that by synthesizing both reference and queried images, we can achieve highly accurate change masks from our models. In addition, the current threshold-based change detection algorithm is simple, and the threshold is currently manually selected. While the change detection module can be replaced by a learning-based technique, such a method requires a large amount of training data, and it is beyond the scope of this study.
Conclusion
A change detection system for masonry structures is presented in this study. The system can be applied with images from the drone and can work with images with multiple viewpoints. The proposed system is noninvasive, which is suitable for periodic monitoring and inspection of historic structures.
The system uses an image-based photogrammetry technique to create a realistic 3D model and synthesize images to remove geometrical errors. The accuracy of the change masks depends on the level of detail in the surface texture of the 3D model, which requires close-up images to obtain a realistic texture. Our proposed system synthesizes images from the texture of both the reference and updated 3D models, enabling accurate change masks to be created. In addition, a drone can be programmed to obtain images from areas close to previous visits using GPS information, allowing for automatic change monitoring of structures.
Data Availability Statement
Some or all data, models, or code that support the findings of this study are available from the corresponding author upon reasonable request.
Acknowledgments
This research was funded by Thammasat School of Engineering (TSE), Thammasat University. The authors would like to thank Thammasat University Research Fund for providing the scholarship and support for the research project.
References
Abdel-Qader, I., S. Pashaie-Rad, O. Abudayyeh, and S. Yehia. 2006. “PCA-based algorithm for unsupervised bridge crack detection.” Adv. Eng. Software 37 (12): 771–778. https://doi.org/10.1016/j.advengsoft.2006.06.002.
Achille, C., A. Adami, S. Chiarini, S. Cremonesi, F. Fassi, L. Fregonese, and L. Taffurelli. 2015. “UAV-based photogrammetry and integrated technologies for architectural applications—Methodological strategies for the after-quake survey of vertical structures in Mantua (Italy).” Sensors 15 (7): 15520–15539. https://doi.org/10.3390/s150715520.
Agisoft. 2022. “Agisoft metashape.” Accessed February 2, 2022. https://www.agisoft.com/.
Armesto-González, J., B. Riveiro-Rodríguez, D. González-Aguilera, and M. T. Rivas-Brea. 2010. “Terrestrial laser scanning intensity data applied to damage detection for historical buildings.” J. Archaeol. Sci. 37 (12): 3037–3047. https://doi.org/10.1016/j.jas.2010.06.031.
Bhadrakom, B., and C. Krisada. 2016. “As-built 3D modeling based on structure from motion for deformation assessment of historical buildings.” Int. J. Geomate 11 (24): 2378–2384.
Chaiyasarn, K. 2014. “Damage detection and monitoring for tunnel inspection based on computer vision.” Ph.D. thesis, Univ. of Cambridge.
Chen, H., Z. Qi, and Z. Shi. 2021. “Remote sensing image change detection with transformers.” IEEE Trans. Geosci. Remote Sens. 60: 1–14. https://doi.org/10.1109/TGRS.2021.3095166.
Chen, Z., B. Chang, and T. C. Hutchinson. 2008. “Image-based monitoring of structural damage: Concrete surface cracks.” In Vol. 6933 of Proc., Smart Sensor Phenomena, Technology, Networks, and Systems 2008, 279–290. Bellingham, WA: SPIE.
Costanzo, A., M. Minasi, G. Casula, M. Musacchio, and M. F. Buongiorno. 2015. “Combined use of terrestrial laser scanning and IR thermography applied to a historical building.” Sensors 15 (1): 194–213. https://doi.org/10.3390/s150100194.
Delaunoy, O., N. Gracias, and R. Garcia. 2008. “Towards detecting changes in underwater image sequences.” In Proc., OCEANS 2008-MTS/IEEE Kobe Techno-Ocean, 1–8. Piscataway, NJ: Institute of Electrical and Electronics Engineers (IEEE).
Dung, C. V. 2019. “Autonomous concrete crack detection using deep fully convolutional neural network.” Autom. Constr. 99: 52–58. https://doi.org/10.1016/j.autcon.2018.11.028.
Fregonese, L., G. Barbieri, L. Biolzi, M. Bocciarelli, A. Frigeri, and L. Taffurelli. 2013. “Surveying and monitoring for vulnerability assessment of an ancient building.” Sensors 13 (8): 9747–9773. https://doi.org/10.3390/s130809747.
Fujita, Y., Y. Mitani, and Y. Hamamoto. 2006. “A method for crack detection on a concrete structure.” In Vol. 3 of Proc., 18th Int. Conf. on Pattern Recognition, 901–904. Piscataway, NJ: Institute of Electrical and Electronics Engineers (IEEE).
Guo, W., L. Soibelman, and J. J. Garrett. 2009. “Automated defect detection for sewer pipeline inspection and condition assessment.” Autom. Constr. 18 (5): 587–596. https://doi.org/10.1016/j.autcon.2008.12.003.
Hisyam, D. 2005. “Perilaku organisasional aparatur dalam akselerasi pembangunan daerah.” Efisiensi 5 (1). https://doi.org/10.21831/efisiensi.v5i1.3820.
Jacob, M., and M. Unser. 2004. “Design of steerable filters for feature detection using canny-like criteria.” IEEE Trans. Pattern Anal. Mach. Intell. 26 (8): 1007–1019. https://doi.org/10.1109/TPAMI.2004.44.
Kouimtzoglou, T., E. K. Stathopoulou, and A. Georgopoulos. 2017. “Image-based 3D reconstruction data as an analysis and documentation tool for architects: The case of Plaka Bridge in Greece” Int. Arch. Photogramm. Remote Sens. Spatial Inf. Sci. 42: 391–397.
Lee, B.-G., B. Ko, S. Lee, and D. Shin. 2015. “Computational integral imaging reconstruction of a partially occluded three-dimensional object using an image inpainting technique.” J. Opt. Soc. Korea 19 (3): 248–254. https://doi.org/10.3807/JOSK.2015.19.3.248.
Liu, Y. F., X. Nie, J. S. Fan, and X. G. Liu. 2020. “Image-based crack assessment of bridge piers using unmanned aerial vehicles and three-dimensional scene reconstruction.” Comput.-Aided Civ. Infrastruct. Eng. 35 (5): 511–529. https://doi.org/10.1111/mice.v35.5.
Liu, Z., S. A. Suandi, T. Ohashi, and T. Ejima. 2002. “Tunnel crack detection and classification system based on image processing.” In Vol. 4664 of Proc., Machine Vision Applications in Industrial Inspection X, 145–152. Bellingham, WA: SPIE.
Miyamoto, A., M.-A. Konno, and E. Bruhwiler. 2007. “Automatic crack recognition system for concrete structures using image processing approach.” Asian J. Inf. Technol. 6 (5): 553–561.
Mukherjee, S., and S. T. Acton. 2015. “Oriented filters for vessel contrast enhancement with local directional evidence.” In Proc., 2015 IEEE 12th Int. Symposium on Biomedical Imaging, 503–506. Piscataway, NJ: Institute of Electrical and Electronics Engineers (IEEE).
Mukherjee, S., C. Barry, and T. A. Scott. 2015. “Tubularity flow field—A technique for automatic neuron segmentation.” IEEE Trans. Image Process. 24 (1): 374–389. https://doi.org/10.1109/TIP.2014.2378052.
Omer, M., L. Margetts, M. H. Mosleh, S. Hewitt, and M. Parwaiz. 2019. “Use of gaming technology to bring bridge inspection to the office.” Struct. Infrastruct. Eng. 15 (10): 1292–1307. https://doi.org/10.1080/15732479.2019.1615962.
Osher, S., and J. A. Sethian. 1988. “Fronts propagating with curvature-dependent speed: Algorithms based on Hamilton-Jacobi formulations.” J. Comput. Phys. 79 (1): 12–49. https://doi.org/10.1016/0021-9991(88)90002-2.
Pieraccini, M., D. Dei, M. Betti, G. Bartoli, G. Tucci, and N. Guardini. 2014. “Dynamic identification of historic masonry towers through an expeditious and no-contact approach: Application to the “Torre del Mangia” in Siena (Italy).” J. Cult. Heritage 15 (3): 275–282. https://doi.org/10.1016/j.culher.2013.07.006.
Pushpalwar, R. T., and S. H. Bhandari. 2016. “Image inpainting approaches-a review.” In Proc., 2016 IEEE 6th Int. Conf. on Advanced Computing, 340–345. Piscataway, NJ: Institute of Electrical and Electronics Engineers (IEEE).
Radke, R. J., S. Andra, O. Al-Kofahi, and B. Roysam. 2005. “Image change detection algorithms: A systematic survey.” IEEE Trans. Image Process. 14 (3): 294–307. https://doi.org/10.1109/TIP.2004.838698.
Saur, G., and W. Krüger. 2016. “Change detection in UAV video mosaics combining a feature based approach and extended image differencing.” Int. Arch. Photogramm. Remote Sens. Spatial Inf. Sci. 41: 557–562.
Snavely, N., S. M. Seitz, and R. Szeliski. 2006. “Photo tourism: Exploring photo collections in 3D.” In Proc., ACM SIGGRAPH 2006 Papers, 835–846. New York: Association for Computing Machinery.
Sohn, H.-G., Y.-M. Lim, K.-H. Yun, and G.-H. Kim. 2005. “Monitoring crack changes in concrete structures.” Comput.-Aided Civ. Infrastruct. Eng. 20 (1): 52–61. https://doi.org/10.1111/mice.2005.20.issue-1.
Szeliski, R. 2010. Computer vision: Algorithms and applications. Berlin, Heidelberg: Springer Science & Business Media.
Wang, Z., A. C. Bovik, H. R. Sheikh, and E. P. Simoncelli. 2004. “Image quality assessment: From error visibility to structural similarity.” IEEE Trans. Image Process. 13 (4): 600–612. https://doi.org/10.1109/TIP.2003.819861.
Wang, Z., L. Li, S. Wu, Y. Xia, Z. Wan, and C. Cai. 2015. “A new image quality assessment algorithm based on SSIM and multiple regressions.” Int. J. Signal Process. Image Process. Pattern Recognit. 8 (11): 221–230. https://doi.org/10.14257/ijsip.
Wang, Z., E. P. Simoncelli, and A. C. Bovik. 2003. “Multiscale structural similarity for image quality assessment.” In Vol. 2 of Proc., 37th Asilomar Conf. on Signals, Systems & Computers, 1398–1402. Piscataway, NJ: Institute of Electrical and Electronics Engineers (IEEE).
Zeng, K., and Z. Wang. 2012. “3D-SSIM for video quality assessment.” In Proc., 2012 19th IEEE Int. Conf. on Image Processing, 621–624. Piscataway, NJ: Institute of Electrical and Electronics Engineers (IEEE).
Zhu, Z., S. German, and I. Brilakis. 2010. “Detection of large-scale concrete columns for automated bridge inspection.” Autom. Constr. 19 (8): 1047–1055. https://doi.org/10.1016/j.autcon.2010.07.016.
Information & Authors
Information
Published In

Journal of Architectural Engineering
Volume 29 • Issue 3 • September 2023
Copyright
This work is made available under the terms of the Creative Commons Attribution 4.0 International license, https://creativecommons.org/licenses/by/4.0/.
History
Received: Feb 12, 2022
Accepted: May 30, 2023
Published online: Jul 13, 2023
Published in print: Sep 1, 2023
Discussion open until: Dec 13, 2023
Authors
Metrics & Citations
Metrics
Citations
Download citation
If you have the appropriate software installed, you can download article citation data to the citation manager of your choice. Simply select your manager software from the list below and click Download.