What Improves Evacuations: Exploring the Hurricane-Forecast-Evacuation System Dynamics Using an Agent-Based Framework
Abstract
The hurricane-forecast-evacuation system is complex and dynamic, making it difficult to diagnose potential challenges and implement effective intervention strategies to ensure successful evacuations for everyone. Here we use an agent-based modeling framework to explore how changing different components of the system affects key evacuation outcomes. Called the forecasting laboratory for exploring the evacuation-system (FLEE), this modeling framework integrates high-level representations of the natural hazard (hurricane), the human system (information flow, evacuation decisions), the built environment (road infrastructure), and connections between elements (forecasts and warning information, traffic). Using FLEE, we investigate the simulated effects of changing the number of cars on the road network (changing evacuation demand), implementing approximations to different evacuation management strategies and policies (contraflow, evacuation order timing), and changing population characteristics (population growth and distribution), all for two real scenarios (Irma, Dorian) and one simulated storm (rapid-onset version of Irma). After comparing and validating FLEE’s evacuation outcomes with real-world empirical data, we use FLEE to explore how simulated changes impact evacuation success overall, how the changes compare, and how impacts from the changes vary across forecast scenarios and regions. Through the experiments, we demonstrate the power of these types of frameworks as tools for exploring the forecast-evacuation system across many scenarios, and identify potential next steps to better support researchers, practitioners, and policymakers.
Practical Applications
Because hurricane evacuations involve many factors and uncertainties, it is often difficult to diagnose potential challenges and implement intervention strategies to ensure everyone can evacuate safely. This research provides a new attempt to help address these needs, by integrating the many physical-social factors into a single modeling framework where we can explore potential challenges and interventions from a new perspective. Using the model, we look at how evacuation outcomes vary with the number of cars on the road network, evacuation management strategies and policies, changes in population characteristics, and different forecast scenarios. We look at which changes are most important to evacuation success, if that changes across forecast scenarios, and if some areas in the model are more impacted than others. Throughout the analyses, we demonstrate how the modeling framework is a powerful research tool capable of studying evacuations across many scenarios. We also discuss next steps for improving the models to support researchers and practitioners working to improve evacuations and save lives.
Introduction
Many physical-social factors and uncertainties can influence evacuation outcomes. Consider Hurricanes Irma (2017) and Rita (2005), cases where forecasts of major storms approaching highly populated areas triggered mass evacuations in Florida and Texas, respectively. Although many evacuated successfully—and some, arguably, unnecessarily—severe traffic jams led to major complications during these evacuations, including driving some high-risk residents to remain in place (Wong et al. 2018; Zhang et al. 2007). Considering the forecasts were accurate given current forecast skill, the cases illustrate the complexities of designing and implementing strategies to ensure successful evacuations for everyone involved, especially with growing at-risk populations along the US coastlines.
Surveys, interviews, and other methods are often used to study evacuations, including how forecast information, the built environment, and other factors influence evacuation decision-making and traffic (findings are synthesized e.g., in Lindell and Perry 2012; Huang et al. 2016; Murray-Tuite et al. 2019). Here, we build on this empirical and theoretical knowledge by studying the hurricane-forecast-evacuation system using computational modeling, which enables exploration of a wide variety of scenarios. Computational models built on this knowledge can be compared with data from real evacuation cases, and then used to simulate many different hypothetical situations, e.g., different forecast scenarios, potential societal challenges, and evacuation interventions. Such work enables new and complementary forms of knowledge building, and provides a way to test the effectiveness of different evacuation strategies prior to implementing them in the real world when lives are at risk.
Computational models are designed in different ways, depending on their intended purpose. Models geared toward knowledge building (Barton 2014; Miller and Page 2007) explicitly simulate microscale processes and interactions of interest, with run-time less of a concern, whereas models intended to support evacuations in real time (Blanton et al. 2018; Davidson et al. 2018) require simulating certain aspects of evacuations, often through statistical parameterizations of key processes to generate rapid predictions of aggregate outcomes. The former, research models have been used to investigate evacuation information flows (Morss et al. 2017; Watts et al. 2019), decision-making processes (Watts et al. 2019; Dixon et al. 2017; Yin et al. 2014) and evacuation traffic (Gehlot et al. 2018; Ukkusuri et al. 2017). Here, we integrate high-level representations of these different features into one framework, incorporating realistic representations of forecast information and uncertainty. Integrating these features enables us to simulate and compare many potential influences on hurricane evacuation outcomes, complimenting and building upon past empirical and computational work.
In this article, we use a recently developed computational, agent-based modeling framework for studying the dynamics of the hurricane-forecast-evacuation system. Called the forecasting laboratory for exploring the evacuation-system (FLEE), the modeling framework represents key processes within the system at a high-level, but not the full details of the real system, as this is computationally challenging. This includes representing the natural hazard (hurricane), the human system (information flow, evacuation decisions), the built environment (road infrastructure), and their interconnections such as forecasts, warning information, and traffic (Harris et al. 2021). By coupling these subsystems, FLEE is capable of simultaneously exploring their (potentially nonlinear) interactions and influences on evacuation outcomes.
FLEE’s conceptualization and implementation is described in Harris et al. (2021). This paper presents a comparison of FLEE with empirical data and then uses the model to begin exploring targeted aspects of the system’s dynamics. Specifically, we conduct a series of experiments exploring how changing different societal components of the hurricane-forecast-evacuation system affects key evacuation outcomes across three forecast scenarios impacting the Florida peninsula. This includes investigating the effects of changing the number of cars on the road network (changing evacuation demand), implementing approximations to different evacuation management strategies and policies (contraflow, evacuation order timing), and changing population characteristics (population growth and distribution), all for two real scenarios (Irma, Dorian) and one simulated storm (rapid-onset version of Irma). Using this novel modeling framework, our goal is to simulate potential challenges and evacuation interventions from this new perspective as steps towards better understanding features important for successful evacuation outcomes.
Throughout the analysis, we ask:
1.
How do these simulated changes hinder or improve overall evacuation success and how do they compare with each other?
2.
How do these simulated changes vary across forecast scenarios, regions, and different areas of impact?
In beginning to answer these questions, we demonstrate how agent-based computational frameworks like FLEE can build our understanding of the system’s dynamics—including identifying ways to improve evacuations—across many real and imagined scenarios. We consider this analysis a starting point for developing research models looking at these different features together As the models become more realistic, receive additional validation, and become capable of additional experiments with increasing computing power, these types of computational modeling frameworks will be increasingly well-suited to support researchers and decision-makers in hazard risk management.
Methodology
Overview of FLEE
Details regarding FLEE’s model design are provided in Harris et al. (2021). Here we highlight important aspects of FLEE to note when interpreting experiments exploring these targeted aspects of the system’s dynamics.
•
Virtual world—The area modeled is a cellular representation of the north-south axis of Florida (Fig. 1). Census data informs the spatial distribution and characteristics of FLEE’s 4.1 million household agents.
•
Forecast and warning information—Every 6 h, National Hurricane Center (NHC) products overviewing current and forecast data are synthesized into a light system forecast of wind, storm surge, and rain for FLEE’s different grid cells.
•
Evacuation orders—Emergency manager agents, located within FLEE’s coastal grid cells, decide whether to issue evacuation orders based on storm surge forecasts, clearance times, and the forecast time of arrival of tropical storm force winds.
•
Evacuation decision-making—Household agents decide whether to evacuate based on a combination of forecast information, evacuation order information, and household characteristics (mobile home ownership, age, car ownership, and socioeconomic status).
•
Road networks—Idealized virtual highways and interstates designed to simulate key aspects of Florida’s road network are overlaid on the model grid. These roads allow evacuating household agents to move between grid cells.
•
Evacuation traffic—If spots on roads are unavailable due to traffic for a period of time (or once tropical storm force winds reach a grid cell) household agents who decided to evacuate will decide to shelter in-place instead.
Validation and Model Updates
As a first step for this analysis, we compared FLEE’s evacuation outcomes with new empirical data for Hurricane’s Irma and Dorian, which triggered evacuations across Florida in 2017 and 2019, respectively. For Irma, the empirical data provides the spatial and temporal patterns of evacuation orders, evacuation rates, and traffic intensity. For Dorian, spatial and temporal patterns of evacuation orders are provided, as are the storm’s evacuation rates. Depending on the study, the empirical data are expressed in different ways. For example, evacuation rates are expressed by county, zip code, regions, and so on. Because it is not feasible to translate the empirical data by county, for example, onto FLEE’s 40 grid cells for an exact comparison, we instead aggregate the empirical data to ensure the bigger picture aspects of FLEE’s evacuation (evacuation orders, rates, and traffic) behave realistically. Full descriptions and sources of the empirical data are provided in Table 5, which is located in the Appendix.
Based on several iterations of experiments comparing FLEE’s evacuation behaviors to the new empirical data, the version of FLEE used here includes several updates made to the implementation described in Harris et al. (2021), as summarized in Table 6, which is also located in the Appenidx. First, to reduce unrealistic evacuation rates early in the simulations and make the temporal patterns of evacuation closer to observations for Irma and Dorian, we made two changes: (1) integrating households into the decision-making process gradually rather than assuming instantaneous communication of risk information (e.g., communication process described in Watts et al. 2019); and (2) allowing risk perception to increase as the storm approaches. Second, FLEE’s previous formulation in Harris et al. (2021) exhibited unrealistic variability between grid cells in some situations compared to the empirical data; to address this, we reduced the influence of mobile home and socioeconomic status in the evacuation decision-making algorithm. In addition, FLEE’s previous formulation overestimated evacuation rates in coastal grid cells compared to inland cells, as evacuation orders were issued for the entire grid cell. Thus, we changed the formulation of evacuation orders so they are only issued to a percentage of households in coastal grid cells, reflecting the approximate percentage of population in different regions of Florida that live in evacuation zones (Fig. 5).
Experimental Design
Using the updated version of FLEE, we perform a set of experiments on the model that involve changing the storm and corresponding forecast scenarios. Specifically, we run FLEE using real forecasts from Hurricane Irma, Dorian, and a hypothetical version of Irma where its forecasts are condensed into a shorter timeframe to assess how rapid onset (and similarly, rapid intensification) impacts evacuation outcomes. We note that, though the Irma and Dorian forecasts are identical to those in Harris et al. (2021), the simulations are new due to additional validation and model updates. We also note that the rapid onset case was run for Irma only because it had a larger, more complicated evacuation than Dorian. Together, these three forecast scenarios (Irma, Dorian, Irma-RO) are used to provide a baseline of evacuation behaviors to compare additional experiments against.
Starting from these baseline scenarios for each storm, we systematically modify parameters in FLEE, while holding other variables constant, to explore FLEE’s behaviors and sensitivities to potential evacuation challenges and interventions within the hurricane-forecast-evacuation system including:
•
Changing the number of cars on roads—Here we modify evacuation demand by changing the number of people evacuating per car, which changes the number of cars used to evacuate a specified number of people.
•
Implementing contraflow—We study the potential benefits of this widely-known evacuation management strategy by adding one, two, and three lanes across important highways.
•
Shifting evacuation order timing—Here we shift the issuance of evacuation orders by 10 and 20 h earlier and later for each grid cell, by adjusting clearance times these amounts.
•
Accounting for changing populations and distributions—For this we project FLEE’s population forward in time to expected values in 2030 and 2040 and make population density uniform across the model grid.
We again note the intention is not to represent actual evacuation challenges and evacuation management strategies, but simplified versions of them given idealizations in the model. By comparing the different experiments to the baseline simulations, to each other, and to other studies of evacuation management solutions, we investigate the relative importance of factors and interactions (potentially nonlinear), and we demonstrate how FLEE can explore targeted aspects of system’s dynamics across many scenarios.
Data Analyses
To compare evacuation behaviors quantitatively across experiments, we track evacuation statistics across time for each of FLEE’s 40 grid cells, thus showing the spatial and temporal variation in evacuation outcomes. The primary model outputs analyzed in FLEE are the percent of households that successfully evacuated (i.e., evacuation rates) and the percent of households that intended to evacuate but did not due to excessive traffic in their area. We track the latter statistic to provide insight into where excessive traffic prevented successful evacuations (see, e.g., Wong et al. 2018 for Irma). Other parameters of interest are the percent of residents under evacuation orders in the model who evacuated (sometimes called compliance rates), and the percent of residents who evacuated from areas not under evacuation orders (sometimes called shadow evacuations; McGhee and Grimes 2006; Murray-Tuite et al. 2019).
In addition to displaying data by grid cells and averaged across the domain, these statistics are sometimes broken down into multiple impact zones, designed as first-order approximations of areas likely to experience different levels of impacts based on the actual meteorological conditions produced by the storm. Here, we use four impact zones, defined by whether the grid cells are: (1) coastal or inland; and (2) experience winds that are greater than 64 knots (hurricane-force) or less than 64 knots during the storm of interest. Using the impact zones, we can determine who evacuated from locations that did not end up experiencing hazardous wind conditions (future versions could do this for rain and surge parameters as well).
In interpreting the results for different experiments, we compare multiple metrics that might indicate successful outcomes in different ways. For example, high evacuation rates may not be good if the storm ends up not having much impact in those areas, and unnecessary evacuations may not matter if those in areas experiencing the greatest impacts were able to evacuate successfully (without being impeded by traffic jams).
Because FLEE includes stochastic elements, it can exhibit some run-to-run variability. Therefore, when interpreting results, changes less than 0%–2% in evacuation statistics across experiments are considered insignificant (e.g., see experiments in Harris et al. 2021).
Results and Discussion
Baseline Forecast Scenarios and Comparison with Empirical Data
First, we examine results from FLEE’s baseline simulations for Hurricane’s Irma and Dorian. Comparing these simulations against observations provides a first-order assessment that the model behaves reasonably for these two forecast scenarios based on the processes implemented. Next, we examine results from a simulation using forecasts from a new rapid-onset version of Irma (hereafter called Irma-RO). Together, the Irma, Dorian, and Irma-RO simulations provide a baseline for interpreting subsequent experiments in FLEE where, for each storm scenario, we change the number of cars on the roads, number of available lanes (contraflow), evacuation order timing, and population characteristics.
Hurricane Irma
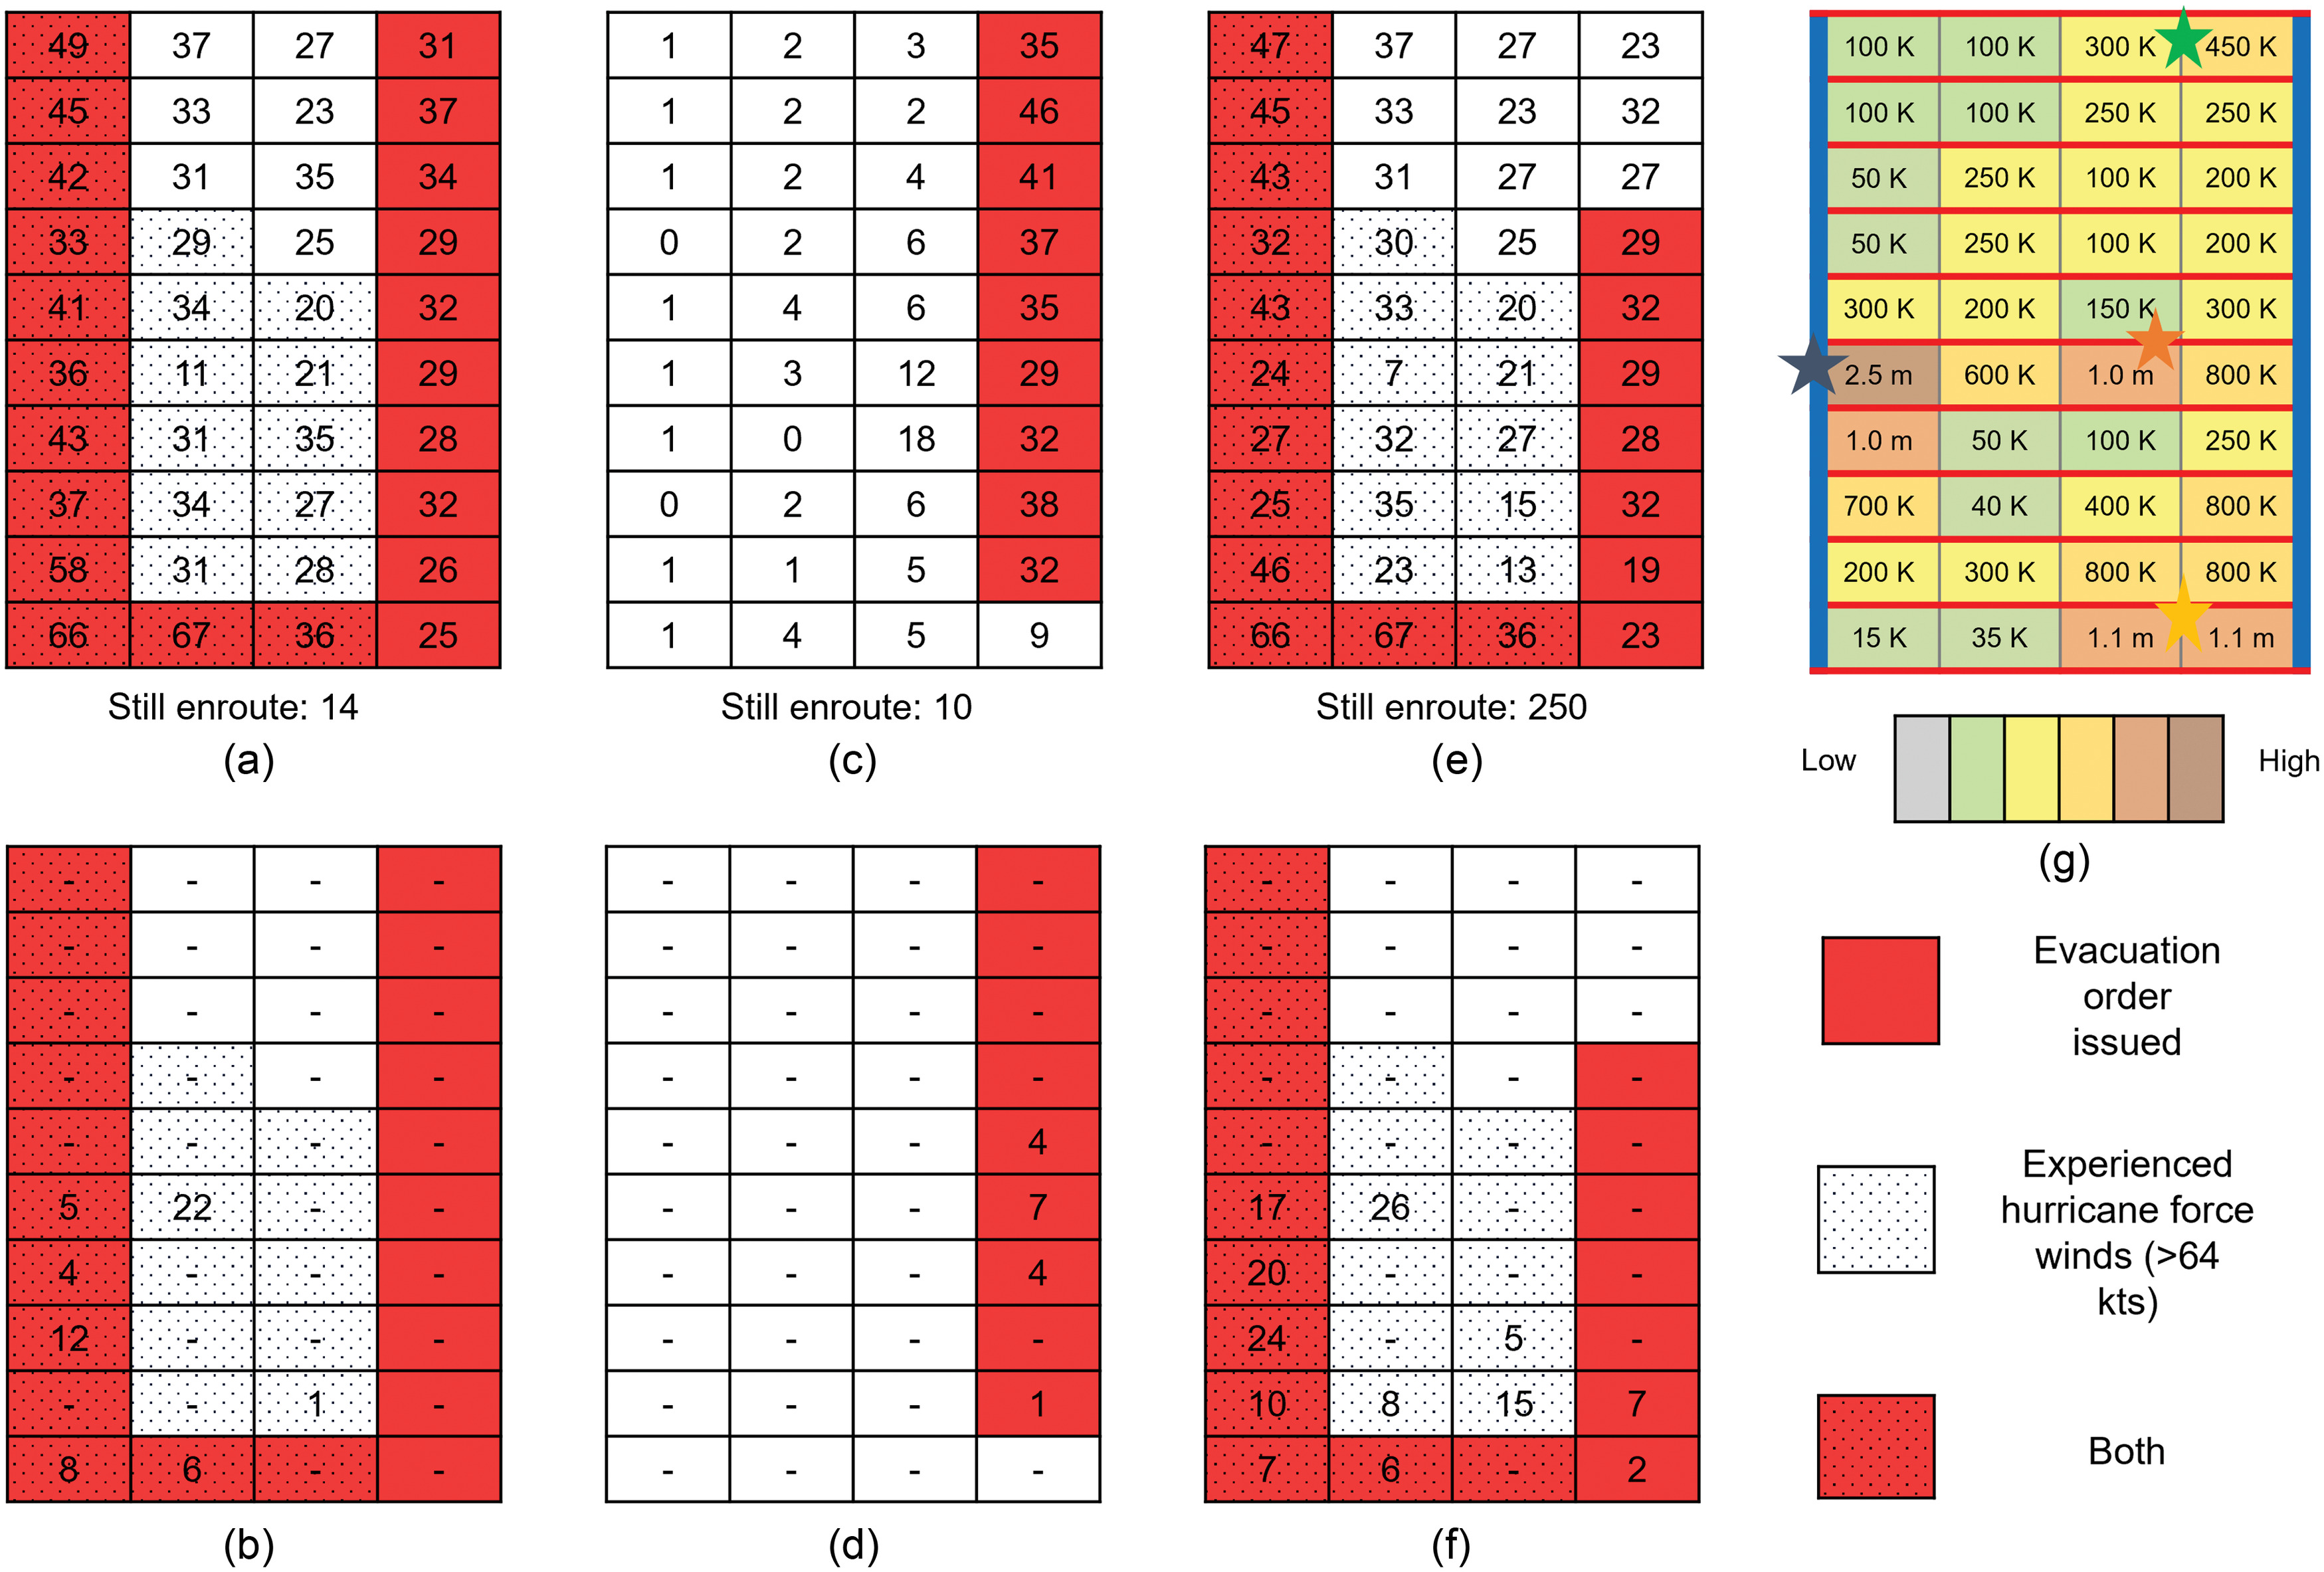
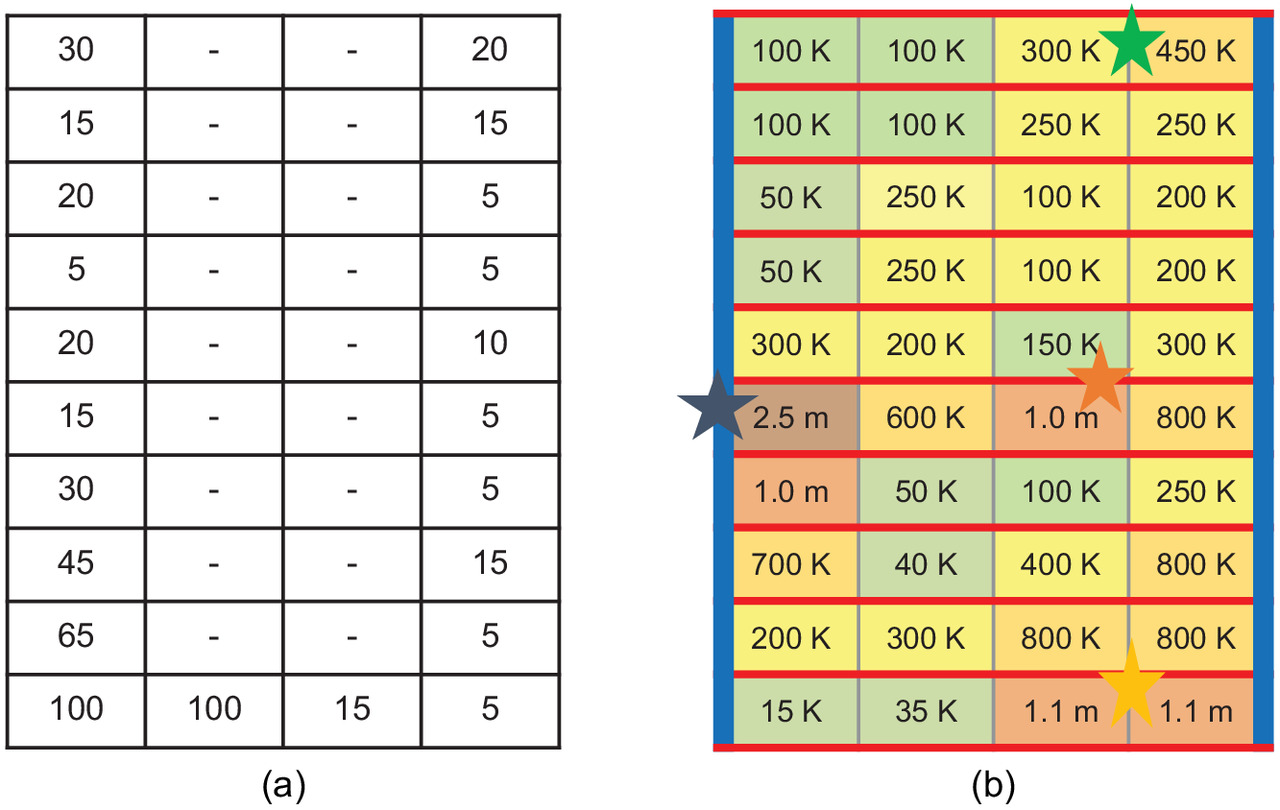
Irma’s 3–10–day forecasts, as shown in Fig. 2 of Harris et al. (2021), place the entire model domain under significant threat, with the most likely outcome being a landfalling major hurricane near Miami. However, forecasts shifted westward as the storm approached, with the storm eventually making a first mainland US landfall as a Category 4 in the Florida Keys and a second landfall as a Category 3 in southwest Florida. Irma’s hurricane-force winds [Figs. 1(a and b); dotted cells] impacted the western two-thirds of the model—particularly the southwest coastlines—with the east-coast experiencing tropical storm force winds. Based on these Irma forecasts, emergency manager agents in FLEE issued evacuation orders along both coasts, starting in Miami [Figs. 1(a and b); red cells], which was observed in Irma’s actual evacuation orders (Wong et al. 2018; Darzi et al. 2021). The comparison with empirical data increase our confidence that FLEE’s evacuation order algorithm behaves sufficiently realistically for the purpose of the subsequent experiments.
Irma’s simulated evacuation rates in FLEE [Fig. 1(a)] vary from 20% to 40% along Florida’s east coasts, 50–60% along the south and west coasts, and 10%–40% inland. This closely resembles the observational data, which also suggest evacuation rates vary from 20% to 40% along Florida’s east coast, to 40%–70% across the south and west coasts, and around 10%–30% inland [data aggregated from Wong et al. (2018), Long et al. (2020), Martin et al. (2020), and Feng and Lin (2021)]. This was the largest evacuation in US history, causing severe traffic across the state (Wong et al. 2018). In FLEE, traffic is most severe around Tampa Bay-St. Petersburg [Fig. 1(b)] with 5%–20% of the metro failing to evacuate due to traffic. This broadly matches observations of traffic rates, which shows severe traffic across the Tampa Bay, I-75, and surrounding areas (Feng and Lin 2021; Staes et al. 2021).
Across FLEE’s entire model grid, 32.0% of households evacuate for the storm, which equals 5.4 million people (Table 1). Estimates from the FDEM (2018) suggest actual evacuation numbers totaled 6.9 million. When considering households evacuating to local shelters in FLEE (not shown), FLEE’s evacuation rates closely resemble the observations. For a given level of wind impact, FLEE’s evacuation rates are higher along the coasts than inland, which is also shown in the real-world data (Feng and Lin 2021; Martin et al. 2020).
| Baseline storm scenario | % Successfully evacuated | % Under evacuation orders who evacuated | % Not under evacuation orders who evacuated | % Unsuccessful evacuation due to traffic | ||||
|---|---|---|---|---|---|---|---|---|
| Total (all cells) | Coastal knot zone | Inland knot zone | Coastal kts zone | Inland kts zone | ||||
| Irma | 32.0 | 39.3 | 24.5 | 29.6 | 29.4 | 34.9 | 25.6 | 2.5 |
| Dorian | 12.0 | — | — | 14.7 | 0.6 | 35.4 | 4.3 | 0.7 |
| Irma-RO | 26.3 | 30.2 | 18.8 | 26.8 | 28.9 | 28.8 | 25.3 | 7.7 |
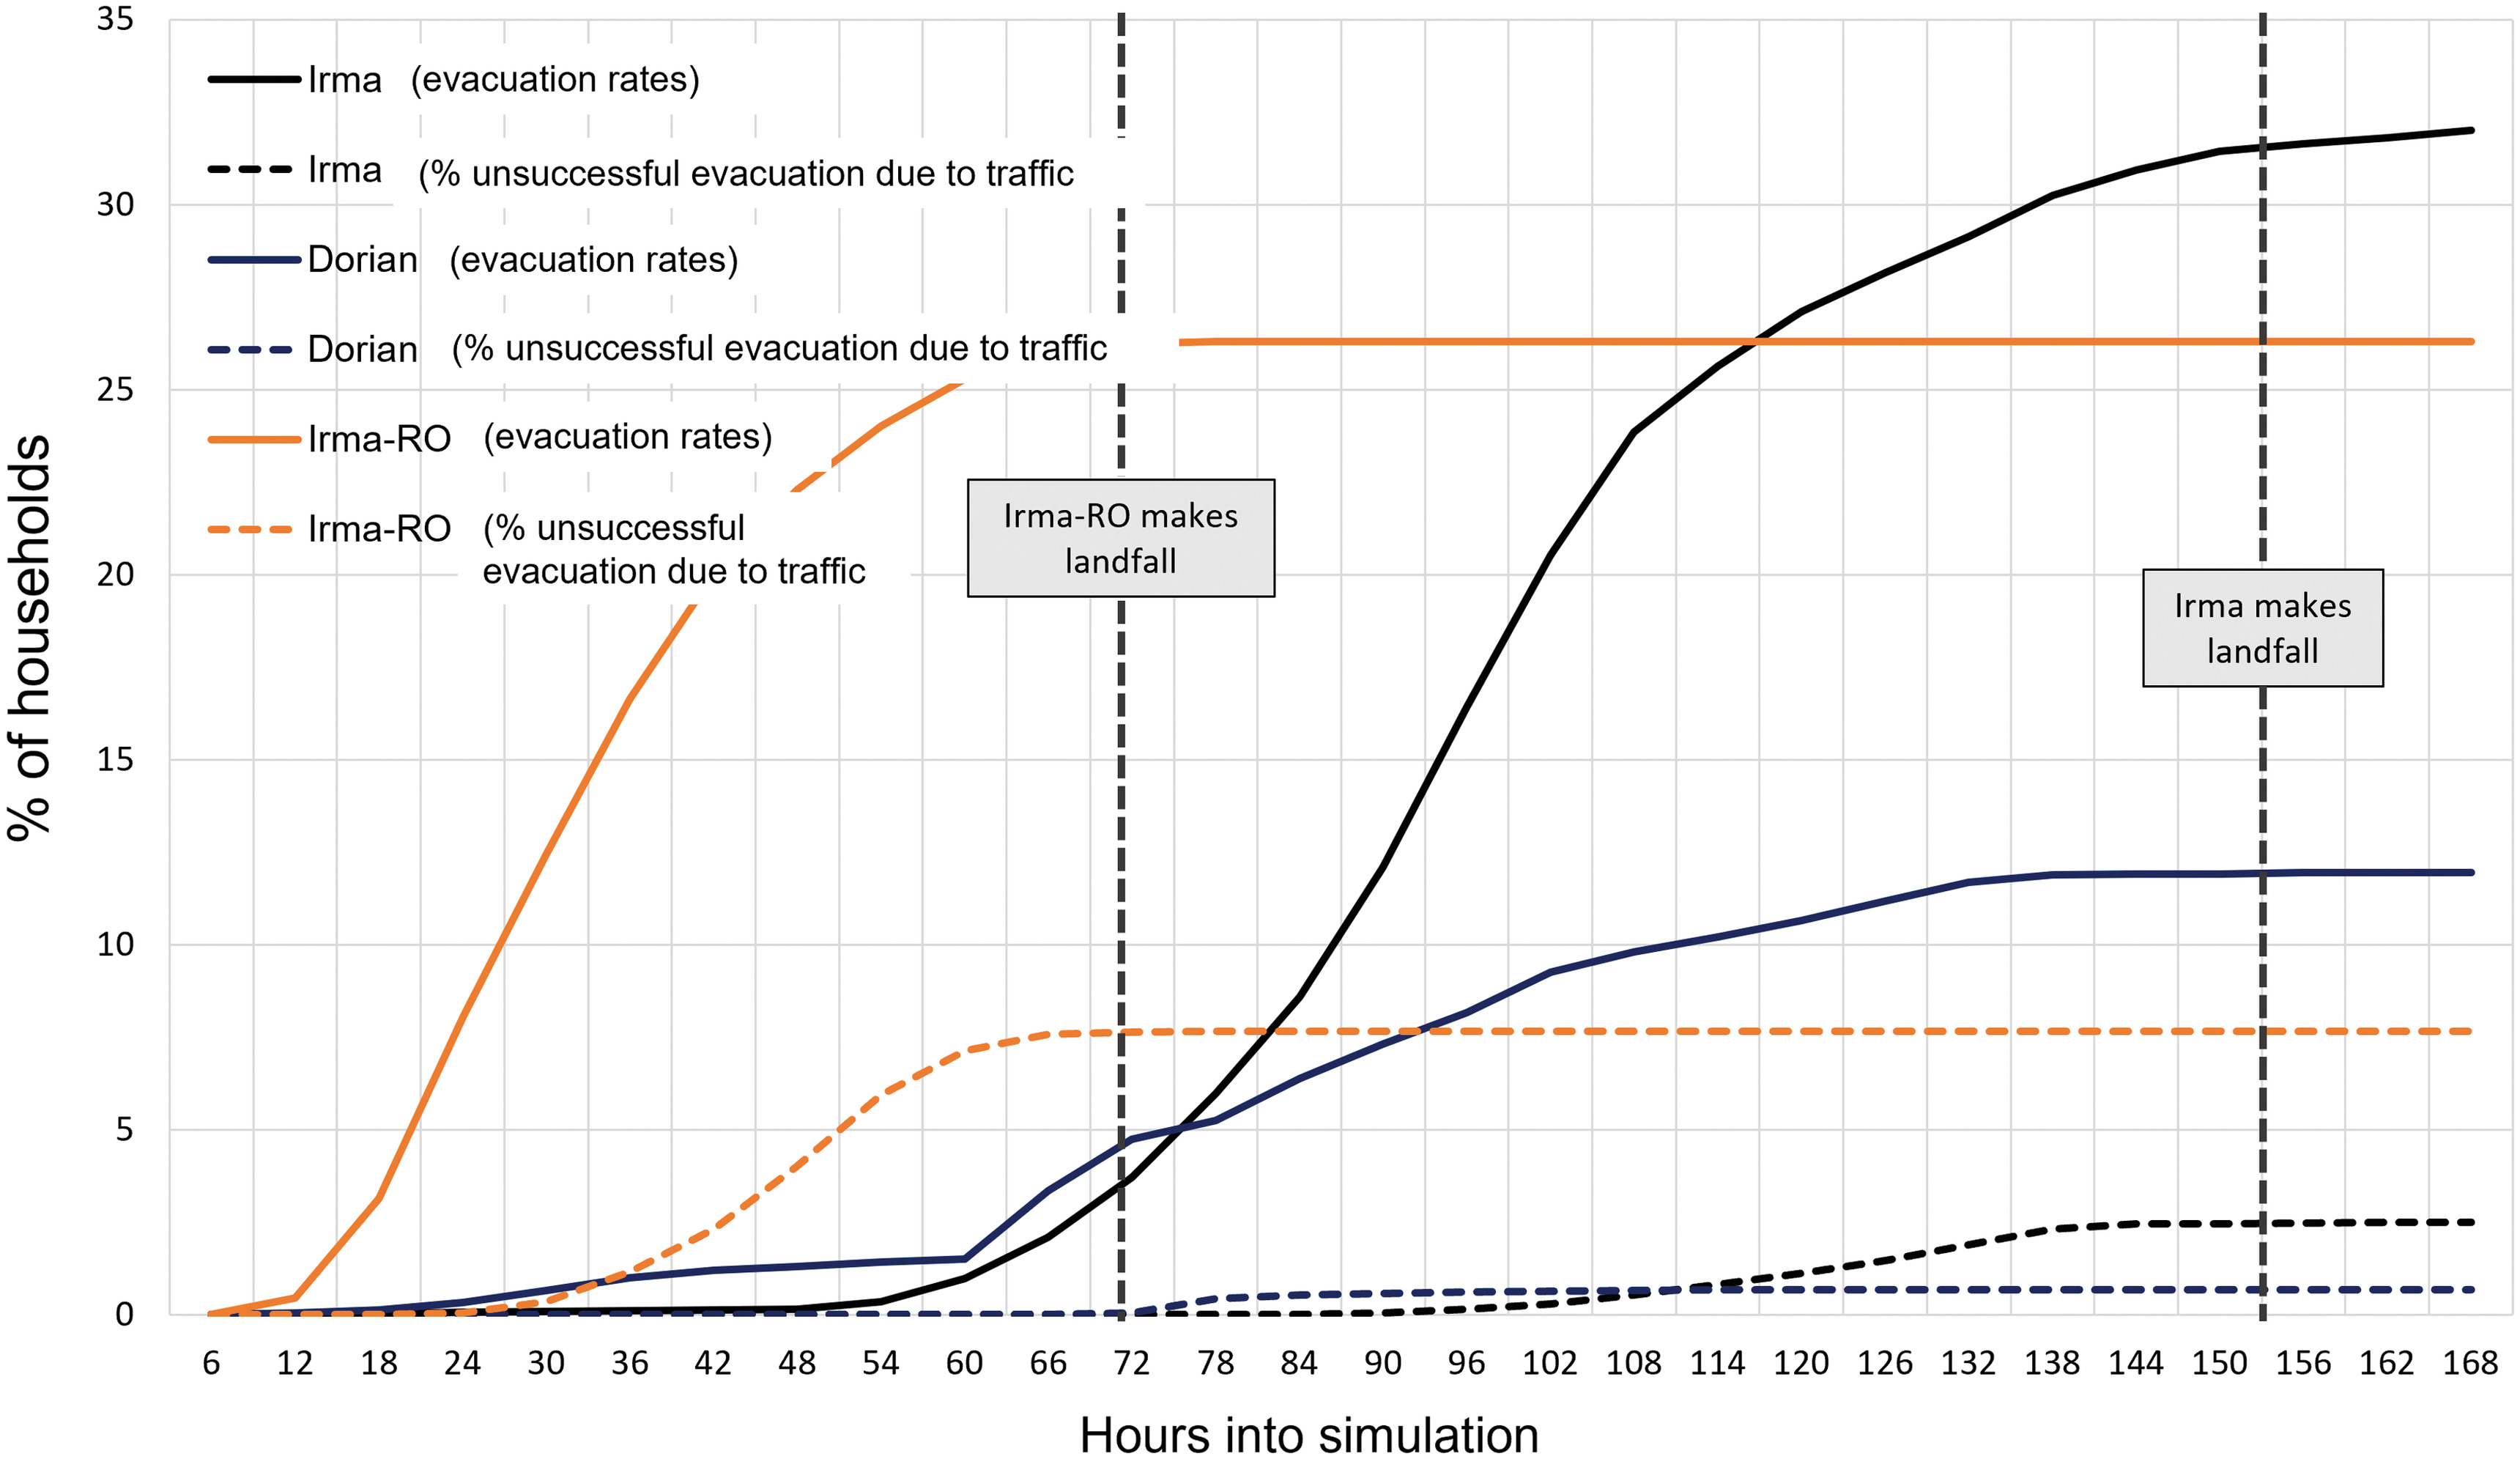
The temporal evolution of FLEE’s evacuation rates is shown in Fig. 2. Despite not receiving evacuation orders, some households (black solid line) evacuate in the first 0–72 h. Evacuation rates increase linearly between 72 and 108 h as evacuation orders expand. Just before the storm moves ashore around 126 h, evacuation rates decrease. In survey data from Wong et al. (2018), evacuation rates increased linearly over the same 72–108 time period and decreased 24 h before landfall.
This information—combined with the other comparisons against empirical data on evacuation orders, rates, and traffic—suggest this version of FLEE sufficiently captures the broader patterns of evacuation for Irma and thus provides a realistic baseline for interpreting results from Irma’s other experiments.
Hurricane Dorian
Dorian’s early forecasts [Fig. 13 of Harris et al. (2021)] place the entire Florida peninsula under threat initially, with the most likely scenario as a landfalling major hurricane along Florida’s east coast. However, after remaining nearly stationary over the Bahamas for many hours, the storm accelerates northward, narrowly missing Florida’s east coast. Because of the forecasts, FLEE’s emergency manager agents issued evacuation orders along the model’s east coast [Figs. 1(c and d); red cells], matching what occurred (Roache 2019).
Dorian is a fundamentally different storm than Irma with fewer people at risk. As a result, FLEE’s simulated evacuation rates were lower, 12.0% compared to 32.0% for Irma, resulting in 3.3 million fewer evacuees (Table 1). Due to fewer evacuees overall—and the evacuation being spread over a longer time (Fig. 2; blue lines)—fewer people fail to evacuate due to traffic during Dorian (0.7%) than Irma (2.5%). FLEE’s evacuation rates and traffic congestion are confined to the east coast during Dorian [Figs. 1(c and d)], matching our understanding of what occurred (Mongold et al. 2020).
Though Dorian’s empirical data is not as robust as Irma’s, the available data, which provides the timing and location of evacuation orders (Roache 2019) and evacuation rates (Mongold et al. 2020), suggests the model is generating reasonable evacuation behaviors, i.e., the Dorian simulation appears as accurate as possible given current empirical data, and is reasonable for experimentation.
Hurricane Irma-RO
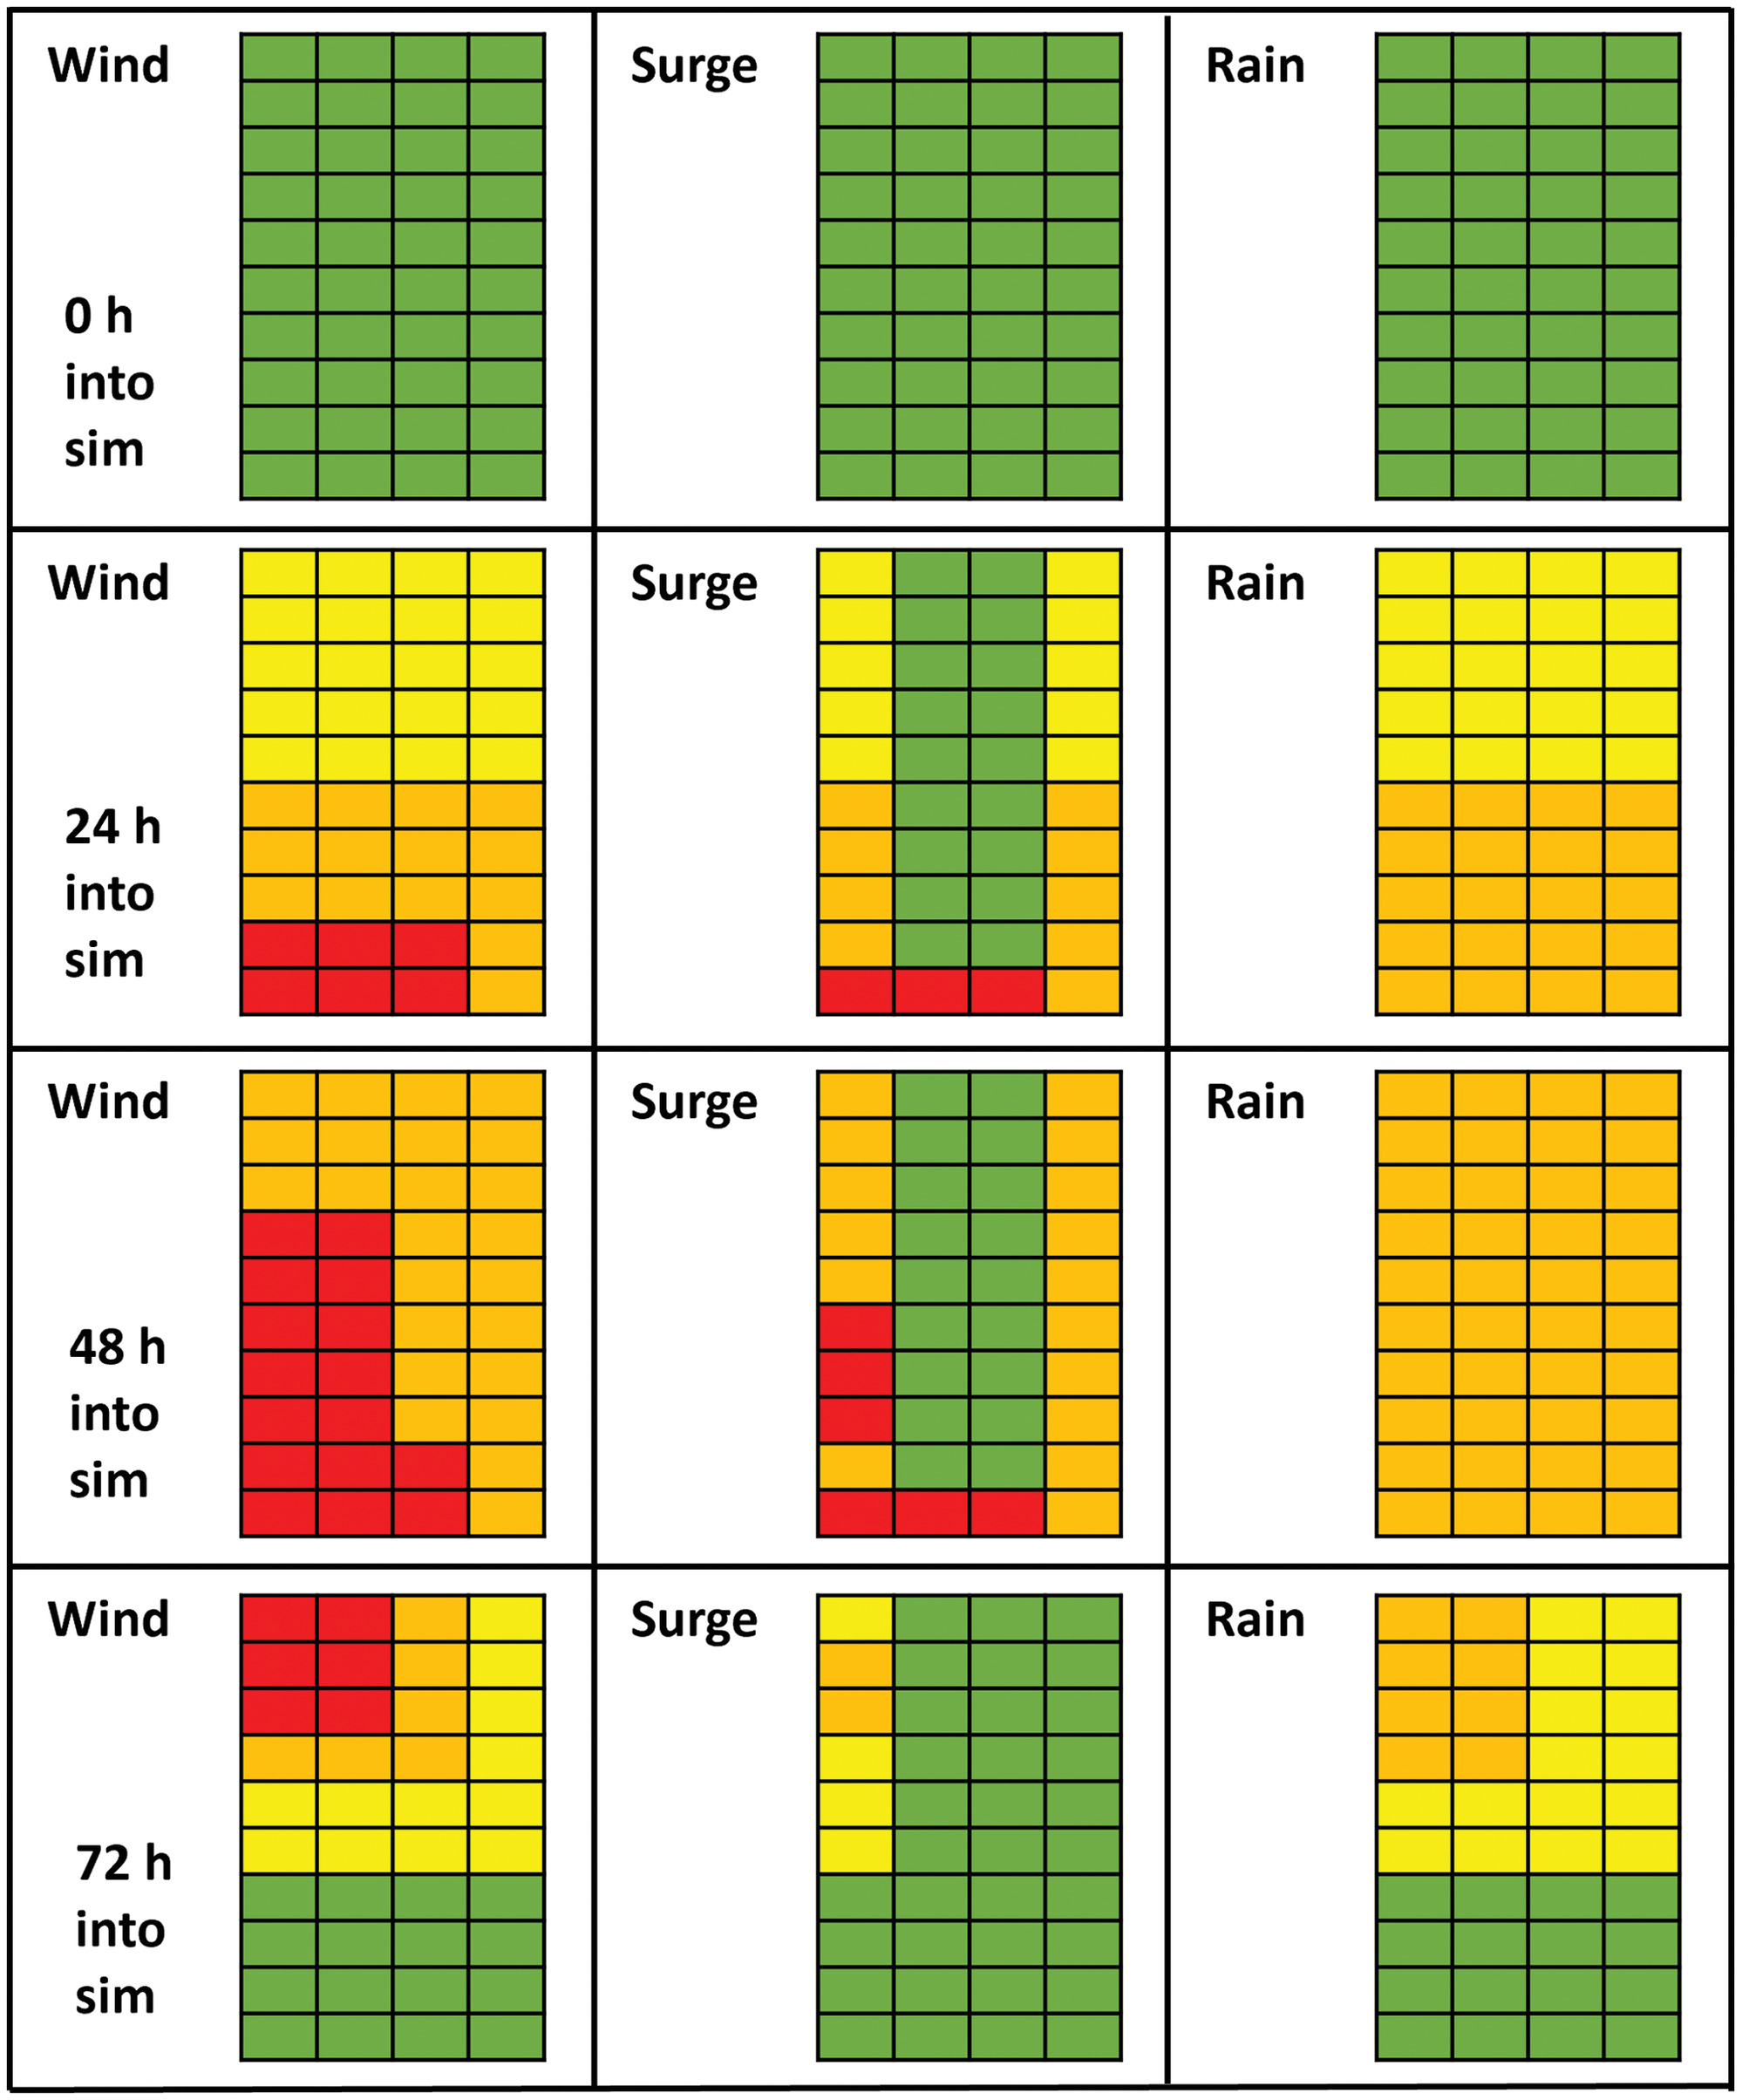
The hypothetical Irma-RO forecasts are shown in Fig. 3. For each grid cell, the peak magnitudes of forecast risk are identical to Irma’s forecasts. However, the forecasts—and subsequently, the simulation—are compressed from 168 to 72 h. By comparing FLEE’s evacuation response between Irma’s real and hypothetical Irma-RO forecasts, this simulation explores the potential effects of a storm that exhibits rapid onset (and also, to a degree, rapid intensification) on the hurricane evacuation dynamics.
FLEE’s response to the Irma-RO forecast is similar to Irma’s, but with key differences. First, evacuation orders [Figs. 1(e and f), red cells] are not issued around Jacksonville [Fig. 1(g), green star]. This occurs because the westward shift in forecast risk happens more quickly than with Irma, meaning the area was removed from risk before evacuation order decisions were made by FLEE’s emergency manger agents. As a result, Irma-RO has 300,000 fewer people intending to evacuate in these regions, despite having identical peak magnitudes of risk in FLEE.
In addition, a lower percentage of FLEE’s population evacuates in Irma-RO (26.3%) than Irma (32.0%). This is partially because fewer evacuation orders are issued, but mostly because there were a greater number of households who intended to evacuate but did not due to excessive traffic in Irma-RO (7.7%) than Irma (2.5%), an increase of 852,000 people (Table 1). The increased traffic in Irma-RO occurs in the Tampa Bay-St. Petersburg metropolitan areas and surrounding southwest coastlines i.e., areas with significant populations at risk that need considerable time for safe evacuations. However, unlike with Irma, residents around Miami-Ft. Lauderdale also experience significant numbers of households giving up to traffic during the Irma-RO scenario [Fig. 1(f)]. Therefore, we believe the Irma-RO case suggests that rapid-onset—and possibly, rapid intensification—can worsen evacuation rates and traffic in these higher-risk areas. Though consistent with our conceptual understanding of these situations, as there is less time to evacuate safely, this is the first study (to our knowledge) to provide evidence that rapid onset scenarios negatively impacts evacuations.
Experiments Modifying Model Parameters
In the following subsections, we modify key model parameters and compare their evacuation behaviors to the Irma, Dorian, and Irma-RO baseline experiments discussed earlier. Specifically, we assess how evacuation outcomes change with the number of cars on the road network (evacuation demand), approximations to evacuation management strategies and policies (contraflow, evacuation order timing), and evolving population characteristics (population growth, distribution). The idea is to demonstrate how FLEE can explore the role of these factors on evacuation outcomes, including exploring how these simulated changes (1) affect evacuation success overall; and (2) vary across forecast scenarios and regions.
Number of Cars on Roads
First, we examine how FLEE’s evacuation outcomes change when more or fewer cars are used to evacuate the same number of people. One way to interpret this set of experiments is simulating the influence of evacuation demand, through use of public transportation, carpooling, or other factors (see summary in Murray-Tuite et al. 2019). Relative to evacuation management strategies like contraflow, these types of influences on evacuation demand are studied less frequently (Bullard and Wright 2011; exceptions in Swamy et al. 2017; Zhang and Chang 2014) nor were they widely used during past storms like Irma and Dorian; (Wong et al. 2018; Murray-Tuite et al. 2019). However, these experiments help illustrate how changes in evacuation demand by using different strategies to evacuate the same number of people can benefit or hinder successful evacuation.
To simulate the effects of changing the number of cars on the road in FLEE, we change the number of people evacuating per car from 4 (baseline) to 2, 3, 5, 6, and 8. Going from 4 to 2 people per car doubles the number of cars evacuating. Alternatively, going from 4 to 8 people per car halves the number of cars evacuating. The former can be viewed as looking at what happens when households use multiple vehicles, whereas the latter can be viewed as exploring what happens if there is an option to transport many people by bus or if people were asked to stay home. Though the car-length is kept the same in FLEE throughout these experiments, we believe the assumption is reasonable for a first-order analysis of modifying FLEE’s evacuation demand.
Evacuation rates and traffic are shown in Table 2. Across all scenarios, results indicate that evacuation rates increase when transportation demand is reduced, as fewer people decide to stay home due to excessive traffic in their areas. These improvements are significant. For example, with Irma, increasing from 4 to 6 people per evacuating car (one-thirds fewer cars on roads) improves evacuation rates by 2.2%, or 500,000 people. The magnitude of improvements is scenario-dependent, with the largest improvements happening with Irma-RO followed by Irma and Dorian. This is because Irma-RO has the most traffic issues, followed by Irma and then Dorian.
| Experiments | Results | |||||||
|---|---|---|---|---|---|---|---|---|
| Storm | Number of cars on roads | Evacuation rates | % Change from baseline | Evacuated | % Under evacuation orders who evacuated | % Not under evacuation orders who evacuated | % Unsuccessful evacuation due to traffic | Unsuccessful evacuation due to traffic |
| Irma | Baseline × 2 | 22.5 | 3.67 m | 25.5 | 16.0 | 12.0 | 1.97 m | |
| Baseline × 1.33 | 28.5 | 4.67 m | 32.0 | 20.9 | 6.0 | 980 k | ||
| Baseline | 32.0 | 0 | 5.24 m | 34.9 | 25.6 | 2.5 | 410 k | |
| Baseline × 0.8 | 33.7 | 5.52 m | 26.4 | 27.6 | 0.8 | 130 k | ||
| Baseline × 0.66 | 34.2 | 5.61 m | 37.1 | 27.9 | 0.3 | 49 k | ||
| Baseline × 0.5 | 34.4 | 5.64 m | 37.1 | 28.3 | 0.1 | 16 k | ||
| Dorian | Baseline × 2 | 9.5 | 1.56 m | 26.7 | 3.9 | 3.1 | 508 k | |
| Baseline × 1.33 | 11.2 | 1.84 m | 32.9 | 4.2 | 1.4 | 229 k | ||
| Baseline | 12.0 | 0 | 1.97 m | 35.4 | 4.3 | 0.7 | 115 k | |
| Baseline × 0.8 | 12.2 | 1.99 m | 36.4 | 4.3 | 0.4 | 66 k | ||
| Baseline × 0.66 | 12.3 | 2.02 m | 36.8 | 4.3 | 0.3 | 49 k | ||
| Baseline × 0.5 | 12.5 | 2.05 m | 37.8 | 3.7 | 0.1 | 16 k | ||
| Irma-RO | Baseline × 2 | 16.9 | 2.77 m | 17.4 | 16.0 | 17.1 | 2.81 m | |
| Baseline × 1.33 | 21.5 | 3.52 m | 23.1 | 18.6 | 12.4 | 2.03 m | ||
| Baseline | 26.3 | 0 | 4.31 m | 28.8 | 25.3 | 7.7 | 1.26 m | |
| Baseline × 0.8 | 29.7 | 4.87 m | 32.3 | 25.0 | 4.3 | 704 k | ||
| Baseline × 0.66 | 31.0 | 5.08 m | 34.2 | 25.6 | 2.9 | 475 k | ||
| Baseline × 0.5 | 33.2 | 5.44 m | 37.0 | 26.4 | 0.9 | 147 k | ||
Note: Bold values were meant to serve as a reference point for comparison.
The experiments also reveal nonlinearities in the system (Table 2). For example, in all forecast scenarios, doubling the number of evacuating cars results in significantly larger changes to evacuation rates than halving the number of evacuating cars. We believe this suggests excessive traffic can worsen evacuations exponentially. Future work may consider furthering our understanding of this relationship, including identifying whether tipping points exist, or whether targeted carpooling and bussing (or other influences) helps, supporting practitioners in risk management.
Fig. 4 shows which areas are impacted by the experiments changing the number of cars on roads. When halving the number of evacuating vehicles, evacuation rates and traffic improve areas heavily trafficked in the baseline simulations (Fig. 1). When doubling the number of evacuating vehicles, evacuations worsen considerably, particularly across at-risk areas where evacuees are dependent on traffic downstream, i.e., southern Florida. By and large, results suggest that reducing evacuation demand, whether through targeted public transportation or other factors, could improve evacuations significantly, especially for the most heavily trafficked scenarios and regions (i.e., Irma-RO, south Florida).
Contraflow
Here we investigate the influence of road capacity in FLEE by implementing a simple version of contraflow where the number of lanes are increased in different areas. Though used before (and successfully) during Hurricane’s Floyd (1999) and Katrina (2005), contraflow was not implemented, to our knowledge, for Irma or Dorian (Wong et al. 2018; Wolshon and Lambert 2004), as it requires considerable personnel resources and must be planned days in advance (e.g., summary in Murray-Tuite et al. 2019).
As described in Harris et al. (2021), FLEE’s road network consists of two northbound, five-lane interstates situated on the model’s coasts (i.e., Florida’s I-75 and I-95). Meanwhile, two east-west running, three-lane interstates move evacuees across the grid horizontally (i.e., I-75 and I-4), while eight two-lane highways move inland residents onto the coastal interstates where they flee to safety. Here we examine the influence of adding contraflow on these highways and interstates.
Evacuation rates and traffic are shown when adding one lane on I-95 and I-75, and one, two, and three lanes across the entire road network (Table 3). This simplified version of contraflow improves evacuation rates across all scenarios, matching the known effectiveness of the evacuation management strategy. Adding lanes everywhere is more effective than adding lanes on one highway, consistent with other studies (e.g., discussion of contraflow effectiveness in Murray-Tuite et al. 2019). Opening three lanes of contraflow before Irma increases evacuation rates by 1.9%. For comparison, experiments reducing the number of cars on roads by one-fifth and one-thirds (relative to baseline) increase evacuation rates by 1.7% and 2.2%, respectively.
| Experiments | Results | |||||||
|---|---|---|---|---|---|---|---|---|
| Storm | Contraflow (lanes added) | Evacuation rates | % Change relative to baseline | Evacuated | % Under evacuation orders who evacuated | % Not under evacuation orders who evacuated | % Unsuccessful evacuation due to traffic | Unsuccessful evacuation due to traffic |
| Irma | Baseline | 32.0 | 0 | 5.24 m | 34.9 | 25.6 | 2.5 | 409 k |
| I-95 | 32.1 | 5.26 m | 35.0 | 25.8 | 2.4 | 393 k | ||
| I-75 | 32.0 | 0 | 5.24 m | 34.9 | 25.6 | 2.5 | 409 k | |
| all | 32.7 | 5.36 m | 35.7 | 26.0 | 1.9 | 311 k | ||
| all | 33.5 | 5.49 m | 36.3 | 27.2 | 1.0 | 163 k | ||
| all | 33.9 | 5.56 m | 36.8 | 27.4 | 0.7 | 115 k | ||
| Dorian | Baseline | 12.0 | 0 | 1.97 m | 35.4 | 4.3 | 0.7 | 115 k |
| I-95 | 12.2 | 2.0 m | 36.3 | 3.8 | 0.5 | 82 k | ||
| I-75 | 12.0 | 0 | 1.97 m | 35.5 | 4.3 | 0.7 | 115 k | |
| all | 12.1 | 1.98 m | 36.2 | 4.3 | 0.5 | 82 k | ||
| all | 12.3 | 2.02 m | 36.7 | 4.3 | 0.3 | 49 k | ||
| all | 12.3 | 2.02 m | 36.9 | 4.3 | 0.3 | 49 k | ||
| Irma-RO | Baseline | 26.3 | 0 | 4.31 m | 28.8 | 25.3 | 7.7 | 1.26 m |
| I-95 | 27.1 | 4.44 m | 29.2 | 23.2 | 6.9 | 1.13 m | ||
| I-75 | 26.3 | 0 | 4.31 m | 28.8 | 22.1 | 7.6 | 1.25 m | |
| all | 28.0 | 4.59 m | 30.6 | 23.5 | 5.9 | 967 k | ||
| all | 29.3 | 4.80 m | 31.8 | 25.0 | 4.7 | 770 k | ||
| all | 29.8 | 4.88 m | 32.6 | 25.0 | 4.2 | 688 k | ||
Note: Bold values were meant to serve as a reference point for comparison.
The magnitude of improvements from this simple version of contraflow are forecast-scenario-dependent (Table 3). For example, relative to the baseline simulations, adding three lanes increases evacuation rates by 1.9% with Irma, 0.3% with Dorian, and 3.5% with Irma-RO. In terms of areas impacted (Fig. 5), contraflow improves heavily trafficked areas in the baseline scenarios (i.e., urban areas and areas dependent on traffic upstream like south Florida). This is consistent with the evacuation demand experiments changing the number of cars on roads, and suggests evacuation management strategies are most effective in the heavily trafficked scenarios and regions.

Evacuation Order Timing
Regarding evacuation orders, there are modeling studies investigating how to optimize evacuation order timing to support decision-makers [e.g., see summary in Yi et al. (2017); examples in Dixit and Radwan (2009) and Davidson (2018); clearance time studies in Florida Statewide Regional Evacuation Study Program (2019)]. Though we are not optimizing FLEE’s evacuation orders, we provide a first-order exploration of the importance of evacuation order timing in FLEE, specifically by issuing orders 10 and 20 h earlier and later than the baseline simulations across all grid cells, and observing the effects on evacuations.
When averaged across all grid cells, shifting the timing of evacuation orders did not meaningfully impact evacuation rates and traffic. The largest changes occurred with Irma-RO; however, evacuation rates only improved by 0.8%, 0.8%, 0.2%, and 0.1% for the 20 h earlier, 10 h earlier, 10 h later, and 20 h later experiments, respectively (not shown). At this scale, these effects are much smaller than implementing contraflow.
However, between grid cells, evacuation order timing has complex—but sometimes significant—impacts (Fig. 6). For example, during Irma, later evacuation orders improve evacuation rates around Tampa Bay-St. Petersburg by 3%–6%, and reduce evacuation rates along the northwest coastline and Jacksonville metroplex by 5%–11%. The latter is actually a positive, however, as the later evacuation order thresholds caused evacuation orders to not be issued in this area, as the forecast risk shifted westward, removing Jacksonville from harm’s way. In this way, FLEE captures the tradeoff between issuing evacuation orders earlier (earlier warnings) versus waiting (reduction in false alarms). Similar impacts occur with Dorian, where later evacuation orders reduced evacuation rates, and subsequently, false alarms. With Irma-RO, earlier orders helps generally (but also increases false alarms), while later evacuation orders again exhibits localized effects (e.g., it improves evacuation rates inland but worsens evacuations along coastal grid cells).

Relative to experiments changing the number of cars on the road and contraflow, evacuation order timing has less impact on evacuation rates and traffic overall, which differs from some other studies (e.g., Dixit and Radwan 2009; Chiu et al. 2008). That’s not to say it is unimportant in FLEE, however, as evacuation order timing has significant but localized effects on evacuations that varies considerably across scenarios. Reasons for the discrepancy with previous studies might include that evacuation orders are earlier in FLEE’s order of operations between subsystems, or that FLEE has a more complex representation of forecasts and their influence on evacuation decisions. Future work may consider studying these complex effects by shifting evacuation order timing at specific areas in FLEE, studying more forecast scenarios, and/or by implementing phased evacuations (e.g., building on Chiu et al. 2008; Chen and Zhan 2008; Zhang and Chang 2014).
Population Growth and Distribution
To our knowledge, no studies directly explore how US hurricane evacuations may change with population growth and changing the distributions of households. In this section, we begin to explore these effects by increasing FLEE’s Florida peninsula population from 16.9 million in 2020 to 2030 and 2040 projections of 19.3 million and 22.3 million, respectively [see Figs. 7(g and h) for population increase by grid cell; projections in Florida DOT 2020]. Meanwhile, a third experiment representing the potential effects of deurbanization is conducted by making the population density uniform across the model grid. Together, these experiments begin to look at how evacuations may change with population characteristics and how that compares with other experiments.

Evacuation statistics are shown for this set of experiments in Table 4. Results suggest that evacuations may worsen in the future due to projected population changes. For example, relative to the baseline simulation, Irma’s evacuation rates decrease by 1.3% and 3.3% in 2030 and 2040, respectively. Relative to the evacuation management strategies tested earlier, the changes are significant, e.g., adding three lanes of contraflow increases evacuation rates by 1.9%. Lastly, making population density uniform across the model grid improves evacuations overall.
| Experiments | Results | |||||||
|---|---|---|---|---|---|---|---|---|
| Storm | Population growth and distribution | Evacuation rates | % Change relative to baseline | Evacuated | % Under evacuation orders who evacuated | % Not under evacuation orders but evacuated | % Unsuccessful evacuation due to traffic | Unsuccessful evacuation due to traffic |
| Irma | Baseline | 32.0 | 0 | 5.24 m | 34.9 | 25.6 | 2.5 | 409 k |
| Uniform | 33.6 | 5.51 m | 36.7 | 29.8 | 2.6 | 426 k | ||
| 2030 | 30.7 | 5.93 m | 33.3 | 24.9 | 3.6 | 695 k | ||
| 2040 | 28.7 | 6.38 m | 31.8 | 22.1 | 5.5 | 1.22 m | ||
| Dorian | Baseline | 12.0 | 0 | 1.97 m | 35.4 | 4.3 | 0.7 | 115 k |
| Uniform | 11.2 | 1.84 m | 36.4 | 3.8 | 0.6 | 98 k | ||
| 2030 | 11.6 | 2.24 m | 34.1 | 4.4 | 1.0 | 193 k | ||
| 2040 | 11.2 | 2.49 m | 32.7 | 4.5 | 1.5 | 333 k | ||
| Irma-RO | Baseline | 26.3 | 0 | 4.31 m | 28.8 | 25.3 | 7.7 | 1.26 m |
| Uniform | 29.2 | 4.79 m | 32.0 | 26.7 | 6.0 | 983 m | ||
| 2030 | 23.7 | 4.58 m | 28.1 | 20.0 | 10.0 | 1.93 m | ||
| 2040 | 21.9 | 4.87 m | 23.6 | 21.7 | 11.7 | 2.61 m | ||
Note: Bold values were meant to serve as a reference point for comparison.
As with contraflow, the impacts of population growth and uniform population distributions are scenario dependent. For example, the 2040 experiments result in a 3.3% decrease in evacuation rates with Irma, a 0.8% decrease with Dorian, and a 4.4% decrease with Irma-RO, i.e., the heavily trafficked scenarios are most sensitive to these experiments.
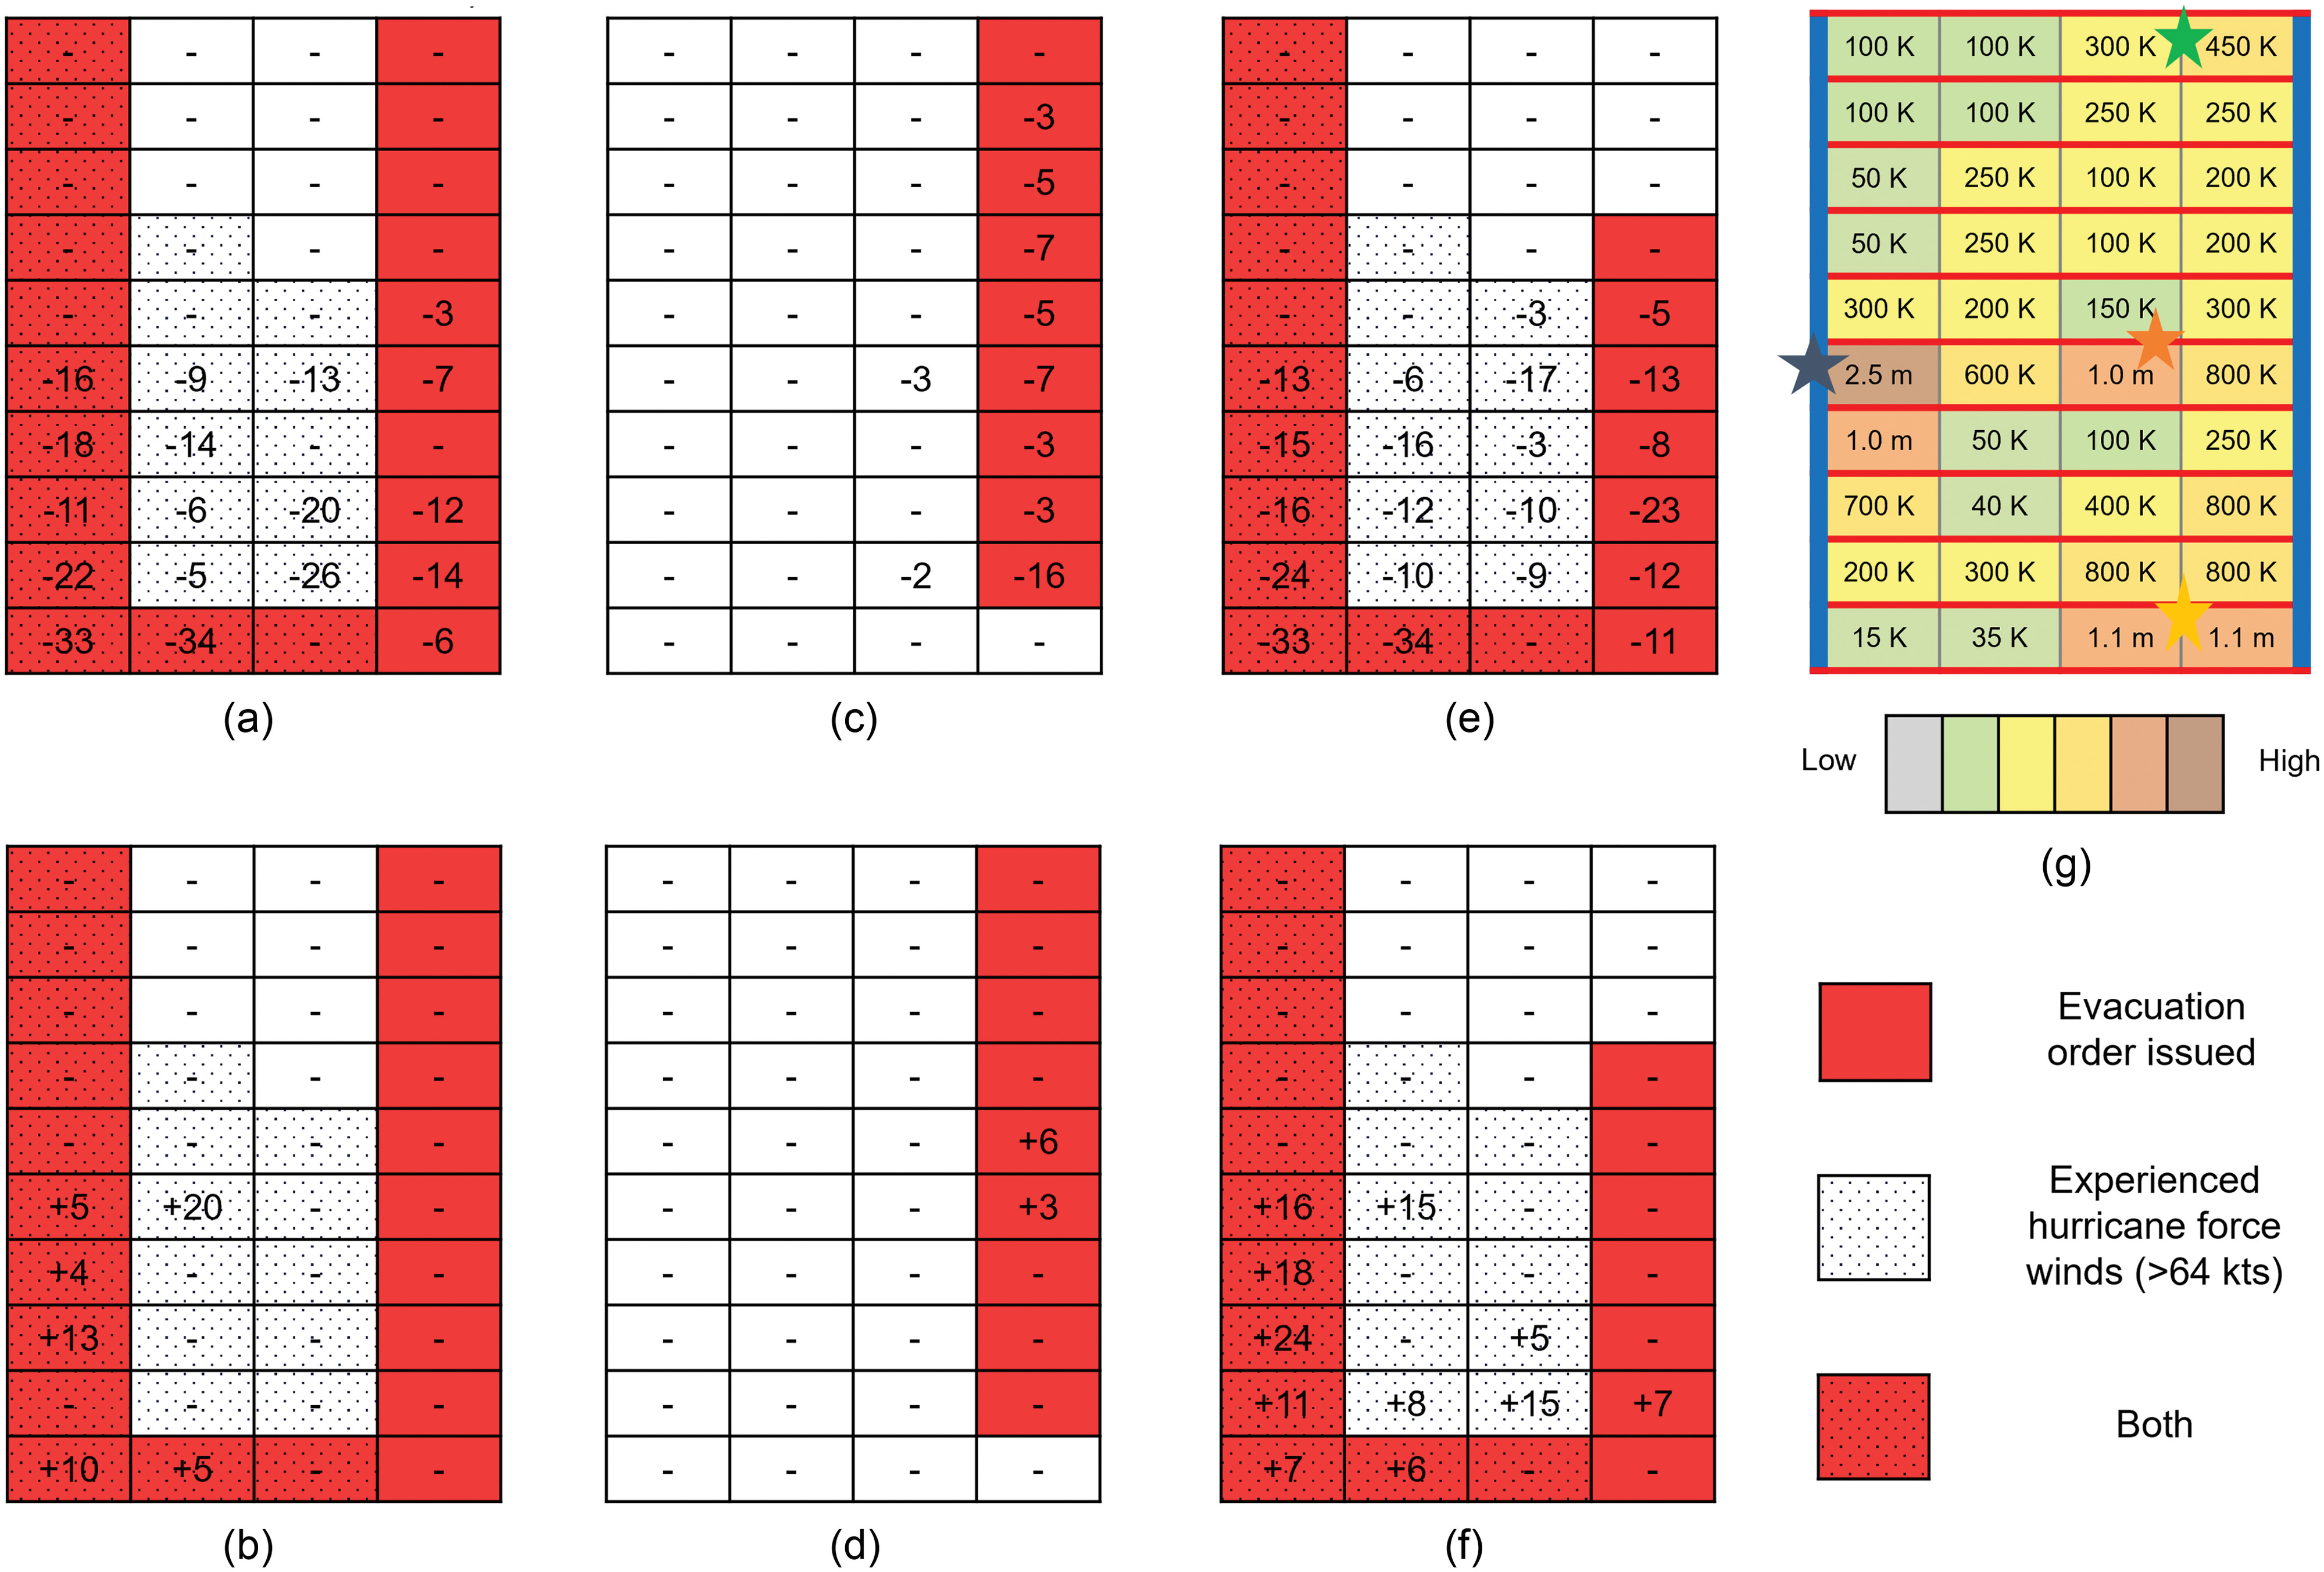
Fig. 7 shows the change in evacuation rates and traffic by grid cell. In the Irma and Irma-RO scenarios, evacuation worsen in 2030 and 2040 across the southern half of the model, with notable impacts surrounding Tampa Bay-St. Petersburg and Miami-Ft. Lauderdale. This also occurs in Dorian, though to a lesser extent, mainly in the areas at risk [Figs. 7(c and d); red cells] that are most upstream, i.e., southern portions of the areas at risk.
Results suggest that, in the absence of other changes, population growth may worsen future evacuations by adding more vehicles on the roads. Its impacts may be most significant in heavily trafficked, rapid onset forecast scenarios, and across south Florida, which is further upstream with respect to traffic flow. With population growth or demographic shifts more generally, additional evacuation management strategies may be especially important in certain geographic areas, depending on the storm scenario.
Summary and Conclusions
After presenting a comparison of simulated evacuation outcomes with empirical data for two real storms, this analysis began to explore targeted aspects of the hurricane-forecast-evacuation system dynamics using an agent-based, computational framework capable of exploring how the natural-human-built environment sub-systems influence evacuation outcomes. By changing certain model parameters one-by-one, we investigate, to a first order, how evacuations are hindered and improved when changing the number of cars on the road network (changing evacuation demand), when implementing approximations to different evacuation management strategies and policies (contraflow, evacuation order timing), and when changing population characteristics (population growth and distribution). Experiments are conducted for two real forecast scenarios (Irma, Dorian) and one simulated storm (rapid-onset version of Irma).
In analyzing the results, we ask and answer the following questions:
1.
How do these simulated changes hinder or improve overall evacuation success and how do they compare with each other? Overall, evacuations may be less successful (perhaps exponentially) if households use more cars to evacuate the same number of people, or if the at-risk populations increase with population growth. On the other hand, evacuations generally improve when contraflow is implemented or when evacuation demand is reduced. Though having significant localized effects, shifting evacuation order timing has less impact on evacuation success overall than other simulated changes.
2.
How do these simulated changes vary across forecast scenarios, regions, and different areas of impact? We find evidence that evacuations during rapid-onset scenarios are considerably less successful in the highest impacted areas, and that impacts from the simulated changes—both those hindering and improving evacuations—are largest in these rapid onset events. Regionally, the most heavily trafficked areas (e.g., urban areas at-risk and places upstream of traffic) benefit from evacuation management strategies and policies the most (contraflow, reducing evacuation demand), suggesting potential benefits of targeted interventions.
Together, these results demonstrate how agent-based frameworks like FLEE can be powerful virtual laboratories capable of investigating aspects of the system dynamics across many scenarios, real or synthetic. The findings presented are not intended to be definitive. Rather, they provide a foundation for this type of work exploring the system dynamics computationally, and for testing the effectiveness of evacuation management strategies and policies prior to implementing them in the real world when the stakes are high.
There are several challenges and opportunities to improve FLEE and increase its utility in evacuation planning and practice. This includes:
1.
Conducting additional tests and validation—As empirical data on real-world evacuations becomes increasingly available, that information can be codified into FLEE and used to validate the model. For example, recent Hurricane Ian (2022) provides new opportunities to validate (and improve) FLEE. This increases FLEE’s realism, and subsequently, its ability to answer questions of interest.
2.
Improving the model resolution—FLEE’s spatial resolution, for example, should be improved to better represent the actual distribution of households, road networks, and cities.
3.
Improving computational run-time—The modeling framework is computationally expensive, requiring 3–5 days of real-time to run a single simulation on a personal computer. Improving FLEE’s computational efficiency would allow for running many additional experiments, increasing the model resolution, and incorporating other features relevant to evacuations, such as simulating the challenges of implementing evacuation management strategies (e.g., contraflow is time sensitive and requires significant resources and planning).
Other applications for computational modeling frameworks like FLEE include using them to explore how changes in forecast track and intensity influences evacuations. The idea is to demonstrate how these types of models can provide a societally relevant complement to traditional measures of forecast accuracy, by measuring the impact of forecast errors on evacuation success [need described by Morss (2005), Murphy (1993), and Roebber and Bosart (1996)]. Furthermore, this type of modeling framework can be extended to other hazards where evacuation traffic is a concern, such as wildfires. Though this requires customizing FLEE’s details and design, the principles of agent-based models are broadly and readily extendable to these phenomena.
As we continue to develop computational frameworks like FLEE and improve their ability to answer questions of interest, this area of research can support practitioners, policymakers, and scholars in hazard risk management and related disciplines. Practitioners could use the models to explore evacuation outcomes under many different scenarios and improve our knowledge of which strategies are most effective, when, and where. FLEE will be especially helpful for decision-makers once the models are capable of running in pseudo real-time. Policymakers could use the models to identify resource needs in future climate-population scenarios. Meanwhile, researchers can benefit from many aspects of knowledge building using the modeling frameworks, including studying how these different physical-social factors combine to produce evacuation outcomes, cultivating important cross-disciplinary understanding (Bostrom et al. 2016).
Appendix. Notes on Model Validation and Updates
In Table 5, we overview the empirical information used to validate FLEE. Then, we describe FLEE’s model improvements inspired by the validation in Table 6, including showing the percentage of coastal grid cells now receiving evacuation orders in the updated model (Fig. 8). These updated values are based on the percentage of the Florida population estimated to reside in an evacuation zone, as derived from Fig. 2 of Wong et al. (2018), Florida Department of Emergency Management (personal communication), and Fig. 1 of Darzi et al. (2021).
| Information category | Storm | Data specifics | Sources |
|---|---|---|---|
| Evacuation orders | Irma | Counties, evacuation zones | Fig. 2 of Wong et al. (2018), Florida Department of Emergency Management (personal communication), Fig. 1 of Darzi et al. (2021) |
| Dorian | Counties, evacuation zones | Roache (2019) | |
| Evacuation rates | Irma | By region | Fig. 4 of Wong et al. (2018) |
| Irma | By voting precinct | Fig. 1(c) of Long et al. (2020) | |
| Irma | By county | Table 10 of Martin et al. (2020) | |
| Irma | By state | Florida Department of Emergency Management (2017), Fig. 6 of Wong et al. (2018), and Fig. 2(c) of Long et al. (2020) | |
| Irma | By city | Feng and Lin (2021) | |
| Dorian | Storm total | Mongold et al. (2020) | |
| Evacuation traffic | Irma | Areas/times of congestion | Page 15 of Wong et al. (2018), Ghorbanzadeh et al. (2021), and Staes et al. (2021) |
| Irma | Total numbers stuck | Feng and Lin (2021) |
| Original parameters | Updated parameters | Intended effect |
|---|---|---|
| Instantaneous communication—forecast information were received immediately by households to begin the evacuation decision-making process | Households are randomly assigned a value between 0 and 24 h. This is the amount of time before households begin making evacuation decisions. The value is a best guess–sensitivity analysis suggests the exact value does not significantly impact evacuations | To provide a more realistic, slower representation of information diffusion through the population (e.g., see Watts et al. 2019) |
| Evacuation barriers (car ownership, socioeconomic status) are static and do not change | Evacuation barriers are raised by 36 h initially and decrease linearly to their original values in Harris et al. (2021) by 54 h before landfall | This effectively increases risk perception over time, which helps prevent too many people from evacuating early in the simulations, e.g., upstate and inland in the Irma and Dorian simulations |
| Mobile home ownership weighting in household evacuation decision-making algorithm: Random between 0 and 10 | Mobile home ownership weighting in household evacuation decision-making algorithm: Random between 0 and 0.5 | To reduce the impact of mobile home ownership relative to other decision-making inputs. In turn, this minimized excess variability in evacuation rates between neighboring grid cells, particularly inland |
| Socioeconomic status weighting in household evacuation decision-making algorithm: Random between 5 and 125 | Socioeconomic status weighting in household evacuation decision-making algorithm: Random between 5 and 109 | To reduce excess variability in evacuation rates between neighboring grid cells, particularly inland |
Data Availability Statement
All input data and model code generated and used during the study are available in a repository or online in accordance with funder data retention policies. The model code was created using the Fortran programming language. The commented code, an ODD specification (a formal, detailed model description), and supporting input files are available for download at the CoMSES model library (https://www.comses.net/codebase-release/4cd05855-f387-48bd-8899-9d62375518cb/).
Acknowledgments
This material is based upon work supported by the National Science Foundation under Grant No. 2100801. The authors thank NSF for their support.
Author contributions: A. H., P. R., and R. M. designed the research; A. H. and P. R. created the built environment components of the model; R. M. and A. H. built the human system elements of the model; A. H., R. M., and P. R. analyzed the data; A. H. wrote the paper with R. M. and P. R. providing edits.
References
Barton, C. M. 2014. “Complexity, social complexity, and modeling.” J. Archaeol. Method Theory 21 (2): 306–324. https://doi.org/10.1007/s10816-013-9187-2.
Blanton, B., K. Dresback, B. Colle, R. Kolar, H. Vergara, Y. Hong, N. Leonardo, R. Davidson, L. Nozick, and T. Wachtendorf. 2018. “An integrated scenario ensemble-based framework for hurricane evacuation modeling: Part 2—Hazard modeling.” Risk Anal. 40 (1): 117–133. https://doi.org/10.1111/risa.13004.
Bostrom, A., R. E. Morss, J. K. Lazo, J. L. Demuth, H. Lazrus, and R. Hudson. 2016. “A mental models study of hurricane forecast and warning production, communication, and decision-making.” Weather Clim. Soc. 8 (2): 111–129. https://doi.org/10.1175/WCAS-D-15-0033.1.
Bullard, R., and B. Wright. 2011. Race, place, and environmental justice after Hurricane Katrina: Struggles to reclaim, rebuild, and revitalize New Orleans and the gulf coast. Boulder, CO: Westview Press.
Chen, X., and F. B. Zhan. 2008. “Agent-based modelling and simulation of urban evacuation: Relative effectiveness of simultaneous and staged evacuation strategies.” J. Oper. Res. Soc. 59 (1): 25–33. https://doi.org/10.1057/palgrave.jors.2602321.
Chiu, Y.-C., H. Zheng, J. A. Villalobos, W. G. Peacock, and R. Henk. 2008. “Evaluating regional contra-flow and phased evacuation strategies for Texas using a large-scale dynamic traffic simulation and assignment approach.” J. Homeland Secur. Emerg. Manage. 5 (1): 1547–7355. https://doi.org/10.2202/1547-7355.1409.
Darzi, A., V. Frias-Martinez, S. Ghader, H. Younes, and L. Zhang. 2021. “Constructing evacuation evolution patterns and decisions using mobile device location data: A case study of hurricane Irma.” Preprint, submitted February 24, 2021. https://arxiv.org/abs/2102.12600.
Davidson, R., et al. 2018. “An integrated scenario ensemble-based framework for hurricane evacuation modeling: Part 1—Decision support system.” Risk Anal. 40 (1): 97–116. https://doi.org/10.1111/risa.12990.
Dixit, V. V., and E. Radwan. 2009. “Optimal scheduling of evacuation orders for cities.” In Proc., 88th Annual Meeting of the Transportation Research Board. Washington, DC: Transportation Research Board.
Dixon, D. S., P. Mozumder, W. F. Vasquez, and H. Gladwin. 2017. “Heterogeneity within and across households in hurricane evacuation response.” Networks Spatial Econ. 17 (2): 645–680. https://doi.org/10.1007/s11067-017-9339-0.
FDEM (Florida Division of Emergency Management). 2018. “Regional emergency management liaison team.” Accessed August 20, 2022. https://www.floridadisaster.org/dem/directors-office/regions/.
Feng, K., and N. Lin. 2021. “Reconstructing and analyzing the traffic flow during evacuation in Hurricane Irma (2017).” Transp. Res. Part D: Transp. Environ. 94 (May): 102788. https://doi.org/10.1016/j.trd.2021.102788.
Florida DOT (Florida Department of Transportation). 2020. “Technical memorandum projections of Florida population by county, 2020–2070.” Accessed August 20, 2022. https://www.fdot.gov/planning/demographic/baseline.shtm.
Florida Statewide Regional Evacuation Study Program. 2019. “Regional evacuation transportation analysis. Technical data report South Florida region.” Accessed August 20, 2022. http://sfregionalcouncil.org/wp-content/uploads/2019/08/Vol1-11_ChVI.pdf.
Gehlot, H., X. Zhan, X. Qian, and C. Thompson. 2018. “A-RESCUE 2.0: A high-fidelity, parallel, agent-based evacuation simulator.” J. Comput. Civ. Eng. 33 (2): 04018059. https://doi.org/10.1061/(ASCE)CP.1943-5487.0000802.
Ghorbanzadeh, M., S. Burns, L. V. Rugminiamma, E. Erman Ozguven, and W. Huang. 2021. “Spatiotemporal analysis of highway traffic patterns in hurricane Irma evacuation.” Transp. Res. Rec. 2675 (9): 321–334. https://doi.org/10.1177/03611981211001870.
Harris, A. R., P. J. Roebber, and R. E. Morss. 2021. “An agent-based modeling framework for examining the dynamics of the hurricane-forecast-evacuation system.” Int. J. Disaster Risk Reduct. 67 (Jan): 102669. https://doi.org/10.1016/j.ijdrr.2021.102669.
Huang, S.-K., M. K. Lindell, and C. S. Prater. 2016. “Who leaves and who stays? A review and statistical meta-analysis of hurricane evacuation studies.” Environ. Behav. 48 (8): 991–1029. https://doi.org/10.1177/0013916515578485.
Lindell, M. K., and R. W. Perry. 2012. “The protective action decision model: Theoretical modifications and additional evidence.” Risk Anal. 32 (4): 616–632. https://doi.org/10.1111/j.1539-6924.2011.01647.x.
Long, E. F., M. K. Chen, and R. Rohla. 2020. “Political storms: Emergent partisan skepticism of hurricane risks.” Sci. Adv. 6 (37): eabb7906. https://doi.org/10.1126/sciadv.abb7906.
Martin, Y., S. L. Cutter, and Z. Li. 2020. “Bridging twitter and survey data for evacuation assessment of Hurricane Matthew and Hurricane Irma.” Nat. Hazard. Rev. 21 (2): 04020003. https://doi.org/10.1061/(ASCE)NH.1527-6996.0000354.
McGhee, C. C., and M. C. Grimes. 2006. An operational analysis of the Hampton roads hurricane evacuation traffic control plan. Richmond, VA: Virginia DOT.
Miller, J. H., and S. E. Page. 2007. Complex adaptive systems: An introduction to computational models of social life. Princeton, NJ: Princeton University Press.
Mongold, E., R. A. Davidson, J. Trivedi, S. DeYoung, T. Wachtendorf, and P. Anyidoho. 2020. “Hurricane evacuation beliefs and behaviour of inland vs. coastal populations.” Environ. Hazards 20 (4): 363–381. https://doi.org/10.1080/17477891.2020.1829531.
Morss, R. E. 2005. “Problem definition in atmospheric science public policy: The example of observing-system design for weather prediction.” Bull. Am. Meteorol. Soc. 86 (2): 181–192. https://doi.org/10.1175/BAMS-86-2-181.
Morss, R. E., et al. 2017. “Hazardous weather prediction and communication in the modern information environment.” Bull. Am. Meteorol. Soc. 98 (12): 2653–2674. https://doi.org/10.1175/BAMS-D-16-0058.1.
Murphy, A. H. 1993. “What is a good forecast? An essay on the nature of goodness in weather forecasting.” Weather Forecasting 8 (2): 281–293. https://doi.org/10.1175/1520-0434(1993)008%3C0281:WIAGFA%3E2.0.CO;2.
Murray-Tuite, P., M. K. Lindell, B. Wolshon, and E. J. Baker. 2019. Large-scale evacuation: The analysis, modeling, and management of emergency relocation from hazardous area. 1st ed. New York: Taylor & Francis.
Roache, M. 2019. “At least 1 million people in these counties are under evacuation orders as Hurricane Dorian approaches.” Accessed August 20, 2022. https://time.com/5666941/hurrican-dorian-evacuation-orders-counties/.
Roebber, P. J., and L. F. Bosart. 1996. “The complex relationship between forecast skill and forecast value: A real-world analysis.” Weather Forecasting 11 (4): 544–559. https://doi.org/10.1175/1520-0434(1996)011%3C0544:TCRBFS%3E2.0.CO;2.
Staes, B., N. Menon, and R. L. Bertini. 2021. “Analyzing transportation network performance during emergency evacuations: Evidence from Hurricane Irma.” Transp. Res.Part D: Transp. Environ. 95 (Jun): 102841. https://doi.org/10.1016/j.trd.2021.102841.
Swamy, R., J. E. Kang, R. Batta, and Y. Chung. 2017. “Hurricane evacuation planning using public transportation.” Socio-Econ. Plann. Sci. 59 (Sep): 43–55. https://doi.org/10.1016/j.seps.2016.10.009.
Ukkusuri, S. V., S. Hasan, B. Luong, K. Doan, X. Zhan, P. Murray-Tuite, and W. Yin. 2017. “ARESCUE: An agent based regional evacuation simulator coupled with user enriched behavior.” Networks Spatial Econ. 17 (1): 197–223. https://doi.org/10.1007/s11067-016-9323-0.
Watts, J., R. E. Morss, C. M. Barton, and J. L. Demuth. 2019. “Conceptualizing and implementing an agent-based model of information flow and decision making during hurricane threats.” Environ. Modell. Software 122 (Dec): 104524. https://doi.org/10.1016/j.envsoft.2019.104524.
Wolshon, B., and L. Lambert. 2004. Convertible roadways and lanes. Washington, DC: Transportation Research Board, National Research Council.
Wong, S., S. Shaheen, and J. Walker. 2018. Understanding evacuee behavior: A case study of hurricane Irma. Berkeley, CA: Transportation Sustainability Research Center.
Yi, W., L. K. Nozick, R. A. Davidson, B. Blanton, and B. A. Colle. 2017. “Optimization of the issuance of evacuation orders under evolving hurricane conditions.” Transp. Res. Part B: Methodol. 95 (Jan): 285–304. https://doi.org/10.1016/j.trb.2016.10.008.
Yin, W., P. Murray-Tuite, S. V. Ukkusuri, and H. Gladwin. 2014. “An agent-based modeling system for travel demand simulation for hurricane evacuation.” Transp. Res. Part C: Emerging Technol. 42 (May): 44–59. https://doi.org/10.1016/j.trc.2014.02.015.
Zhang, F., et al. 2007. “An in-person survey investigating public perceptions of and response to Hurricane Rita forecasts along the Texas Coast.” Weather Forecasting 22 (6): 1177–1190. https://doi.org/10.1175/2007WAF2006118.1.
Zhang, X., and G. Chang. 2014. “A transit-based evacuation model for metropolitan areas.” J. Public Transp. 17 (3): 129–147. https://doi.org/10.5038/2375-0901.17.3.9.
Information & Authors
Information
Published In

Natural Hazards Review
Volume 24 • Issue 4 • November 2023
Copyright
This work is made available under the terms of the Creative Commons Attribution 4.0 International license, https://creativecommons.org/licenses/by/4.0/.
History
Received: May 4, 2022
Accepted: May 23, 2023
Published online: Jul 31, 2023
Published in print: Nov 1, 2023
Discussion open until: Dec 31, 2023
ASCE Technical Topics:
- Business management
- Diagnosis
- Disaster preparedness
- Disaster risk management
- Disaster warning systems
- Engineering fundamentals
- Evacuation
- Forecasting
- Forensic engineering
- Highway and road management
- Highway transportation
- Information systems
- Infrastructure
- Mathematics
- Models (by type)
- Population projection
- Practice and Profession
- Statistics
- Structural engineering
- Sustainable development
- Systems engineering
- Traffic models
- Transportation engineering
Authors
Metrics & Citations
Metrics
Citations
Download citation
If you have the appropriate software installed, you can download article citation data to the citation manager of your choice. Simply select your manager software from the list below and click Download.
Cited by
- Jeannette Sutton, Hamilton Bean, Lori Peek, Erica Kuligowski, Michele Wood, The Legacy of Dennis S. Mileti and the Future of Public Alert and Warning Research, Natural Hazards Review, 10.1061/NHREFO.NHENG-2113, 25, 3, (2024).