Impact of Youth Education on Green Stormwater Infrastructure Recommendations to Increase Equity and Resilience in Marginalized Communities
Publication: Journal of Water Resources Planning and Management
Volume 150, Issue 9
Abstract
Marginalized communities disproportionately experience the impacts of climate change, including more intense flooding and longer recovery times from disasters. Youth, particularly those belonging to marginalized communities, are consistently underrepresented in infrastructure planning decisions despite being the group most impacted by the long time scales of climate change, water management, and community infrastructure decisions. This paper investigates the novel perspectives that youth bring to planning processes and resulting impacts on recommendations for green stormwater infrastructure solutions to address flooding and community-scale factors important to achieving disaster resilience. Particular attention is paid to the infrastructure benefits prioritized by youth and characteristics of selected locations for infrastructure solutions. Further, the capabilities possessed by youth to effectively advocate for specific community infrastructure changes are not well researched, and the education and resources required to transform youth advocacy into action are not well understood. Through mixed methods, including quantitative and qualitative data and analysis, this paper explores the impact of youth education on building advocacy and the ability to create implementable stormwater infrastructure designs. The research is based on the development and implementation of a new interdisciplinary program called Youth Advocacy for Resilience to Disasters (YARDs). Funded by the National Science Foundation, the YARDs program teaches youth about natural disasters, resilience, data communication, green infrastructure, and presentation skills. The curriculum was developed by interdisciplinary researcher teams, combining civil engineering, sociology, urban planning, digital media, and education research. The program was piloted as a weeklong summer program for middle school students, and later implemented as a semester-long program. Both implementations focused on students developing green infrastructure recommendations that address flooding and other student-identified risks to communicate to community decision makers. The methods are readily transferable to other potential youth programs in areas impacted by flooding with expansion to additional communities facing different combinations of disasters.
Introduction
Many communities across the world are experiencing more frequent and intense flooding events that are affecting stormwater infrastructure due to climate change (Brody et al. 2011). Stormwater systems are designed under the assumption of stationary precipitation extremes, so with a 10% increase in rainfall in the US since 1910, systems need to meet higher demands than their original designs (Rosenberg et al. 2010). The increased demand put on stormwater systems is leading to a greater interest and investment in stormwater infrastructure (Pierce et al. 2021). Infrastructure is a critical aspect of community resilience (Johansen et al. 2017). However, in building new stormwater infrastructure, communities must decide where and what type of infrastructure to design and implement. Many potentially competing factors, including cost, benefits, site conditions, local community factors, and other long-term impacts, contribute to the decision. Further, due to historical lack of investment in quality stormwater infrastructure, marginalized communities often face greater flooding impacts and tend to have longer recovery times for disasters (Shonkoff et al. 2011). Thus, the need to develop and implement more resilient stormwater infrastructure solutions such as green infrastructure to respond to climate change is particularly pressing for marginalized communities. Previous research has shown that different priorities across community stakeholders will lead to varying recommendations in placing and designing stormwater solutions to increase resilience (Reckner and Tien 2023). Additionally, stormwater system analysis education has been found to vary across engineers and planners (Rosenberg et al. 2017). Therefore, it is important to incorporate diverse stakeholder feedback and perspectives into the stormwater infrastructure planning and design process.
Among community stakeholders, youth are consistently underrepresented in discussions of future community planning, even though they are often seen as the future of their community (McKoy and Vincent 2007). Eighty percent of young adults will live within 161 km (100 mi) of where they grew up, with that percentage being even higher in low-income communities (Sprung-Keyser et al. 2022). Therefore, it is crucial to engage youth in community planning and management decisions. Current case studies that invoke stakeholder participation in stormwater planning focus on speaking with community leaders or holding public forums (Barclay and Klotz 2019). However, neither of these avenues directly engage with youth. Civic education is one of the best ways to engage youth in political discussion (Kahne and Sporte 2008). Youth, especially those part of marginalized communities, that go through politically related extracurricular programs are more likely to stay engaged in politics when they get older (McFarland and Thomas 2006). With the high proportion of youth in a community likely staying in that community, it is imperative that youth voices be represented in community decision-making. Youth are the current and future members of their communities, so it is crucial to have them engaged in decisions that will affect the community’s future. This is particularly important for decisions around stormwater infrastructure in flood-prone communities, which affects both critical water resources and community resilience to disasters and storms.
Among stormwater infrastructure solutions, decision makers often make choices between green and gray stormwater infrastructure designs in their communities. Green infrastructure includes nature-based solutions that can incorporate more community-focused benefits in addition to flooding (Shafique and Kim 2017). Gray infrastructure solutions are traditional, hard-scaped systems built with the main objective of reducing flooding impacts (Wang et al. 2023). With multiple options for flood infrastructure solutions that consider a range of variables and community benefits, there is the opportunity for infrastructure investments to improve community outcomes across resilience, sustainability, and equity objectives (Tien 2022). Although green infrastructure is becoming more widely used, there is currently no consistent methodology in the literature for implementing green stormwater infrastructure systems, which leaves planners unclear on what guidance to follow (Monteiro et al. 2020). There exists room in green infrastructure planning to incorporate youth perspectives, but there is little prior literature that explores the efficacy of youth in providing perspectives on stormwater infrastructure investments.
In this paper, the authors seek to understand the unique perspectives of youth, especially youth of color, in stormwater infrastructure planning. This research is based on the development and implementation of a new interdisciplinary program called Youth Advocacy for Resilience to Disasters (YARDs). Funded by the National Science Foundation, the YARDs program teaches youth about natural disasters, resilience, data communication, green infrastructure, presentation skills, and more. The curriculum was developed by researchers across disciplines, including civil engineering, sociology, urban planning, digital media, and engineering education. The program was first piloted as a weeklong summer program that included middle school students (rising sixth through eighth graders), and later implemented as a semester-long after-school program (sixth through eighth graders). This paper investigates the novel perspectives of youth in developing recommendations for green stormwater infrastructure solutions to address flooding and community-scale factors of importance to achieving disaster resilience. These topics are addressed through exploring the following three main research questions throughout the paper:
1.
What are the types of infrastructure solutions that youth develop or generate through the YARDs program?
2.
How can the YARDs curriculum support youth in marginalized communities in understanding intersecting disasters and identifying infrastructure projects to address issues in their communities?
3.
How can advocating for these infrastructure projects through maps or posters enable youth and their communities to become more resilient?
Background
Community Planning for Climate Change
Planning for climate change is a national priority (The White House 2021) and has emerged strongly among federal, state, and local governments, and nongovernmental and professional institutions. Communities need to develop adaptation and resilience strategies to reduce the risks and impacts of climate change including sea-level rise and extreme flooding events (Becsi et al. 2020). Community planning in particular has been covered by a variety of recent literature focusing on needs for community stakeholder engagement particularly across diverse stakeholders to increase community resilience. For example, prior work highlights the need for community engagement (Susskind et al. 2020); collaboration (Stults and Larsen 2020); equity and social and environmental justice (Frantzeskaki et al. 2019; Goh 2020); adaptation, mitigation, and resilience (Becsi et al. 2020); sustainability (Smith et al. 2016); and local knowledge and expertise (Galvin et al. 2020).
According to Susskind et al. (2020), community engagement is critical for effective community planning for climate change and extreme events to include stakeholder voices and needs in planning and decision-making processes. This encourages robust collaborative support between local governments, community groups, and private sector organizations geared toward effective and equitable climate planning (Stults and Larsen 2020). Frantzeskaki et al. (2019) argue that community planning should be cognizant of the needs of marginalized communities and seek ways to reduce social inequities. Planning researchers have advocated for increased engagement in community governance and citizen-driven adaptation and resilience planning initiatives, in addition to climate change mitigation strategies (Hoff and Gausset 2015). In stormwater management, community leaders can engage their community through public perception surveys on attitudes toward varying types of infrastructure (Spahr et al. 2021).
However, there remains the ongoing need to incorporate and harness local knowledge and expertise in community planning processes (Drennan 2018). Residents and organizations often have valuable insights into specific risks and vulnerabilities (social, economic, and environmental) and opportunities (Reed et al. 2020) that could support effective climate change planning and decision-making (Tien et al. 2023). There is little literature, however, on the role of youth in providing such insights. Planning and environmental education—particularly focusing on youth in marginalized neighborhoods—is the beginning of a new era of climate awareness and could strengthen communities affected by climate change–related disasters by arming them with research and collaborative action needed to protect their communities (Dubois and Krasny 2016).
YARDs Curriculum
To address the need to engage youth in community planning processes for climate change, members of the research team developed a novel curriculum called YARDs. The interdisciplinary curriculum was the result of a collaboration across researchers currently and previously at the Georgia Institute of Technology and Savannah State University. The goal of YARDs is to empower marginalized youth to advocate for their communities that are at risk due to climate change. Through 14 different sessions, students are introduced to the topics of resilience, environmental justice, map making, civics, and flood infrastructure solutions with an emphasis on green infrastructure. The curriculum was piloted with two sets of middle school students in summer and fall 2022. The pilot programs were conducted in a southern US coastal community prone to flooding, hurricanes, heat waves, and other disasters.
The weeklong summer 2022 pilot program included 12 rising sixth through eighth grade students. The fall 2022 pilot program included 12 students in a Title I (i.e., containing a higher number of low-income students) middle school who participated in a 2-day-a-week 14-session after-school program. In both pilots, the program was facilitated through researchers and local teachers. Facilitators placed students into groups where they selected a site for an infrastructure project and designed a solution for identified risks at their site, with all groups at a minimum addressing flood risk. The resulting product for all student groups was a presentation on the location and design features for their infrastructure solution. The fall pilot program included a final showcase where students presented their solutions to community leaders, planners, and decision makers. In addition to their final design presentations, students were also invited to participate in surveys before and after the program, as well as focus group discussions as part of the YARDs program.
Although this study focuses on outcomes from implementations of the YARDs program, the objective is to explore the impact of youth education on community infrastructure planning processes, and the methods are readily transferable to other potential youth education programs in this area. The focus of YARDs is broadly on increasing community resilience to disasters. For the specific youth population engaged in the program, flood risk and infrastructure solutions to increase community resilience to flooding events are explored. These findings can be applied to other study areas impacted by flooding and populations experiencing increasing disaster events due to climate change, and where infrastructure solutions can provide improved water resources planning and management. In those cases, the specific mapping and data layers the students work with would differ based on community data availability, but the overall curricula on disasters, environmental justice, green infrastructure, and resilience would remain the same. In addition, other potential disaster events and types can be addressed, with employing the proposed mixed methods approach that combines both quantitative and qualitative data analysis providing an increased understanding of the impact of youth education curricula on creating implementable infrastructure designs, increasing youth advocacy, and supporting increased community resilience.
Green Stormwater Infrastructure
Marginalized communities, for whom the YARDs program is designed, are often found in low-lying communities and overall are more at risk to experience the effects of climate change (Sterzel et al. 2020). For marginalized communities, green infrastructure is often seen as a preferred flood protection option compared to gray infrastructure solutions because of its ability to address some of the other risks climate change presents in these communities, including high temperatures (Garcia-Cuerva et al. 2018). Green infrastructure can also benefit a community by increasing access to green space, providing educational opportunities, and improving air quality (Alves et al. 2018), benefits that are particularly impactful for historically marginalized communities (Garcia-Cuerva et al. 2018). Although green infrastructure can lead to potential green gentrification where bettering locations could lead to an influx of new, more affluent residents, driving up housing prices, engaging directly with diverse community perspectives in the green infrastructure designs, as the YARDs program seeks to do, helps limit potential green gentrifications (Jennings et al. 2019). Engaging the community in creating recommendations for green infrastructure solutions is a way to improve community health outcomes and resilience to disasters (Curran and Hamilton 2012).
For the YARDs curriculum, students were introduced to flooding and the role of green stormwater infrastructure to potentially reduce the negative impacts of flooding through engagement with a floodplain demonstration and accompanying curricula. The Ward’s Stormwater Floodplain Simulation System was used in combination with a customized curriculum where students could see how a parking lot, a marsh, and a retention pond at the top of a floodplain differently affected the amount of flooding at lower elevations. The parking lot with no on-site drainage resulted in the most flooding, the marsh the least, and the retention pond lessened flooding while resulting in a slower flow of water compared to the parking lot. With these results as a baseline, students had the opportunity to also learn about and experiment with gray infrastructure solutions, such as building levees out of putty or considering existing levees, which, when their capacity was exceeded, resulted in more devastating and faster flowing flooding than in the green infrastructure example. Reflections after the activity resulted in the conclusion that green infrastructure and nature-based solutions provide increased community resilience to flooding compared to gray infrastructure or traditional hard-scaped solutions. With these outcomes, this paper seeks to better understand the novel perspectives youth bring to water management and flood infrastructure planning processes.
Methods
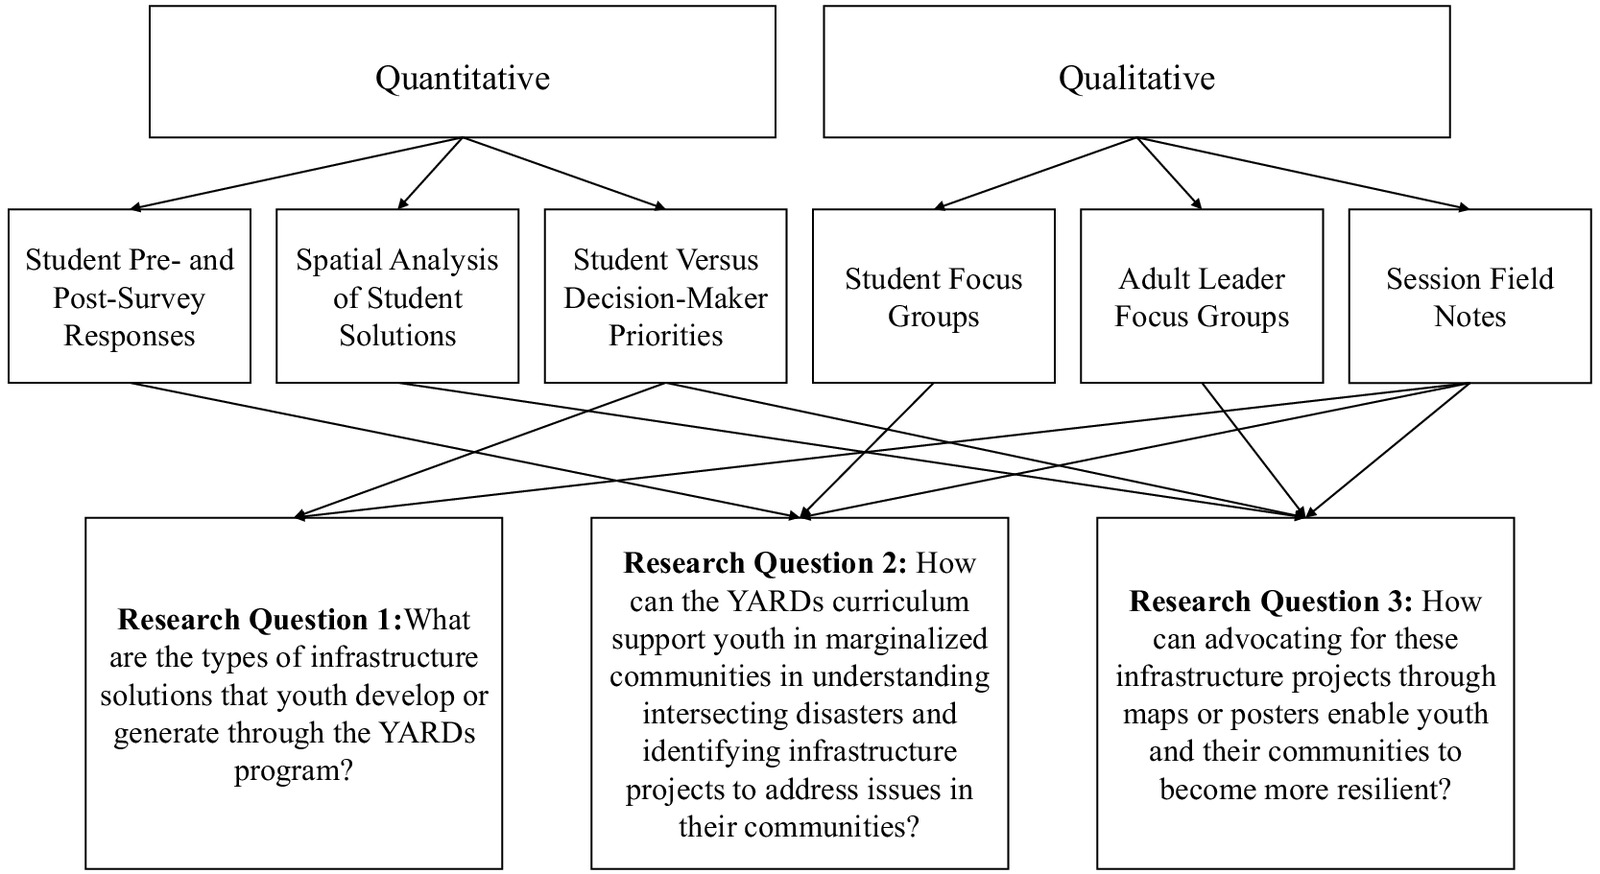
To answer the three main research questions of this study, the authors employed mixed methods, including both quantitative and qualitative data, that were collected during both the weeklong summer 2022 pilot and the fall 2022 half-semester after-school program The quantitative data included spatial and topic analysis of the locations and features of the student green infrastructure designs, as well as statistical analysis of student survey data. Specifically, the data analysis included pre- and post-matched student survey responses, spatial analysis of student solutions, and comparisons of student versus decision maker priorities. For qualitative data, included are analyses of responses from student and adult focus groups and detailed session notes to evaluate factors such as the delivery method in both pilots, demographics of students and how that informed their perspectives, and suggestions for future program iterations. Each research question as defined in the introduction was analyzed through mixed methods, i.e., combining quantitative and qualitative methods. The correspondence between the quantitative and qualitative analysis approaches, the data collected and analyzed in this study, and the study research questions are shown in Fig. 1. All methods are described in more detail in the sections following.
Student Participants
The summer 2022 program participants were between 11 and 13 years old, with 60% indicating they were in sixth grade. Sixty percent of participants identified as girls. Fifty percent of the participants were African American, and the rest identified as multiracial, white, and Asian. The fall program participants were between 12 and 14 years old, with 67% indicating they were in eighth grade. Fifty percent of participants identified as girls, and 50% identified as boys. When asked to self-report their race/ethnicity, 50% of the students reported they identified as Black/African American, and other races and ethnicities identified included multiracial and Native American/American Indian.
Quantitative Data Sources and Analysis
As shown in Fig. 1, three different quantitative data sources were collected through implementation of the YARDs curriculum. The first data source was the survey administered to students before and after the YARDs program. Some items on the pre- and post-surveys were adapted from surveys developed by Millstein et al. (2016) to assess students’ perceptions of psychosocial factors and perceptions of knowledge and skills related to summer program topics. Additional items were developed to measure participants’ understanding of infrastructure to adapt the survey to the new curriculum. While the survey covered multiple topics including advocacy, participation, and optimism for change, the specific questions related to infrastructure and disaster resilience that are of particular relevance and analyzed in detail for this paper included the following:
1.
Disasters facing students’ community
a.
What type of disasters do you think are the most important facing your community? (Select all that apply)
2.
Perceptions of psychosocial factors
a.
Self-efficacy for disaster resilience/environmental justice and advocacy behavior
(1)
I can talk about how building better infrastructure could lead to less flooding in my neighborhood.
(2)
I know where different types of infrastructure, such as hospitals and grocery stores, are located in my neighborhood.
(3)
I am sure that I can tell my friends how infrastructure problems could impact the neighborhood.
b.
Advocacy outcome efficacy
(1)
This project can make a difference in finding infrastructure solutions for natural disasters.
(2)
This project can make a difference in making our school or community a better place for advocating infrastructural changes.
3.
Perceptions of knowledge and skills
a.
Assertiveness
(1)
I can talk about infrastructure problems in my community.
(2)
I can talk with adults about how to advocate for infrastructural changes in our community.
The first question was a “select all that apply” type, where the authors analyzed the percentage of a selection chosen. The remaining survey questions were analyzed on a 5-point Likert-type scale from strongly disagree to strongly agree. A Wilcoxon signed-rank test (matched groups) was used to determine statistical significance of changes pre- and post-curriculum for the summer pilot. The fall pilot survey had identical questions, but the sample size was small and did not allow for statistical significance analyses. For both pilots, the results are interpreted with awareness of their smaller sample sizes. Therefore, the results are augmented with further qualitative analyses in this paper. The survey response data helped answer the second research question, “How can the YARDs curriculum support youth in marginalized communities in understanding intersecting disasters and identifying infrastructure projects to address issues in their communities?” This question was analyzed by looking at the statistical significance of the responses to questions related to infrastructure and disaster resilience.
The second quantitative data source was the students’ projects and a spatial analysis that focused on the locations of the student solutions from both the summer and fall pilots and how they relate to the current infrastructure in the surrounding areas. Each student infrastructure solution included a proposed site selection on either an open lot they were aware of, a high-risk street, or a FEMA flood lot. The latter sites were lots that the city and FEMA had purchased due to frequent flooding to prevent further residential or commercial development on the site. Resulting student solutions from the YARDs program included green infrastructure, parks, community centers, and community gardens. Given this set of infrastructure solutions, the average distance was computed between each of the student solutions and existing infrastructure of these types in the community. The average distance was calculated by finding the closest feature (e.g., existing green infrastructure) to the input data set (e.g., location of the student chosen lot), determining the distance, and averaging over all distances between the features to the chosen sites. The average distances were also computed between the summer and fall pilots to examine the difference between the pilots. These computed distances contribute to answering the third research question, “How can advocating for these infrastructure projects through maps or posters enable youth and their communities to become more resilient?” This question was addressed by analyzing students’ different perspectives on the selected locations of solutions compared to those from community decision makers.
The last quantitative data analysis was a comparison of student versus decision maker perceptions on the issues that need to be addressed in their communities. The issues that students prioritized were taken from the solutions they presented through a coding process to identify common themes. The issues decision makers prioritize were taken from a prior study that included surveys with community decision makers on priorities for green or gray stormwater infrastructure solutions (Reckner and Tien 2023). In that study, decision makers in a southern US coastal community were surveyed regarding their perception of the importance of various stormwater infrastructure benefits on a scale of 1 = least important to 10 = most important in deciding the location of new flood infrastructure in their community. The variables that were included in the analysis of that study were categorized into one of four groups (regulating, provisioning, supporting, and cultural services) based on the benefits they could provide as in Miller and Montalto (2019). In this paper, these categories are redefined for clarity as disaster risk variables, basic survival variables, ecosystem variables, and sociocultural variables. Disaster risk variables are defined as relating to the disasters themselves and the critical infrastructure they put at risk. Basic survival variables are defined as providing resources that support people’s basic survival: shelter, clean air, clean water, and healthy food. Ecosystem variables are defined as the preservation of plant and animal habitats. Sociocultural variables are defined as benefiting the social and cultural characteristics that affect the surrounding community.
Each of the student infrastructure solutions included descriptions of its design features and the issues the solution addresses, e.g., a resilience hub can address energy, shelter, and food needs in the event of a disaster. Each of these features and issues was coded as belonging to one of the four variable types. For coding, the authors were given the definitions of the four variable types based on prior work (Miller and Montalto 2019; Reckner and Tien 2023) with examples. The authors first coded individually, and then discussed and determined the resulting code assignment decisions as a group. If a design feature could fit into multiple variable types, the feature is represented as a proportion of all the variables related to that feature. This coding was conducted across the researcher team to ensure consistency and include varying engineering, planning, and sociology perspectives.
From the coding, the student participants’ priority for a variable type was calculated according to Eq. (1a), where is the variable type () priority for youth participants (), is the number of design features that relate to the specific variable type, is the youth presentation group, is the total number of youth groups, and is the total number of design features. The adult decision makers’ priority for a variable type was calculated through Eq. (1b), where is the variable type () priority for decision makers (), and is the average importance of all the benefits ranked from 1 to 10 within a variable type. For example, a student group recommended a retention pond and community center. In their presentation, the students highlighted the map layers they analyzed, risks associated with the site, benefits of added infrastructure, and more. To support and motivate their design, they mentioned disaster risk type variables six times, basic survival variables 0.5 times, and sociocultural variables 4.5 times, with the halves due to a supporting point relating to multiple categories. In this instance, in calculating the student group’s priority for disaster risk variables, and . This ratio is calculated and added for each student group and divided by the total number of student groups, which in this program was four
(1a)
(1b)
The student versus decision maker priorities helped answer the first research question, “What are the types of infrastructure solutions that youth develop or generate through the YARDs program?” This question was analyzed by looking at the relative importance of the four variable and benefit categories prioritized by students compared to decision makers.
Qualitative Data Analysis
As shown in Fig. 1, this study includes analysis from three main qualitative data sources. The first qualitative data source is the student focus group discussions. Four sets of student focus group data were analyzed, with the students randomly split into two groups in both pilots. Within each focus group, participants’ discussions were guided through a semistructured protocol that included a set of questions regarding the YARDs program that were developed by the researchers. All relevant quotes from participants related to infrastructure are presented in the following results section.
The second qualitative data source is the adult leaders focus group discussion. These data are from the fall pilot program collected after the student presentations of their solutions to the adult leaders at the end of the YARDs curriculum. In that focus group, the authors discussed with local and statewide leaders in attendance at the final student presentations their thoughts on the delivery of the program and the feasibility of the student designs. Analysis and quotes from these focus groups helped answer the third research question.
The last qualitative data source used in this study is session field notes through observations that the researchers and authors took throughout the delivery of the YARDs program. The authors took notes on topics such as how the students reacted and interacted with the curriculum material, recommendations for the next iteration of the YARDs program, and if any parts of the sessions deviated from the initial curriculum. These field notes helped fill in gaps in supporting all the research questions.
Results
First Research Question: Youth Priorities
The first research question asked, “What are the types of infrastructure solutions that youth develop or generate through the YARDs program?” This answer was addressed through a quantitative comparison of student versus decision maker priorities.
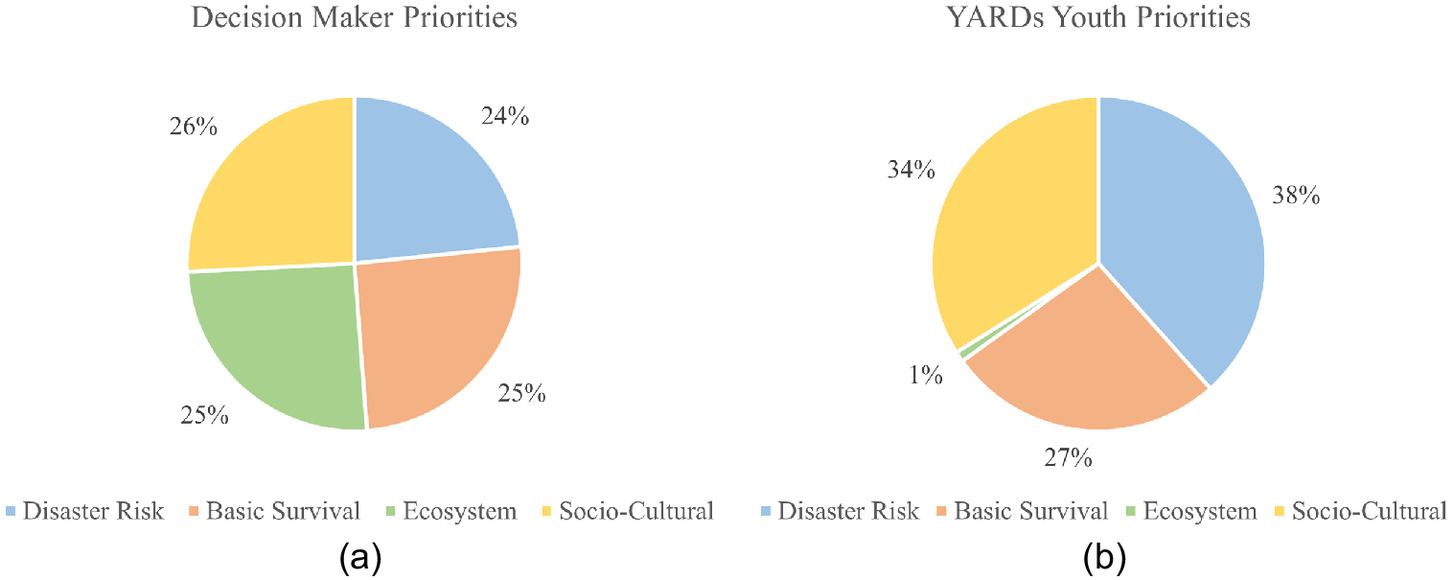
Youth participant and adult decision maker priorities were calculated through Eqs. (1a) and (1b), respectively. The pie charts in Fig. 2 show the relative weighting of each of the four variable types for the adult decision makers compared to YARDs youth. From Fig. 2(a), the local decision makers tended to weigh each type of variable equally, with a slight increased priority on sociocultural variables and with disaster risk being the smallest. On the other hand, the youth had disaster risk as the highest priority (38% for the youth compared to 24% for the adult decision makers), while ecosystem variables were only mentioned briefly by one team. In the YARDs curriculum, a mapping software was made available to the students to explore different map data layers in the community to support their solutions. Although this mapping software contained a variable on bird habitat, and the facilitators mentioned a few times throughout the program how green infrastructure can help clean water runoff, which helps local habitats, the students did not appear to identify with the ecosystem variables. Rather, the students tended to emphasize issues that directly affected them or alarmed them. For example, in both summer and fall programs, when going through the spatial data layers, when students heard about air quality issues and cancer rates, they were directly able to see how some neighborhoods were worse off than others. These data helped inform most groups on where they wanted to locate their solutions. Basic survival and sociocultural variables were more intuitive, with the students coming in with a baseline understanding of these issues. For the disaster risk variables, all the students witnessed a floodplain simulator where they were able to see how different types of infrastructure can lead to different flooding levels and impacts. In the focus groups, many students identified the floodplain simulator as their favorite activity due to its interactive components. In the YARDs program, groups also saw different sea-level rise scenarios through the mapping activities. Both the floodplain simulator and visualizing sea-level rise led to many groups choosing to incorporate features addressing disaster risk in their solutions. The results show the importance youth place on reducing disaster risk, while providing sociocultural benefits, in designing new infrastructure solutions for their communities.
Second Research Question: Youth Advocacy
The second research question asked, “How can the YARDs curriculum support youth in marginalized communities in understanding intersecting disasters and identifying infrastructure projects to address issues in their communities?” This question was analyzed quantitatively through the student pre- and post-curriculum survey responses. There was a difference in numbers of students taking both the pre- and post-surveys in the two pilots, resulting in a varying ability to statistically assess the outcomes. The summer pilot had 11 students take the pre- and post-survey responses. For the fall pilot, 13 students took the pre-survey and eight students took the post-survey. However, only six students took both the pre- and post-survey. This difference was due to different consistency in attendance between the two pilots. The summer pilot was a summer camp where students needed to commit to only a week of time. The fall pilot was an after-school program that spanned 6 weeks where many students had other commitments going on simultaneously, leading to different students coming and going in the program. The researchers will continue to run the program in the future as a summer program to ensure more consistent student exposure to the curriculum.
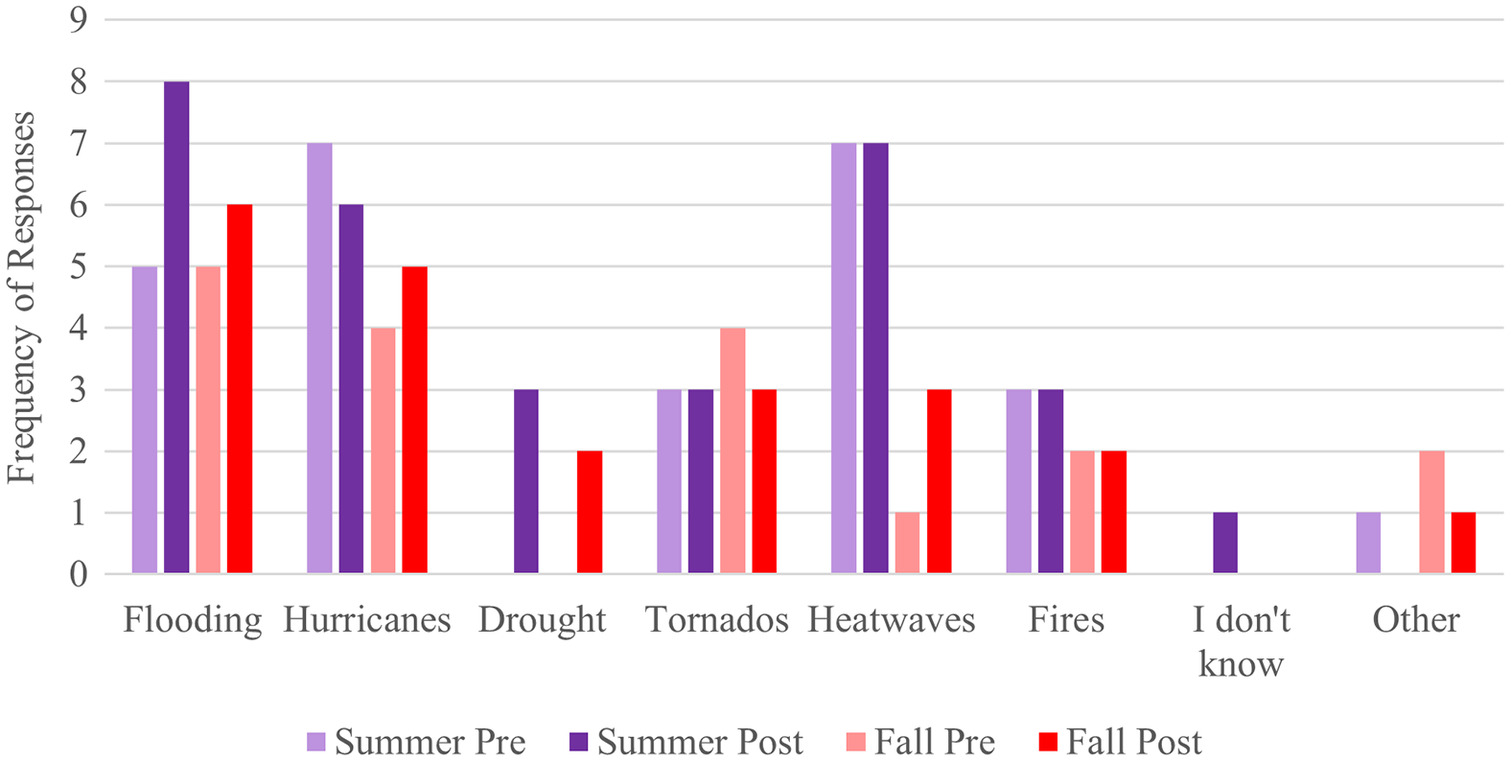
In both pilots, identical questions in the survey were asked pre- and post-curriculum to be able to assess the impact of the YARDs program on student outcomes. The following shows results of the student survey responses pre- and post-curriculum for both the summer and fall pilots. First, Fig. 3 shows the results from asking the students to identify the most important disasters facing their community. Respondents could select among a list of possible disasters (choose all that apply), as well as given options to indicate that they did not know and to write in other disasters not provided. Across both pilots, hurricanes and flooding were identified as one of the most significant disaster risks to their community. Comparing differences before and after the curriculum, flooding was mentioned more in the post-survey for both pilots, with the summer having the largest increased difference. Comparing the results between summer and fall, the summer pilot students indicated heat waves as an area of high concern. Although heat waves have larger impacts on the demographics of the fall pilot, they placed it as a lower concern. This is likely due to the summer pilot students experiencing high temperatures at the time of taking the survey.
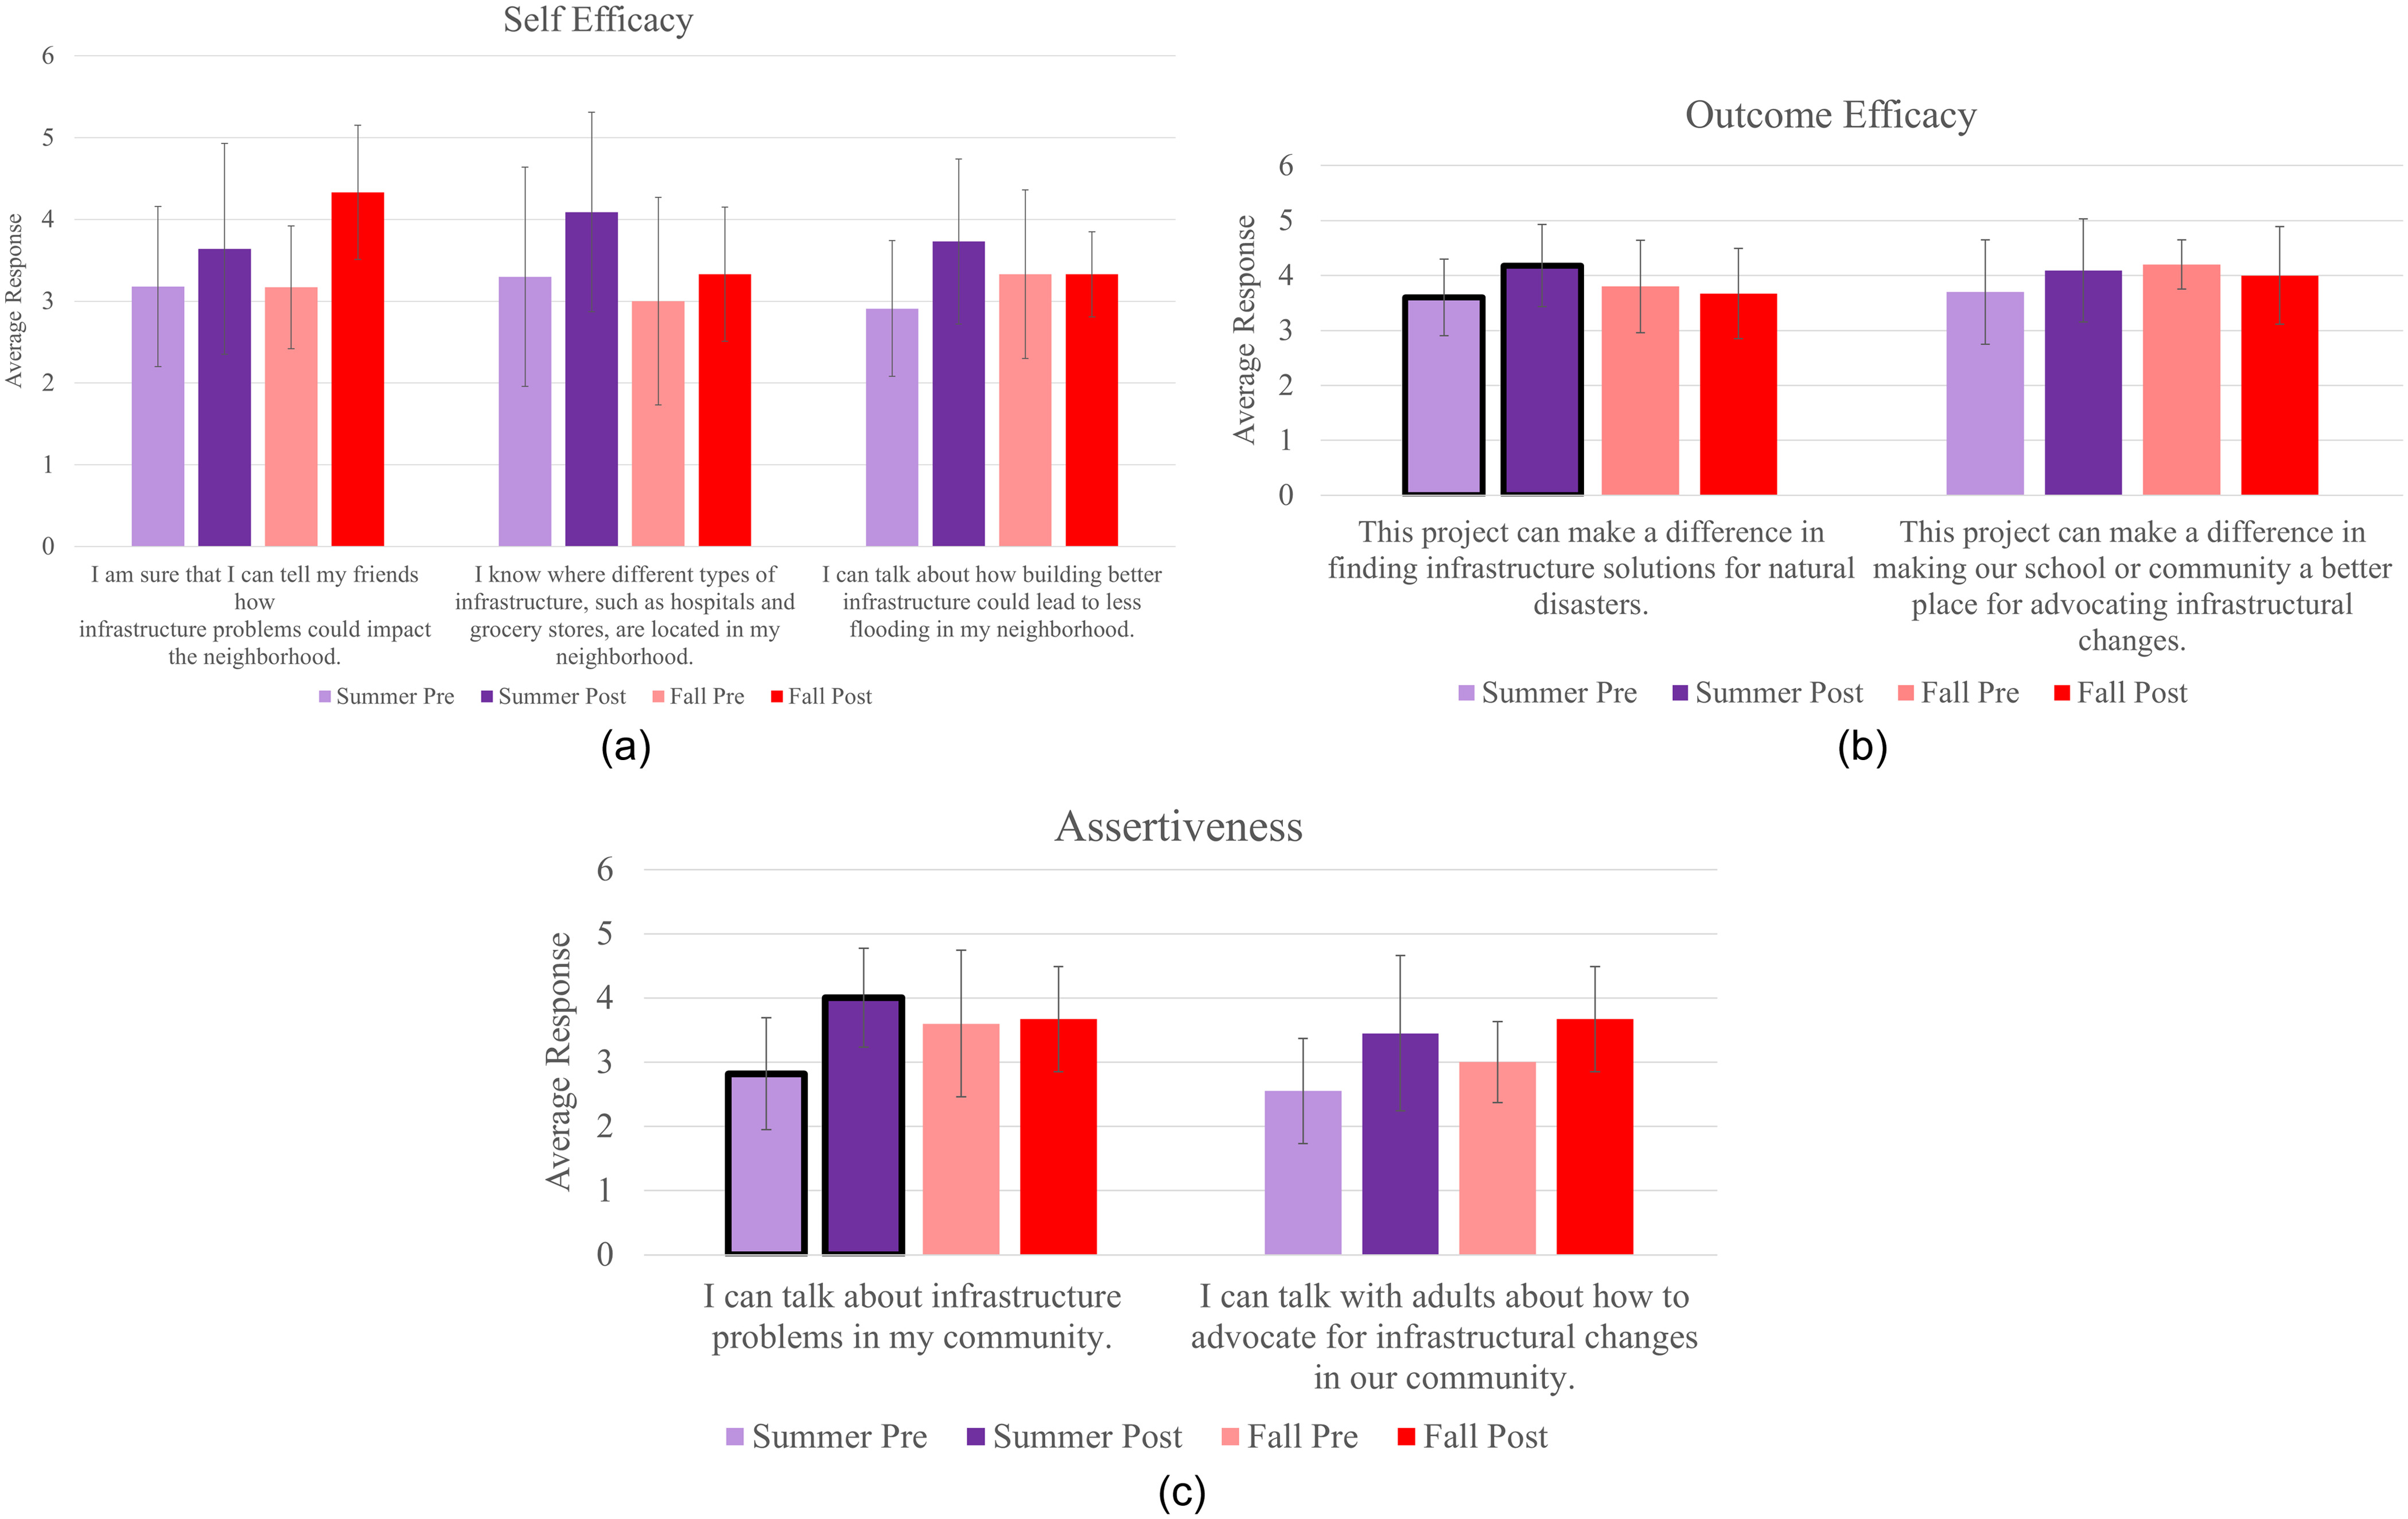
In the program survey, students were also asked about their self-efficacy for disaster resilience/environmental justice and advocacy behavior, overall advocacy outcome efficacy, and overall assertiveness. Results from these questions relating to the infrastructure focus of this study are presented in Fig. 4. Responses are given on a 5-point Likert-type scale from 1 = strongly disagree to 5 = strongly agree. The error bars represent one standard deviation from the average for the responses to each question. The questions with outlined bars had a significant change in the results from pre- to post-responses indicated by a from the Wilcoxon signed-rank test. The questions that resulted in a significant positive change in average values for the summer surveys were “This project can make a difference in finding infrastructure solutions for natural disasters” in the outcome efficacy category and “I can talk about infrastructure problems in my community” in the assertiveness category. These results show evidence of the students’ attitude changes from the program for what they learned about infrastructure, indicating it can make a difference in their community, and that they know more about it after the program. Among the self-efficacy questions, the student responses for all questions were higher after the program. For outcome efficacy for the summer pilot students, the responses went from neither agreeing nor disagreeing to agreeing on the post-survey. On average, on the summer post-survey, students agreed with all but one statement relating to outcome efficacy, indicating a positive result from the YARDs program. For assertiveness, students went on average from slightly disagreeing to slightly agreeing after the curriculum. These findings indicate that participants had higher perceptions of their skills relevant to assertiveness after experiencing the program. Overall, students increased their understanding of infrastructure positively throughout the YARDs program.
Supplementing the survey results with data from the focus groups, among the student focus groups, it was found that the students comprehended and connected with the material related to infrastructure. In both the summer and fall pilots, after the program, students could actively define the difference between green and gray flood infrastructure. The connection between infrastructure and flood impacts was clearer for students in the summer pilot program. For example, when asked how infrastructure might improve disaster resilience, a student said, “As long as the infrastructure is built correctly and there isn’t, like, a hole in it, then it can actually prevent or protect against natural disasters. Like a dam, for example, that could help keep water away from people’s houses and keep people’s lives safe. Also there’s a hole and there’s a gap. So the pressure will build and make it a ton of a lot worse than what it would be before.” This comment speaks to the student understanding differences in how green or gray infrastructure fails and the corresponding impacts on the community. Then when asked why a community might look into solutions such as water retention, they clarified, “Because it helps soak up the water rather than just keep it away.” For the fall student focus groups, participants had a tougher time focusing (likely due to the extended time period of the program and the turnover in student participants) and provided limited responses related to points beyond basic understanding of infrastructure. The authors used these answers to infer that the curriculum can be further improved to explore why the students were looking into green infrastructure solutions, and future implementations of the curriculum will emphasize the connection between different flood infrastructure solutions and overall community resilience. The authors inferred from session notes that the emphasis on green infrastructure was effective for the participants present in the room, and some students were able to understand through the YARDs program the role of green infrastructure in reducing flooding impacts in the community.
Third Research Question: Increasing Community Resilience
The third research question asked, “How can advocating for these infrastructure projects through maps or posters enable youth and their communities to become more resilient?” This question was addressed through a quantitative spatial analysis of the student solutions. Specifically, to identify if new student-designed solutions address current unmet community needs, a spatial analysis of the student-selected infrastructure locations was conducted. Results include calculated distances from existing infrastructure and analysis of the characteristics of specific locations to assess the additional benefits new infrastructure solutions would provide to support increased community resilience.
Fig. 5 shows the spatial spread of the student-selected infrastructure locations of the two pilots. The chosen lot locations for the student solutions are shown, along with the locations of where the YARDs curriculum for the two pilots was delivered, which are shown as circles on the map. The boxed areas indicate areas that are examined in further detail in Figs. 6 and 7. The summer pilot was conducted in a location where few students lived nearby. Through mapping activities as part of the curriculum, students were shown locations of FEMA flood lots, and could pick from these locations to place their solutions. From the resulting solutions, all groups chose to locate their infrastructure solutions on the southeast side of the study city, which is next to marshes. This concentration of chosen lots corresponds with most of the FEMA flood lots being located there due to high flood risks in those areas. In addition, mapping layers that students explored during the program showed demographic information including distributions of youth populations across the community. Most of the lots chosen in the summer pilot were located in high youth concentration areas. Even though the summer students did not live in these high-concentration areas, many groups still desired to help as many youths as possible that live in areas of high flood risk and higher air pollution risk. The lots chosen in the fall pilot had similar air pollution risks and demographics, but the risk of coastal flooding is greater near the summer-chosen lots.
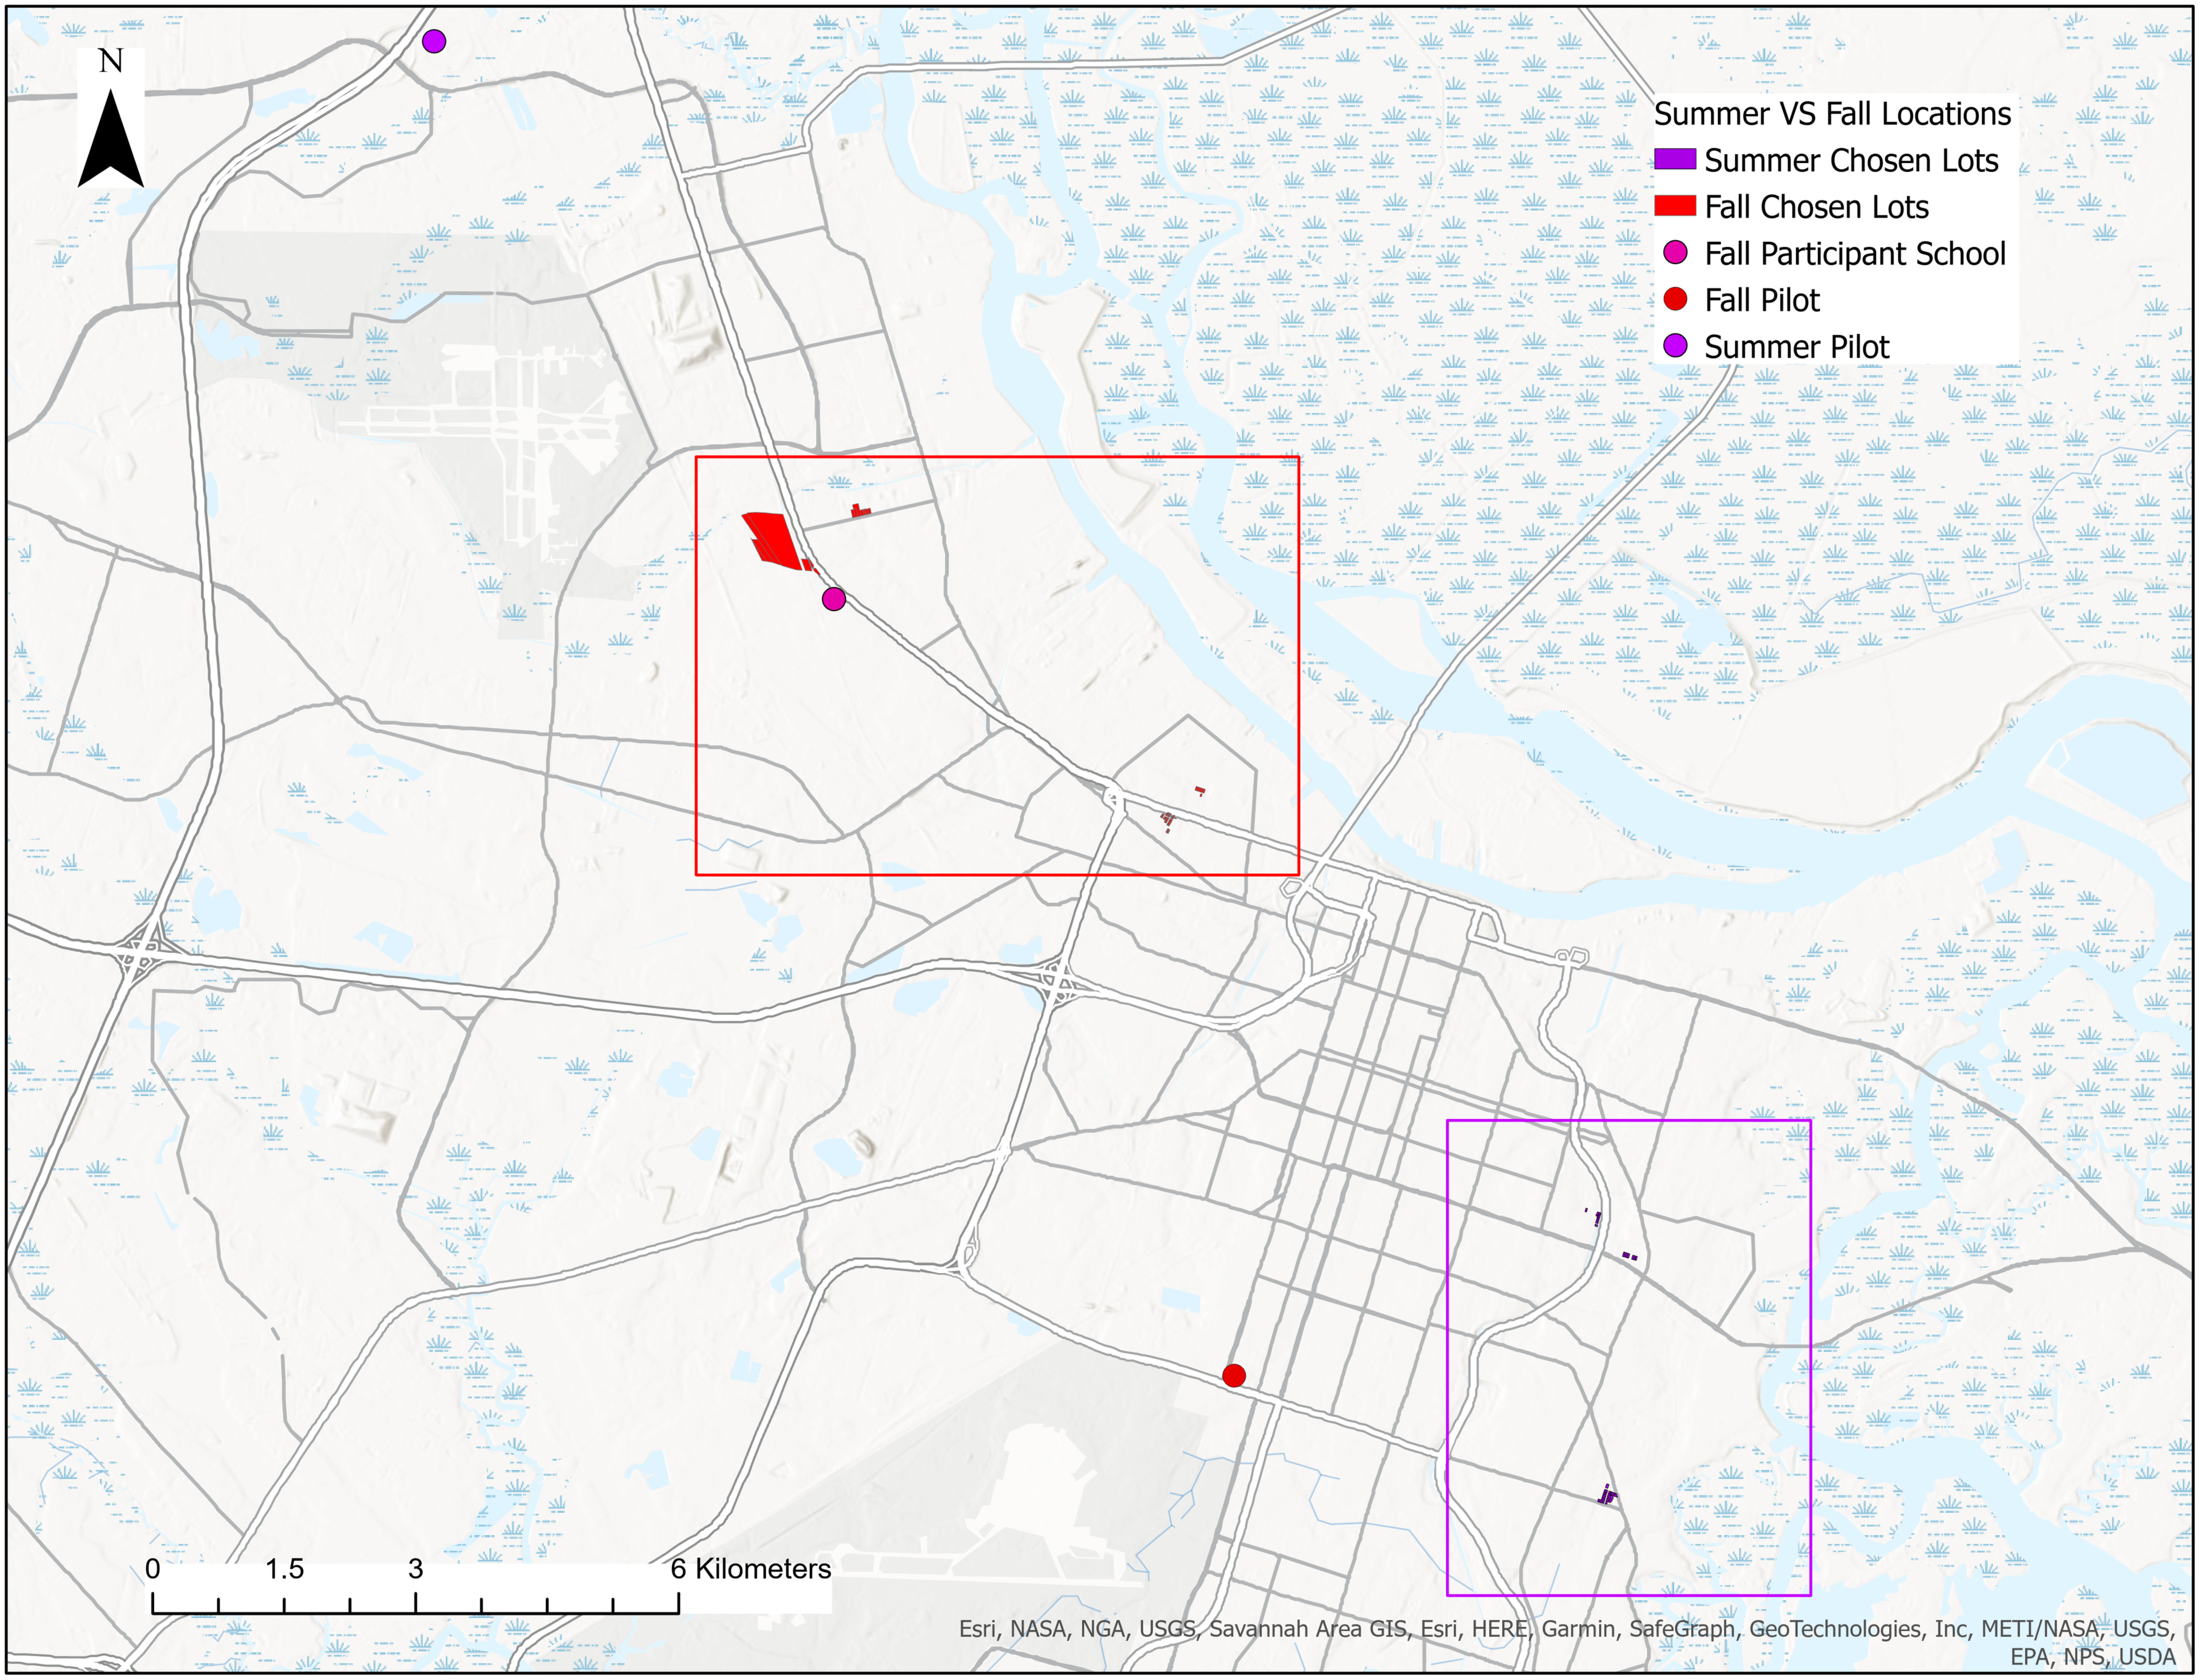
In the fall pilot, all the students picked lots close to where they live. The pilot took place south of the city, away from the participants’ school due to ongoing construction at the school. Regardless of this change in venue, the students used their knowledge of their own neighborhoods and their access to detailed community maps through the YARDs mapping activities to choose their lots. Students could choose existing FEMA flood lots or any other at-risk areas of which they were aware. This choice resulted in half of the groups picking FEMA flood lots and half picking open lots they were aware of in their neighborhood. There were no FEMA flood lots central to their neighborhood despite flood risk present. This may be due to either the community not being made aware of FEMA’s lot purchasing program or the community members not having the desire to leave.
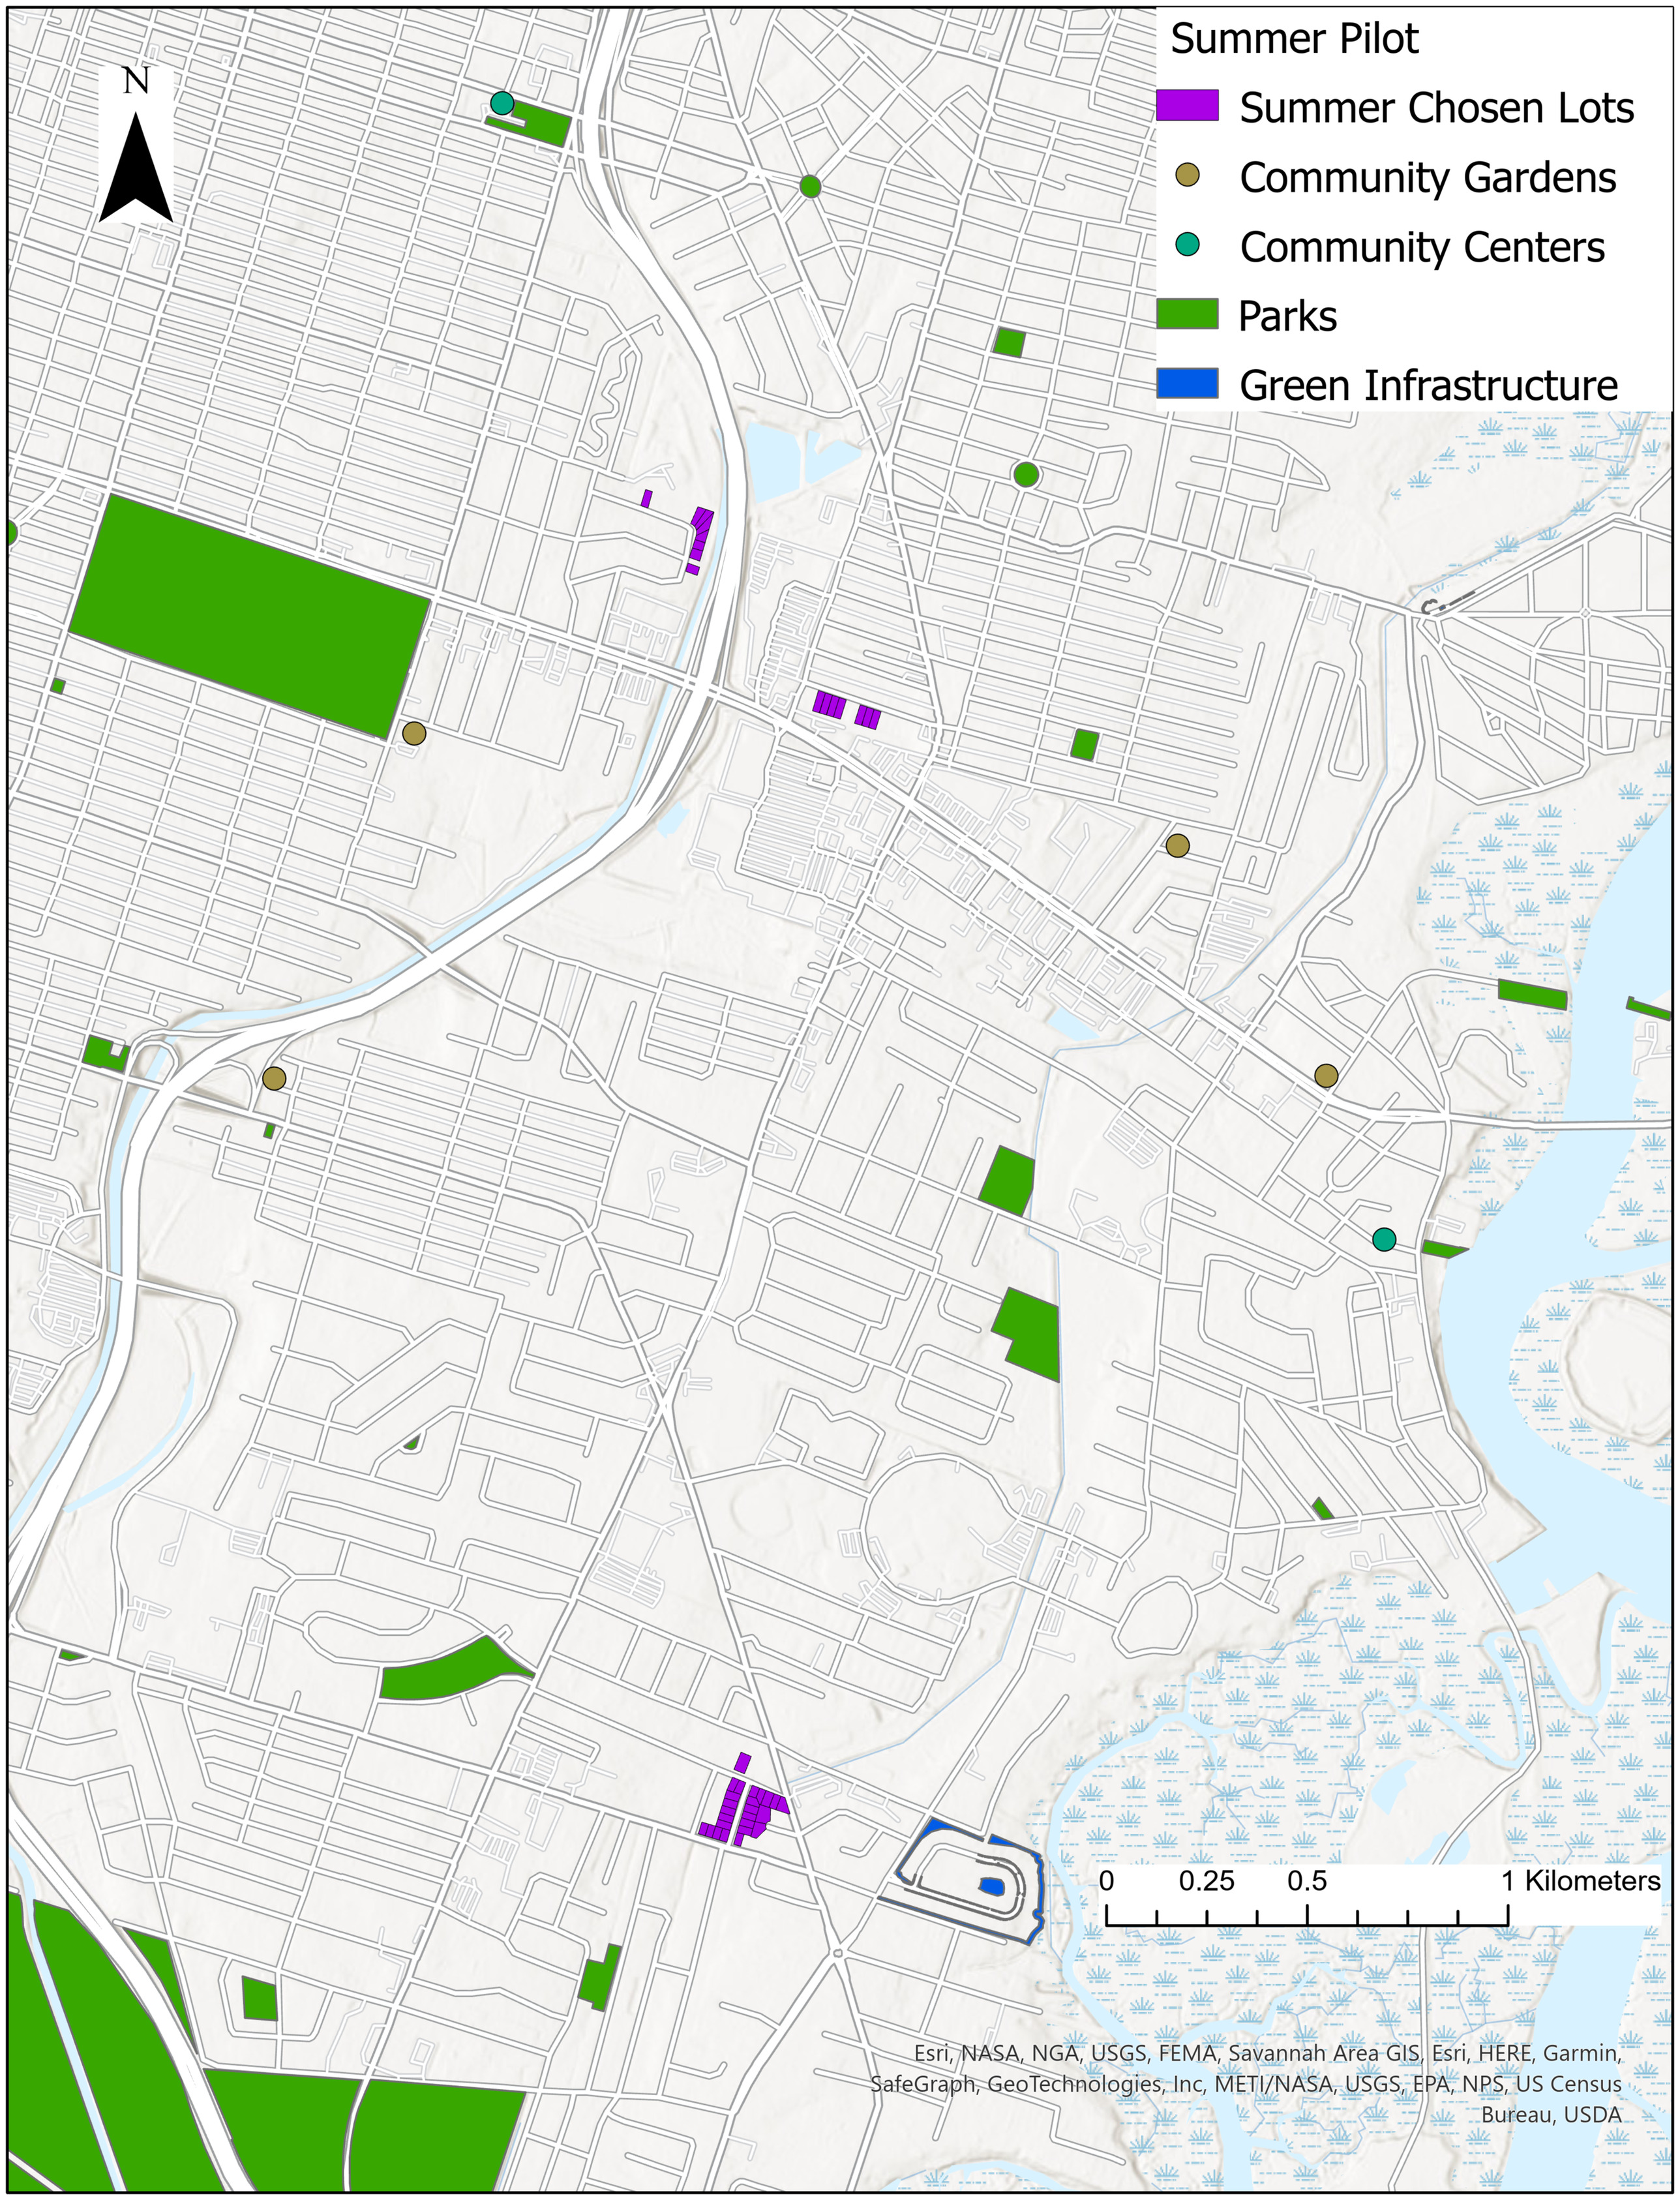
To examine the chosen lot locations in more detail, including relationships with existing infrastructure, Figs. 6 and 7 show zoomed-in maps of the highlighted locations from Fig. 5. Starting with the summer pilot, Fig. 6 shows a more detailed map indicating where the chosen lots were located and surrounding existing infrastructure. Because the student infrastructure solutions included community gardens, community centers, parks, and green infrastructure, existing infrastructure in the area of these types are shown. The only green infrastructure nearby is located by the southernmost chosen lot. The primary purpose of the existing green infrastructure is to improve water quality rather than provide any significant water retention. All the student designs include increasing flood protection to the surrounding area, so the student-selected location and infrastructure features address a need not currently met or emphasized by local decision makers. Although there are a number of parks nearby, many are small, and although they provide some public green space, there is little to no infrastructure that would make them more youth friendly. The northern lots are close to existing community resources including community centers and community gardens. However, considering the concentration of youth in the area, these resources are currently insufficient to meet population needs. Considering that the locations of the lots needed to be chosen at the beginning of the third day of the summer program (with only 2.5 camp days’ worth of instruction), the youth were able to select lots with clearly identified needs and chose locations to address community concerns not currently met by existing infrastructure.
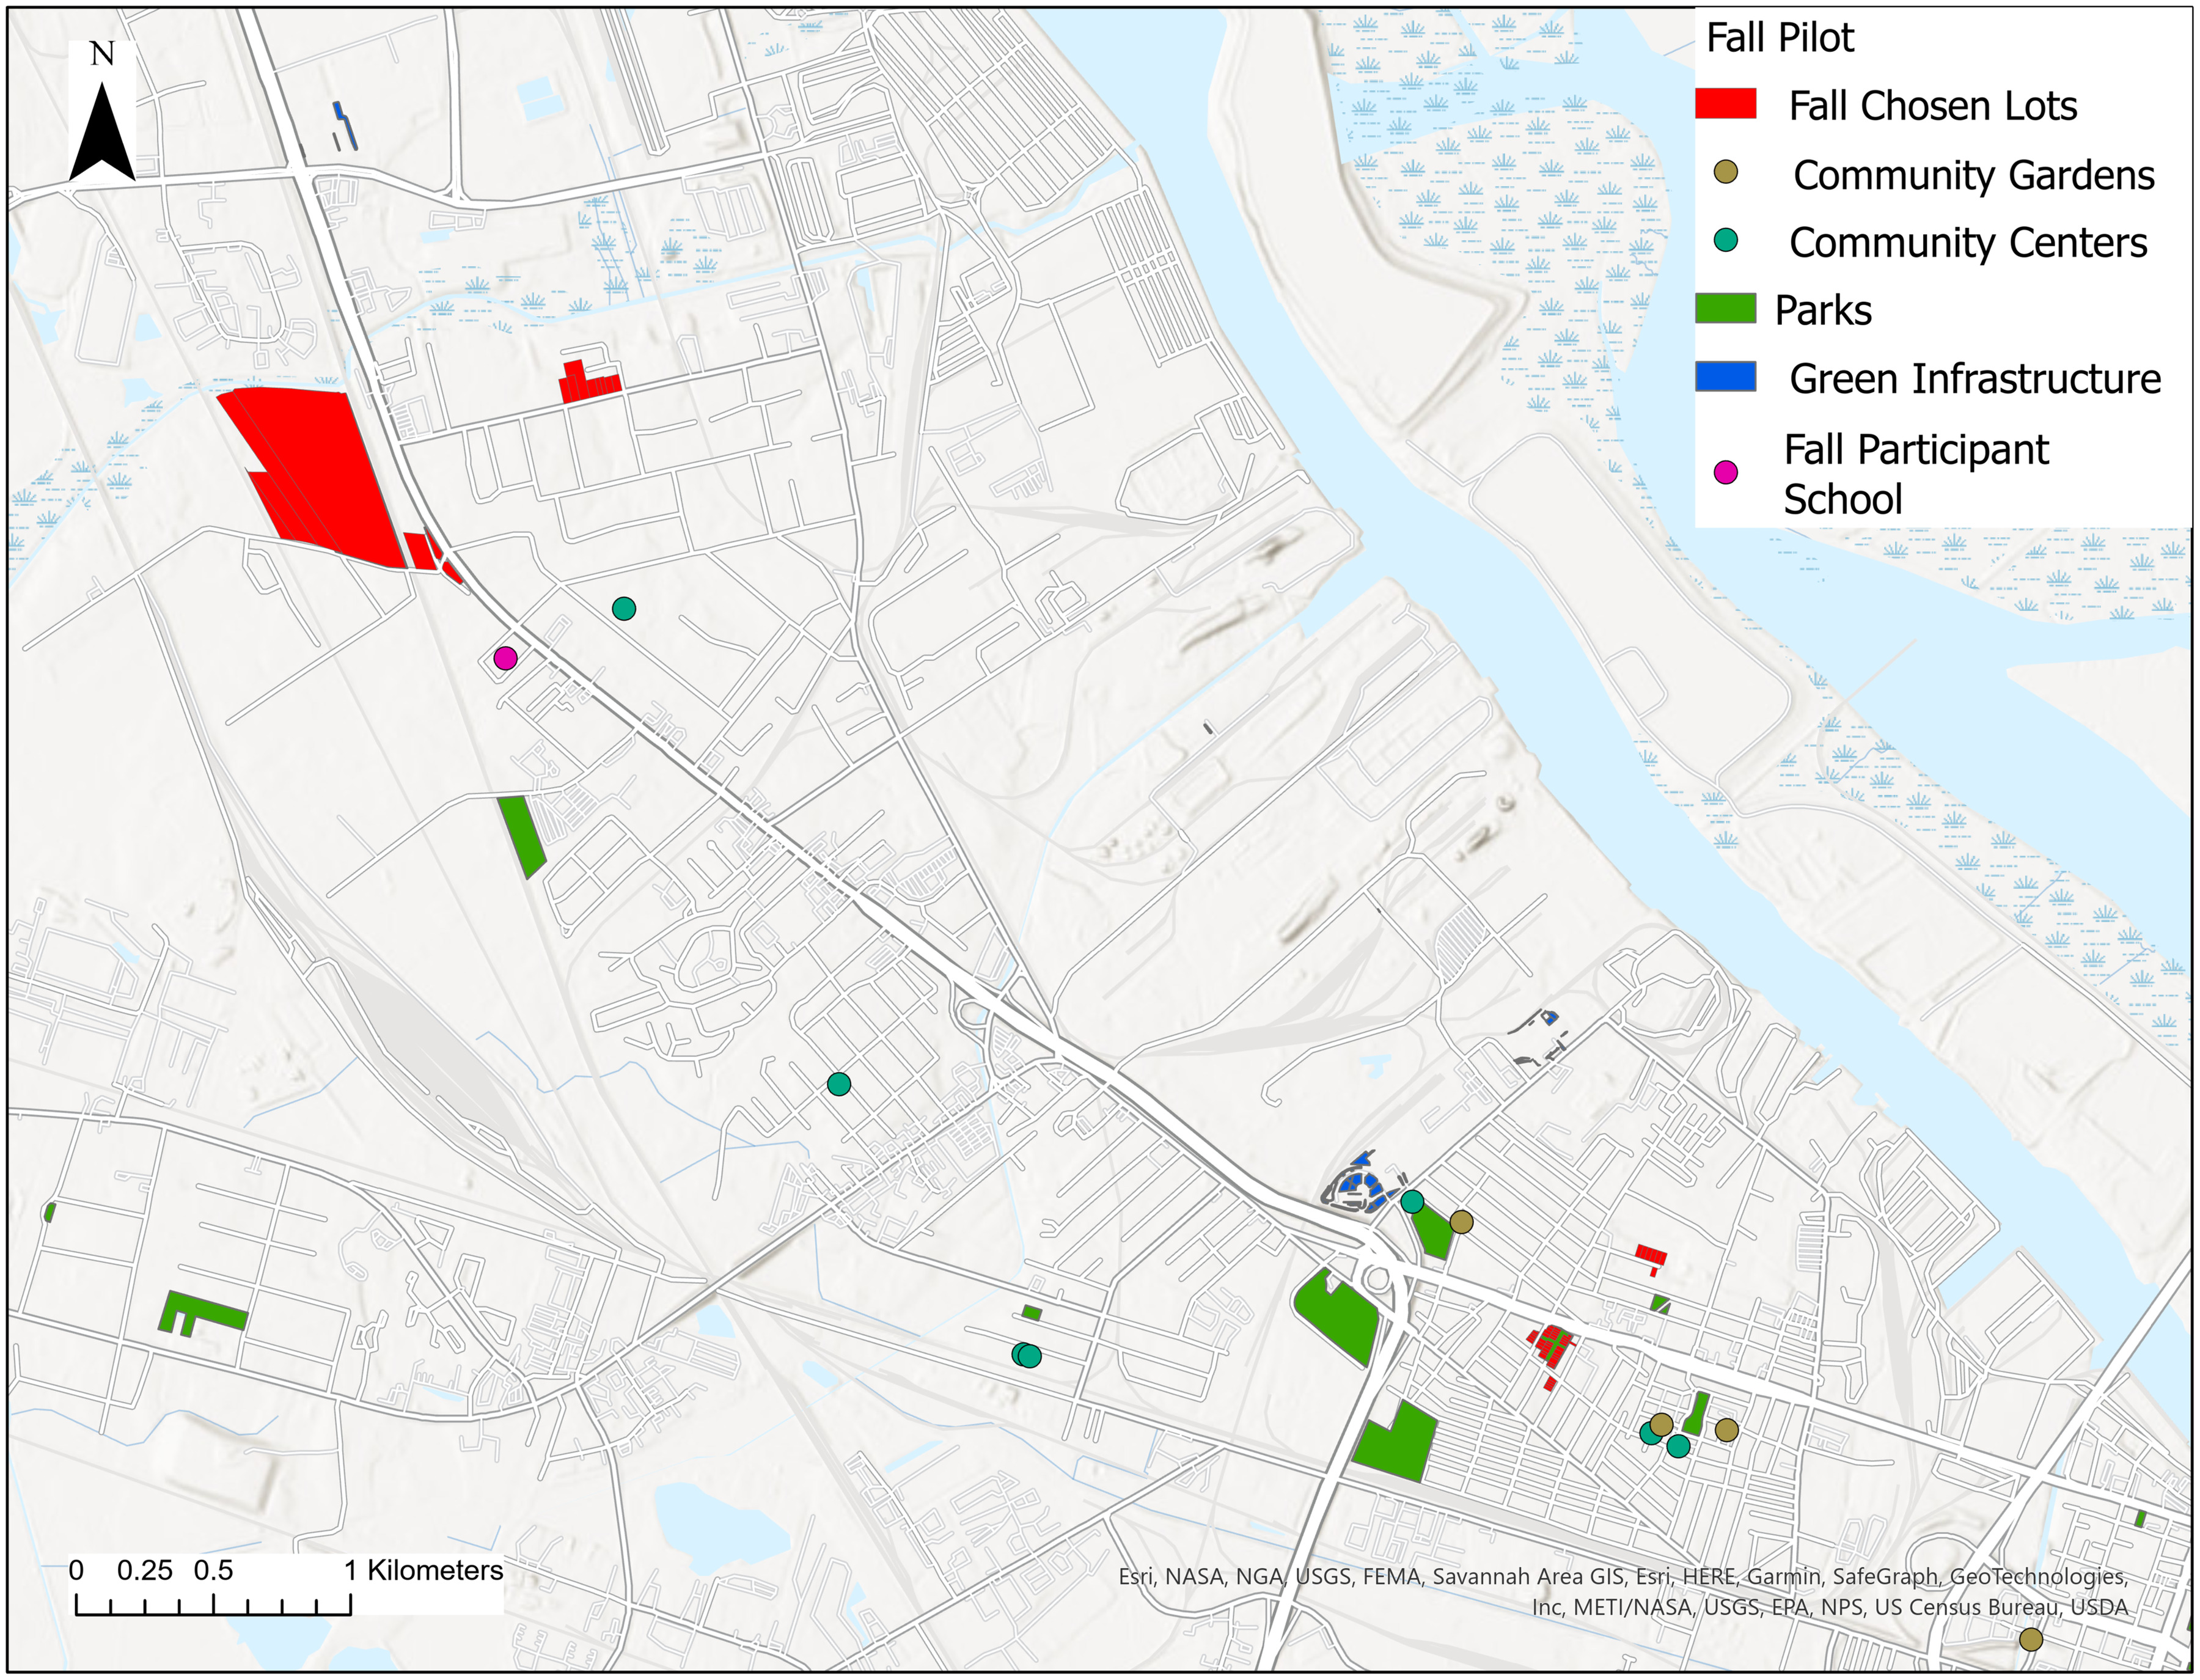
For the fall pilot, Fig. 7 shows the relationship between chosen lots and existing infrastructure, as well as where the students would typically go to school. The groups who picked lots in the southeast of the map were closer to existing infrastructure while being on existing FEMA flood lots, compared to the northwest lots that were not FEMA flood lots. For example, one of the southeastern chosen lots is already an existing FEMA flood lot transformed into a park, but the students argued for a park that better served youth. One of the groups that did not pick a FEMA lot also picked an existing park. However, they suggested it include a water retention pond and a resilience hub to better reduce community disaster risk. The groups who picked the northwest lots selected areas of higher infrastructure need. In future iterations of the YARDs program, in identifying locations for new infrastructure, for students who are more familiar with their neighborhood, selecting among FEMA flood lots may be too restrictive, and expanding possible infrastructure sites to include parks or other areas may allow more flexibility in locations and designs for infrastructure solutions.
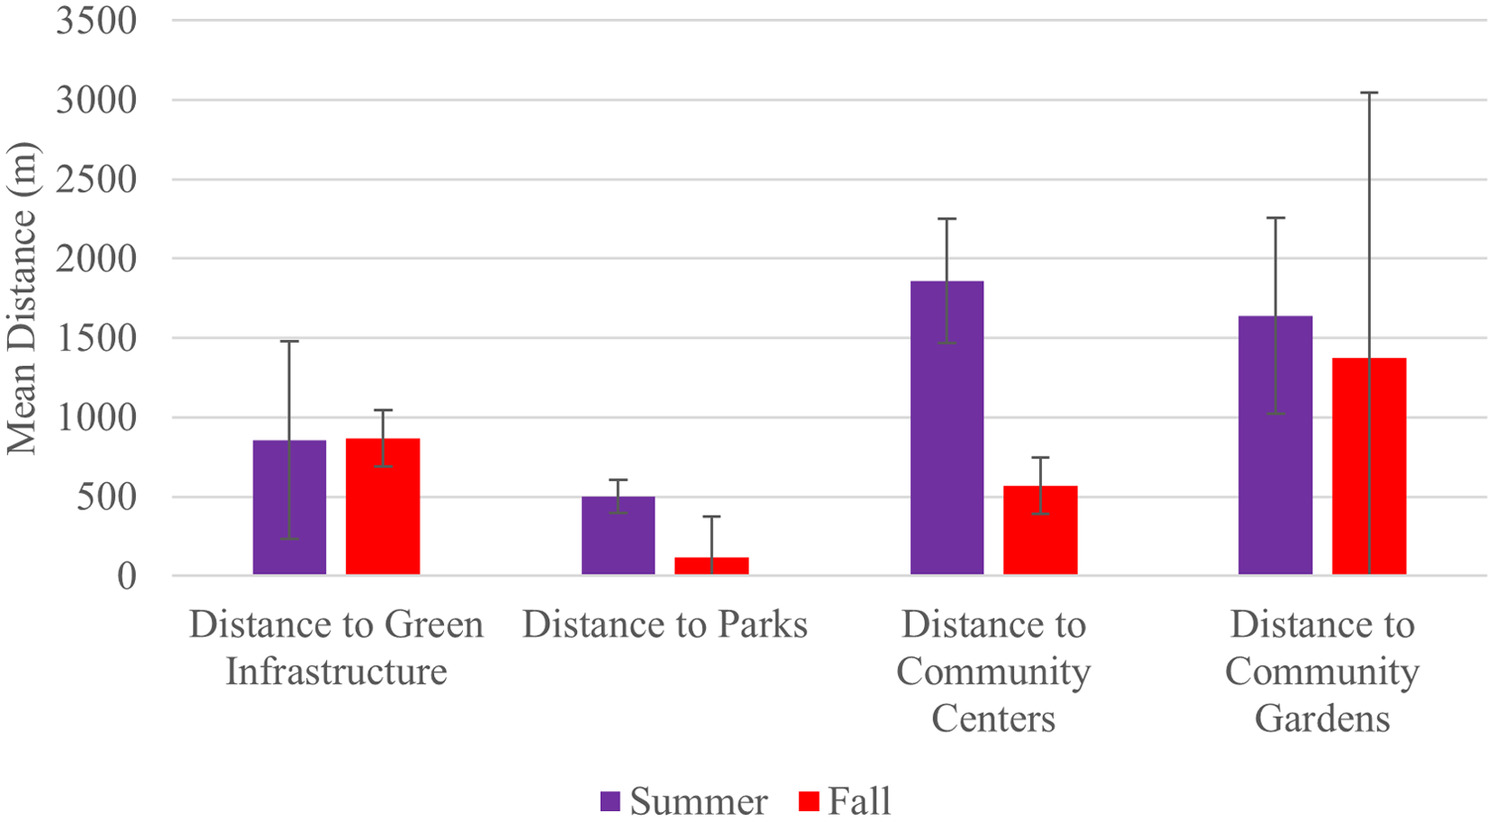
To quantify the relationship between the student-chosen lots and existing infrastructure and examine the students’ effectiveness in choosing sites of infrastructure need, Fig. 8 shows the distance between the student solution locations and existing infrastructure. Average distances are shown along with error bars showing one standard deviation from the mean. The summer and fall lots had a similar distance to green infrastructure, with both pilots’ lots averaging around 800 m from existing green infrastructure. Because green infrastructure’s benefits are very localized, 800 m is a sufficient distance for new green infrastructure solutions to act independently of existing ones and provide additional community benefits. Both pilots chose locations close to parks or existing park locations with suggested redesigns for increased flood resilience. This may be due to student familiarity with and use of these spaces. The distance to community centers shows the greatest difference across the pilots, with the summer lots indicating a larger distance to the existing infrastructure. This is due to there being fewer community centers within the neighborhoods of the summer-chosen lots. Both pilots had lots far from existing community gardens, with the distances for the fall pilot showing large variations due to large differences between the groups who picked FEMA flood lots or general areas of need. Overall, the students selected locations that are located far from existing infrastructure to address current unmet community needs.
Supplementing these results, to examine feasibility of the student solutions and benefits of the curriculum and resulting student infrastructure designs, feedback from adult community leaders and decision makers on the student solutions was analyzed. An adult leader focus group was conducted for the fall pilot after the students presented their designs and the adults were able to learn more about the YARDs program. Overall, the adults identified that the student designs were practical. When the decision makers were asked if the student designs could be implemented, one responded with “Short answer is yes. They certainly would need to be designed and built out further … seeing the passion these kids have … that will go a long way.” While the designs were not ready to be built, they were enough to inspire change in the community. Considering financial resources for new infrastructure, when asked whether a smaller, i.e., less expensive, design was more ideal for implementation, the decision maker said, “It depends … It is like cobbling together like how can we think about different resources and different budgets.” Overall, the decision makers did not recommend specifically limiting the students by size or budget. Rather, the financial limiting would naturally happen on the government side. Regarding implementation, another decision maker added, “It is a necessary last step for this program that something gets built … we have to think that this is these kids like first experience interacting with government … if they actually make it happen that is a huge lifelong learning tool … you can actually create a change.” They emphasized that for a program like this that encourages participants to be lifelong advocates, it is important they have a positive experience by seeing something built to remain optimistic about government and municipal planning processes.
One leader identified a desire to have more detailed designs, saying, “There are some that the locations are more viable … just from what I know about the space … where I know we could probably have space to do something else … right now I would say it would be there are tangible ideas. I would not want to just say here is a laundry list that we come up with. I would like the kids to actually say, no outside the laundry list like here is where we [d]rill down and then here are our some of our specific suggestions.” Students in the fall pilot presented a general description of their design. In the summer pilot, students drew more details of their solutions, such as where certain aspects of their designs would go into their chosen lot. The consensus was reached that asking students to provide as much detail as possible would be preferred to better understand student priorities and ideas, while emphasizing to the students that their exact design may not be implemented.
Overall, in future iterations of the program, having participants choose among feasible lots and present specific features they would like to see developed for or added to the lot provides the most relevant and useful information to community leaders and decision makers. Comparing these results with those found in the comparison between participant and adult priorities, the authors find that not only is it important for community planning and development for the participants’ designs to be implemented in some form, but that students and youth are able to provide unique perspectives for water management and flood risk mitigation. Future decision makers benefit from the youth perspective by exploring new ideas on locations and prioritized features for new flood infrastructure solutions, and encouraging future community members to stay engaged with municipal planning processes.
Conclusion
Youth are seen as the future of their community, but they are often left out of community and infrastructure planning efforts. Through the YARDs program, the research team sought to design a youth program that addresses some of these issues. Student participants were able to learn more about flood infrastructure, apply their knowledge to a novel flood infrastructure design, and present their results to community leaders and decision makers. The YARDs program was piloted as a summer camp in 2022 and then an after-school program in the fall of 2022. In this paper, we explore three research questions:
1.
What are the types of infrastructure solutions that youth develop or generate through the YARDs program?
2.
How can the YARDs curriculum support youth in marginalized communities in understanding intersecting disasters and identifying infrastructure projects to address issues in their communities?
3.
How can advocating for these infrastructure projects through maps or posters enable youth and their communities to become more resilient?
In answering the first question, the outcomes of this research show that youth infrastructure solutions prioritize features that provide disaster risk, basic survival, and sociocultural benefits, with limited mention of habitat protection variables. Compared to adult decision maker priorities, having infrastructure that reduces disaster risk is an even greater priority for youth. The students’ designs were unique compared to what is currently present in their community, indicating that youth desires, especially among youth of color, are not currently being considered in infrastructure planning processes.
In answering the second research question, results showed that participants were able to understand the difference between green and gray stormwater infrastructure and create new green infrastructure solutions in the community. Participants left the program with an increased positive attitude toward advocacy in terms of outcome efficacy and their ability to be assertive and heard. From the final project presentations, youth in the YARDs program were capable of providing feasible stormwater infrastructure designs to their community leaders.
For the third research question, the outcomes of this research suggest that participant infrastructure solutions are different from existing community infrastructure, and provide new benefits to the community to increase resilience to disasters. Community leaders can use programs like YARDs to gain perspectives from traditionally underrepresented voices, in this case marginalized youth perspectives, on the features and priorities of stormwater infrastructure designs. Locations selected were neighborhood specific and responded to real flood risks. Future iterations of the YARDs program will support further specificity of student stormwater solutions to facilitate transition into action and better usability of the program outcomes to community leaders.
In assessing how future iterations of the YARDs program could improve project outcomes, there are several recommendations. First, as a pilot program, teacher and facilitator training for the program is being continually improved to maximize the effectiveness of the program for the youth and adult leaders. Second, improving recruitment and retention of youth can greatly improve the efficacy of the YARDs program. Student recruitment and retention for the fall after-school program was especially challenging. Many students were only able to participate in 6 to 8 of the total 14 sessions, making it difficult to assess the direct impact of the curriculum on the students’ attitudes toward disasters and flood infrastructure solutions. Retention in the summer pilot was better; thus, future delivery of the YARDs curriculum will focus on implementation as a summer program. Third, the order and content of infrastructure and planning-related material partially changed between the summer and fall pilot programs as information was learned from the summer to the fall pilots. Once YARDs has been delivered more consistently, further analysis can be done on the data sets, including analyses across larger data sets and different student populations.
In addition, the YARDs program has conducted multiple programs within the same county and with the same community partners to be able to consistently assess the efficacy of the curriculum while making necessary updates on the way. Future work by the research team includes running additional iterations of the YARDs program; continuing to hone the curriculum in collaboration with middle school teachers; and conducting interviews with families of youth, teachers and school administrators, youth programs directors and mentors, and leaders in local governments to better design the curriculum and program. Going forward, the research team is looking to expand the program to other schools within the current county and other cities affected by stormwater flooding in collaboration with new community partners. Beyond flooding, the research team is also exploring how the curriculum sessions can be adapted to teach youth about other disaster types depending on the priorities of the youth in that specific program or location.
Overall, this work found positive outcomes in the amount youth are able to comprehend and the ability of youth to contribute to infrastructure planning processes. The findings from this study show that youth education can effectively provide a pathway to increase youth advocacy and participation in community planning processes. While there were variations between results from the summer and fall pilots, the overall consistent positive outcomes across multiple implementations of the YARDs program suggest that similar outcomes are possible across student populations. Based on the findings from this study, the authors recommend that additional research needs to be done at the intersection of youth participation and engineering planning. The authors also encourage additional programs of this type to be developed focusing on educating and engaging youth in community infrastructure planning, application in new communities, expanded youth populations, and additional disaster types. The results from this study show the novel perspectives that youth bring to infrastructure planning processes and disaster risk mitigation. Implementing programs such as YARDs is an important step in continuing to explore the best way to teach youth about infrastructure and for youth to advocate for new infrastructure solutions to increase the resilience of their communities.
Data Availability Statement
Some or all data, models, or code generated or used during the study are proprietary or confidential in nature and may only be provided with restrictions. These include the student information, responses, and outcomes from the study.
Acknowledgments
This material is based upon work supported by the National Science Foundation’s Civic Innovation Challenge under NSF Award ID’s 2133233 and 2042600. Any opinions, findings, and conclusions or recommendations expressed in this material are those of the authors and do not necessarily reflect the views of the National Science Foundation. We also want to acknowledge members of the team who participated in the creation of the YARDs program including Dr. Nisha Botchwey, Timothy Cone, Dr. Yanni Loukissas, Dr. Mildred McClain, Storm Robinson, Mustafa Shabazz, Mohsin Yousufi, as well as the teachers and students (left anonymous for confidentiality) who contributed to the success of the project.
References
Alves, A., J. Patiño Gómez, Z. Vojinovic, A. Sánchez, and S. Weesakul. 2018. “Combining co-benefits and stakeholders perceptions into green infrastructure selection for flood risk reduction.” Environments 5 (2): 29. https://doi.org/10.3390/environments5020029.
Barclay, N., and L. Klotz. 2019. “Role of community participation for green stormwater infrastructure development.” J. Environ. Manage. 251 (Dec): 109620. https://doi.org/10.1016/j.jenvman.2019.109620.
Becsi, B., D. Hohenwallner-Ries, T. Grothmann, A. Prutsch, T. Huber, and H. Formayer. 2020. “Towards better informed adaptation strategies: Co-designing climate change impact maps for Austrian regions.” Clim. Change 158 (3): 393–411. https://doi.org/10.1007/s10584-019-02602-7.
Brody, S. D., W. E. Highfield, and J. E. Kang. 2011. Rising waters: The causes and consequences of flooding in the United States. Cambridge, UK: Cambridge University Press.
Curran, W., and T. Hamilton. 2012. “Just green enough: Contesting environmental gentrification in Greenpoint, Brooklyn.” Local Environ. 17 (9): 1027–1042. https://doi.org/10.1080/13549839.2012.729569.
Drennan, L. 2018. “Community narratives of disaster risk and resilience: Implications for government policy.” Aust. J. Public Adm. 77 (3): 456–467. https://doi.org/10.1111/1467-8500.12299.
Dubois, B., and M. E. Krasny. 2016. “Educating with resilience in mind: Addressing climate change in post-Sandy New York City.” J. Environ. Educ. 47 (4): 255–270. https://doi.org/10.1080/00958964.2016.1167004.
Frantzeskaki, N., et al. 2019. “Nature-based solutions for urban climate change adaptation: Linking science, policy, and practice communities for evidence-based decision-making.” Bioscience 69 (6): 455–466. https://doi.org/10.1093/biosci/biz042.
Galvin, K. A., T. Even, R. S. Reid, J. Njoka, J. R. de Pinho, P. Thornton, and K. Saylor. 2020. “Understanding climate from the ground up: Knowledge of environmental changes in the east African savannas.” In Changing climate, changing worlds: Local knowledge and the challenges of social and ecological change, ethnobiology, edited by M. Welch-Devine, A. Sourdril, and B. J. Burke, 221–242. Cham, Switzerland: Springer.
Garcia-Cuerva, L., E. Z. Berglund, and L. Rivers. 2018. “An integrated approach to place Green Infrastructure strategies in marginalized communities and evaluate stormwater mitigation.” J. Hydrol. 559 (Apr): 648–660. https://doi.org/10.1016/j.jhydrol.2018.02.066.
Goh, K. 2020. “Planning the green new deal: Climate justice and the politics of sites and scales.” J. Am. Plann. Assoc. 86 (2): 188–195. https://doi.org/10.1080/01944363.2019.1688671.
Hoff, J., and Q. Gausset. 2015. “Community governance and citizen-driven initiatives in climate change mitigation: An introduction.” In Community governance and citizen-driven initiatives in climate change mitigation. London: Routledge.
Jennings, V., M. H. E. M. Browning, and A. Rigolon. 2019. Urban green spaces: Public health and sustainability in the United States. Springer Briefs in Geography. Cham, Switzerland: Springer.
Johansen, C., J. Horney, and I. Tien. 2017. “Metrics for evaluating and improving community resilience.” J. Infrastruct. Syst. 23 (2): 04016032. https://doi.org/10.1061/(ASCE)IS.1943-555X.0000329.
Kahne, J. E., and S. E. Sporte. 2008. “Developing citizens: The impact of civic learning opportunities on students’ commitment to civic participation.” Am. Educ. Res. J. 45 (3): 738–766. https://doi.org/10.3102/0002831208316951.
McFarland, D. A., and R. J. Thomas. 2006. “Bowling young: How youth voluntary associations influence adult political participation.” Am. Sociol. Rev. 71 (3): 401–425. https://doi.org/10.1177/000312240607100303.
McKoy, D. L., and J. M. Vincent. 2007. “Engaging schools in urban revitalization: The Y-PLAN (Youth—Plan, Learn, Act, Now!).” J. Plann. Educ. Res. 26 (4): 389–403. https://doi.org/10.1177/0739456X06298817.
Miller, S. M., and F. A. Montalto. 2019. “Stakeholder perceptions of the ecosystem services provided by green infrastructure in New York city.” Ecosyst. Serv. 37 (Jun): 100928. https://doi.org/10.1016/j.ecoser.2019.100928.
Millstein, R. A., S. I. Woodruff, L. S. Linton, C. C. Edwards, and J. F. Sallis. 2016. “Development of measures to evaluate youth advocacy for obesity prevention.” Int. J. Behav. Nutr. Phys. Act. 13 (Dec): 84. https://doi.org/10.1186/s12966-016-0410-x.
Monteiro, R., J. C. Ferreira, and P. Antunes. 2020. “Green infrastructure planning principles: An integrated literature review.” Land 9 (12): 525. https://doi.org/10.3390/land9120525.
Pierce, G., K. Gmoser-Daskalakis, M. A. Rippy, P. A. Holden, S. B. Grant, D. L. Feldman, and R. F. Ambrose. 2021. “Environmental attitudes and knowledge: Do they matter for support and investment in local stormwater infrastructure?” Soc. Nat. Resour. 34 (7): 885–905. https://doi.org/10.1080/08941920.2021.1900963.
Reckner, M., and I. Tien. 2023. “Community-scale spatial mapping to prioritize green and grey infrastructure locations to increase flood resilience.” Supplement, Sustainable Resilient Infrastruct. 8 (sup1): 289–310. https://doi.org/10.1080/23789689.2022.2148449.
Reed, T., L. R. Mason, and C. C. Ekenga. 2020. “Adapting to climate change in the upper Mississippi River Basin: Exploring stakeholder perspectives on river system management and flood risk reduction.” Environ. Health Insights 14: 1178630220984153. https://doi.org/10.1177/1178630220984153.
Rosenberg, D. E., M. Babbar-Sebens, E. Root, J. Herman, A. Mirchi, M. Giacomoni, J. Kasprzyk, K. Madani, D. Ford, and L. Basdekas. 2017. “More integrated formal education and practice in water resources systems analysis.” J. Water Resour. Plann. Manage. 143 (12): 02517001. https://doi.org/10.1061/(ASCE)WR.1943-5452.0000847.
Rosenberg, E. A., P. W. Keys, D. B. Booth, D. Hartley, J. Burkey, A. C. Steinemann, and D. P. Lettenmaier. 2010. “Precipitation extremes and the impacts of climate change on stormwater infrastructure in Washington State.” Clim. Change 102 (1): 319–349. https://doi.org/10.1007/s10584-010-9847-0.
Shafique, M., and R. Kim. 2017. “Green stormwater infrastructure with low impact development concept: A review of current research.” Desalin. Water Treat. 83 (7): 16–29. https://doi.org/10.5004/dwt.2017.20981.
Shonkoff, S. B., R. Morello-Frosch, M. Pastor, and J. Sadd. 2011. “The climate gap: Environmental health and equity implications of climate change and mitigation policies in California—A review of the literature.” Clim. Change 109 (S1): 485–503. https://doi.org/10.1007/s10584-011-0310-7.
Smith, J. G., B. DuBois, and M. E. Krasny. 2016. “Framing for resilience through social learning: Impacts of environmental stewardship on youth in post-disturbance communities.” Sustainability Sci. 11 (3): 441–453. https://doi.org/10.1007/s11625-015-0348-y.
Spahr, K. M., J. M. Smith, J. E. McCray, and T. S. Hogue. 2021. “Reading the green landscape: Public attitudes toward green stormwater infrastructure and the perceived nonmonetary value of its co-benefits in three US cities.” J. Sustainable Water Built Environ. 7 (4): 04021017. https://doi.org/10.1061/JSWBAY.0000963.
Sprung-Keyser, B., N. Hendren, and S. Porter. 2022. The radius of economic opportunity: Evidence from migration and local labor markets. Washington, DC: Center for Economic Studies, US Census Bureau.
Sterzel, T., M. K. B. Lüdeke, C. Walther, M. T. Kok, D. Sietz, and P. L. Lucas. 2020. “Typology of coastal urban vulnerability under rapid urbanization.” PLoS One 15 (1): e0220936. https://doi.org/10.1371/journal.pone.0220936.
Stults, M., and L. Larsen. 2020. “Tackling uncertainty in US local climate adaptation planning.” J. Plann. Educ. Res. 40 (4): 416–431. https://doi.org/10.1177/0739456X18769134.
Susskind, L., J. Chun, S. Goldberg, J. A. Gordon, G. Smith, and Y. Zaerpoor. 2020. “Breaking out of carbon lock-in: Malaysia’s path to decarbonization.” Front. Built Environ. 6 (Mar): 21. https://doi.org/10.3389/fbuil.2020.00021.
The White House. 2021. “National climate task force.” Accessed June 29, 2023. https://www.whitehouse.gov/climate/.
Tien, I. 2022. “Recommendations for investing in infrastructure at the intersection of resilience, sustainability, and equity.” J. Infrastruct. Syst. 28 (2): 02522001. https://doi.org/10.1061/(ASCE)IS.1943-555X.0000684.
Tien, I., J.-M. Lozano, and A. Chavan. 2023. “Locating real-time water level sensors in coastal communities to assess flood risk by optimizing across multiple objectives.” Commun. Earth Environ. 4 (1): 1–12. https://doi.org/10.1038/s43247-023-00761-1.
Wang, M., M. Liu, D. Zhang, J. Qi, W. Fu, Y. Zhang, Q. Rao, A. E. Bakhshipour, and S. K. Tan. 2023. “Assessing and optimizing the hydrological performance of grey-green infrastructure systems in response to climate change and non-stationary time series.” Water Res. 232 (Apr): 119720. https://doi.org/10.1016/j.watres.2023.119720.
Information & Authors
Information
Published In

Journal of Water Resources Planning and Management
Volume 150 • Issue 9 • September 2024
Copyright
This work is made available under the terms of the Creative Commons Attribution 4.0 International license, https://creativecommons.org/licenses/by/4.0/.
History
Received: Jul 6, 2023
Accepted: Feb 12, 2024
Published online: Jun 27, 2024
Published in print: Sep 1, 2024
Discussion open until: Nov 27, 2024
Authors
Metrics & Citations
Metrics
Citations
Download citation
If you have the appropriate software installed, you can download article citation data to the citation manager of your choice. Simply select your manager software from the list below and click Download.