Drainage Alternatives for Rain Gardens on Subsoil of Low Permeability: Balance among Ponding Time, Soil Moisture, and Runoff Reduction
Publication: Journal of Sustainable Water in the Built Environment
Volume 8, Issue 3
Abstract
Rain gardens are commonly used as green infrastructure to reduce runoff volume and introduce ecological benefits to urban areas. The objective of this study was to evaluate hydrologic performance of a rain garden constructed on low-permeability subsoil with three different drainage systems: no drain, underdrain, and surface drain. A surface-subsurface hydrologic model was implemented in the evaluation. The mathematical model incorporates processes of runoff inflow, direct precipitation, infiltration, evapotranspiration (ET), exfiltration, and outflow. This modeling assessment used a rain garden with subsoil permeability of , ponding and media depth of 304.8 mm each, and loading ratio (contributory catchment area over rain garden area) of 5:1 under rainfalls over an entire year as well as individual design storms in New Jersey. Over an entire year, the longest continual ponding times are 880, 8, and 12 h for design alternatives of no drain, underdrain, and surface drain, respectively. Mosquito issues might arise from long ponding time for the no-drain design. Soil moisture of all three drainage designs never reaches down to the wilting point. Volume reduction of stormwater runoff for the three drainage designs are 89%, 15%, and 58%, respectively. The hydrologic performance for individual design storms (1, 2, 5, 10, 25, 50, and 100 year) was also addressed. Differences of effectiveness in runoff volume reduction for individual storms among the three drainage designs are consistent with those for the entire year. However, the underdrain design has the best performance in peak runoff rate reduction. Taken together, the surface drainage system has the best balance among runoff reduction for flood mitigation, soil moisture for plant survival, and ponding time for mosquito issues. The surface drainage design is recommended for a rain garden if it is installed on subsoil of low permeability and if the runoff captured does not require a substantial water quality improvement.
Introduction
Stormwater management has become an important component within urban and suburban areas due to rapid urban development that greatly increases surface imperviousness (Dietz 2007). Although the centralized best management practice (BMP) could effectively remove pollutants and control stormwater runoff, it still has a negative impact on the natural hydrology and ecosystem (Coffman et al. 1999; US EPA 2000). The idea of low impact development (LID) has received attention, aiming to restore the developed watershed to predevelopment hydrological conditions (Van Roon 2005; Zhang et al. 2016). Rain gardens, often referred to as small-scale bioretention or bioinfiltration, have been recommended to control storm runoff at the source due to their cost effectiveness and positive impact on restoring ecosystems (US EPA 2000).
A rain garden is a shallow depression in the landscape typically receiving stormwater runoff from nearby impervious surfaces such as rooftops, parking lots, and sidewalks (Dietz and Clausen 2005; Dussaillant et al. 2004; Jia et al. 2013; Zhang et al. 2016). A rain garden usually consists of a soil media layer planted with vegetation; the water could directly infiltrate into the subsoil or be discharged through an underdrain structure (NJDEP 2014). In the US, engineered soil for media is a mixture of sand, soil, and organic compost (Thompson et al. 2008). The function of the engineered soil is to treat stormwater runoff and provide a media for biological growth (Carpenter and Hallam 2010). Rain gardens could be built without subsurface drainage systems (underdrain systems) depending on the infiltration capability of the subsoil.
In many states of the US, guidance documents for rain gardens indicate that it is inappropriate to build rain gardens on soil with hydraulic conductivity less than () (Jennings et al. 2015). In New Jersey, the minimum subsoil design permeability rate (hydraulic conductivity) is (), and maximum design storm drain time (ponding time) is 72 h (NJDEP 2014). The ponding time is an important factor for mosquito issues. Mosquitoes are vectors of many animal and human diseases (Chase and Knight 2003). Most mosquito species require 7 days for transitioning from larvae to adult, while some species could accomplish this process within 4.5 days (Jennings 2016). Standing and shallow water lasting for more than 4 days could encourage mosquito growth (Dietz and Clausen 2005). To reduce the ponding time, it is important to add a drain system for those rain gardens built on poorly infiltrated areas.
Many factors could impact the performance of LID-BMPs. Hydrologic performance on reducing surface runoff and pollutants removal depends on the storm characteristics, loading ratio (runoff contributory catchment area over rain garden area), and effective storage volume of rain gardens (Gilroy and McCuen 2009; Jackisch and Weiler 2017; Schneider and McCuen 2006). Furthermore, Xing et al. (2016) found that layout of green infrastructures had impact on the total outflow reduction.
There have been research studies to quantify hydrologic performance of rain gardens, such as runoff volume reduction, ponding time, and soil moisture during a certain amount of time. Jennings et al. (2015) presented an analysis algorithm evaluating the performance regarding stormwater runoff volume reduction, infiltration/exfiltration, and evapotranspiration. Their research concluded that even rain gardens with a loading ratio of 10:1 built on low-permeability soils () could have 55% runoff volume reduction at certain rainfall events. Winston et al. (2016) monitored three rain gardens built on low-permeability soil and found that the rain gardens achieved a volume reduction rate of 36%–59% mainly due to the exfiltration and effective internal storage volume of the media layer (with the outlet connection to the underdrain elevated such that all or a portion of the media is fully saturated). Hunt et al. (2008) examined peak flow mitigation effects by a relatively deep bioretention cell (1.2 m deep) in North Carolina for two years and concluded that bioretention can effectively reduce peak runoff under small to midsize rainfall events (up to 40 mm rainfall depth) with a mean reduction rate of 99%. Tang et al. (2015) showed that the characteristics of soil could greatly affect the performance of rain gardens (e.g., the loess soil in Xi’an area had high infiltration capacity () so that stormwater could easily infiltrate downward and recharge groundwater). Chui and Trinh (2016) used a HYDRUS-2D model to evaluate the performance of a bioretention system and concluded that conversion of 5% of the catchment area to bioretention basin could enhance infiltration of the whole watershed, though not to the natural level. Anderson et al. (2018) used a stormwater runoff simulator to evaluate the hydrologic performance of rain garden (i.e., storage capacity, drawdown rate, ponding depth, and overflow characteristics) pointing out that subsurface storage of the system can make up for a lack of surface storage. They showed on average, 59% of the applied runoff infiltrated before overflow, 2.7 times more than the surface storage. DelVecchio1 et al. (2020) conducted laboratory experiments and investigated the impact of soil type and flow pattern on infiltration and evapotranspiration (ET). They found that one-dimensional (vertical flow) systems are deep infiltration dominated, while two-dimensional systems (horizontal flow) had nearly equal volume reduction from deep infiltration and ET. Ahmadisharaf et al. (2021) used the US Environmental Protection Agency’s Storm Water Management Model (EPA-SWMM) to evaluate the flood mitigation and total suspended solids (TSS) removal of retention ponds, and their results indicated that for their study case, a large retention pond was more efficient than a series of small retention ponds for both flood mitigation and TSS removal and the retention ponds reduce both peak flow and TSS more effectively in smaller storm depths. Nichols et al. (2021) created a hydrologic model with HYDRUS-1D to evaluate the performance of a rain garden built in an urban area and found that in the cold season the maximum loading ratio could be as high as 15:1. Bethke et al. (2022) used EPA-SWMM to simulate hydrologic performance of a rain garden under different environmental conditions. They found that the planting media thickness and soil porosity in a rain garden were significant indicators of overflow in native soils with lower seepage rates.
The performance of rain gardens depends on many factors based on previous studies (e.g., hydraulic conductivity, effective storage, and rainfall intensities). Although rain gardens are not recommended to be built on the low-permeability subsoil based on some states’ manuals, this study aims to address two research questions: (1) What is the overall hydrologic performance of rain garden built on subsoil of low-permeability? and (2) How different drainage designs can improve the performance of rain garden under this situation? Our study objective was to use a mathematical model to demonstrate and compare the hydrologic performance between rain gardens with different types of drainage. This was achieved by evaluating the degrees of stormwater runoff volume reduction, changes in the soil moisture and the ponding time through numerous storm events over an entire year, as well as evaluating the performance of these rain garden designs under large individual storm events of different return periods.
Methods
Alternative Drainage Designs
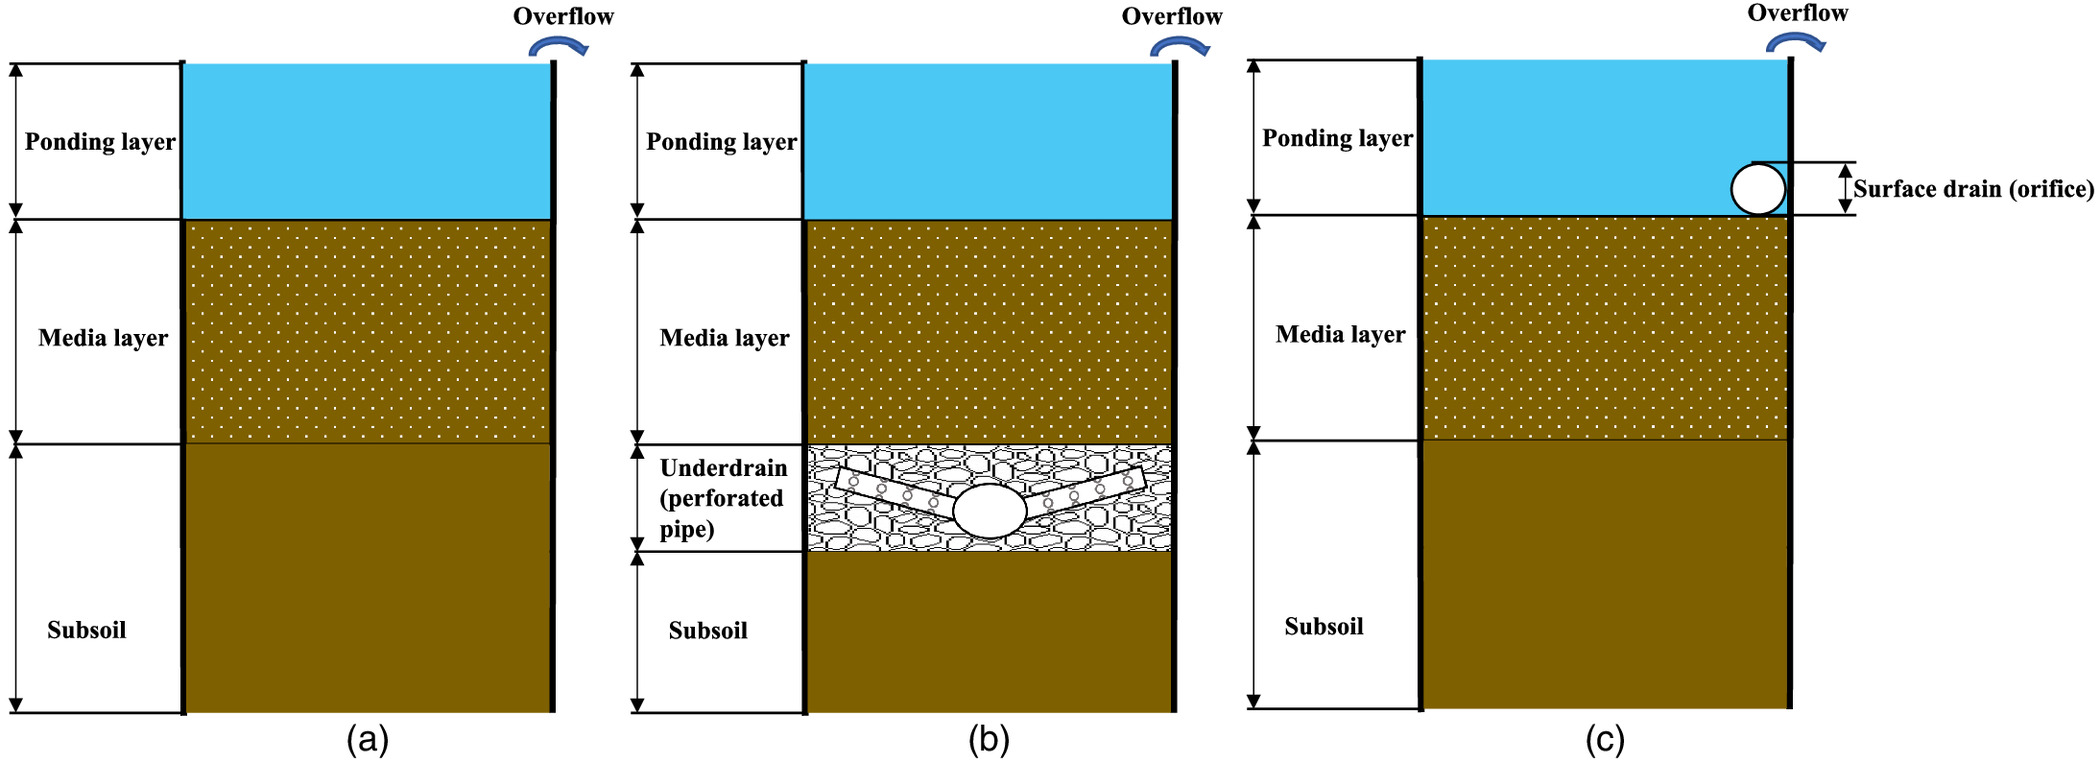
Three types of drainage designs were evaluated in this study: no drain, underdrain, and surface drain (Fig. 1). For rain garden with no-drain design, stormwater runoff will either infiltrate completely into the subsoil during small storms or overflow from the top of the berm during large storms (Endreny and Collins 2009; Prince George’s County 1993). The underdrain design consists of a perforated pipe installed below the media layer of the rain garden to drain the water from surface infiltration (Guo 2003; Roy-Poirier et al. 2010; Davis et al. 2009; Zhang and Guo 2013). The surface-drain design, which was newly proposed in this study to be added to rain gardens installed on subsoils of low permeability, consists of an outlet structure with an invert located on top of the media layer of the rain garden to drain the standing water.
Mathematical Model
The mathematical model is based on water balance in three parts of the rain garden, which are, from bottom to top, the subsoil, media layer, and ponding layer (Fig. 2). It is used to simulate hydrologic performance indicated by soil moisture, ponding time, and runoff reduction. Components of the water balance considered include runoff inflow from the catchment area (), direct precipitation on the rain garden (), ET from the rain garden, infiltration into the media layer (), exfiltration to the subsoil (), and outflow from the rain garden ().

Outflow from the rain garden would be calculated differently depending on which type of drainage (Fig. 1) has been chosen. Moreover, if the ponding water depth exceeds the berm height of the rain garden, overflow would occur for all the drainage designs and be added to the outflow. Mulch layer is not always required for all rain gardens, and the mulch layer is omitted to simplify the model. Since permeability rate of the media layer is normally much higher than that of the subsoil, especially in this study case of low-permeability subsoil, the infiltration from the ponding layer to the media layer below () is assumed to be a nonlimiting factor and this process is not explicitly modeled.
Inputs to this rain garden model include dimensions and properties of the rain garden, rainfall data, subsoil hydraulic conductivity, evapotranspiration coefficients, field capacity and porosity of soil media, and other parameters (Table 1). The catchment area that the rain garden served has a total area of (), while the rain garden itself has a total area of () with ponding depth and media depth of 304.8 mm (). The dimensions were taken from an actual rain garden located in Linden, New Jersey. Since stormwater runoff comes from the parking lot, this catchment area is assumed to be 100% impervious.
| Rain garden parameter | Value | Source |
|---|---|---|
| Garden area | Measured | |
| Catchment area | Measured | |
| Runoff coefficient | 1.0 | Assumed |
| Subsoil hydraulic conductivity | Measured | |
| Berm height | 304.8 mm | Measured |
| Media depth | 304.8 mm | Measured |
| Media porosity | 0.45 | Thompson et al. (2008) and NRCCA (2010) |
| Media field capacity | 0.25 | Thompson et al. (2008) and NRCCA (2010) |
| Diameter of outlet orifice | 63.5 mm | NJDEP (2014) |
| Discharge coefficient | 0.62 | Daugherty and Franzini (1977) |
| Crop coefficient (growing stage, May to August) | 1.2 | Allen et al. (1998) and Jennings et al. (2015) |
| Crop coefficient (other stages) | 0.3 | Allen et al. (1998) and Jennings et al. (2015) |
Hourly rainfall data was used when the hydrologic performance over an entire year was modeled. Rainfall data at Newark Liberty International Airport, New Jersey, was downloaded from the National Oceanic and Atmospheric Administration (NOAA) (NOAA 2014). This rain gauge is located 9.4 km away from the rain garden. Simulation of rain garden hydrologic performance over entire years was conducted using meteorological data from the years 2001, 2009, and 2011 at Newark, New Jersey. Major analysis was based on the year 2009, considered to be an average rainfall year in this study, because the total rainfall depth was 1,198 mm (), which is comparable to New Jersey’s average annual precipitation of 1,168 mm () (Broccoli et al. 2013). The total precipitation depths of years 2001 and 2011 were 775 mm () and 1,776 mm (), respectively, and considered to be a dry year and a wet year in this study. The initial soil media moisture content was assumed to be 0.25 (an assumed field capacity based on the literature in Table 1) on January 1st of each modeling year.
Peak runoff rate reduction, in addition to runoff volume reduction, was evaluated for individual storm events of different recurrence intervals (1-, 2-, 5-, 10-, 25-, 50-, and 100-year storms). For an individual storm event, based on the New Jersey Stormwater Best Management Practices (NJBMP) manual, the peak flow reduction should be evaluated under the Natural Resources Conservation Services (NRCS)’ 24-h design storm. New Jersey is located in the region with the NRCS Type III rainfall distribution (NRCS 1986). The NRCS 24-h Type III design storm of 6-min (0.1 h) interval was used when evaluating the hydrologic performance over an individual storm event. The design storm distribution is shown in Fig. S1 . Time of concentration on the catchment area is assumed to be zero and the runoff coefficient is assumed to be 1.0 since the area is a very small impervious parking lot (Table 1). This assumption is conservative and should not make a significant difference either. The same as the modeling of entire year, the initial soil media moisture content was assumed to be 0.25 for the modeling of individual design storms.
Modeling of Rain Garden with No-Drain Design
The no-drain design (Fig. 1) model simulates the stormwater runoff coming from the catchment area (), direct precipitation (), ET, and exfiltration into subsoil (). In the model developed, the water storage () was calculated as a series of water storage () by considering the involved processes in sequence (step by step), the same procedure used by Jennings et al. (2015), as outlined in the following:
1.
Compute the water storage [the temporary water storage at calculation Step no. 1 at the time segment no. ()] to account for water storage in the ponding layer (if any) and water storage in the media layer at the previous time segment as well as runoff from catchment area and the direct precipitation on rain garden during the th time incrementwhere = water storage within the rain garden (); = rain garden area (); = water ponding depth in rain garden at the th time segment (m) (with ); = volumetric soil moisture content at the th time segment; = media layer depth (m); = runoff coefficient; = catchment area (); and = rainfall depth during the th time increment (m). Note , and in this study.
(1)
2.
Calculate the water storage to account for the media layer exfiltrationwhere = exfiltration of media layer during the th time increment (m). The exfiltration rate is set equal to the hydraulic conductivity of the subsoil when the water is available for exfiltration.
(2)
3.
Calculate the water storage to account for evapotranspiration rate of the rain gardenwhere = evapotranspiration rate during th time increment (m). Evapotranspiration rate was based on the monthly mean temperature (given in a separate section that follows). Evapotranspiration rate was assumed to be zero during the time when it is raining.
(3)
4.
Calculate ponding water depth , which subtracts the maximum possible water-only depth in the media layer from the water-only depth where = media layer porosity.
(4)
5.
Calculate the water ponding depth at the th time increment and calculate the outflow at the th time incrementwhere = berm height of rain garden. If the ponding water depth exceeds berm height , overflow occurs. The overflow, if any, is assumed to drain completely into the local storm sewer system within the respective time increment.
(5)
(6)
6.
Calculate the volumetric soil moisture content of the media layer at the th time increment
(7)
Modeling of Rain Garden with Underdrain Design
When modeling the underdrain system (Fig. 1), exfiltration rate () was calculated by adding design drainage rate to the exfiltration rate of the subsoilwhere = design drainage rate of the underdrain system (m/h); and = rate of exfiltration to subsoil (m/h).
(8)
The underdrain system simulation followed the same steps with no-drain design model, the only difference was the exfiltration rate. This study initially used underdrain with an assumed design drainage rate of to compare with no drain and surface drain for the annual hydrologic simulation. The assumption of the underdrain drainage rate of was based on the minimal allowable hydraulic conductivity of with a safety factor of 2 for the subsoil specified in the NJBMP manuel (NJDEP 2014). Then the study compared and evaluated performance under different assumed design drainage rates of 12.7, 25.4, 50.8, and . The underdrain piping system would need to be hydraulically sized to realize the assumed design drainage rates. The aggregate bed for the underdrain system was not considered in this model. The aggregate bed within the underdrain design is typically not designed to detain water, rather, it is typically designed as a pathway/passage of water to the underdrain pipe network and the subsoil further below. However, if the underdrain drainage capacity is smaller than the infiltration capacity of the soil media layer above, some water would be detained in the aggregate bed and the water ponding time and the peak runoff reduction would be affected.
Modeling of Rain Garden with Surface-Drain Design
Surface drain (Fig. 1) was designed with an orifice invert positioned on the top of the media layer. Different sizes of orifice were evaluated in this model: 12.7, 25.4, 38.1, 50.8, and 63.5 mm. The diameter of 63.5 mm () is the smallest orifice diameter allowable for the surface drain in NJBMP manual (NJDEP 2014). Stormwater in the ponding layer would drain through this orifice. Outflow rate depends on the water level in the rain garden. With the given thresholds of berm height and orifice diameter, the modeled water level may not reflect the actuality (e.g., drop too fast) if the model is run with hourly intervals. In this model, rainfall data, infiltration, exfiltration, and evapotranspiration rates were assumed to be uniformly distributed within each hour. However, the model was run in 10 time increments within each 1-h loop, and the changes in water level caused by surface drainage were calculated every 6 min. The surface-drain process was calculated after considering exfiltration at Step 2.
Orifice drainage rate was calculated by using Vatankhah’s method (Vatankhah 2011, 2018). For partially submerged orifice, flow rate (m3/s) can be computed aswhere = discharge coefficient; = gravitational acceleration (m/s2); = orifice diameter (m); and = ponding water depth of rain garden (m). Note that for a fully submerged orifice condition, flow rate was formulated in a standard way aswhere = orifice area ().
(9)
(10)
Modeling of Evapotranspiration
Evapotranspiration is the combination of water loss from the soil surface through evaporation and transpiration from plants (Allen et al. 1998; Denmead and Shaw 1962). Evapotranspiration potential is widely estimated by reference evapotranspiration and crop coefficient. Hargreaves’s method (Hargreaves 1994) was used in this research, and potential evapotranspiration (PET) was formulated aswhere = crop coefficient; = reference evapotranspiration rate (m/d); = extraterrestrial radiation with the same unit as (m/d); = average of monthly mean maximum temperature and monthly mean minimum temperature (°C); and = monthly mean maximum temperature minus monthly mean minimum temperature (°C). The monthly mean maximum and mean minimum temperature data of New Jersey were from NOAA and based on years 1981–2000. The 100% of vegetation density and single crop coefficient condition was assumed to evaluate the effect of evapotranspiration.
(11)
(12)
There is no crop coefficient specific to the type of plants in rain gardens for estimating the evapotranspiration potential. Hess et al. (2019) provided the recommendation of values for rain garden plants based on total leaf count, showing that initial stage is between 0.3 and 0.4, middle stage is between 0.85 and 1.25, and ending stage is between 0.45 and 0.8. Jennings et al. (2015) used reed swamp wetland species for the rain garden, having the values of 0.3, 1.2, and 0.3 for initial, middle, and ending stage, respectively. Based on those two studies and previous assumptions, this study used the value for wetland species from the Food and Agriculture Organization (FAO) (Allen et al. 1998). The growing stage starts May 1st and lasts 110 days with value of 1.2, while the other stage has a value of 0.3.
Evapotranspiration rate depends on the potential evapotranspiration rate and soil water content (Brocca et al. 2008), yieldingwhere PET = evapotranspiration potential (m/d); = volumetric soil moisture content; and = maximum volumetric soil moisture content.
(13)
Results and Discussion
In this section, data from year 2009 was used in subsections of ponding time, runoff volume reduction, soil moisture analysis, underdrain system with different design drainage rates, and surface drainage system with different design orifice diameters. Water depth and moisture content plots for year 2001 and 2011 can be found in Figs. S2 –S5 .
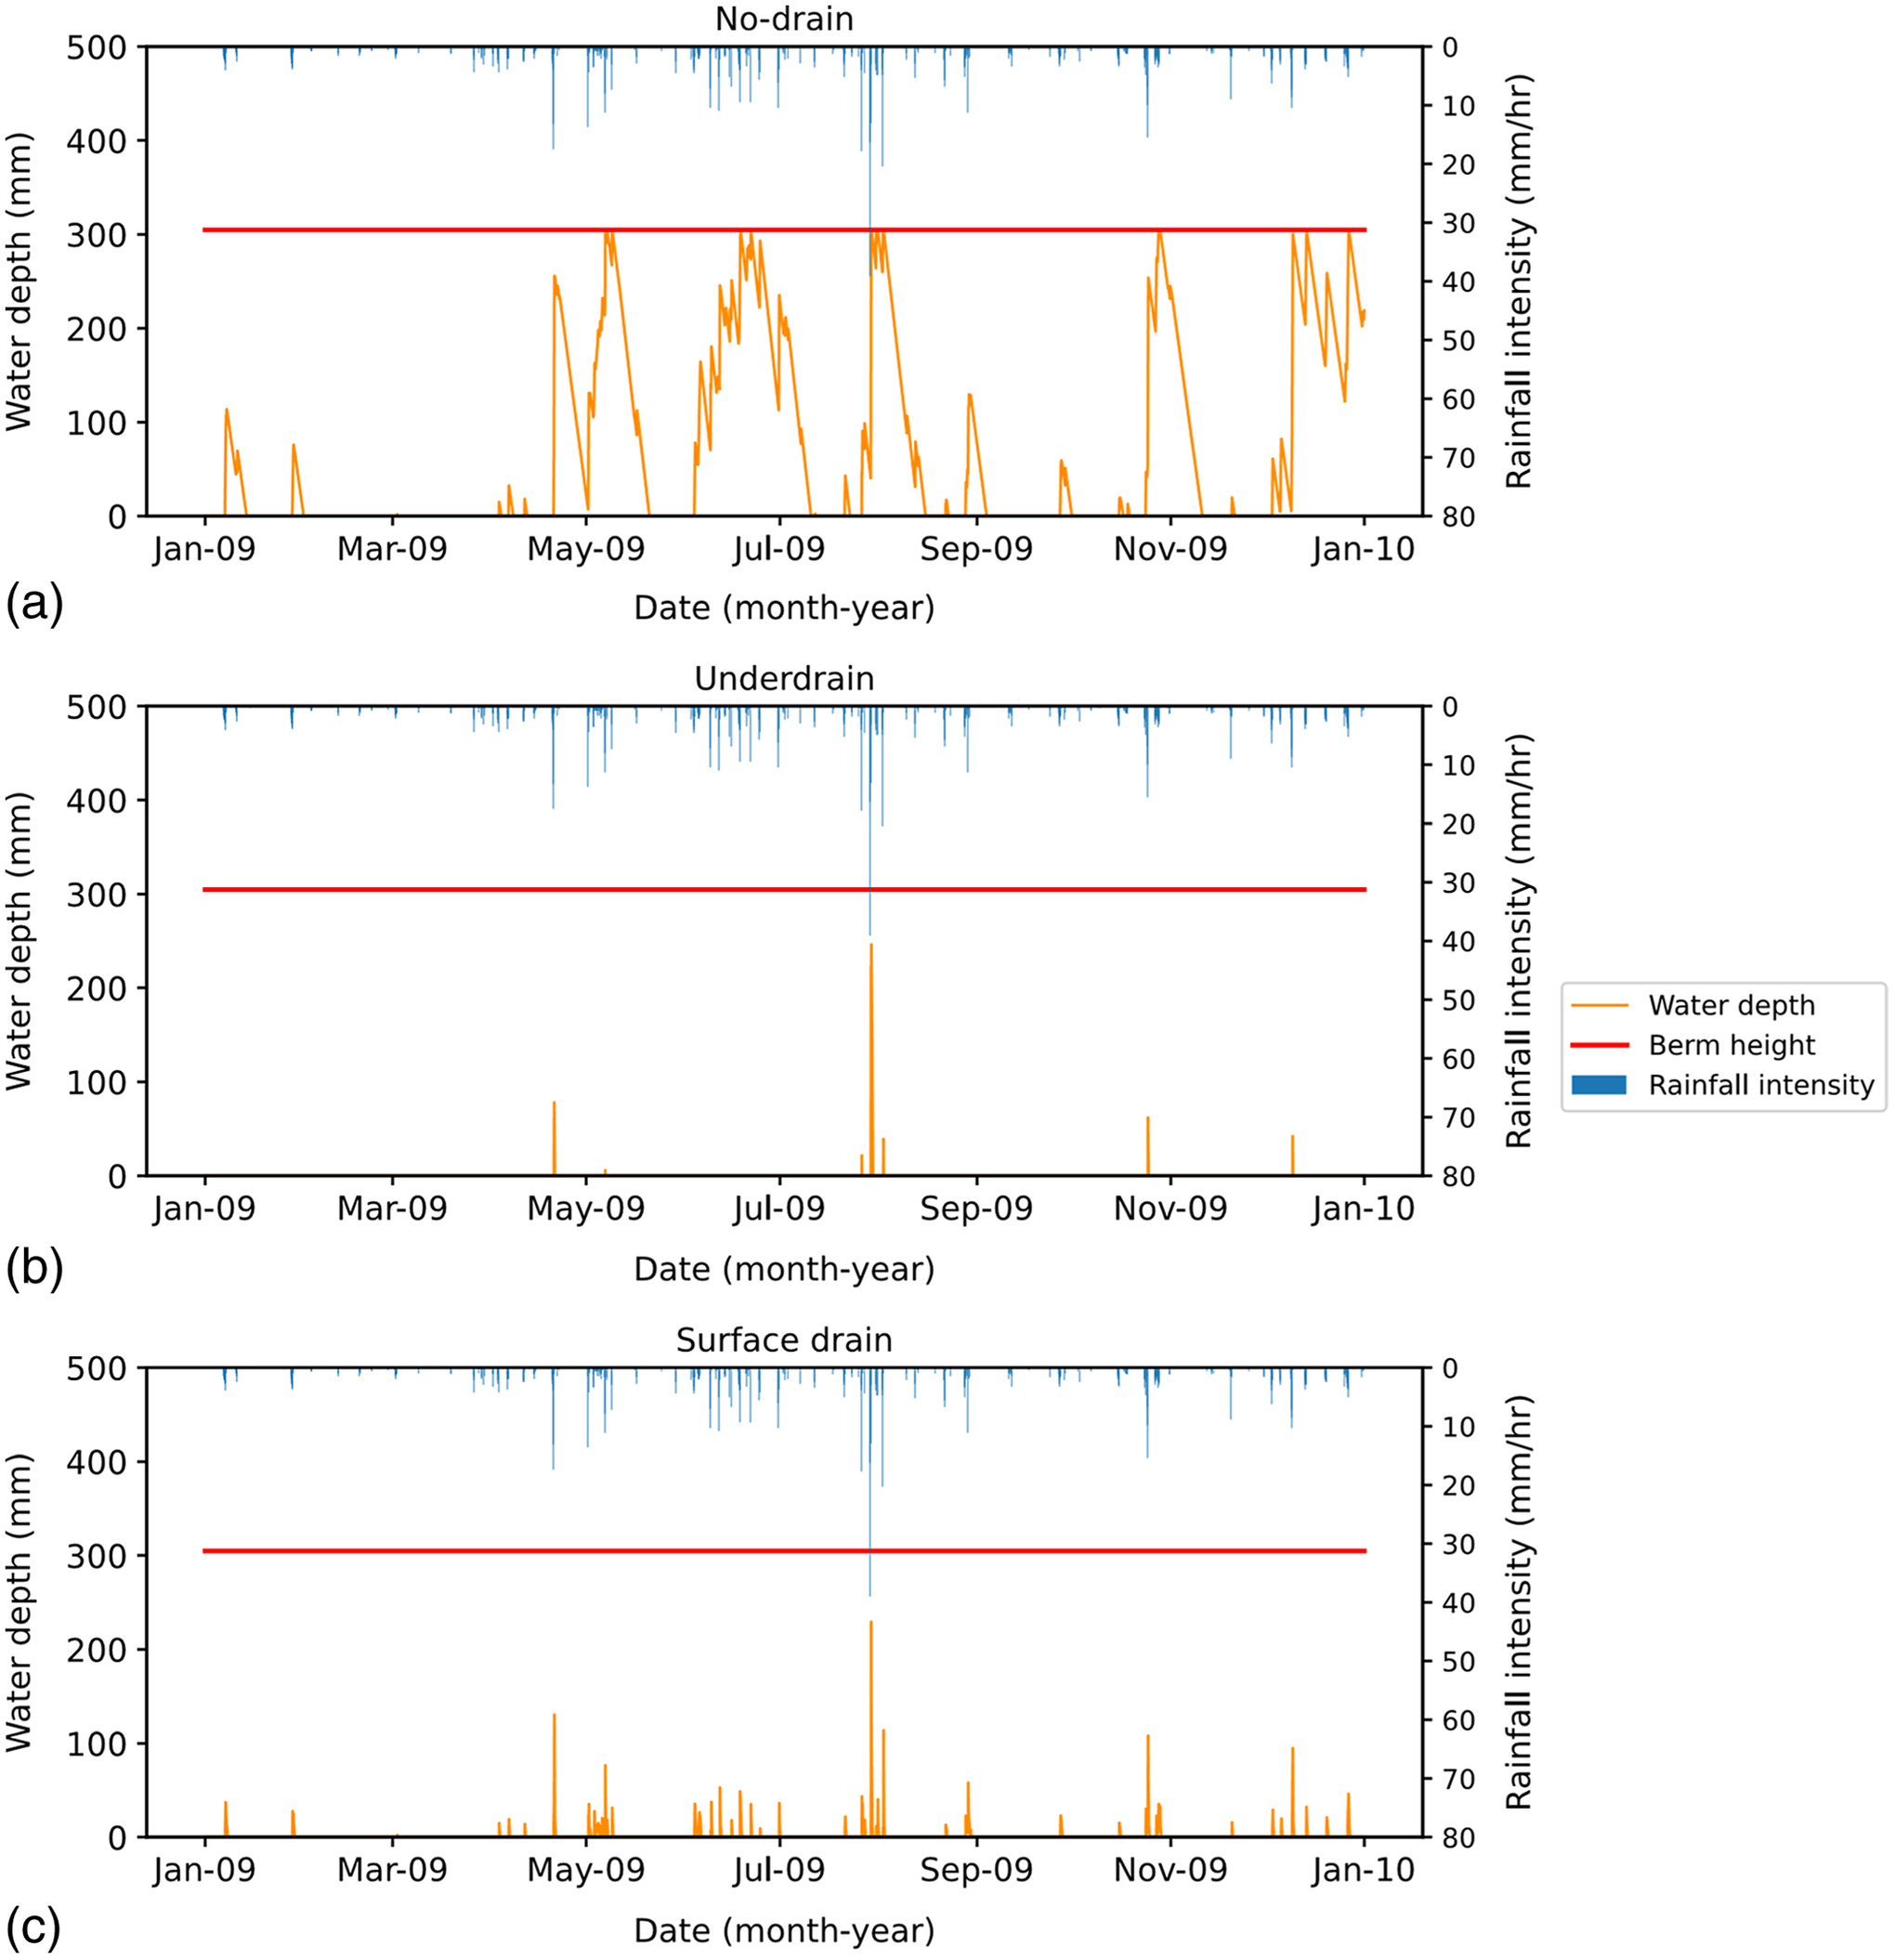
Ponding Time
Water depth changes are present in Fig. 3. No-drain system had the longest ponding time with 44.6% of the whole year, while the rain garden with underdrain had the least ponding time with only 0.4% of the entire year. The rain garden with a surface-drain system has a ponding time of 8.0% of the entire year. Besides, no-drain design had the longest continual ponding time with 880 h (37 days) from June to July, while the underdrain system and surface-drain system only had 8 and 11 h ponding time, respectively. Both designs with drainage systems met the New Jersey requirement that standing water in the rain garden should be drained within 72 h after a rainfall event (NJDEP 2014). Mosquito season in New Jersey is from April to September, when more than 60% volume of annual rainfall occurs. The longest ponding time happens in June when the air temperature is relatively warm. During the spring and summer, no-drain design would have mosquito issues very often unless some predators such as frogs are present. Plant health could also be negatively affected by the long ponding time for the no-drain design.
Runoff Volume Reduction
Runoff volume reduction has been used to quantify how much water was retained (through exfiltration to subsoil and evapotranspiration to atmosphere) by the rain garden under each condition. No-drain design had an 89.2% runoff reduction, which means 89.2% of stormwater either infiltrated into subsoil or was lost through evapotranspiration and 10.8% of total runoff was discharged as overflow. However, underdrain system and surface-drain system had runoff reduction rates of 14.7% and 57.6%, respectively. There is no overflow situation for underdrain with design drainage rate of (). The result indicates that the underdrain system could drain all the stormwater runoff quickly and effectively. However, this design has a low capability for groundwater recharge. The surface drain had better runoff reduction because each rainfall filled the media layer first, and water kept in this layer would exfiltrate into subsoil instead of the surface orifice. For surface-drain design, outflow rate depends on the height from the standing water level to the orifice centroid. The outflow rate is small at the beginning of the ponding. However, it could be as high as (with the water level dropping rate of or ) when the water level is at the berm height. Although the surface-drain system kept more water in the soil, unlike the underdrain system, none of the outflow was filtrated by the media layer. This means water quality improvement such as pollutant (e.g., TSS) removal through the filtering mechanism cannot be achieved. This could be a significant deficiency for the surface-drain system.
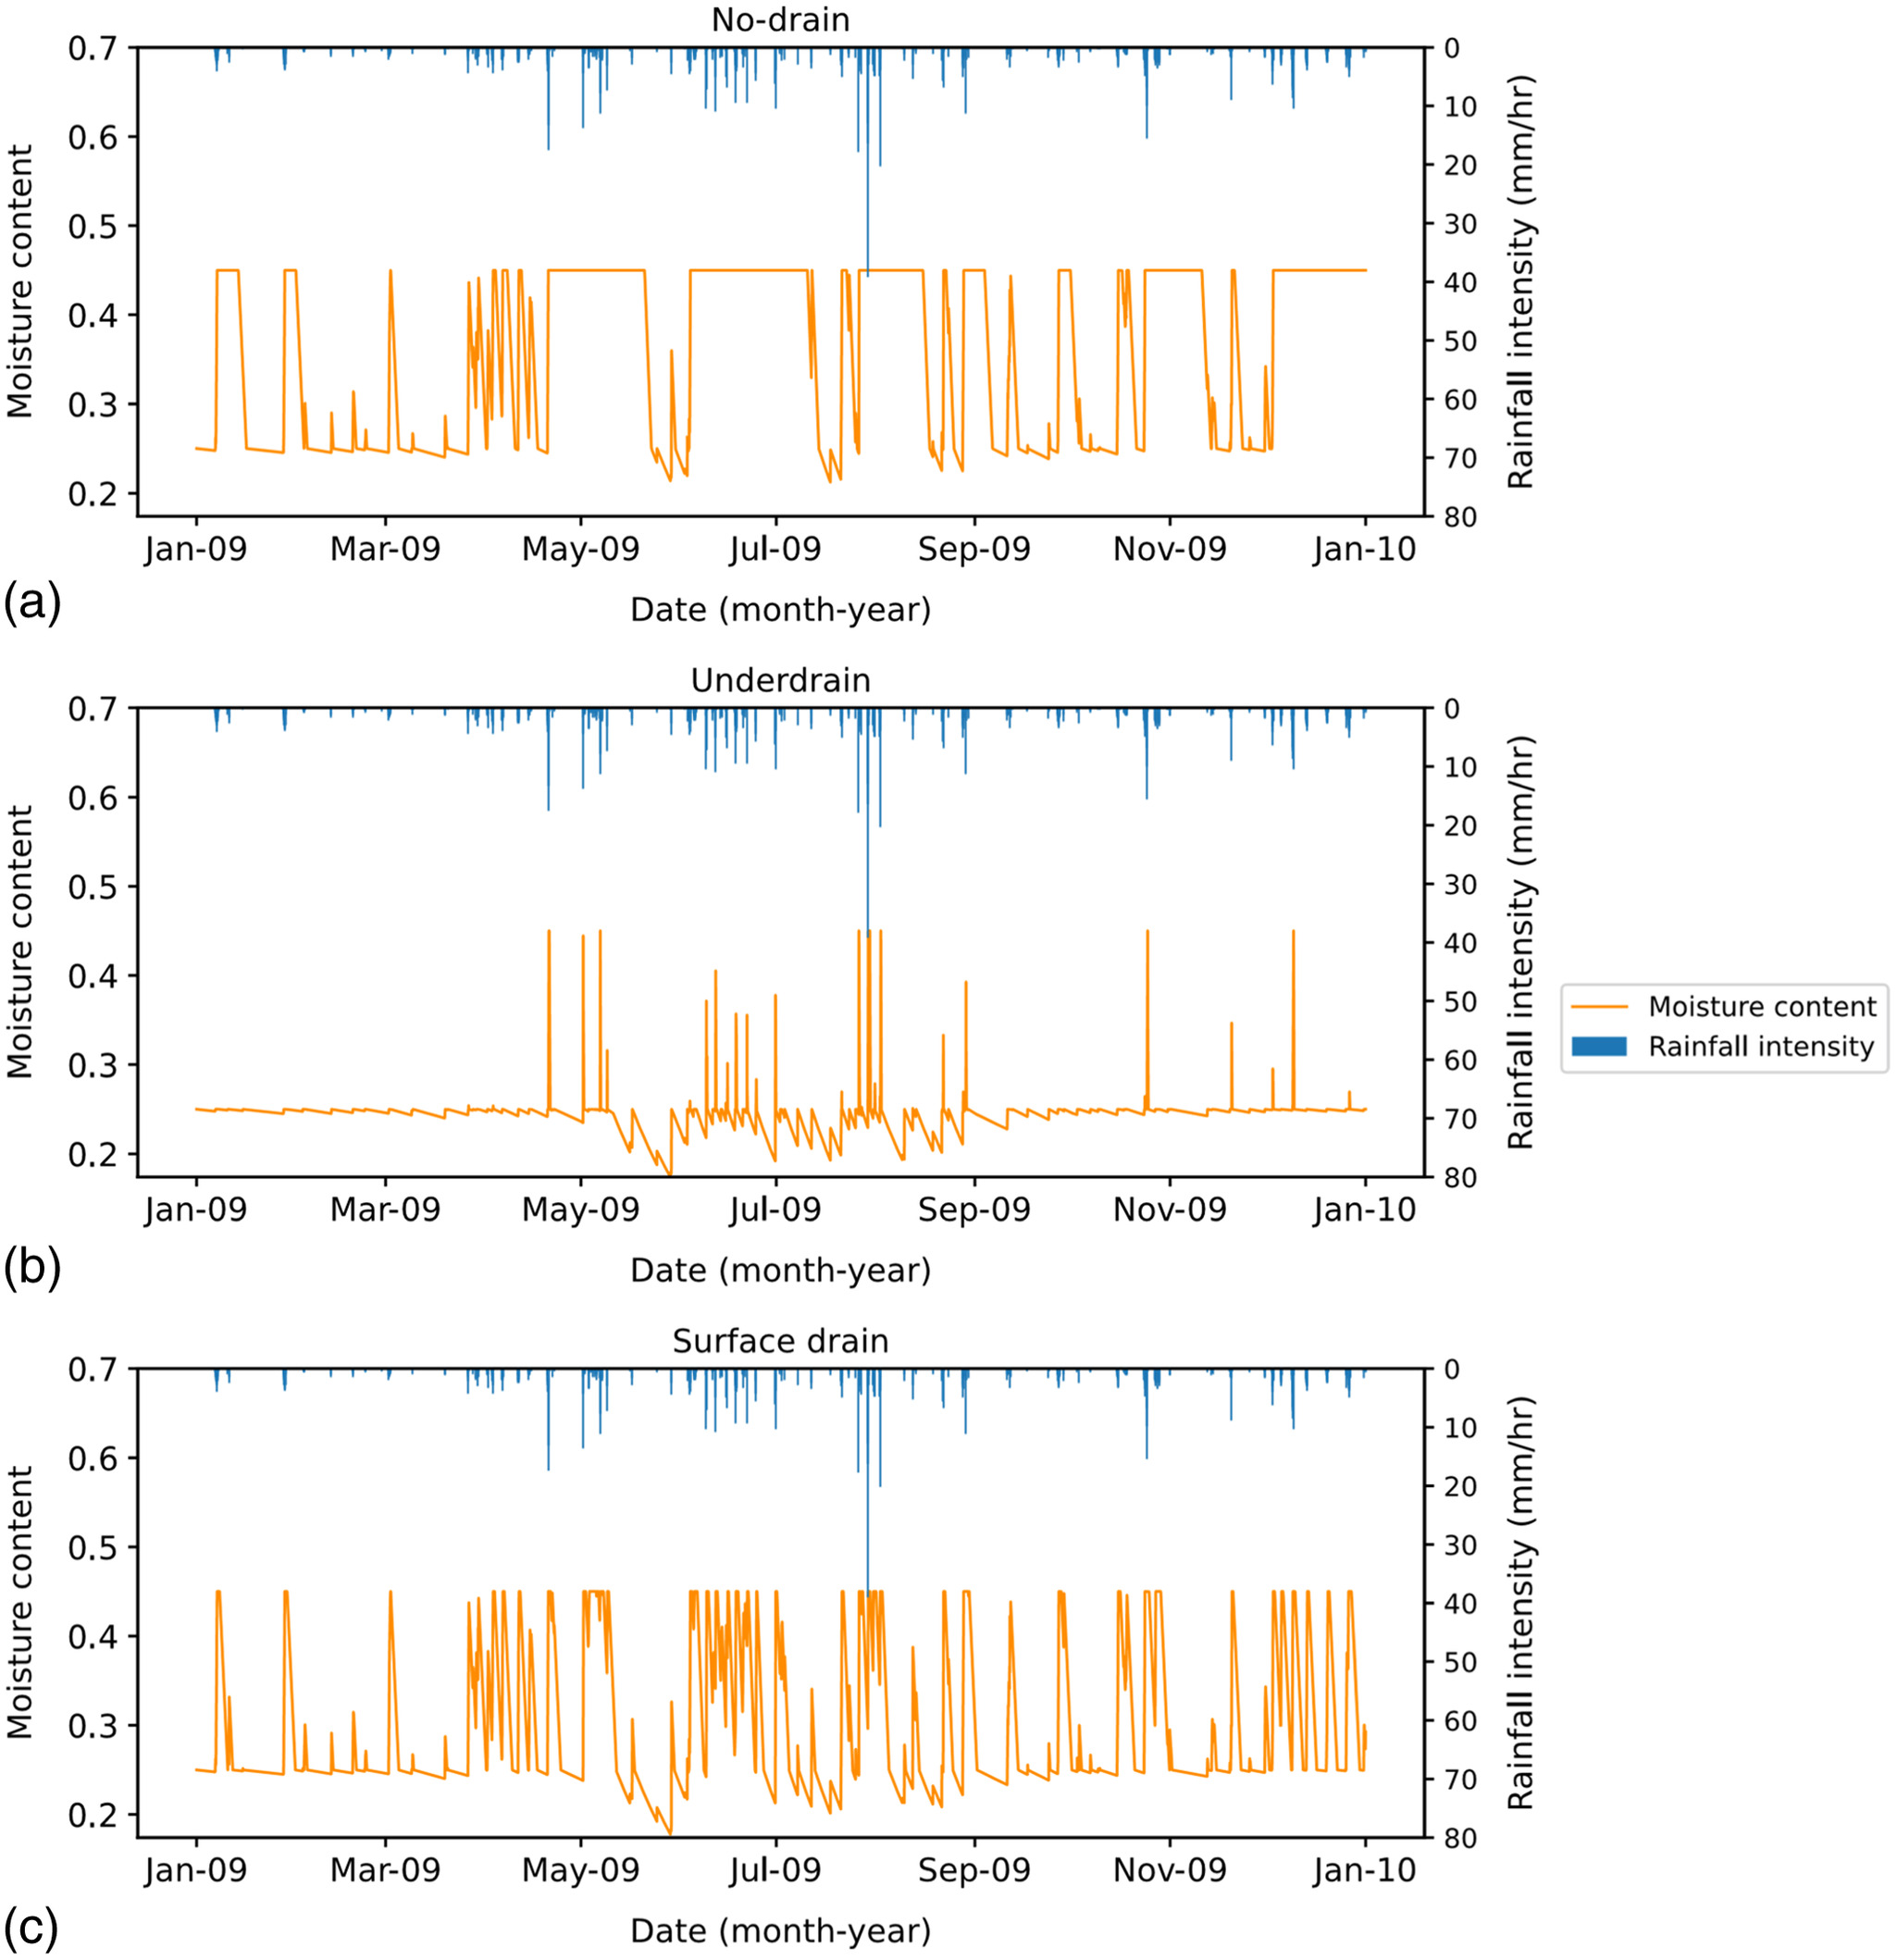
Soil Moisture
Fig. 4 presents soil moisture (media moisture) under the three different drainage designs during the whole year. For all three drainage designs, the soil moisture decreased rapidly from saturation to the field capacity due to exfiltration into subsoil and/or outflow from the drainage systems. When the soil moisture is below the field capacity, soil moisture decreased slowly because evapotranspiration is the only factor affecting water content. The no-drain design had an average soil moisture content of 0.35, with the lowest value of 0.21. The underdrain design had an average soil moisture of 0.24, with the lowest value of 0.17. Surface-drain design had an average soil moisture of 0.29, with the lowest value of 0.18. All three designs had soil moisture contents higher than the wilting point that was equal to 0.1. Plants could survive and grow well in this rain garden. The soil moisture of the no-drain design was above 0.20 at all times. The maximum continual time that soil moisture was below 0.20 was 97 and 83 h for underdrain and surface-drain design, respectively. July had the largest evapotranspiration rate of , while January had the smallest evapotranspiration rate of (Table 2). The evapotranspiration rate during summer was 7 times that during winter. Low soil moisture usually happened between May and September when the evapotranspiration rate was among the highest.
| Parameter | Month | |||||||||||
|---|---|---|---|---|---|---|---|---|---|---|---|---|
| January | February | March | April | May | June | July | August | September | October | November | December | |
| Min. temperature (°C) | 3.8 | 5.7 | 10.4 | 16.7 | 22.3 | 27.5 | 30.0 | 28.9 | 24.8 | 18.5 | 12.6 | 6.4 |
| Max. temperature (°C) | 0.9 | 6.5 | 11.8 | 17.4 | 20.4 | 19.7 | 15.4 | 8.9 | 3.9 | |||
| Extraterrestrial radiation (mm/d) | 6.4 | 8.6 | 11.4 | 14.3 | 16.4 | 17.3 | 16.7 | 15.2 | 12.5 | 9.6 | 7 | 5.7 |
| Evapotranspiration (mm/d) | 0.73 | 1.11 | 1.89 | 3.09 | 4.26 | 5.09 | 5.12 | 4.46 | 3.34 | 2.15 | 1.23 | 0.74 |
Underdrain System with Different Design Drainage Rates
Table 3 presents the modeled results for the drainage option of an underdrain system regarding different design drainage rates. It should be noted that the infiltration rate in the model is equal to the design drainage rate plus the exfiltration rate into the subsoil ( when the water is available). As the design drainage rate increases, the longest continual ponding time decreases quickly. With the design drainage rate of , there is only 1 h of ponding time after each storm event during the whole year. However, the runoff volume reduction rate does not change as quickly as the continual ponding time. There is only 1 h in which overflow occurs for underdrain design with the design drainage rate of (), which happened during the largest rainfall on July 29, 2009. Underdrain designs with design drainage larger than () have no overflow for the entire modeling year. The continual time with soil moisture content below 0.2 is the same for all the design drainage rates, and the lowest soil moisture content is the same as well. The lowest soil moisture content occurred after the longest period of no rainfall. The average soil moisture decreases slightly as the underdrain design drainage increases, and all could maintain a soil moisture higher than the wilting point. This is because the underdrain makes water in the media layer drain fast only until soil moisture reaches the field capacity.
| Parameter | Underdrain drainage rate (mm/h) | |||
|---|---|---|---|---|
| 12.7 | 25.4 | 50.8 | 101.6 | |
| Overflow (%) | 0.1 | 0 | 0 | 0 |
| Drainage (%) | 83.3 | 85.3 | 85.9 | 86.0 |
| Evapotranspiration (%) | 5.1 | 5.0 | 5.0 | 5.0 |
| Exfiltration (%) | 11.5 | 9.7 | 9.1 | 9.0 |
| Runoff volume reduction (%) | 16.6 | 14.7 | 14.1 | 14.0 |
| Average soil moisture content | 0.25 | 0.24 | 0.24 | 0.24 |
| Lowest soil moisture content | 0.17 | 0.17 | 0.17 | 0.17 |
| Longest continual ponding time (h) | 23 | 8 | 3 | 1 |
| Continual time with soil moisture below 20% (h) | 97 | 97 | 97 | 97 |
Surface Drainage System with Different Design Orifice Diameters
Table 4 presents modeled results for the surface-drain designs with different orifice diameters. Applying a very small orifice (12.7 mm, in diameter) could make the rain garden retain 64.9% of the total stormwater annually, with a minimal total overflow volume of 1.4%. The remaining 33.7% of the total stormwater would discharge through the surface drain. When the orifice diameter increases to a small size (25.4 mm, in diameter), overflow from the top of the berm will start to occur, with an extremely small total overflow volume of 0.4%. Furthermore, the stormwater will detain in the garden longer as the orifice size decreases. The longest continual ponding time is 65 h for the smallest orifice (12.7 mm), which still meets the requirement of draining within 72 h after a rainfall event. Although a smaller orifice has a better hydrological performance, the clogging issue needs to be considered in the practical design (e.g., addition of an anticlogging trash rack).
| Parameter | Surface orifice diameter (mm) | ||||
|---|---|---|---|---|---|
| 12.7 | 25.4 | 38.1 | 50.8 | 63.5 | |
| Overflow (%) | 1.4 | 0.4 | 0 | 0 | 0 |
| Drainage (%) | 33.7 | 40.0 | 41.6 | 42.1 | 42.4 |
| Evapotranspiration (%) | 6.7 | 6.4 | 6.3 | 6.3 | 6.3 |
| Exfiltration (%) | 58.2 | 53.2 | 52.1 | 51.6 | 51.3 |
| Runoff volume reduction (%) | 64.9 | 59.6 | 58.4 | 57.9 | 57.6 |
| Average soil moisture content | 0.31 | 0.30 | 0.30 | 0.29 | 0.29 |
| Lowest soil moisture content | 0.19 | 0.18 | 0.18 | 0.18 | 0.18 |
| Longest continual ponding time (h) | 65 | 32 | 20 | 14 | 12 |
| Continual time with soil moisture below 20% (h) | 82 | 83 | 83 | 83 | 83 |
Hydrologic Performances for Average, Dry, and Wet Years
Table 5 presents a summary of precipitation characteristics of three different modeling years: 2001, 2009, and 2011. The largest 24-h rainfall in 2001 was 49.8 mm (), which is still less than the 1-year, 24-h storm (71.1 mm, ) in this area. The largest 24-h rainfall in year 2009 was 75.4 mm (), which is slightly larger than a 1-year storm. Such large rainfall event happened only once in year 2009. The largest 24-h rainfall in year 2011 is 227 mm (), which is larger than a 100-year storm (216 mm, ). This happened on August 27, 2009 during Hurricane Irene. Another large 24-h rainfall event happened on August 14, 2009 (163 mm, ) prior to Hurricane Irene. Table 6 presents the modeled results for each drainage design based on different precipitation years. The hydrologic performance of each drainage design in year 2001 and 2011 are consistent with performance in year 2009. The surface-drain system has the best overall hydrologic performance among the three drainage designs. However, each design shows a decreasing trend in performance as the total annual precipitation increases. This decreasing trend is due to larger overflow volumes during the larger storm events.
| Parameter | Year 2001 | Year 2009 | Year 2011 |
|---|---|---|---|
| Number of wet days | 109 | 122 | 123 |
| Total precipitation (mm) | 774.95 | 1,197.86 | 1,775.71 |
| Average rainfall per wet day (mm) | 7.1 | 9.8 | 14.4 |
| Ratio of wet days to dry days | 0.43 | 0.5 | 0.51 |
| Largest daily rainfall (mm) | 43.69 | 75.44 | 162.56 |
| Largest 24-h rainfall (mm) | 49.78 | 75.44 | 226.57 |
| Parameter | Year 2001 | Year 2009 | Year 2011 | ||||||
|---|---|---|---|---|---|---|---|---|---|
| No drain | Underdrain | Surface drain | No drain | Underdrain | Surface drain | No drain | Underdrain | Surface drain | |
| Longest continual ponding time (h) | 715 | 0 | 11 | 880 | 8 | 12 | 1,175 | 11 | 13 |
| Runoff volume reduction (%) | 98.6 | 18.5 | 68.1 | 89.2 | 14.7 | 57.6 | 73.4 | 10.7 | 40.7 |
| Overflow (%) | 1.4 | 0 | 0 | 10.8 | 0 | 0 | 26.6 | 6.1 | 0 |
| Drainage (%) | 0 | 81.5 | 31.9 | 0 | 85.3 | 42.4 | 0 | 83.2 | 59.3 |
| Evapotranspiration (%) | 11.1 | 7.9 | 9.1 | 8.1 | 5.0 | 6.3 | 5.4 | 3.6 | 4.3 |
| Exfiltration loss (%) | 87.5 | 10.6 | 59.0 | 81.1 | 9.7 | 51.3 | 68.0 | 7.1 | 36.4 |
| Average soil moisture content | 0.31 | 0.23 | 0.26 | 0.36 | 0.24 | 0.29 | 0.40 | 0.24 | 0.29 |
| Lowest soil moisture content | 0.1 | 0.09 | 0.1 | 0.21 | 0.17 | 0.18 | 0.17 | 0.15 | 0.16 |
Note: Underdrain uses design drainage rate of ; and surface drain uses orifice diameter of 63.5 mm.
Hydrographs and Peak Runoff Reductions under Individual Design Storm Events
The peak runoff rate reductions during individual large design storms are assessed for the three different drainage designs with a loading ratio of 5:1. Fig. 5 shows the hydrographs for the three drainage designs under a 5-year storm. Hydrographs for each drainage design for all six modeled design storms, 1-, 2-, 10-, 25-, 50-, and 100-year storms, can be found in Figs. S6 –S11 in the supplemental materials. Table 7 presents the peak runoff reduction rates of each design storm over 24 h. During the smaller storm events, such as 1- and 2-year storms, all three drainage designs have a peak flow reduction rate more than 70%. Under a 5-year storm event, the no-drain design only has a 49.3% reduction rate, while surface drain and underdrain have a more efficient reduction rate of 83.2% and 95.5%, respectively. Additionally, the no-drain design has an insignificant (0.2%) to zero peak flow reduction for the 10-, 25-, 50-, and 100-year storm events. The surface-drain design caps at a 38.5% reduction for the 25-year storm; it has no effect of reducing peak flow rate at any larger rainfall event. For smaller storm events (smaller than 10 year), underdrain design could reduce peak flow rates by more than 90%. It also has a 24.7% peak flow reduction under a 50-year storm event, while the other two designs have no peak flow reduction. Overall, the underdrain design has the best performance on reducing peak flow rate.

| Storm event | Peak runoff rate reduction efficiency | ||
|---|---|---|---|
| No drain (%) | Underdrain ( design drainage rate) (%) | Surface drain (63.5 mm office diameter) (%) | |
| 1 year | 96.6 | 93.1 | 80.5 |
| 2 year | 89.9 | 94.2 | 81.5 |
| 5 year | 49.3 | 95.5 | 83.2 |
| 10 year | 0.2 | 88.6 | 65.3 |
| 25 year | 0 | 55.8 | 38.5 |
| 50 year | 0 | 24.7 | 0 |
| 100 year | 0 | 0 | 0 |
The runoff volume reductions during individual large design storms are also assessed for the three drainage design alternatives. Table 8 shows volume reduction during design storm events. No-drain design has the highest volume reduction rates, while underdrain design shows the worst performance. Since most surface runoff becomes groundwater recharge with the no-drain design, the volume reduction rate for the 1-year storm could be as high as 88.9%. The underdrain design could only retain 5.6% stormwater under the 1-year storm, while the surface drain could retain 18.3% of runoff volume. Differences of effectiveness in the runoff volume reduction during the individual large design storms among the three different drainage designs are consistent with those over the entire year.
| Storm event | Runoff volume reduction efficiency | ||
|---|---|---|---|
| No drain (%) | Underdrain ( design drainage rate) (%) | Surface drain (63.5 mm orifice diameter) (%) | |
| 1 year | 88.9 | 5.6 | 18.3 |
| 2 year | 75.4 | 5.1 | 14.1 |
| 5 year | 57.8 | 4.7 | 11.2 |
| 10 year | 48.8 | 4.2 | 9.7 |
| 25 year | 39.5 | 3.5 | 8.4 |
| 50 year | 34.1 | 3.1 | 7.2 |
| 100 year | 29.3 | 2.7 | 6.2 |
The smaller orifice for the surface-drain design has better performance on reducing peak flow rate under small storms, while the larger orifice performs better under rainfall larger than a 10-year storm [Fig. 6(a)]. Peak flow reduction rate of most orifice sizes increases first then decreases as the storm size increases. The small storm events have minimal increase in peak flow reduction rates because there is no overflow. As the storm size increases, both peak inflow rate and peak outflow rate increase. However, the peak outflow rate does not increase as fast as inflow rate due to the restriction by the orifice (proportional to the square root of water ponding depth) and the storage in the media layer and exfiltration into subsoil. Overflow occurs during large storms. During these large events, storm size increases, peak inflow rate increases, and peak outflow rate increases even faster due to the augmentation of outflow over the berm.

The runoff volume reduction performance is shown in Fig. 6(b). If the orifice size is fixed, the volume reduction rate always decreases as storm size increases, since the volume of water that could be retained in the garden (by the media layer) is constrained and the outflow volume would increase faster than the inflow volume. For the same storm size, the smaller orifice has better performance on runoff volume retention due to the more severe restriction of outflow and, thus, the longer water ponding time and the larger volume of exfiltration to subsoil. For the 1-year storm, rain gardens with a 12.7-mm orifice surface drain could retain 40.4% of the total stormwater volume, while a 63.5-mm office surface drain could only retain 21.5% of the runoff. Similarly, variation of peak flow rate and volume reductions is shown in Fig. 7 for the underdrain design. It has the same trend as the surface design shown in Fig. 6. However, the underdrain design has little volume reduction under design storm events. The highest volume reduction rate is only 8.4% under a 1-year storm event. Overall, surface-drain design has a more balanced performance considering both the total volume and peak flow rate reduction.

Water Quality
Over an entire year of 2009, 89.2% of water in the rain garden infiltrated through the media layer and then exfiltrated into underground/subsoil or evapotranspirated for the no-drain system, 100% of water infiltrated through the media layer and then exfiltrated plus drained out or evapotranspirated for the rain garden with the underdrain, while only 57.6% of water in the rain garden with the surface-drain system infiltrated or evapotranspirated and got treated through the media layer (Table 6). A rain garden with the underdrain system would not generate any overflow and could treat all the runoff generated by relatively small water quality design storm (e.g., New Jersey water quality design storm of 50.8 mm nonuniformly distributed over two hours). According to the NJBMP manual, the bioretention system is given credit of at least 80% TSS removal from the polluted runoff depending on the soil depth and vegetation type [e.g., 80% annual removal rate with 460 mm () media depth and terrestrial forested community]. The rain garden with underdrain design could be given such a high credit. Usually, stormwater runoff in the first flush carries most of the sediments and pollutants from the catchment (Lee et al. 2002). Since the surface-drain design would detain water for a period of time, it could treat the first flush stormwater and remove some TSS. In addition, a small amount of the first flush water would be retained within the media layer if there is still room before a rainfall. To avoid short-circuiting and make sure water could be filtrated by the media layer, the surface drain should be placed far away from the inlet(s) of the rain garden. Further studies should be conducted to determine water quality performances of rain garden with the surface drain if it is to be used to intercept polluted runoff such as runoff from surfaces of roads traveled by motorized vehicles.
Limitations and Future Study
The effective storage volume from ponding and media layers plays an important role in the hydrologic performance of a rain garden. It depends on the media porosity, field capacity, depth, etc. of each layer. This study did not conduct the field or lab test of these soil properties on site, rather, normal values were used in the modeling. For the evapotranspiration process, no specific crop coefficient could be chosen for the rain garden species. Those factors would be a source of uncertainty. The underdrain system, if any, was not explicitly modeled. The underdrain discharge rate depends on many factors (e.g., soil media hydraulic conductivity, characteristics of aggregate bed, length, slope, diameter, orifice size of the perforated pipe, clogging issue, and whether any additional flow-restriction structure would apply). This model simplifies the underdrain discharge rate by choosing various possible drainage rates; this is a study limitation. For the individual storms, the study only modeled the hydrological performance based on the NRCS Type III 24-h rainfall distribution. Rain gardens could have different performances under different rainfall distributions. Moreover, no field data or lab test data was used to calibrate and validate the model. The aforementioned assumptions, simplifications, and omissions are part of the limitations of this study.
Future research should consider different sizes of effective storage volume from the ponding and media layers and different offset heights of the surface drain to evaluate the hydrologic performance of rain gardens. Since the hydraulic conductivity is a key parameter of rain gardens, future studies should also evaluate the performances with different soil media and subsoil permeabilities. Moreover, further studies should be conducted to determine water quality performance of rain gardens with the surface drain if it is to be used to intercept contaminated runoff and to achieve a certain pollutant removal efficiency.
Conclusions
Rain gardens are one of the LID-BMPs commonly used to reduce stormwater volume and improve water quality. This study was conducted to evaluate the hydrologic performance of rain gardens built on poorly draining subsoils with a loading ratio of 5:1 by using a mathematical modeling approach. Based on the assessment presented here, the following conclusions can be drawn:
1.
Rain gardens with the no-drain design have the best performance on stormwater runoff volume reduction, with an 89% reduction through infiltration (81.1%) and evapotranspiration (8.1%) over an entire year. However, because of the poor permeability of subsoil, the ponding time does not meet the typical 72-h drainage requirement. A very long water ponding time could cause a mosquito problem. In addition, water is ponded during 40% of the entire year, indicating this condition might only be good for wetlands-type plants.
2.
Rain gardens with a surface drain have a good performance concerning runoff volume reduction, with 58% of total runoff retained through exfiltration (51.3%) and evapotranspiration (7.3%) over an entire year. The longest ponding time of 65 h for orifice with 12.7-mm diameter meets the New Jersey design requirement. The average soil moisture content is 0.29, which is good for plant survival. The surface orifice size has little impact on soil moisture. A smaller orifice could increase runoff volume reduction, while also increasing the longest continual ponding time due to the lower drainage capacity.
3.
Rain gardens with underdrain system have the least effect on runoff volume reduction, with only 15% of total stormwater volume retained over an entire year. The underdrain design meets the 72-h drainage requirement by the New Jersey Department of Environmental Protection (NJDEP 2014). Average soil moisture is the lowest among the three different designs. Compared to the surface drain, the underdrain design can treat 100% of water quality design storm volume (a relatively small storm). Difference in design drainage rates of the underdrain system has little impact on runoff volume reduction and soil moisture, while it could significantly change the ponding time due to the changed drainage capacity.
4.
From the individual design storm evaluations, the no-drain design also has the best performance on stormwater runoff volume reduction, while it has little effectiveness on peak flow reduction for large storm events (10 year and larger). The underdrain design has the best performance on peak flow reduction but has little impact on volume reduction. The surface drain has some performance on both indicators. For the surface-drain and underdrain designs, a larger drainage capacity is helpful for reducing peak flow rates but does not improve the runoff volume reduction.
5.
The surface-drain system has the best overall hydrologic performance among the three drainage designs and would be a good addition to rain gardens installed on subsoils of low permeability and if the runoff captured is relatively clean such as that from roofs and sidewalks. Water quality performance of rain gardens with the surface drain may not be good enough to meet the regulatory requirements when it is used to intercept contaminated runoff. The use of a smaller orifice (less than 63.5-mm diameter) could not greatly increase the runoff volume reduction in low-permeability subsoils over the entire year (e.g., a large decrease in orifice diameter from 63.5 to 12.7 mm only increases runoff volume reduction rate from 57.6% to 66.4%). Besides, the use of a smaller orifice diameter has a larger chance of the overflow occurrence and a worse performance on the peak flow reduction for large, less frequent storm events. The use of a smaller orifice diameter may also increase the chance of clogging.
6.
Effective storage in the media and ponding layers plays an important role in the surface-drain design. Runoff storage volume in the media layer is determined by the soil depth, porosity, and field capacity. Future studies should focus on the degree of sensitivity of soil properties (hydraulic conductivity, porosity, field capacity, and wilting point) and depths of each layer that would affect effective storage volumes and then impact the hydrologic performance of rain gardens. Further studies would strengthen the recommendation for addition of the surface drain to rain gardens built on subsoils of low permeability and would better quantify the performance of the new design.
Supplemental Materials
File (supplemental_materials_jswbay.0000988_zhou.pdf)
- Download
- 708.92 KB
Data Availability Statement
Some or all data, models, or code that support the findings of this study are available from the corresponding author upon reasonable request.
1.
Numerical hydrologic model developed from this study.
2.
Model input files for all the conditions assessed in this study.
Acknowledgments
This research was conducted as a part of the community resiliency project sponsored by the National Fish and Wildlife Foundation and the Phillips 66 Corporate Citizenship. The graduate study of the first author [Zikai Zhou (ZZ)] was also financially supported by Rutgers University. The anonymous reviewers and editors provided valuable comments and suggestions.
References
Ahmadisharaf, E., N. Alamdari, M. Tajrishy, and S. Ghanbari. 2021. “Effectiveness of retention ponds for sustainable urban flood mitigation across range of storm depths in northern Tehran, Iran.” J. Sustainable Water Built Environ. 7 (2): 05021003. https://doi.org/10.1061/JSWBAY.0000946.
Allen, R. G., L. S. Pereira, D. Raes, and M. Smith. 1998. Crop evapotranspiration—Guidelines for computing crop water requirements. Rome: Food and Agriculture Organization of the United Nations.
Anderson, A. R., T. G. Franti, and D. P. Shelton. 2018. “Hydrologic evaluation of residential rain gardens using a stormwater runoff simulator.” Trans. ASABE 61 (2): 495–508. https://doi.org/10.13031/trans.12213.
Bethke, G. M., R. William, and A. S. Stillwell. 2022. “Rain garden performance as a function of native soil parameters.” J. Sustainable Water Built Environ. 8 (1): 04021021. https://doi.org/10.1061/JSWBAY.0000967.
Brocca, L., F. Melone, and T. Moramarco. 2008. “On the estimation of antecedent wetness conditions in rainfall–runoff modelling.” Hydrol. Processes 22 (5): 629–642. https://doi.org/10.1002/hyp.6629.
Broccoli, A. J., M. B. Kaplan, P. C. Loikith, and D. A. Robinson. 2013. State of the climate: New Jersey. New Brunswick, NJ: Rutgers Climate Institute.
Carpenter, D. D., and L. Hallam. 2010. “Influence of planting soil mix characteristics on bioretention cell design and performance.” J. Hydrol. Eng. 15 (6): 404–416. https://doi.org/10.1061/(ASCE)HE.1943-5584.0000131.
Chase, J. M., and T. M. Knight. 2003. “Drought-induced mosquito outbreaks in wetlands.” Ecol. Lett. 6 (11): 1017–1024. https://doi.org/10.1046/j.1461-0248.2003.00533.x.
Chui, T. F. M., and D. H. Trinh. 2016. “Modelling infiltration enhancement in a tropical urban catchment for improved stormwater management.” Hydrol. Processes 30 (23): 4405–4419. https://doi.org/10.1002/hyp.10926.
Coffman, L. S., R. Goo, and R. Frederick. 1999. “Low-impact development: An innovative alternative approach to stormwater management.” In Proc., WRPMD’99: Preparing for the 21st Century, 1–10. Reston, VA: ASCE.
Daugherty, R. L., and J. B. Franzini. 1977. Fluid mechanics with engineering applications. New York: McGraw-Hill.
Davis, A. P., W. F. Hunt, R. G. Traver, and M. Clar. 2009. “Bioretention technology: Overview of current practice and future needs.” J. Environ. Eng. 135 (3): 109–117. https://doi.org/10.1061/(ASCE)0733-9372(2009)135:3(109).
DelVecchio, T., A. Welker, and B. M. Wadzuk. 2020. “Exploration of volume reduction via infiltration and evapotranspiration for different soil types in rain garden lysimeters.” J. Sustainable Water Built Environ. 6 (1): 04019008. https://doi.org/10.1061/JSWBAY.0000894.
Denmead, O. T., and R. H. Shaw. 1962. “Availability of soil water to plants as affected by soil moisture content and meteorological conditions1.” Agron. J. 54 (5): 385–390. https://doi.org/10.2134/agronj1962.00021962005400050005x.
Dietz, M. E. 2007. “Low impact development practices: A review of current research and recommendations for future directions.” Water Air Soil Pollut. 186 (1–4): 351–363. https://doi.org/10.1007/s11270-007-9484-z.
Dietz, M. E., and J. C. Clausen. 2005. “A field evaluation of rain garden flow and pollutant treatment.” Water Air Soil Pollut. 167 (1–4): 123–138. https://doi.org/10.1007/s11270-005-8266-8.
Dussaillant, A. R., C. H. Wu, and K. W. Potter. 2004. “Richards equation model of a rain garden.” J. Hydrol. Eng. 9 (3): 219–225. https://doi.org/10.1061/(ASCE)1084-0699(2004)9:3(219).
Endreny, T., and V. Collins. 2009. “Implications of bioretention basin spatial arrangements on stormwater recharge and groundwater mounding.” Ecol. Eng. 35 (5): 670–677. https://doi.org/10.1016/j.ecoleng.2008.10.017.
Gilroy, K. L., and R. H. McCuen. 2009. “Spatio-temporal effects of low impact development practices.” J. Hydrol. 367 (3–4): 228–236. https://doi.org/10.1016/j.jhydrol.2009.01.008.
Guo, J. C. Y. 2003. “Design of infiltrating basin by soil storage and conveyance capacities.” Water Int. 28 (4): 411–415. https://doi.org/10.1080/02508060308691717.
Hargreaves, G. H. 1994. “Defining and using reference evapotranspiration.” J. Irrig. Drain. Eng. 120 (6): 1132–1139. https://doi.org/10.1061/(ASCE)0733-9437(1994)120:6(1132).
Hess, A., B. Wadzuk, and A. Welker. 2019. “Predictive evapotranspiration equations in rain gardens.” J. Irrig. Drain. Eng. 145 (7): 04019010. https://doi.org/10.1061/(ASCE)IR.1943-4774.0001389.
Hunt, W. F., J. T. Smith, S. J. Jadlocki, J. M. Hathaway, and P. R. Eubanks. 2008. “Pollutant removal and peak flow mitigation by a bioretention cell in urban Charlotte, NC.” J. Environ. Eng. 134 (5): 403–408. https://doi.org/10.1061/(ASCE)0733-9372(2008)134:5(403).
Jackisch, N., and M. Weiler. 2017. “The hydrologic outcome of a low impact development (LID) site including superposition with streamflow peaks.” Urban Water J. 14 (2): 143–159. https://doi.org/10.1080/1573062X.2015.1080735.
Jennings, A. A. 2016. “Residential rain garden performance in the climate zones of the contiguous United States.” J. Environ. Eng. 142 (12): 04016066. https://doi.org/10.1061/(ASCE)EE.1943-7870.0001143.
Jennings, A. A., M. A. Berger, and J. D. Hale. 2015. “Hydraulic and hydrologic performance of residential rain gardens.” J. Environ. Eng. 141 (11): 04015033. https://doi.org/10.1061/(ASCE)EE.1943-7870.0000967.
Jia, H., H. Yao, and S. L. Yu. 2013. “Advances in LID BMPs research and practice for urban runoff control in China.” Front. Environ. Sci. Eng. 7 (5): 709–720. https://doi.org/10.1007/s11783-013-0557-5.
Lee, J. H., K. W. Bang, L. H. Ketchum Jr., J. S. Choe, and M. J. Yu. 2002. “First flush analysis of urban storm runoff.” Sci. Total Environ. 293 (1–3): 163–175. https://doi.org/10.1016/S0048-9697(02)00006-2.
Nichols, W., A. Welker, R. Traver, and M.-C. Tu. 2021. “Modeling seasonal performance of operational urban rain garden using HYDRUS-1D.” J. Sustainable Water Built Environ. 7 (3): 04021005. https://doi.org/10.1061/JSWBAY.0000941.
NJDEP (New Jersey Department of Environmental Protection). 2014. “New Jersey stormwater best management practices manual.” Accessed January 27, 2019. https://www.njstormwater.org/bmp_manual2.htm.
NOAA (National Oceanic and Atmospheric Administration). 2014. Storm events database. Washington, DC: National Climatic Data Center, NOAA.
NRCCA (Northeast Region Certified Crop Adviser). 2010. Soil and water management, 74. Ithaca, NY: Cornell Univ.
NRCS (Natural Resources Conservation Service). 1986. Urban hydrology for small watersheds. Washington, DC: USDA.
Prince George’s County. 1993. Design manual for use of bioretention in stormwater management. Landover, MD: Prince George’s County (MD) Government, Dept. of Environmental Protection, Watershed Protection Branch.
Roy-Poirier, A., P. Champagne, and Y. Filion. 2010. “Review of bioretention system research and design: Past, present, and future.” J. Environ. Eng. 136 (9): 878–889. https://doi.org/10.1061/(ASCE)EE.1943-7870.0000227.
Schneider, L. E., and R. H. McCuen. 2006. “Assessing the hydrologic performance of best management practices.” J. Hydrol. Eng. 11 (3): 278–281. https://doi.org/10.1061/(ASCE)1084-0699(2006)11:3(278).
Tang, S., W. Luo, Z. Jia, S. Li, Y. Wu, and M. Zhou. 2015. “Effect of rain gardens on storm runoff reduction.” Shuikexue Jinzhan/Adv. Water Sci. 26 (6): 787–794. https://doi.org/10.14042/j.cnki.32.1309.2015.06.004.
Thompson, A. M., A. C. Paul, and N. J. Balster. 2008. “Physical and hydraulic properties of engineered soil media for bioretention basins.” Trans. ASABE 51 (2): 499–514. https://doi.org/10.13031/2013.24391.
US EPA. 2000. “Low impact development (LID). A literature review.” Accessed January 27, 2019. https://nepis.epa.gov/Exe/ZyPDF.cgi/P1001B6V.PDF?Dockey=P1001B6V.PDF.
Van Roon, M. 2005. “Emerging approaches to urban ecosystem management: The potential of low impact urban design and development principles.” J. Environ. Assess. Policy Manage. 7 (1): 125–148. https://doi.org/10.1142/S1464333205001943.
Vatankhah, A. R. 2011. “Approximate solutions to complete elliptic integrals for practical use in water engineering.” J. Hydrol. Eng. 16 (11): 942–945. https://doi.org/10.1061/(ASCE)HE.1943-5584.0000376.
Vatankhah, A. R. 2018. “Discussion of ‘Flow through partially submerged orifice’ by James C. Y. Guo and Ryan P. Stitt.” J. Irrig. Drain. Eng. 144 (5): 07018022. https://doi.org/10.1061/(ASCE)IR.1943-4774.0001296.
Winston, R. J., J. D. Dorsey, and W. F. Hunt. 2016. “Quantifying volume reduction and peak flow mitigation for three bioretention cells in clay soils in northeast Ohio.” Sci. Total Environ. 553 (May): 83–95. https://doi.org/10.1016/j.scitotenv.2016.02.081.
Xing, W., P. Li, S. Cao, L. Gan, F. Liu, and J. Zuo. 2016. “Layout effects and optimization of runoff storage and filtration facilities based on SWMM simulation in a demonstration area.” Water Sci. Eng. 9 (2): 115–124. https://doi.org/10.1016/j.wse.2016.06.007.
Zhang, S., and Y. Guo. 2013. “Explicit equation for estimating storm-water capture efficiency of rain gardens.” J. Hydrol. Eng. 18 (12): 1739–1748. https://doi.org/10.1061/(ASCE)HE.1943-5584.0000734.
Zhang, X., X. Guo, and M. Hu. 2016. “Hydrological effect of typical low impact development approaches in a residential district.” Nat. Hazard. 80 (1): 389–400. https://doi.org/10.1007/s11069-015-1974-5.
Information & Authors
Information
Published In

Journal of Sustainable Water in the Built Environment
Volume 8 • Issue 3 • August 2022
Copyright
This work is made available under the terms of the Creative Commons Attribution 4.0 International license, https://creativecommons.org/licenses/by/4.0/.
History
Received: Sep 3, 2020
Accepted: Jan 29, 2022
Published online: Apr 21, 2022
Published in print: Aug 1, 2022
Discussion open until: Sep 21, 2022
Authors
Metrics & Citations
Metrics
Citations
Download citation
If you have the appropriate software installed, you can download article citation data to the citation manager of your choice. Simply select your manager software from the list below and click Download.
Cited by
- Isam Alyaseri, Jianpeng Zhou, Azadeh Bloorchian-Verschuyl, Susan Morgan, Impact of Green Infrastructures for Stormwater Volume Reduction in Combined Sewers: A Statistical Approach for Handling Field Data from Paired Sites Containing Rain Gardens and Planter Boxes, Journal of Sustainable Water in the Built Environment, 10.1061/JSWBAY.SWENG-416, 9, 3, (2023).
- Diego M. Meneses, Lin Zheng, Qizhong Guo, Identification and Quantification of Surface Depressions on Grassy Land Surfaces of Different Topographic Attributes Using High-Resolution Terrestrial Laser Scanning Point Cloud and Triangulated Irregular Network, Journal of Hydrologic Engineering, 10.1061/JHYEFF.HEENG-5823, 28, 4, (2023).
- Beata Janowska, Jagoda Łój, Roman Andrzejak, Role of Community Gardens in Development of Housing Estates in Polish Cities, Agronomy, 10.3390/agronomy12061447, 12, 6, (1447), (2022).
- Ruo-Qian Wang, Yangmin Ding, Semi-supervised identification and mapping of surface water extent using street-level monitoring videos, Big Earth Data, 10.1080/20964471.2022.2123352, (1-19), (2022).