Seismic Vulnerability of Reinforced Concrete Frame Structures: Obtaining Plan or Vertical Mass Irregularity from Structure Use Change
Publication: Journal of Structural Engineering
Volume 150, Issue 3
Abstract
Changes in a structure’s use can have a significant impact on distribution of live loads, both in the plan and elevation of a building. Unevenly distributed live loads can introduce variations in mass, causing irregularities in the structure and making it more susceptible to damage during earthquakes. Previous studies have extensively investigated the seismic vulnerability of structurally irregular buildings. However, due to computational challenges, simplified two-dimensional models are commonly employed, which fail to accurately capture the nonlinear interaction between torsional and lateral responses, thereby limiting their ability to reflect the actual structural behavior. This research focuses on examining the seismic fragility of reinforced concrete frames that exhibit mass irregularities in the elevation or plan caused by the change in structural usage. For accurate vulnerability evaluation, this research employs comprehensive three-dimensional models of reinforced concrete irregular structures. A total of 21 frame models encompassing various degrees of vertical and in-plan irregularities resulting from different scenarios of live-load distribution were studied. Nonlinear dynamic response history analysis was conducted with 10 earthquake input ground motions. To assess the vulnerability of the studied structures against the given earthquakes comprehensively, the concept of a fragility surface was introduced. The fragility surface is derived from fragility curves corresponding to various damage limit states, providing a complete overview of the seismic vulnerability of the structure in terms of peak ground accelerations and allowable drift ratios. In this study, eight allowable drift ratios were defined to establish failure limit-state conditions. The seismic vulnerability of all assumed building usage scenarios ware quantified, and this study highlights that uneven structure use in the regular structure can significantly affect its seismic performance. The findings of this study can contribute to a better understanding of the novel aspects related to the seismic behavior of irregular structures, enhancing our knowledge in this field.
Introduction
Earthquakes are one of the most severe natural hazards. Between 2000 and 2015, earthquakes resulted in more than 80,000 fatalities worldwide (Arguero 2020; Ghanem et al. 2019a). According to the Federal Emergency Management Agency (FEMA), seismic damage in the United States totals roughly $4.4 billion a year (Arguero 2020). Since earthquakes regularly result in severe structural damage and economic losses, much effort has been made to determine the seismic vulnerability of infrastructures.
Structure loss estimation and seismic hazard risk assessment frequently employ fragility or vulnerability curves (Furtado et al. 2018; Sherif et al. 2022; Abdelhafeez et al. 2022). The curves display the likelihood of failure for a specific seismic risk (Di Sarno Pugliese 2020; Ghanem and Moon 2021). Typically, cumulative log-normal distribution functions that express the chance of reaching predetermined damage criteria are used to illustrate fragility curves (Radu and Grigoriu 2018). Most studies use the Monte Carlo simulation (MCS) method to generate seismic vulnerability curves. However, structural failure is a low-probability event. It often requires thousands of trials to obtain one failure event, significantly increasing computational time and cost. As a result, computationally inexpensive models with fewer structural nodes are commonly used in the analysis. However, whether such models can exhibit actual structural behavior under seismic loads is questionable. Also, some studies evaluate the failure probability analytically from the damage limit-state function. This approach does not require any simulations. However, the complexity of a structure is still idealized to derive the analytical form of the limit-state function (Thapa et al. 2022). Moreover, this method is not generally applicable. Both existing methods are not a practically feasible way to get the failure probability and derive the fragility curve for irregular structures with detailed numerical models. Many research efforts have been focused on measuring earthquake failure likelihood and evaluating the vulnerability of structures with irregularities.
Irregularities in the shape and vertical configuration of structures pose significant challenges when it comes to their response to seismic actions. These irregularities encompass a range of issues, such as shape irregularities, floor deformability, and higher modes, which have distinct consequences on the seismic behavior of buildings. Understanding these specific effects is crucial for ensuring structural integrity and safety in earthquake-prone areas. Shape irregularities refer to deviations from regular geometries in both plan and elevation. When the centers of mass and stiffness within a structure are misaligned, plan irregularities occur (Moon et al. 2018). Such misalignments can lead to uneven distributions of mass, stiffness, strength, and height throughout the building, rendering it vulnerable to seismic forces. These irregularities can also include setbacks, which impose prescribed limits on the placement of elements within a structure. Compliance with building codes and standards, such as the International Building Code (IBC), is essential to address and mitigate these plan irregularities.
Vertical irregularities, on the other hand, pertain to variations in stiffness, strength, and mass distribution along the height of a structure (Ghanem et al. 2022). These irregularities can arise due to differences in floor-to-floor heights, vertical setbacks, or the presence of irregular mass or stiffness distributions (Sohn et al. 2022; Ghanem et al. 2019a). Vertical irregularities significantly influence the dynamic behavior of a building during an earthquake, leading to differential displacements and potential concentration of forces in specific regions. This can result in localized damage, structural instability, and an increased risk of collapse. Floor deformability is another critical aspect related to irregularities in seismic behavior. It refers to variations in the flexibility or rigidity of floors within a structure. When different floors exhibit contrasting degrees of stiffness or deformability, seismic forces can induce significant interstory drifts and torsional effects (Amirsardari et al. 2020). These irregularities introduce additional complexities in the structural response and may cause progressive damage accumulation or even failure. Higher modes, also known as higher-frequency vibration modes, are an essential consideration in the context of irregular structures subjected to seismic actions. As irregularities disrupt the symmetry and uniformity of a building’s mass and stiffness distribution, higher modes become more pronounced. These modes contribute to the overall dynamic response of the structure and can lead to resonant effects, amplifying the building’s response to seismic forces. The irregularities may result in localized stress concentrations, increased structural demands, and potential damage in critical regions.
Structural irregularity is not preferred in current design practices, so it is usually avoided at the design stage of many structures. However, structures are designed to last 50 to 100 years, sometimes even longer (Pan et al. 2018). There is a high chance that the structure’s occupancy would change in such a long life span. Also, the structure owner can decide how to use the space, resulting in very different live-load distributions than the design code. The unevenly distributed live loads on the structure can transform a regular structure into a mass-irregular structure.
In summary, irregularities in plan and vertical configurations pose significant challenges to the seismic behavior of structures. Shape irregularities, floor deformability, and higher modes all have distinct consequences on structural integrity and safety. By understanding and addressing these specific irregularities, designers and engineers can enhance the seismic performance of buildings, mitigate risks, and promote consistency in design and construction practices in earthquake-prone regions. After a series of structural seismic damage investigations and analyses, it is confirmed that irregular structures suffer the most from earthquakes. The effects of the plan and vertical mass irregularities on the seismic vulnerability of the reinforced concrete structures are investigated in this research. The changes in the use of structures are the reasons for the development of different irregularities. The following section discusses what other researchers have investigated through the literature, highlighting the gap and the purpose of this research.
Structures with Plan or Vertical Irregularity
Numerous studies have been undertaken to explore the seismic performance and fragility evaluation of planned irregular buildings. These investigations have contributed significantly to our understanding of this subject (Abdel Raheem et al. 2018; Brunesi et al. 2015; Kostinakis and Athanatopoulou 2020; Anagnostopoulos et al. 2015). In a study conducted by Kostinakis and Athanatopoulou (2020), the specific focus was on assessing the effects of in-plan irregularities resulting from masonry infills on in-plan mass distribution and furthermore on the seismic behavior of reinforced concrete (RC) buildings. The researchers examined the influence of such irregularities on the structural response to seismic forces. Their findings provided valuable insights into how the presence of masonry infills affects the overall seismic performance of RC buildings. Anagnostopoulos et al. (2015) conducted a comprehensive review that critically examined the phenomenon of earthquake-induced torsion in buildings. This study served as an extensive overview of the subject, covering various aspects. The researchers discussed the mechanisms, causes, and consequences of earthquake-induced torsion, contributing to a deeper understanding of this phenomenon in the field of structural engineering. They provide valuable insights into the specific effects of in-plan irregularities caused by masonry infills and the critical review of earthquake-induced torsion in buildings.
In one example, the plan had an irregular shape due to the deformability of the floor. Ruggieri et al. (2020) looked at seven irregular models’ local and global performance in the plan and eight RC low-rise building models. They applied nonlinear static analysis and concluded that the spatial irregularity and response to seismic motion influence the seismic response of building structures. The same researchers assessed the variance in structural capacity and seismic fragility of two RC structures (Ruggieri et al. 2020). They claimed that the kind of diaphragm dramatically impacts the likelihood of structural damage. Ruggieri et al. (2021) also assessed the seismic safety and fragility class of 15 RC structures with plan irregularities in Foggia, Italy. For this goal, the researchers used two probabilistic strategies based on static and dynamic approaches. Their findings showed that both approaches offered trustworthy substitutes for determining the seismic vulnerability of RC buildings. In Ruggieri et al. (2022), proposed a numerical procedure for simplified reduced-order models in seismic response prediction of frame buildings with plan irregularities. The procedure aims to reduce computational costs in global seismic assessments, particularly for class-level applications. The research highlights that calibration of the reduced-order models is not strictly necessary and demonstrates a favorable compromise between computational cost and assessment accuracy when comparing results with full models and incremental dynamic analyses. Fragility curves indicate similar estimates at low engineering demand parameter capacity values but some differences at high engineering demand parameter values. The proposed approach offers a reliable estimate for class-level seismic assessment and provides a balance between accuracy and coverage, although further enhancements are suggested.
Regarding vertical irregularity, various studies have looked at how it affects the seismic behavior of structures made of RC. To assess seismic fragility, the studies utilized static and dynamic analyses. The seismic fragility of a vertically asymmetric RC frame structure was investigated by Men et al. (2009). They claimed that the seismic intensity and structural performance levels influence the fragility curves of this type of construction. The vulnerability of frames made following the European design code was examined by Nazri et al. (2018). In their investigation, many models with vertical geometric irregularity were considered, and dynamic evaluations were carried out. Fragility research results show irregular frames are more brittle and more likely to collapse than regular frames. The seismic fragility analysis of RC frames with vertical irregularity was carried out by Kumar et al. (2016). Based on the likelihood that they would sustain damage, the authors assessed the vulnerability of various structures. The researchers also conducted a performance analysis that included shear walls as a fix for misaligned frames. They concluded that vertical irregular frames behave better with masonry infills.
Additionally, Shojaei and Behnam (2017) used a nonlinear dynamic approach to assess the seismic vulnerability of low-rise, irregularly reinforced concrete structures. They claimed that an irregular structure sustains more significant damage than a conventional one. The seismic behavior of setback-RC structures with vertical irregularity was investigated by Kassem et al. (2019). A series of dynamic studies created fragility curves by calculating the probability that the buildings would sustain damage under earthquake activity. Researchers established that regular frames are less likely to fail than irregular ones. The impact of vertical irregularity resulting from various setback percentages on the seismic response of concrete structures was examined by Azad et al. (2019). According to the study, the seismic capability of structures is strongly impacted by irregularity. The seismic vulnerability of midrise RC structures with a setback was also evaluated by Ayub et al. (2018). The researchers looked at six models with various setback arrangements. Vulnerability curves were developed from nonlinear static analysis. Their research concluded that the setback frames experience brittle failure when moderate damage is exceeded. When irregularity occurs on the lower level rather than the upper levels, the buildings are more vulnerable. The numerical research by Oggu and Gopikrishna (2020) evaluated the earthquake resistance of three-dimensional RC buildings built following the Indian Standard code. They examine the seismic response of four midrise RC building models, including three models with a setback on various levels, in terms of maximum horizontal displacement and maximum interstory drift ratio. They claimed that the probability of collapse and vulnerability are more evident in the case of seismic sequences.
Existing literature on the seismic vulnerability of structures fails to adequately address the impact of unexpected irregularities, specifically that of uneven mass distribution resulting from changes in structure usage. Our research fills this gap by investigating how plan and vertical irregularities induced by usage changes affect the seismic vulnerability of RC structures. This study expands beyond geometric irregularities during the design phase, providing insights into real-world scenarios where irregularities emerge postconstruction. By employing advanced analytical models, we capture the 3D nature of structures and incorporate nonlinear torsional effects. This research offers practical implications for design and retrofitting, enabling better consideration of potential seismic vulnerabilities due to irregular mass distributions.
In order to overcome the limitations of simplistic modeling approaches and accurately capture the complex seismic behaviors of structures, a significant advancement has been made through the adoption of detailed 3D numerical models. These models offer a higher level of sophistication and realism in simulating structural responses, including the intricate torsional effects induced by irregularities in the buildings. To address the computational challenges associated with these advanced models, an integrated fragility analysis platform has been developed. This platform represents a pioneering approach in the field, as it effectively manages the computational demands involved in conducting comprehensive analyses. By integrating various computational tools and techniques, this platform streamlines the process of assessing structural fragility, thus enabling researchers and engineers to obtain valuable insights efficiently. One notable contribution of this research lies in the comprehensive definition of eight damage limit-state conditions based on allowable drift ratios. This approach surpasses the limitations of previous studies that often relied on simplified criteria, allowing for a more nuanced evaluation of structural performance. By considering a wider range of damage states, the analysis becomes more robust and captures a greater spectrum of potential structural failures.
To generate seismic vulnerability curves for the analyzed structures, a nonlinear dynamic response history analysis approach is employed. This involves subjecting the structures to 10 different earthquake inputs, each representing a distinct seismic event. By examining the structural responses under various ground motion scenarios, a comprehensive understanding of the structures’ vulnerability to different levels of seismic activity is obtained. Moreover, this investigation introduces a novel concept known as the fragility surface, which represents an advancement over traditional fragility curves. The fragility surface provides a multidimensional representation of the relationship between earthquake intensity, allowable drift ratio, and the probability of structural failure. By visualizing this relationship, researchers and practitioners gain a deeper understanding of how different combinations of earthquake intensity and allowable drift ratio influence the overall structural vulnerability. Overall, this research not only enhances the novelty aspect of modeling seismic behaviors by utilizing advanced 3D numerical models, but it also contributes to the field through the development of an integrated fragility analysis platform. Furthermore, the comprehensive definition of damage limit states, the utilization of nonlinear dynamic response history analysis, and the introduction of the fragility surface represent significant advancements in the assessment of structural vulnerability to seismic events.
Fragility Analysis Method
Seismic fragility or vulnerability curves are commonly exploited as they directly affect earthquake hazard risk assessment. The fragility curves reveal how likely a target structure is to reach the level of the predefined damage condition under an expected earthquake event; they graphically show the failure probability versus an earthquake hazard intensity variable. Extensive research efforts have been dedicated to evaluating the seismic sensitivity of various structural systems and mitigating their earthquake damage risks.
Most previous studies adopt two main methods to evaluate structural failure likelihood against the earthquake hazard in deriving fragility curves. The degree of earthquake damage to a structure can be assessed by comparing the expected seismic response (demand) to seismic capacity (supply). The limit-state function is expressed as supply minus demand. The failure condition is presumed to be met when the limit function value becomes negative (i.e., the seismic demand is larger than the seismic capacity) (Melchers and Beck 2018). The first category method calculates failure probabilities analytically from the limit-state function. This method is not generally applicable because it is often practically impossible to get the explicit form of the limit-state function for comprehensive numerical models with advanced structural analysis methods (Jeong and Elnashai 2007). The other category method estimates the failure likelihood from numerical simulations. The probability of structural failure is computed by counting the number of damaged cases and dividing it by the total number of simulated cases; this approach’s analytical derivation of the limit-state function is no longer needed. Any advanced structural analysis techniques (e.g., dynamic response history analysis or adaptive pushover analysis) can be utilized in earthquake simulations. However, complex models and advanced analysis methods could enormously increase the simulation time and cost.
This research presents a different approach to assess structural failure probabilities and derive seismic fragility curves for RC moment frame structures having varying mass irregularities in plan or elevation. More detailed analytical models are needed to capture the realistic earthquake behavior of studied structures with high structural irregularities. Different structural analysis methods independently estimate the seismic capacity (supply) of a target building and the imposed seismic demand from an earthquake event. However, the most widely used simulation-based approach is not practically applicable due to the high simulation cost. However, the adopted approach, which stands between the analytical function-based and simulation-based approaches, can manage complicated 3D models in vulnerability assessment. It computes the likelihood of failure analytically with no need to develop an explicit expression of the limit function; the limit function value is mathematically obtained as supply minus demand. This technique requires integrating reliability and structural analyses to determine the limit-state function and damage likelihood. The first-order reliability method (FORM) analyzes failure probability from the limit-state function. The limit-state function expressed in an original random variable space is converted into the corresponding one in the standard normal space through transformation matrices. Then the limit-state function is linearly approximated so that the most probable failure point can be easily found. It is known that the FORM is a reliable and practical approach to calculating the likelihood of failure (Der Kiureghian 2005; Rackwitz and Flessler 1978).
The integrated structural reliability analysis platform is established for failure probability estimation directly from numerically evaluated limit-state function values. The platform combines two programs used for structural and reliability analysis. It enables constructing a seismic fragility curve more inexpensively and precisely. The chosen structural analysis software is ZEUS-NL, which is specialized in seismic simulations (Elnashai et al. 2010). It adopts the fiber-based element modeling technique; each fiber in a member cross-section is represented by its inelastic material behavior model. A plastic hinge would be developed when whole fibers yield. A reliability analysis software FERUM (Finite Element Reliability Using MATLAB), is selected to estimate structural failure probability. This program provides several reliability analysis techniques, including FORM (Haukaas 2003). Both program codes are open to the public so that any modification can be easily made. The linking interface is built in MATLAB, by which two analysis tools can communicate. In previous research, Know and Elnashai (2006) performed a fragility analysis for 2D RC structures using MCS for the same structure used in this research.
In a study conducted by Moon et al. (2018), the adopted approach for generating fragility curves was compared to results obtained from Monte Carlo simulation (MCS). The comparison aimed to assess the efficiency and accuracy of the adopted approach, particularly when dealing with complex 3D models. The results of the comparison demonstrated that the adopted approach was not only verified but also highly efficient in producing fragility curves. Even with intricate 3D models, the adopted approach required a significantly lower number of structural analyses and total computing time compared to MCS. Fig. 1 visually illustrates the performance of the adopted approach by showcasing the estimation of failure probability for one of the cases. In this particular instance, the adopted approach successfully estimated the failure probability using only 12 simulations. On the other hand, when employing MCS, the failure probability could not be accurately estimated even after conducting 5,000 simulations. These findings highlight the advantages of the adopted approach over MCS in terms of efficiency and accuracy when generating fragility curves for complex 3D models. Research by Moon et al. (2018) contributes to the field by validating and demonstrating the effectiveness of the adopted approach, providing valuable insights for researchers and practitioners involved in fragility analysis.

The research introduces an advanced and comprehensive framework for conducting fragility analysis and generating fragility curves, as depicted in Fig. 2. The framework, developed by the authors, integrates two analysis tools, FERUM and ZEUS-NL, to facilitate accurate calculation of failure probabilities and the creation of fragility curves. Using MATLAB, the platform enables the exchange of data between FERUM and ZEUS-NL in a step-by-step process. FERUM determines input random variable values and sends them to ZEUS-NL, which generates an analytical model for structure capacity and seismic response. The analysis outcomes are then sent back to FERUM for calculation of the limit-state function, iteratively determining failure probability using FORM. This integration enhances engineering analysis by considering uncertainties in input parameters and enables the development of more resilient structures in seismic areas. The seamless data exchange between independently developed tools is noteworthy, allowing for a comprehensive analysis of structural behavior under dynamic loads.
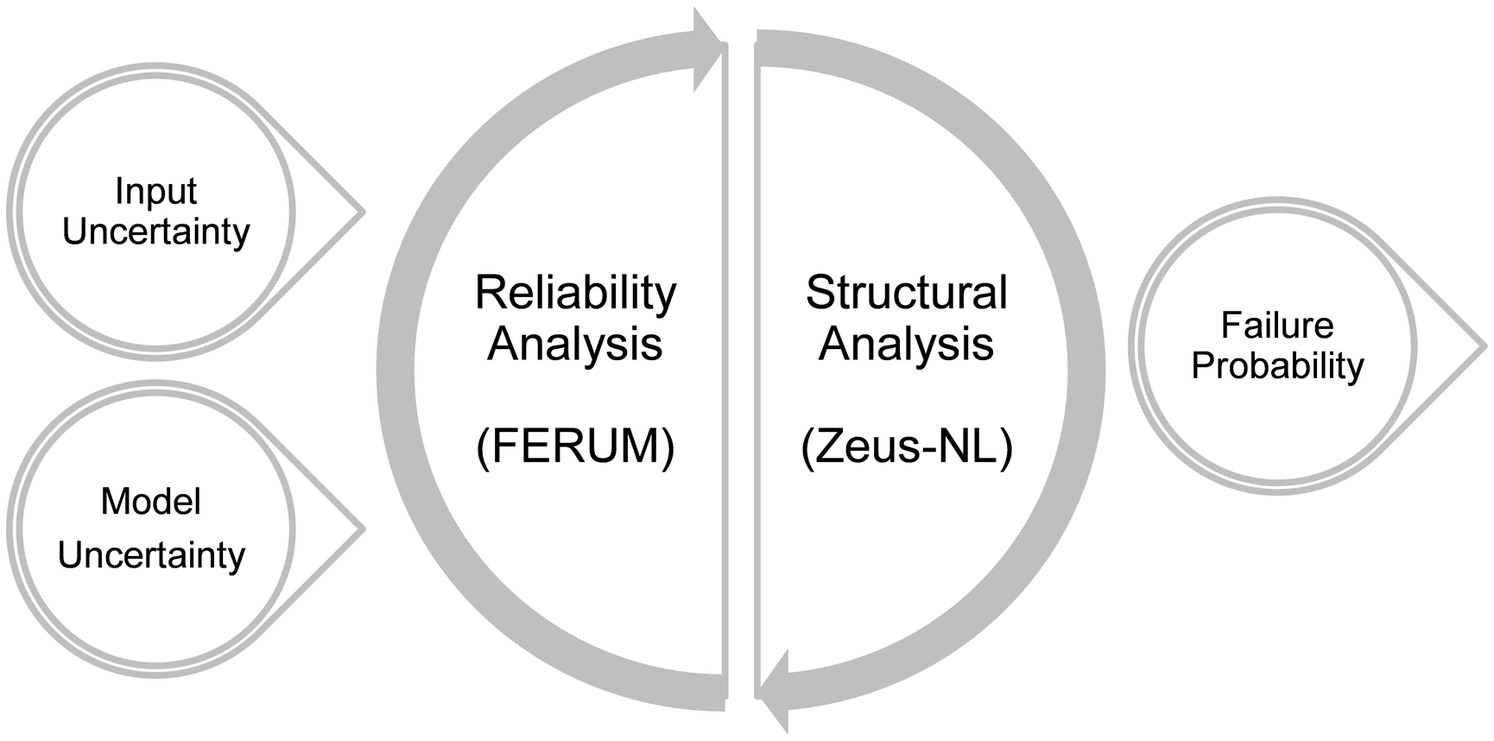
The framework incorporates a parallel computing scheme, allowing for the simultaneous execution of multiple simulations. This significantly speeds up the computation process and enables quicker acquisition of results. By utilizing parallel computing, the framework optimizes the use of computing resources, resulting in a more efficient and time-effective analysis. Fig. 2 illustrates the key components of the integrated fragility analysis framework, showcasing their interconnections and the flow of data and calculations. The figure provides a visual representation of the overall process, enabling a clear understanding of the steps involved in the fragility analysis. By employing this advanced and integrated framework, the research contributes to the field of structural engineering by offering a more efficient and accurate approach to fragility analysis. The framework’s ability to leverage parallel computing enhances the scalability and computational capabilities, enabling researchers and practitioners to analyze a larger number of scenarios and obtain results in a timely manner.
Seismic Vulnerability Analysis
Analytical Models
The target structure is a three-story RC frame that can serve as a typical low-rise RC office building. Different mass irregularities in plan or elevation due to various building use scenarios are explored to study how such mass irregularity can change the overall seismic vulnerability of the target structure. Three-dimensional detailed analytical models are employed to simulate the realistic seismic response caused by nonlinear torsional coupling (Kwon and Elnashai 2006). Fig. 3 shows the aerial view of the examined structure model.

The nonlinear finite-element analysis tool ZEUS-NL is utilized to build numerical models. The studied frames comprise 48 columns and 72 beams, with 6 and 7 elements in each column and beam member, respectively. With a side width of 305 mm, the RC column has a square section. The slab thickness is 152 mm, and RC beams have 457-mm-deep T sections. The modified Mander’s and bilinear models simulate the nonlinear material behaviors of concrete and reinforcing steel, respectively (Martínez-Rueda and Elnashai 1997). Concentrated gravity loads are only added to the intersection between the beam and column to minimize the computational cost. For more information about the prototype model, refer to Bracci et al. (1992).
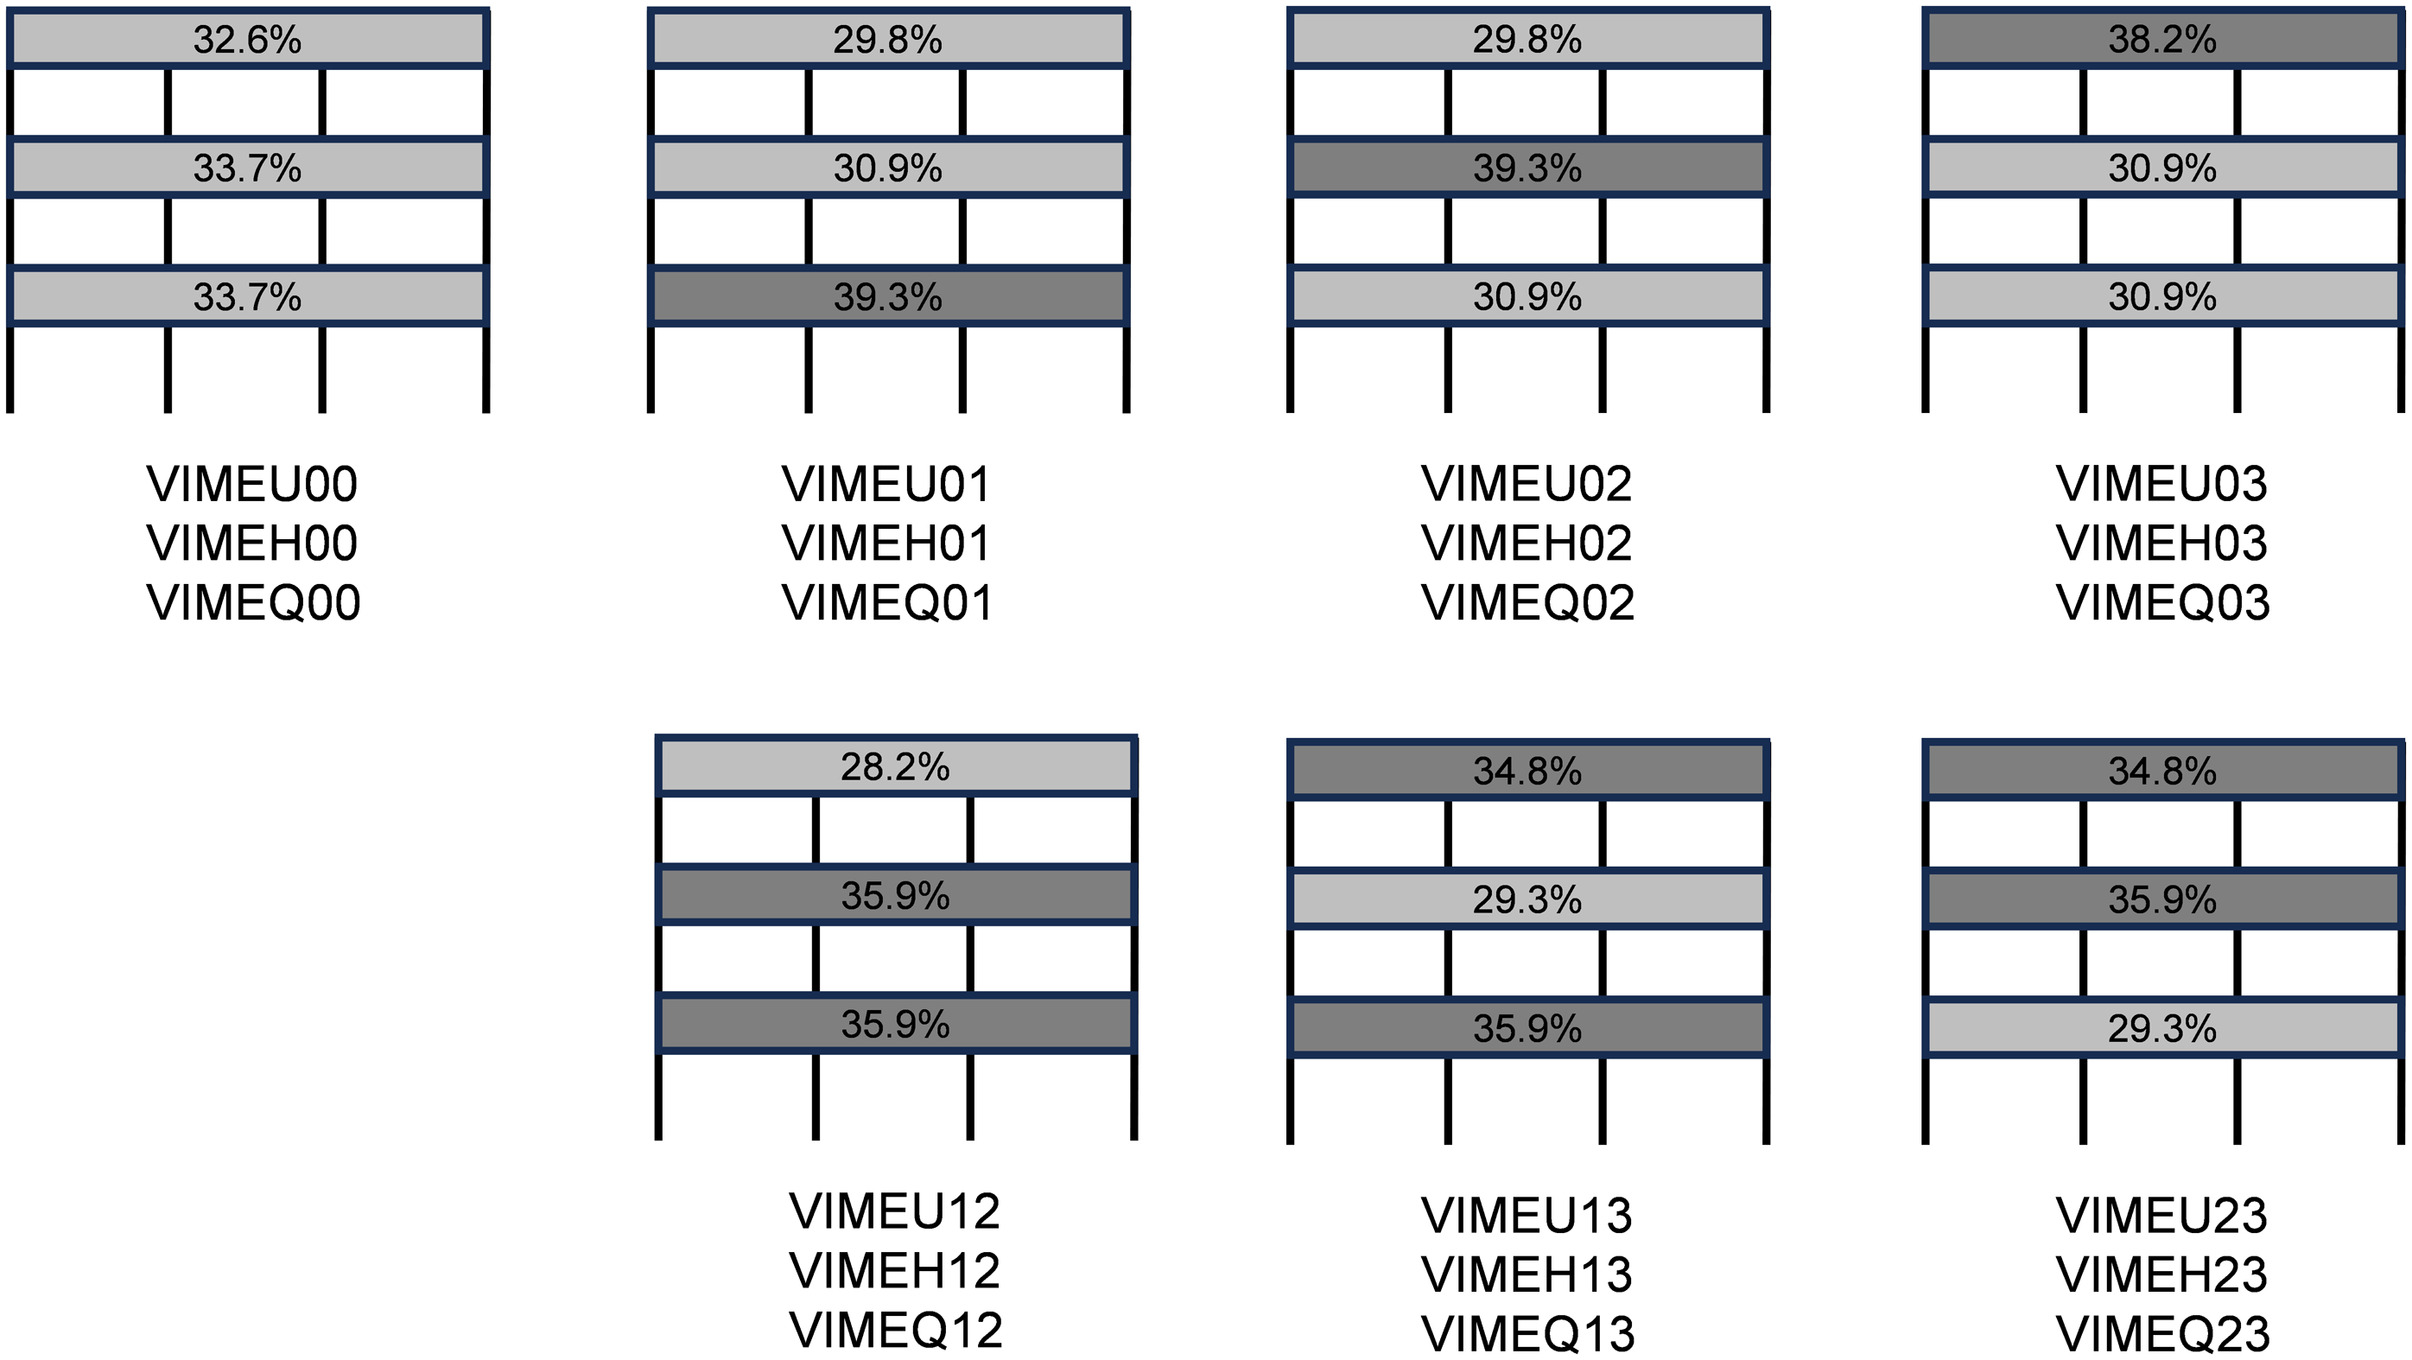
For the office structure under consideration, a 2.39-kPa (50-psf) live load is assumed based on the ASCE 7-22 design code (ASCE 2022). The total sum of dead and live loads on the structure remains constant. In contrast, different live-load distribution cases are considered. As a result, 21 irregular models with varying in-plane or vertical mass eccentricities are explored in this study. Depending on the in-plan live-load distribution, they can be divided into three groups (VIMEU, VIMEH, and VIMEQ). VIMEU models are plan-regular structures with uniform in-plan live-load distributions. At the same time, VIMEH and VIMEQ are plan-irregular structures with non-evenly distributed live loads. In VIMEH models, live loads are concentrated on the half side of each floor plan; VIMEQ models are assumed to have concentrated live loads on a quarter side of each plan.
Even though this kind of mass distribution in the cases of the VIMEH and VIMEQ can lead to exceeding the value stated in the code, this approach is followed for the assessment of fragility after the conclusion of the design phase; the user changes and distribution can disobey the code requirements, which makes the need for this study more crucial and needed. In other words, this approach is followed for the critical assessment of fragility imposed by these unexpected irregular cases. Fig. 4 depicts the difference in assumed in-plan live-load distributions among the three groups. Then, seven vertical live-load distribution scenarios are considered in each group. The first case is when there is no vertical irregularity, and total live loads are distributed equally over the floor. In the second to fourth cases, one of three floors carries two times more live loads than the others, while two floors are assumed to carry two times more than the other floor in the remaining cases. Fig. 5 shows seven vertical load distribution scenarios with the resulting total mass distribution percentage and model reference names. The number after the group name in the model reference names indicates the floors with more live loads.

Input Ground Motions
A total of 10 earthquake motion records are carefully chosen based on the scaling factor of peak ground acceleration (PGA) related to the peak ground velocity (PGV), which can impose a wide range of seismic demands on the studied structure from various earthquake sources (Elnashai and Sarno 2008; Pavel and Lungu 2013). The PGA/PGV ratio ranges from 0.25 to 1.24 for the chosen ground input data. The ground motion was applied in only one direction at a time to constrain the effect of irregularity to analyze its effect on the structure vulnerability accurately. Table 1 details selected earthquake events and ground input motion records. Fig. 6 depicts acceleration time-history records of all input ground motions, their elastic response spectra, and the average response spectrum in a thick line.
| Reference name | Earthquake | Year | Station | Magnitude (Mw) | PGA/PGV () |
|---|---|---|---|---|---|
| EQ01 | Superstition Hills | 1987 | Parachute | 6.5 | 0.25 |
| EQ02 | Northridge | 1994 | Jensen Filter Plant | 6.6 | 0.37 |
| EQ03 | Westmorland | 1981 | Parachute | 5.9 | 0.41 |
| EQ04 | Landers | 1992 | Lucerne | 7.2 | 0.54 |
| EQ05 | San Salvador | 1986 | National Institution | 5.8 | 0.71 |
| EQ06 | Imperial Valley | 1979 | Agrarias | 6.5 | 0.82 |
| EQ07 | Chi-Chi | 1999 | CHY006 | 7.6 | 0.83 |
| EQ08 | Kobe | 1995 | KJMA | 6.9 | 0.91 |
| EQ09 | Cape Mendocino | 1992 | Petrolia | 7.0 | 1.20 |
| EQ10 | Loma Prieta | 1989 | Saratoga | 6.9 | 1.24 |

Uncertainty and Limit-State Definition
The vulnerability analysis of the investigated structures considered both earthquake hazards and structural capacity uncertainties. Ten earthquake ground motions account for the uncertainty in earthquake hazards. Steel yield and concrete ultimate strength are assumed to be random variables following log-normal distributions to consider structural capacity uncertainty (Bartlett and MacGregor 1996; Mirza and MacGregor 1979). Mean strength values of 33.6 MPa and 336.5 MPa are used for concrete and steel materials, respectively. Also, the coefficient of variation values of 0.186 and 0.107 are used for concrete and steel materials, respectively (Kwon and Elnashai 2006; Lu et al. 2005; Moon et al. 2016; Ghanem et al. 2019b, 2021a, b; Ghanem and Moon 2021).
A total of eight damage limit-state conditions are employed to conduct a comprehensive fragility analysis. The interstory drift (ISD) is utilized to determine seismic damage levels and whether a structure fails based on the predefined criteria. The International Building Code (International Code Council 2021) sets the maximum allowable drift for a typical building structure between 0.7% and 2.5% of its story height, while EN 1998-1 (CEN 2004) Eurocode 8 specifies it between 1% and 1.5%. Thus, the ISD values for eight damage levels are chosen to be 0.25% to 2% with an increment of 0.25% of the story height, covering a broad range of allowable ISD criteria in design codes. It is assumed that a given structure attains a damage limit-state condition if the maximum ISD value of a member exceeds the defined drift threshold.
Fundamental Periods of Studied Structures
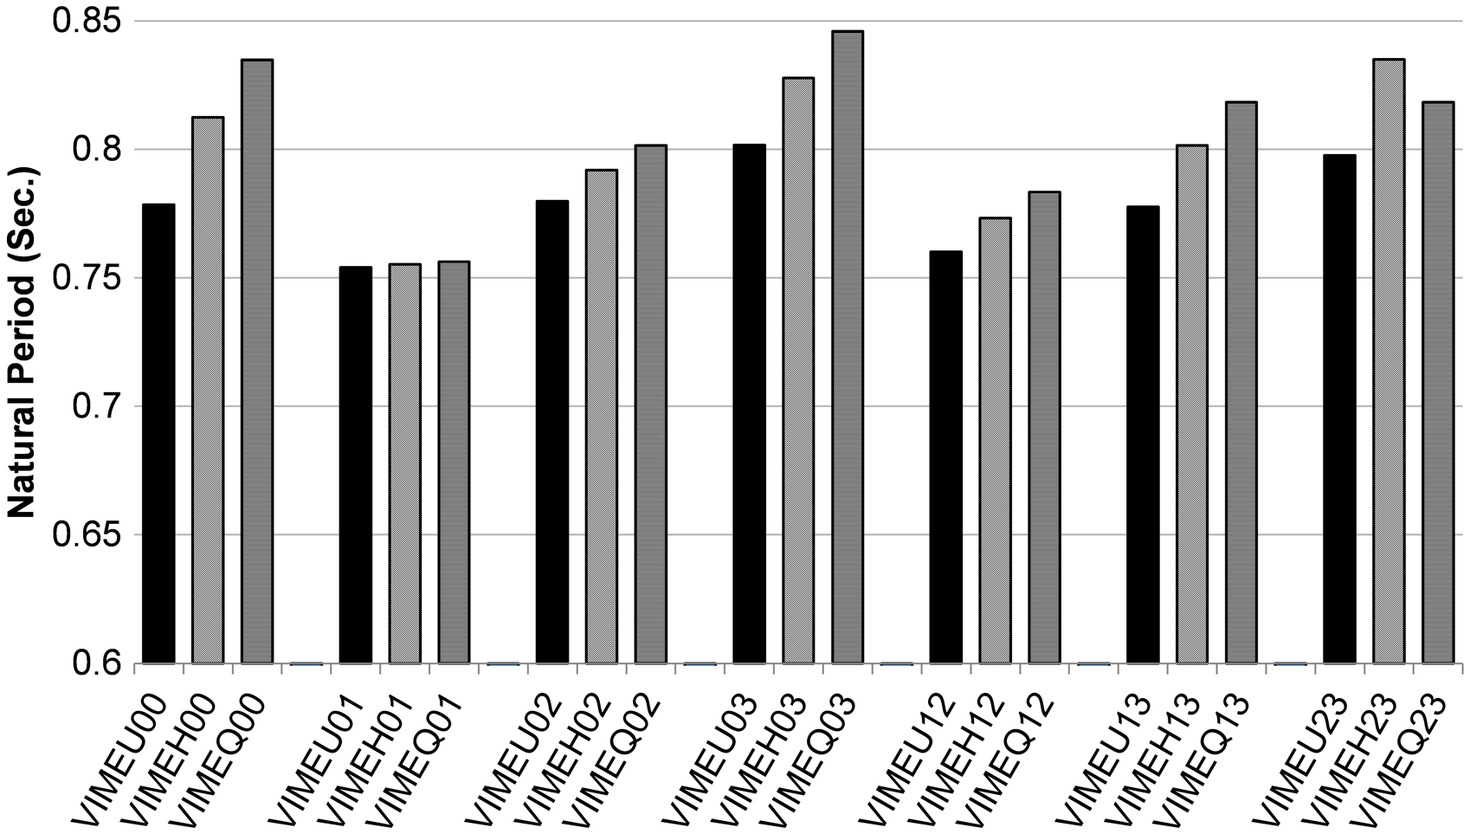
Eigenvalue analysis on 21 RC frame models is conducted. Fig. 7 compares the first natural periods of all studied numerical models and shows the effect of mass irregularities in plan or elevation on the natural period. It is shown that the first natural period increases with increasing plan irregularity. It is also found that the structures with higher live-load concentrations on upper floors have longer periods than the other models, and the VIMEQ03 model has the longest period. This result agrees with the anticipation that more loads on higher floors result in a more flexible system. Such flexible structures are expected to suffer more damage from earthquakes due to the increasing overturning moment.
Seismic Fragility Curve and Fragility Surface
Three-dimensional analytical models are employed in vulnerability analysis of RC frame structures having various vertical and in-plan mass irregularities. The use of computationally intensive yet realistic structural representation becomes viable with the help of the integrated approach described in the preceding section. Twenty-one frame models under 10 earthquake events are analyzed based on eight limit-state definitions. A total of 1,680 cases are studied with varying PGA values. The seismic fragility curves for all studied structures from detailed analytical models are successfully produced using a regular personal computer [Intel (R) Core (TM) i7-9700K @ 3.60GHz CPU, 16 GB RAM].
Fig. 8 shows seismic fragility curves of six selected models (VIMEU00, VIMEU03, VIMEH00, VIMEH03, VIMEQ00, and VIMEQ03) with eight damage limit-state conditions. The naming convention of LS025, LS050, LS075, LS125, LS150, LS175, and LS200 is used in the plot legend to indicate admissible ISD values of 0.25%, 0.5%, 0.75%, 1%, 1.25%, 1.5%, 1.75%, and 2% in eight limit states. The VIMEU00 model is a regular structure with no in-plan and vertical irregularities, while VIMEH00 and VIMEQ00 models have only plan irregularities. VIMEU03, VIMEH03, and VIMEQ03 models have vertical irregularities due to the higher live-load assumption on the third floor. Fig. 8 presented in this study represents the failure probabilities obtained through iterative structure and reliability analysis. Each data point on the plot corresponds to a specific failure probability. To generate the smoothed fragility curves, we employed the least-square curve-fitting technique with the cumulative log-normal distribution, utilizing the aforementioned data points. The findings of this study reveal substantial variances in the seismic fragility curves due to structural irregularities. It is worth noting that the likelihood of failure increases as the limit state becomes more stringent, even at the same PGA level. This implies that implementing stricter criteria for damage assessment and performance expectations leads to a higher probability of structural failure. Two significant factors impacting the seismic fragility curves are in-plan and vertical mass irregularities. In light of these observations, it becomes evident that accounting for the spatial distribution of mass within the structure is crucial for accurate seismic fragility assessments. The presence of irregularities in both the horizontal and vertical directions significantly influences the structural response to seismic forces.
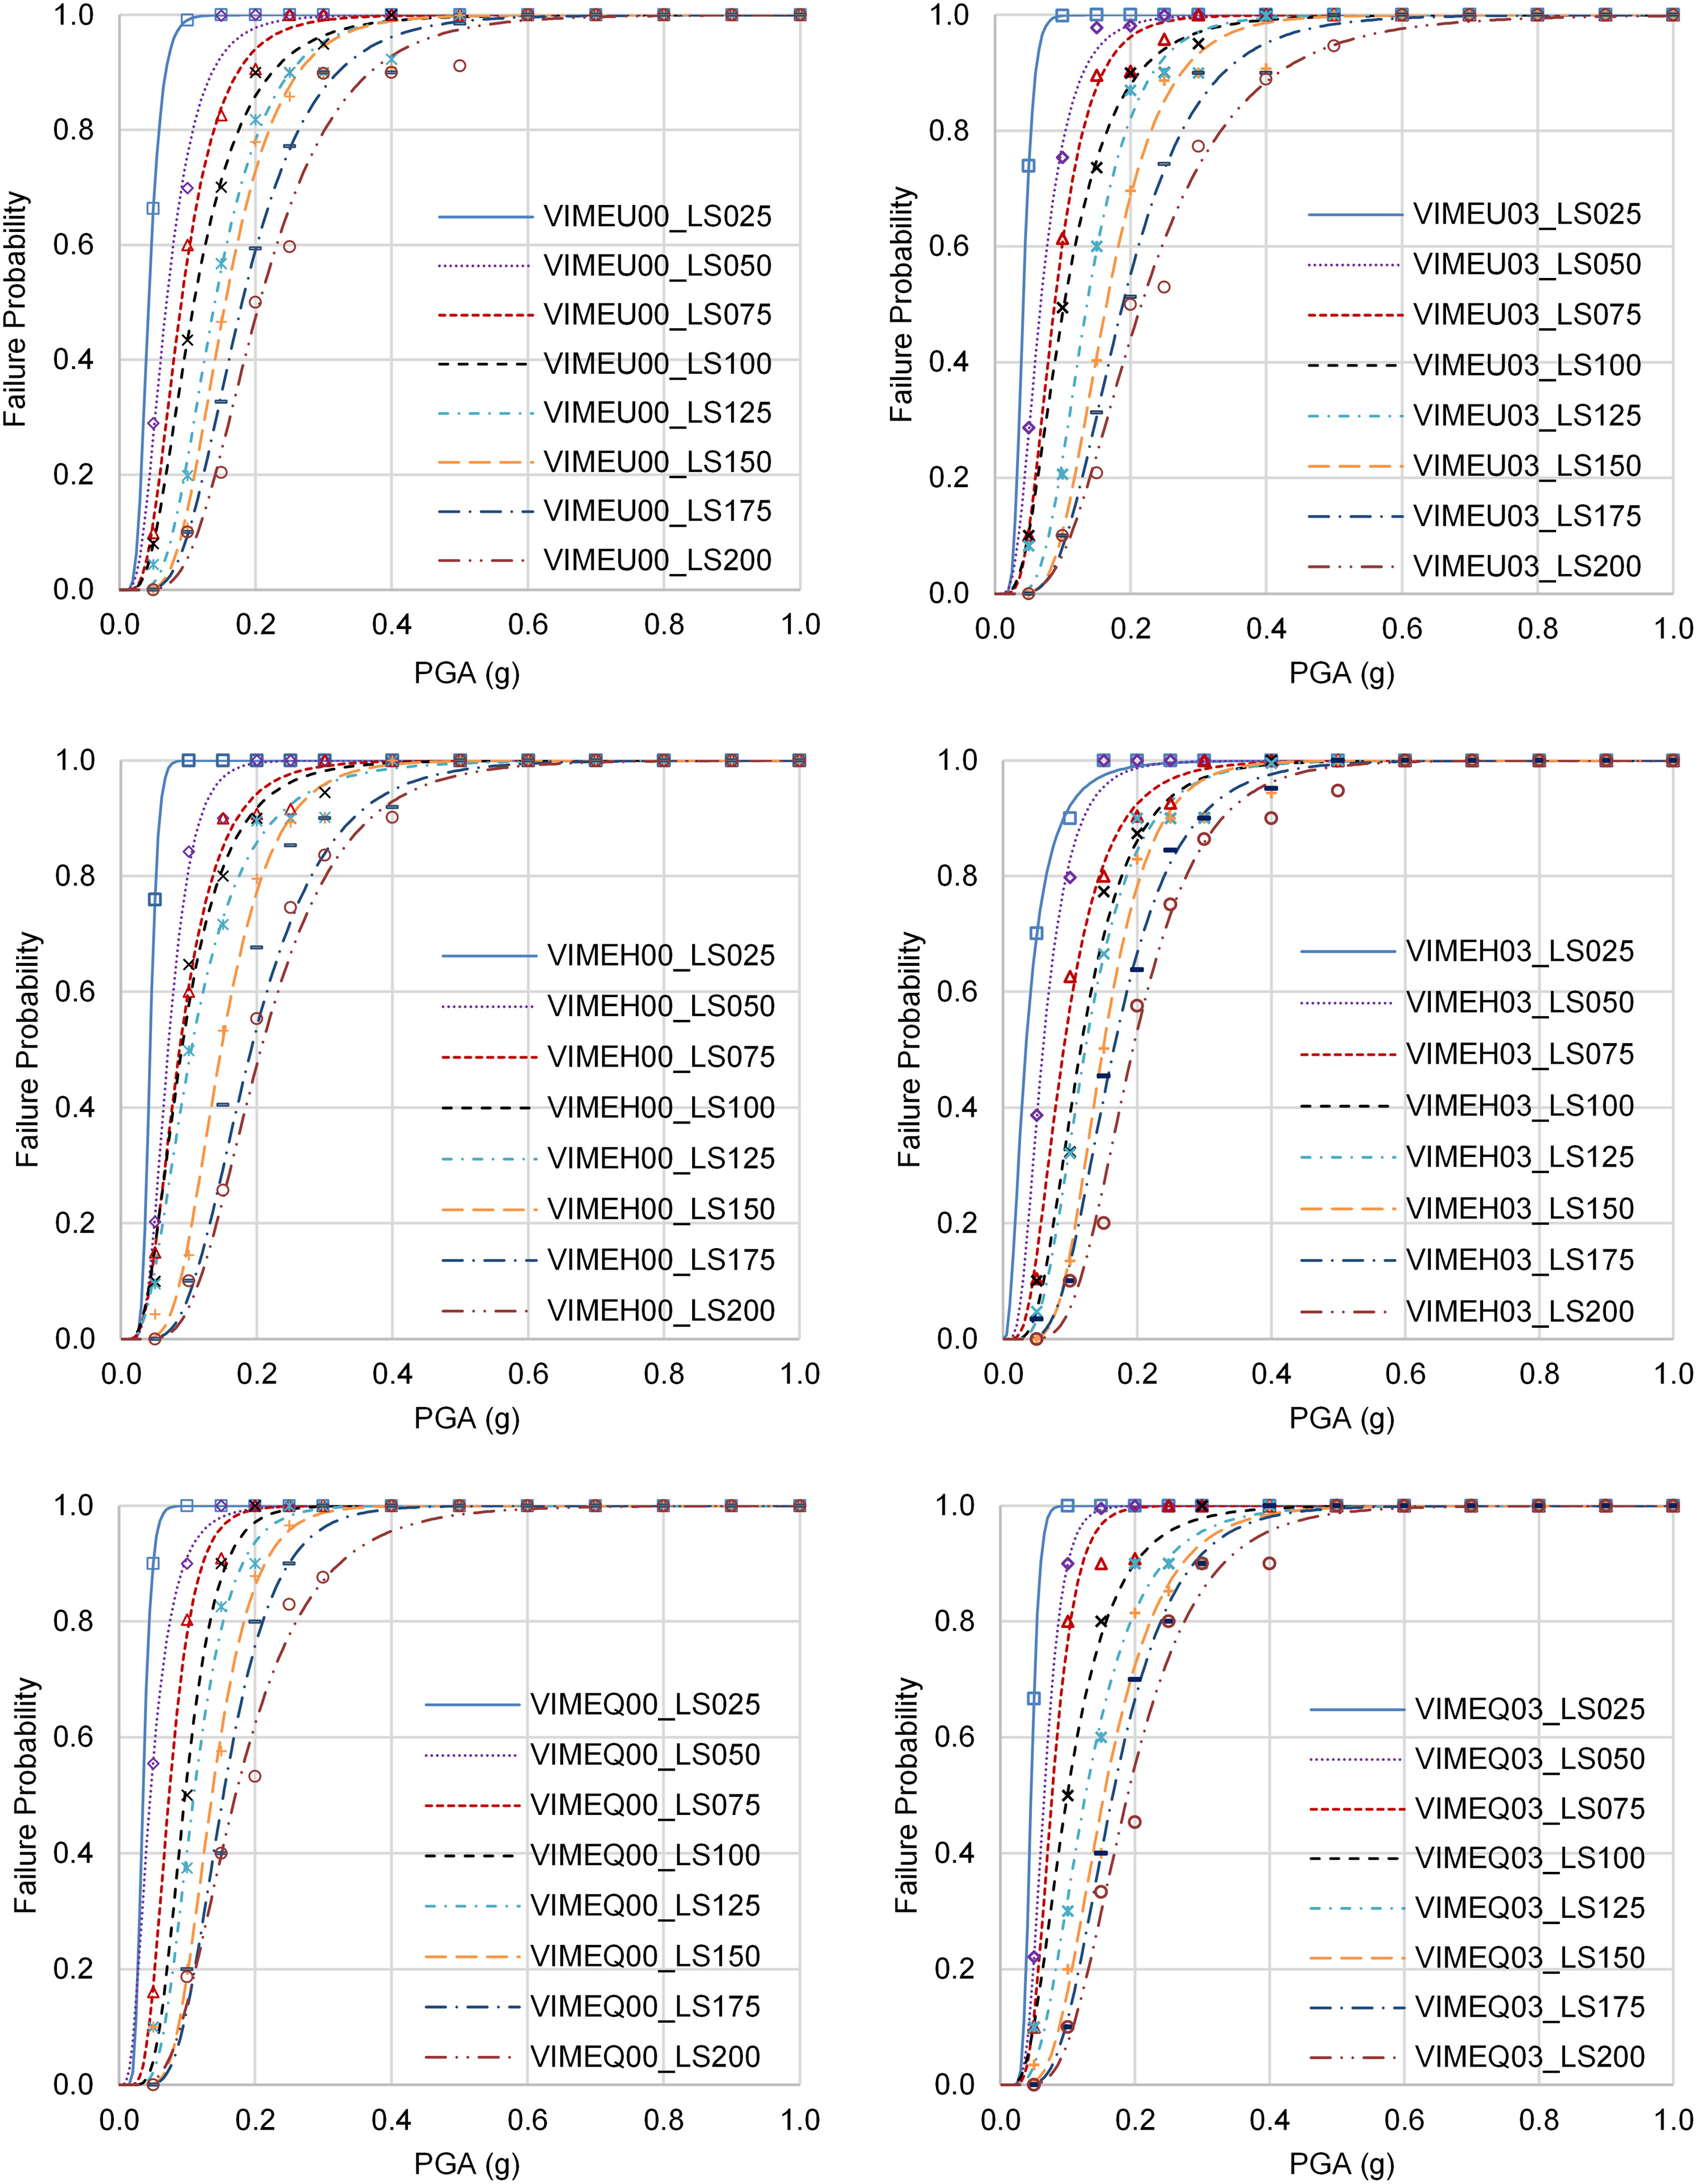
Table 2 provides valuable information by reporting the log-normal parameters for the derived fragility curves of the studied RC frame structures, emphasizing the sensitivity of structure failure probability to structural irregularities. These parameters contribute to our understanding of the structures’ behavior and vulnerability under seismic loading conditions, specifically highlighting the significant influence of irregularities on the probability of failure at different performance levels. By examining the reported parameters, decision makers can gain insights into the characteristics of the structures, allowing them to evaluate the potential risks associated with irregularities and make informed decisions regarding design, retrofitting, and risk mitigation strategies.
| Model | Parameters | Allowable drift ratio | |||||||
|---|---|---|---|---|---|---|---|---|---|
| 0.25% | 0.50% | 0.75% | 1.00% | 1.25% | 1.50% | 1.75% | 2.00% | ||
| VIMEU00 | Mean | 0.0459 | 0.0796 | 0.1033 | 0.1281 | 0.1555 | 0.1695 | 0.1996 | 0.2283 |
| Variance | 0.0003 | 0.0020 | 0.0031 | 0.0060 | 0.0055 | 0.0052 | 0.0089 | 0.0118 | |
| VIMEU01 | Mean | 0.0488 | 0.0820 | 0.1081 | 0.1315 | 0.1547 | 0.1626 | 0.1908 | 0.2201 |
| Variance | 0.0003 | 0.0022 | 0.0035 | 0.0059 | 0.0048 | 0.0049 | 0.0075 | 0.0102 | |
| VIMEU02 | Mean | 0.0612 | 0.0740 | 0.0891 | 0.1145 | 0.1345 | 0.1587 | 0.1786 | 0.2004 |
| Variance | 0.0011 | 0.0019 | 0.0041 | 0.0060 | 0.0049 | 0.0042 | 0.0084 | 0.0140 | |
| VIMEU03 | Mean | 0.0434 | 0.0770 | 0.0980 | 0.1203 | 0.1458 | 0.1782 | 0.2089 | 0.2466 |
| Variance | 0.0002 | 0.0018 | 0.0023 | 0.0056 | 0.0068 | 0.0055 | 0.0099 | 0.0185 | |
| VIMEU12 | Mean | 0.0667 | 0.0857 | 0.1120 | 0.1379 | 0.1559 | 0.1661 | 0.1993 | 0.2245 |
| Variance | 0.0017 | 0.0021 | 0.0050 | 0.0054 | 0.0050 | 0.0059 | 0.0092 | 0.0104 | |
| VIMEU13 | Mean | 0.0523 | 0.0838 | 0.1005 | 0.1323 | 0.1505 | 0.1801 | 0.2057 | 0.2337 |
| Variance | 0.0007 | 0.0019 | 0.0032 | 0.0045 | 0.0046 | 0.0088 | 0.0099 | 0.0123 | |
| VIMEU23 | Mean | 0.0468 | 0.0765 | 0.0994 | 0.1319 | 0.1525 | 0.1740 | 0.2096 | 0.2561 |
| Variance | 0.0016 | 0.0010 | 0.0015 | 0.0040 | 0.0055 | 0.0050 | 0.0111 | 0.0244 | |
| VIMEH00 | Mean | 0.0438 | 0.0754 | 0.0995 | 0.1057 | 0.1251 | 0.1602 | 0.2123 | 0.2283 |
| Variance | 0.0001 | 0.0010 | 0.0033 | 0.0045 | 0.0072 | 0.0047 | 0.0102 | 0.0118 | |
| VIMEH01 | Mean | 0.0533 | 0.0840 | 0.0989 | 0.1311 | 0.1407 | 0.1698 | 0.1821 | 0.2045 |
| Variance | 0.0011 | 0.0021 | 0.0025 | 0.0032 | 0.0048 | 0.0056 | 0.0066 | 0.0094 | |
| VIMEH02 | Mean | 0.0612 | 0.0740 | 0.0891 | 0.1145 | 0.1345 | 0.1587 | 0.1786 | 0.2004 |
| Variance | 0.0012 | 0.0012 | 0.0023 | 0.0053 | 0.0062 | 0.0052 | 0.0068 | 0.0084 | |
| VIMEH03 | Mean | 0.0452 | 0.0689 | 0.1050 | 0.1312 | 0.1377 | 0.1598 | 0.1822 | 0.2103 |
| Variance | 0.0016 | 0.0017 | 0.0040 | 0.0051 | 0.0051 | 0.0040 | 0.0074 | 0.0081 | |
| VIMEH12 | Mean | 0.0612 | 0.0820 | 0.0929 | 0.1153 | 0.1358 | 0.1525 | 0.1618 | 0.2021 |
| Variance | 0.0023 | 0.0028 | 0.0028 | 0.0060 | 0.0066 | 0.0057 | 0.0055 | 0.0124 | |
| VIMEH13 | Mean | 0.0274 | 0.0688 | 0.0912 | 0.1139 | 0.1350 | 0.1637 | 0.1903 | 0.2040 |
| Variance | 0.0013 | 0.0010 | 0.0018 | 0.0054 | 0.0050 | 0.0050 | 0.0081 | 0.0092 | |
| VIMEH23 | Mean | 0.0385 | 0.0677 | 0.0874 | 0.1105 | 0.1371 | 0.1545 | 0.1863 | 0.2215 |
| Variance | 0.0001 | 0.0009 | 0.0031 | 0.0049 | 0.0041 | 0.0050 | 0.0079 | 0.0108 | |
| VIMEQ00 | Mean | 0.0361 | 0.0543 | 0.0797 | 0.1043 | 0.1187 | 0.1453 | 0.1647 | 0.1937 |
| Variance | 0.0001 | 0.0012 | 0.0011 | 0.0017 | 0.0023 | 0.0028 | 0.0042 | 0.0106 | |
| VIMEQ01 | Mean | 0.0433 | 0.0645 | 0.0899 | 0.1042 | 0.1150 | 0.1315 | 0.1615 | 0.1861 |
| Variance | 0.0001 | 0.0010 | 0.0020 | 0.0023 | 0.0041 | 0.0048 | 0.0060 | 0.0085 | |
| VIMEQ02 | Mean | 0.0547 | 0.0649 | 0.0757 | 0.0988 | 0.1201 | 0.1462 | 0.1719 | 0.1981 |
| Variance | 0.0001 | 0.0007 | 0.0016 | 0.0026 | 0.0039 | 0.0034 | 0.0084 | 0.0104 | |
| VIMEQ03 | Mean | 0.0466 | 0.0687 | 0.0819 | 0.1151 | 0.1437 | 0.1695 | 0.1825 | 0.2080 |
| Variance | 0.0001 | 0.0006 | 0.0009 | 0.0046 | 0.0061 | 0.0061 | 0.0066 | 0.0092 | |
| VIMEQ12 | Mean | 0.0361 | 0.0520 | 0.0747 | 0.0934 | 0.1144 | 0.1470 | 0.1573 | 0.1787 |
| Variance | 0.0001 | 0.0013 | 0.0015 | 0.0019 | 0.0038 | 0.0058 | 0.0060 | 0.0101 | |
| VIMEQ13 | Mean | 0.0372 | 0.0515 | 0.0885 | 0.1042 | 0.1340 | 0.1546 | 0.1738 | 0.1935 |
| Variance | 0.0001 | 0.0021 | 0.0014 | 0.0024 | 0.0034 | 0.0048 | 0.0063 | 0.0086 | |
| VIMEQ23 | Mean | 0.0361 | 0.0543 | 0.0907 | 0.0969 | 0.1293 | 0.1584 | 0.1933 | 0.2059 |
| Variance | 0.0001 | 0.0012 | 0.0039 | 0.0039 | 0.0060 | 0.0055 | 0.0130 | 0.0107 | |
This study introduces the concept of a seismic fragility surface, which provides a holistic representation of a structure’s vulnerability to seismic hazards based on the intensity of the hazard and the desired damage limit state. The fragility surface is derived from fitted fragility curves associated with various limit states. In Fig. 9, the seismic fragility surfaces of selected models are presented, offering a comprehensive understanding of how the likelihood of structural failure changes in relation to earthquake PGA and the damage limit state defined by the maximum allowable drift ratio. The fragility surfaces convey valuable information regarding the impact of structural irregularities on the fragility of a building. It becomes evident that the presence of structural irregularities significantly affects the fragility surface, highlighting the importance of considering and addressing such irregularities in the design and assessment of structures subjected to seismic events. By examining the fragility surfaces, engineers and researchers can gain insights into the potential failure modes and associated probabilities of a structure under varying seismic hazard levels. Moreover, the fragility surfaces provide a useful tool for assessing and comparing the seismic performance of different structural models. By analyzing the changes in the fragility surface, one can identify areas of increased vulnerability and make informed decisions regarding retrofitting or designing more resilient structures. The concept of the fragility surface presented in this study enhances our understanding of the complex relationship between seismic hazards, structural vulnerability, and damage limit states. It contributes to the broader field of seismic engineering by providing a comprehensive framework for assessing and mitigating the risks associated with earthquakes. Furthermore, the consideration of structural irregularities in the fragility surface analysis emphasizes the need for careful design and construction practices to ensure the resilience and safety of structures in seismically active regions.

Seismic Fragility of Mass Irregular Structures
The impact of mass irregularity on the seismic vulnerability of RC frame structures is evaluated by comparing fragility curves. The vulnerability curves of structural models with different in-plan and vertical mass distributions and three limit states are compared in Fig. 10. As the extent of the in-plane irregularity increases by 25% corresponding to the half and quarter loading cases, there is a clear and pronounced upward trend in the probability of failure. In simpler terms, when there is a higher degree of in-plane irregularity in the distribution of mass, the likelihood of structural failure becomes increasingly prominent. This indicates that deviations from the anticipated mass distribution significantly compromise the overall structural integrity, thereby amplifying the probability of failure. As expected, plan irregularity significantly impacts seismic performance and vulnerability. Note that asymmetrically distributed live loads noticeably degrade the seismic performance of the studied structure with regular configuration on the plan.
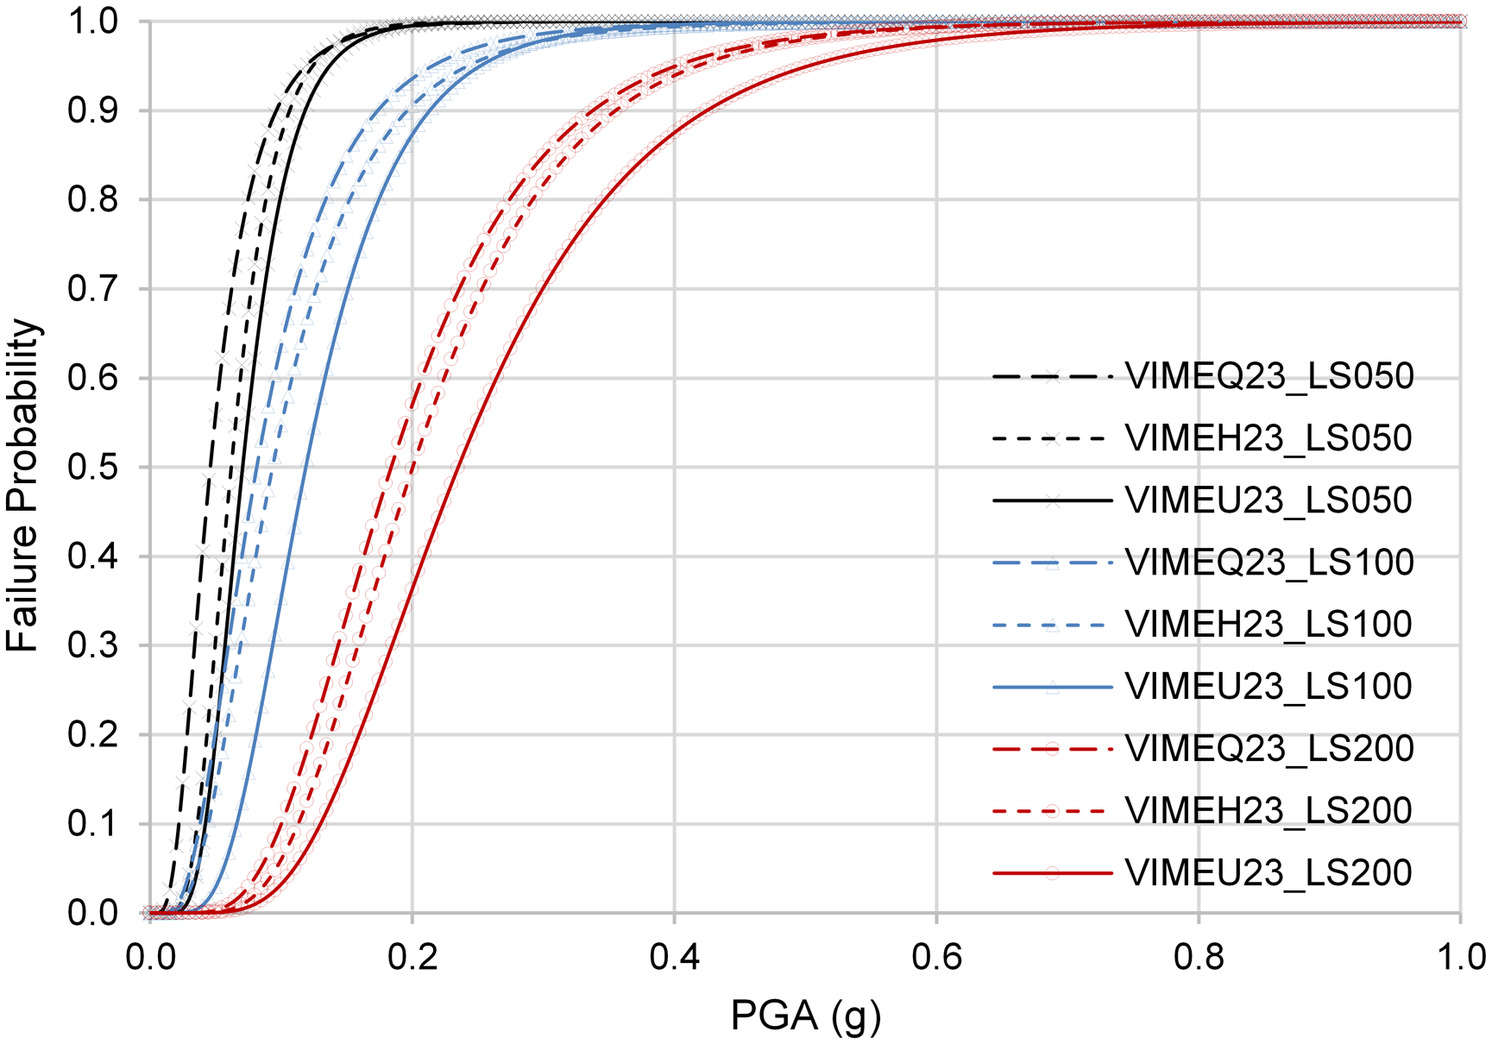
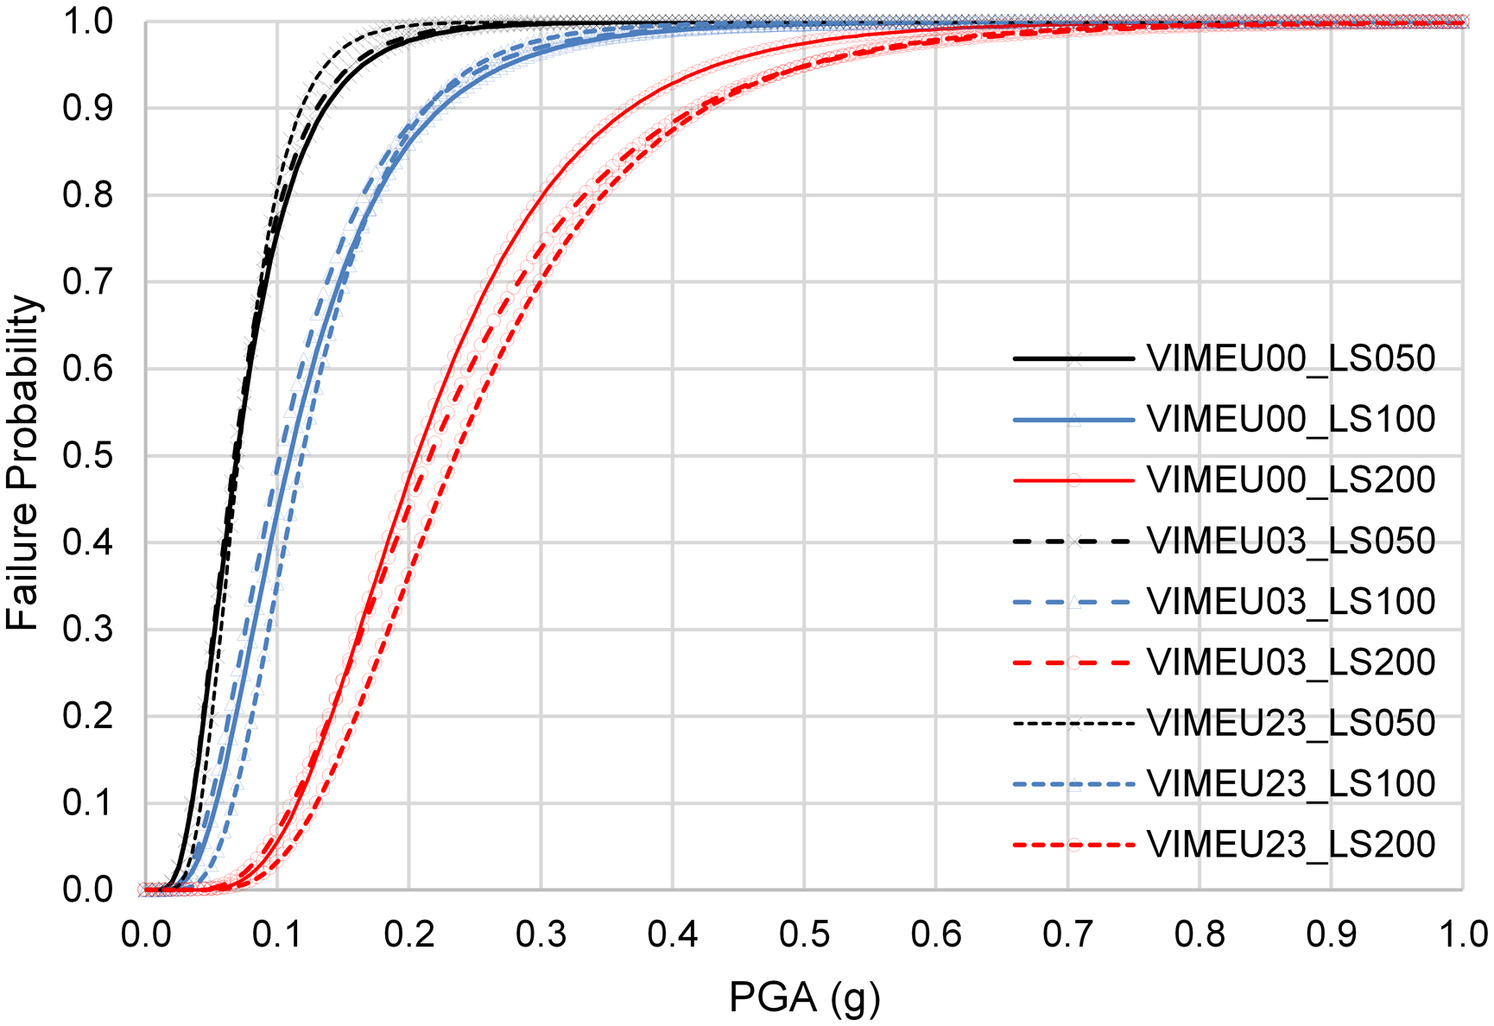
Fig. 11 shows seismic vulnerability curves of plan-regular models with selected vertical mass distribution cases at three limit states. The VIMEU00 model is a regular structure with no vertical irregularity. In contrast, VIMEU03 and VIMEU23 models have different vertical irregularities from more structural use of the top and two upper floors, respectively. The seismic fragility curve of a regularly shaped frame structure demonstrates a trend influenced by the choice of structural use scenario. When comparing models at the same PGA, it is evident that the failure probability varies significantly. This trend highlights that even initially regular structures can experience mass irregularity resulting from uneven structural use. Moreover, it reveals that such irregularities can lead to a considerably worse seismic performance than initially expected. Therefore, it is crucial to recognize and account for the potential impact of structural use scenarios on mass distribution to accurately assess the seismic vulnerability of a building.
Conclusion
This research focuses on the impact of live-load distributions on the behavior of structures, particularly in relation to their usage. It has been observed that uneven utilization of building space can lead to unequal mass distributions in both plan and elevation, effectively transforming a regular structure into a mass-eccentric structure. This transformation renders the structure more vulnerable to earthquake loading. To address this issue, this research has undertaken an investigation to develop more realistic and comprehensive seismic vulnerability relations for low-rise RC frame structures. This study specifically considers structures with various vertical and in-plan irregularities resulting from different usage change scenarios.
To achieve this, this research has utilized 3D analytical models instead of simplified ones, allowing us to account for actual nonlinear torsional impact. This novel integrated approach combines structural and reliability analyses to overcome the significant computational challenges associated with employing detailed models.
The outcomes of this research provide more representative and reliable fragility curves for low-rise RC frame structures. By employing detailed analytical models, this research has been able to investigate the influence of occupancy or mass distribution changes on structural seismic vulnerability. In this study, 21 different live-load distribution scenarios have been considered, and conducted nonlinear response history analyses using 10 earthquake ground input records. Based on allowable drift ratios, eight limit states have been assumed, leading to the analysis of a total of 1,680 cases. Fragility curves have been generated from these cases, and seismic fragility surfaces have been plotted based on the results. Also, the log-normal parameters of all derived fragility curve functions for the studied frame structures have been presented.
These findings demonstrate that structural occupancy or mass distribution changes have a significant impact on seismic vulnerability, which aligns with previous research and observations of earthquake damage. Additionally, this work introduces the concept of seismic fragility surfaces, which provides extensive information regarding structure performance during earthquake events.
Based on the conducted fragility analysis and the reported vulnerability results, this research recommends that design criteria consider an unexpected eccentricity of up to 25% in both plan and vertical directions, depending on the different limit states. These criteria address the risk of unexpected eccentric cases resulting from changes in the structure’s usage, which may occur after the completion of the design process. Moreover, the results of this research show that the variation in failure probabilities decreases as the limit states increase. For cases with lower limit states, it is highly advisable to consider these unexpected eccentricity cases to mitigate the higher exposure to failure.
Although this research considered 21 different live-load distribution scenarios, they may not encompass the full range of irregularities present in the real world, such as variations in floor plans or vertical setbacks, which could influence the structural response and vulnerability. While the findings of this research provide valuable insights into the seismic fragility of low-rise RC frame structures. Therefore, further studies considering a broader range of irregularities are necessary to enhance the generalizability of the findings to a wider spectrum of real-world structural configurations. In conclusion, this research contributes to a more realistic model for vulnerability assessment by investigating the effect of unexpected usage changes on the vulnerability of structures. The findings and recommendations presented in this study have significant implications for the design and analysis of low-rise RC frame structures in seismic-prone areas.
Data Availability Statement
Some or all data, models, or code that support the findings of this study are available from the corresponding author upon reasonable request.
Acknowledgments
This work is supported by the University of Hawaii and the Korea Agency for Infrastructure Technology Advancement (KAIA) grant funded by the Ministry of Land, Infrastructure and Transport (Grant RS-2021-KA163162).
References
Abdelhafeez, M., A. Ghanem, and M. Sherif. 2022. “Probabilistic fragility analysis of reinforced concrete structures under tsunami hydrodynamic loads of the ASCE 7 standard.” In Proc., Ports 2022, 488–497. Reston, VA: ASCE.
Abdel Raheem, S. E., M. M. Ahmed, M. M. Ahmed, and A. G. Abdel-shafy. 2018. “Evaluation of plan configuration irregularity effects on seismic response demands of L-shaped MRF buildings.” Bull. Earthquake Eng. 16 (9): 3845–3869. https://doi.org/10.1007/s10518-018-0319-7.
Amirsardari, A., E. Lumantarna, P. Rajeev, and H. M. Goldsworthy. 2020. “Seismic fragility assessment of non-ductile reinforced concrete buildings in Australia.” J. Earthquake Eng. 26 (4): 1941–1975.
Anagnostopoulos, S. A., M. T. Kyrkos, and K. G. Stathopoulos. 2015. “Earthquake induced torsion in buildings: Critical review and state of the art.” Earthquakes Struct. 8 (2): 305–377. https://doi.org/10.12989/eas.2015.8.2.305.
Arguero, B. 2020. “Annual US earthquake losses are estimated at $4.4B.” Accessed November 30, 2020. https://www.govcon.com/doc/annual-us-earthquake-losses-estimated-at-44b-0001.
ASCE. 2022. Minimum design loads and associated criteria for structures and other structures. ASCE/SEI 7-22. Reston, VA: ASCE.
Ayub, M. A., M. Rizwan, and A. Waheed. 2018. “Damage assessment of deficient reinforced concrete setback structures.” Proc. Inst. Civ. Eng. Struct. Build. 171 (9): 696–704. https://doi.org/10.1680/jstbu.17.00095.
Azad, M. S., M. M. Sazzad, N. Samadder, and M. F. Rahman. 2019. “Effect of setback percentages in vertically irregular concrete buildings on response to earthquake.” In Proc., Int. Conf. on Planning, Architecture and Civil Engineering, 7–9. Rajshahi, Bangladesh: Rajshahi Univ. of Engineering and Technology.
Bartlett, F. M., and J. G. MacGregor. 1996. “Statistical analysis of the compressive strength of concrete in structures.” ACI Mater. J. 93 (2): 158–168.
Bracci, J. M., A. M. Reinhorn, and J. B. Mander. 1992. Seismic resistance of reinforced concrete frame structures designed only for gravity loads: Part I—Design and properties of a one-third scale model structure. Buffalo, NY: State Univ. of New York at Buffalo.
Brunesi, E., R. Nascimbene, F. Parisi, and N. Augenti. 2015. “Progressive collapse fragility of reinforced concrete framed structures through incremental dynamic analysis.” Eng. Struct. 104 (Mar): 65–79. https://doi.org/10.1016/j.engstruct.2015.09.024.
CEN (European Committee for Standardization). 2004. Eurocode 8: Design of structures for earthquake resistance Part 1: General rules, seismic actions, and rules for buildings. EN 1998-1. Brussels, Belgium: CEN.
Der Kiureghian, A. 2005. “First-and second-order reliability methods.” In Engineering design reliability handbook, edited by E. Nikolaidis, D. M. Ghiocel, and S. Singhal. Boca Raton, FL: CRC Press.
Di Sarno, L., and F. Pugliese. 2020. “Seismic fragility of existing RC buildings with corroded bars under earthquake sequences.” Soil Dyn. Earthquake Eng. 134 (Mar): 106169. https://doi.org/10.1016/j.soildyn.2020.106169.
Elnashai, A. S., V. Papanikolaou, and D. Lee. 2010. Zeus-NL-A system for inelastic analysis of structures—User manual. Urbana, IL: Univ. of Illinois at Urbana-Champaign.
Elnashai, A. S., and L. Sarno. 2008. Fundamentals of earthquake engineering. New York: Wiley.
Furtado, A., H. Rodrigues, H. Varum, and A. Arêde. 2018. “Mainshock-aftershock damage assessment of infilled RC structures.” Eng. Struct. 175 (Mar): 645–660. https://doi.org/10.1016/j.engstruct.2018.08.063.
Ghanem, A., M. M. Hassan, and S. A. Mourad. 2019a. “Assessment of seismic behavior of eccentric braced steel frames.” Doctoral dissertation, Faculty of Engineering, Cairo Univ.
Ghanem, A., M. M. Hassan, and S. A. Mourad. 2019b. Effect of the height of structures on the force reduction factor of eccentric braced frames. Giza, Egypt: Cairo Univ.
Ghanem, A., and D. Moon. 2021. “Seismic fragility assessment of skewed reinforced concrete bridges.” In Vol. 27 of Proc., 17th World Conf. on Earthquake Engineering (17WCEE). Kanpur, India: National Information Centre of Earthquake Engineering at the Indian Institute of Technology in Kanpur.
Ghanem, A., D. Moon, and Y. Lee. 2021a. “Seismic fragility surface of irregular reinforced concrete frame structures.” In Proc., 17th World Conf. on Earthquake Engineering (17WCEE). Kanpur, India: National Information Centre of Earthquake Engineering at the Indian Institute of Technology in Kanpur.
Ghanem, A., D. Moon, and Y. Lee. 2021b. “Seismic vulnerability assessment of skewed reinforced concrete bridges.” Preprint, submitted November 1, 2021. https://arxiv.org/abs/10.31224/osf.io/cy5pj.
Ghanem, A., M. Sherif, M. Abdelhafeez, Y. Lee, and D. Moon. 2022. “Relationship between seismic redundancy and failure likelihood for mass-eccentric reinforced concrete frame structures.” In Proc., 12th National Conf. on Earthquake Engineering, NCEE 2022. Oakland, CA: Earthquake Engineering Research Institute.
Haukaas, T. 2003. “Finite element reliability and sensitivity methods for performance-based engineering.” Ph.D. thesis, Dept. of Civil and Environmental Engineering, Univ. of California, Berkeley.
International Code Council. 2021. International Building Code. Brea, CA: International Code Council.
Jeong, S. H., and A. S. Elnashai. 2007. “Probabilistic fragility analysis parameterized by fundamental response quantities.” Eng. Struct. 29 (6): 1238–1251. https://doi.org/10.1016/j.engstruct.2006.06.026.
Kassem, M. M., F. Mohamed Nazri, L. J. Wei, C. G. Tan, S. Shahidan, and S. S. Mohd Zuki. 2019. “Seismic fragility assessment for moment-resisting concrete frame with setback under repeated earthquakes.” Asian J. Civ. Eng. 20 (3): 465–477. https://doi.org/10.1007/s42107-019-00119-z.
Kostinakis, K., and A. Athanatopoulou. 2020. “Effects of in-plan irregularities caused by masonry infills on the seismic behavior of R/C buildings.” Soil Dyn. Earthquake Eng. 129 (Feb): 105598. https://doi.org/10.1016/j.soildyn.2019.03.012.
Kumar, S. S. B. S., G. V. R. Rao, and P. M. Raju. 2016. “Seismic fragility analysis of regular and setback RCC frames—A few hypothetical case studies.” Asian J. Civ. Eng. 17 (5): 551–569.
Kwon, O.-S., and A. S. Elnashai. 2006. “The effect of material and ground motion uncertainty on the seismic vulnerability curves of RC structure.” Eng. Struct. 28 (2): 289–303. https://doi.org/10.1016/j.engstruct.2005.07.010.
Lu, Y., X. Gu, and J. Guan. 2005. “Probabilistic drift limits and performance evaluation of reinforced concrete columns.” J. Struct. Eng. 131 (6): 966–978. https://doi.org/10.1061/(ASCE)0733-9445(2005)131:6(966).
Martínez-Rueda, J. E., and A. S. Elnashai. 1997. “Confined concrete model under cyclic load.” Mater. Struct. 30 (3): 139–147. https://doi.org/10.1007/BF02486385.
Melchers, R. E., and A. T. Beck. 2018. Structural reliability analysis and prediction. New York: Wiley.
Men, J. J., Q. Zhou, and Q. X. Shi. 2009. “Fragility analysis method for vertically irregular reinforced concrete frame structures.” Key Eng. Mater. 400–402 (Jun): 587–592.
Mirza, S. A., and J. G. MacGregor. 1979. “Variability of mechanical properties of reinforcing bars.” J. Struct. Div. 105 (5): 921–937. https://doi.org/10.1061/JSDEAG.0005146.
Moon, D. S., Y. J. Lee, and S. Lee. 2016. “Seismic vulnerability assessment of RC frame structures using 3D analytical models.” J. Korea Acad.-Ind. Cooperation Soc. 17 (9): 724–731. https://doi.org/10.5762/KAIS.2016.17.9.724.
Moon, D. S., Y. J. Lee, and S. Lee. 2018. “Fragility analysis of space reinforced concrete frame structures with structural irregularity in plan.” J. Struct. Eng. 144 (8): 04018096. https://doi.org/10.1061/(ASCE)ST.1943-541X.0002092.
Nazri, F. M., C. Tan, and S. N. A. Saruddin. 2018. “Fragility curves of regular and irregular moment-resisting concrete and steel frames.” Int. J. Civ. Eng. 16 (Jan): 917–927. https://doi.org/10.1007/s40999-017-0237-0.
Oggu, P., and K. Gopikrishna. 2020. “Assessment of three-dimensional RC moment resisting frames under repeated earthquakes.” Structures 26 (Aug): 6–23. https://doi.org/10.1016/j.istruc.2020.03.039.
Pan, W., K. Li, and Y. Teng. 2018. “Rethinking system boundaries of the life cycle carbon emissions of buildings.” Renewable Sustainable Energy Rev. 90 (Mar): 379–390. https://doi.org/10.1016/j.rser.2018.03.057.
Pavel, F., and D. Lungu. 2013. “Correlations between frequency content indicators of strong ground motions and PGV.” J. Earthquake Eng. 17 (4): 543–559. https://doi.org/10.1080/13632469.2012.762957.
Rackwitz, R., and B. Flessler. 1978. “Structural reliability under combined random load sequences.” Comput. Struct. 9 (5): 489–494. https://doi.org/10.1016/0045-7949(78)90046-9.
Radu, A., and M. Grigoriu. 2018. “An earthquake-source-based metric for seismic fragility analysis.” Bull. Earthquake Eng. 16 (9): 3771–3789. https://doi.org/10.1007/s10518-018-0341-9.
Ruggieri, S., A. Chatzidaki, D. Vamvatsikos, and G. Uva. 2022. “Reduced-order models for the seismic assessment of plan-irregular low-rise frame buildings.” Earthquake Eng. Struct. Dyn. 51 (14): 3327–3346. https://doi.org/10.1002/eqe.3725.
Ruggieri, S., F. Porco, and G. Uva. 2020. “A practical approach for estimating the floor deformability in existing RC buildings: Evaluation of the effects in the structural response and seismic fragility.” Bull. Earthquake Eng. 18 (Mar): 2083–2113. https://doi.org/10.1007/s10518-019-00774-2.
Ruggieri, S., F. Porco, G. Uva, and D. Vamvatsikos. 2021. “Two frugal options to assess class fragility and seismic safety for low-rise reinforced concrete school buildings in Southern Italy.” Bull. Earthquake Eng. 19 (Mar): 1415–1439. https://doi.org/10.1007/s10518-020-01033-5.
Sherif, M., A. Ghanem, M. Abdelhafeez, and D. Moon. 2022. “Indexing seismic fragility curves of skewed reinforced concrete bridges.” In Proc., 12th National Conf. on Earthquake Engineering, NCEE 2022. Oakland, CA: Earthquake Engineering Research Institute.
Shojaei, F., and B. Behnam. 2017. “Seismic vulnerability assessment of low-rise irregular reinforced concrete structures using cumulative damage index.” Adv. Concr. Constr. 5 (4): 407–422. https://doi.org/10.12989/ACC.2017.5.4.407.
Sohn, J., I. Choi, and J. Kim. 2022. “Development of limit states for seismic fragility assessment of piloti-type structures verified with observed damage data.” Eng. Struct. 251 (Mar): 113562. https://doi.org/10.1016/j.engstruct.2021.113562.
Thapa, S., Y. Shrestha, and D. Gautam. 2022. “Seismic fragility analysis of RC bridges in high seismic regions under horizontal and simultaneous horizontal and vertical excitations.” Eng. Struct. 37 (Mar): 284–294. https://doi.org/10.1016/j.istruc.2022.01.021.
Information & Authors
Information
Published In

Journal of Structural Engineering
Volume 150 • Issue 3 • March 2024
Copyright
This work is made available under the terms of the Creative Commons Attribution 4.0 International license, https://creativecommons.org/licenses/by/4.0/.
History
Received: Jan 28, 2023
Accepted: Oct 23, 2023
Published online: Dec 30, 2023
Published in print: Mar 1, 2024
Discussion open until: May 30, 2024
ASCE Technical Topics:
- Concrete
- Concrete frames
- Concrete structures
- Design (by type)
- Earthquake engineering
- Earthquake resistant structures
- Engineering fundamentals
- Engineering materials (by type)
- Frames
- Geotechnical engineering
- Load distribution
- Materials engineering
- Reinforced concrete
- Seismic effects
- Seismic tests
- Structural design
- Structural engineering
- Structural members
- Structural systems
- Structure reinforcement
- Structures (by type)
- Tests (by type)
Authors
Metrics & Citations
Metrics
Citations
Download citation
If you have the appropriate software installed, you can download article citation data to the citation manager of your choice. Simply select your manager software from the list below and click Download.