Abstract
Flexible barriers can be used to trap woody debris or debris flows. However, their small scale modelling is challenging because of their possible deformation. This article addresses how to meet the partial mechanical similitude of manufactured flexible barriers. Relevant dimensionless parameters are defined from flow velocity, barrier geometry, and component mechanical properties. These similitude criteria are validated using numerical simulations of barriers exposed to a hydrodynamic loading at various scales. The simulations also confirm the importance of accounting for the mechanical characteristics of the barrier components when designing model barriers in view of achieving realistic deformations. Next, a real barrier with complex features is scaled to conduct flume experiments. This scaled barrier is 3D-printed with material selected to achieve the mechanical similitude criterion. Another validation of this approach is performed considering hydrostatic loading and checking that simulated and measured deformations are similar. As an application case, the deformations measured during the experiments performed with woody debris are also compared to the hydrostatic loading.
Introduction
Flexible barriers in cable-supported nets are widely used as protection structures against various types of gravity-driven natural hazards. Originally designed for rockfall in the 1970’s, barriers are now employed to contain debris flows, snow avalanches, shallow landslides, and woody debris. The ability of the barrier in satisfactorily acting on the hazard run-out, and the barrier strength are the main design-oriented issue that has motivated research works for decades (Nicot et al. 2002; Wendeler 2008; Volkwein et al. 2011; Barbero et al. 2014; Mentani et al. 2016; Ashwood and Hungr 2016; Vagnon et al. 2017; Lambert et al. 2020). Both issues are related to the mechanical response of the barrier when exposed to hazard-induced loading, where amplitude, variation with time, and spatial distribution on the barrier differ from one hazard type to the other. This response is more complex than for rigid barriers because flexible barriers consist of various interconnected components (mainly the net, cables, shackles, and energy dissipating devices) whose characteristics and lay out in the barrier are generally design- and site-specific.
As for the use of flexible barriers in torrents, existing studies have mainly focused on debris flows. Either based on experiments on real or reduced-scale barriers or on numerical models, the vast majority of these studies have focused on the load exerted by the flow on the barrier and the resulting loads within the barrier (Wendeler 2008; Brighenti et al. 2013; Ashwood and Hungr 2016; Leonardi et al. 2016; Albaba et al. 2017; Ng et al. 2017; Vagnon et al. 2017; Tan et al. 2018; Wendeler et al. 2019; Song et al. 2019b; Li et al. 2020; Jiang et al. 2020; Brighenti et al. 2021). Other issues have been addressed to a lesser extent, such as the optimization of the barrier mesh size with respect to the grain size distribution or the influence of the barrier flexibility on the granular material deposition or flow run up (Canelli et al. 2012; Wendeler and Volkwein 2015; Ng et al. 2016; Tan et al. 2020).
Given the very large number of parameters in play and the dimensions of real barriers, lab experiments on barrier models constitute a cost saving alternative to address the flexible barrier response and its effect on the flow. Published studies based on small scale experiments conducted in flumes involved various types of flow materials, from dry granular flows (Brighenti et al. 2021) to viscous flows (Ng et al. 2017). The tested barriers mainly consisted in nets even if, in some studies, barriers made from plastic or rubber sheets were also used when dealing with dry granular materials (Ng et al. 2016; Ashwood and Hungr 2016; Song et al. 2019b). The nets used were made from commercially available products like hexagonal wire mesh (“chicken net”), cable nets, plastic nets, or steel-ropes supported nylon nets (Canelli et al. 2012; Wendeler et al. 2019; Jiang et al. 2020; Brighenti et al. 2021).
To ensure that the obtained results are applicable to the real-scale, similitude issues were accounted for to a greater or lesser extent when designing the small scale experiments. Particular attention was generally paid to the flow characteristics, referring to the Froude number (Ng et al. 2016; Wendeler et al. 2019). Wendeler et al. (2019) proposed five dimensionless quantities to consider when dealing with debris flow catchment barriers. These parameters refer to the flow characteristics, the barrier global dimensions, and the interaction between the flow and the barrier. The barrier mesh size was considered when the retention issue was addressed. In contrast, the mechanical characteristics of the barriers have been marginally considered until now. Ng et al. (2016) considered a deformable barrier made of a plastic plate supported by cables whose stiffness is similar to the real scale. The works conducted by this team led to the conclusion that the barrier stiffness has an influence on the impact force when the flow aspect ratio is high (Song et al. 2019b). Based on flume experiments involving plates made of three different polymers, Yu et al. (2022) recently revealed the influence of barrier modulus on the impact pressure and barrier deflection. Experimental results presented by Wendeler et al. (2019) confirmed the influence of the barrier mechanical characteristics on the impact load on the barrier and observed a difference in flow behavior, in terms of run-up or pile-up. In fact, the barrier mechanical characteristics govern the barrier deformation, by influencing the interaction force between the flow and barrier, the load transfer to the cables and anchors, the barrier retention capacity, and the flow piling up. Thus, it seems necessary to pay special attention to the barrier mechanical characteristics when studying the interaction between a geophysical flow and a flexible barrier based on small scale experiments.
In this context, this article presents the scaling of a flexible barrier to be used in flume experiments to investigate its capability in containing torrential-flow driven solid materials, with a particular focus on woody debris. The similitude issue is addressed in detail for defining the barrier geometrical and mechanical characteristics, employing different techniques and tools. A 3D printing technique is used to manufacture the barrier components, considering various polymers and printing parameters. Discrete element modeling is used to simulate the response of barriers at various scales for demonstrating the relevance of the proposed scaling approach and, second, for validating the scaled model of a specific real barrier. Experiments are conducted on the 3D-printed scaled barrier components to measure their mechanical characteristics and optimize the manufacturing process and on the full reduced scale barrier to measure its deformation under hydro-static loading.
This article is structured as follows. First, the materials and methods used are described, namely the dimensional analysis, the 3D printing, the DEM modeling, and the flume experiments. In the third section, the scaling is theoretically addressed considering a barrier with a simple design. A set of five parameters is proposed to serve as similitude criteria. The limitations in current practices are highlighted before validating the proposed similitude criteria thanks to DEM simulations considering barriers at different scales. In the fourth section, a more realistic barrier with a water-drop mesh is considered in view of conducting flume experiments at a scale of 1/40. The design of the 3D-printed barrier model is addressed, emphasizing constraints resulting from both the 3D printing technique and the complexity of the real net. For validation purposes, the manufactured barrier model response to hydro-static loads is compared to DEM simulation results considering the real-scale barrier. Last, some experimental results concerning the response of the barrier model exposed to a flow laden with woody debris are presented in view of ensuring that the loading considered for addressing the similitude issue, and thus its deformation is in accordance with that experienced by the barrier during these latter experiments.
Materials and Methods
Dimensional Analysis
Four main methods can be used to approach model-prototype similitude (Heller 2011): (1) dimensional analysis is based on the definition of relevant dimensionless numbers aggregating the main parameters describing the system (e.g., geometry, rheology, mechanical strength); (2) inspectional analysis enables the ability to study scale effects of systems whose behavior is known by equations (e.g., Navier-Stokes, elasticity theory); (3) the calibration is based on trial and test adjusting model features until it behaves in a reasonably similar way than the prototype (a sufficient data set of the prototype behaviour is necessary); and (4) the scale series rely on similar runs performed on several models of different scales. Similarities between scales regarding the models’ responses can be sought to be applied to the prototype scale. Meanwhile, scale effects are highlighted through the deviation of some behavior with increasing scale reduction.
We basically used all four approaches in this work. A classical dimensional analysis using the so-called Buckingham Π approach was first implemented to highlight a set of simple dimensionless parameters relevant regarding the down-scaling of flexible structures used in the hydraulic lab. Its relevance was secondly tested using multi-scale numerical simulations, thus performing a virtual scale series approach. Calibration was used to adjust the manufacturing of the net to find the relevant material to be used in the 3D printer and the geometry of the structure. Finally, an inspectional analysis is provided in the “Discussion” section to demonstrate the consistency of the approach proposed to achieve mechanical similarity.
3D Printing
The components of the barrier models were produced by 3D printing according to the fused deposition modelling (FDM) technique. This technique consists of fusing and depositing a polymer filament that, with successive passes, creates custom-made objects with complex shapes. This technique constitutes a convenient and versatile way of manufacturing physical models of barriers to be used in flume experiments.
Various combinations of polymers and production parameters were tested to converge towards the barrier model components with targeted characteristics. The considered polymers were selected among the most widely used ones for 3D printing and those that have a tensile modulus on the order of magnitude of that required for the barrier cables on one side, and the net on the other (see Table 1). The failure stress values reveal that the failure strain of these materials is much larger than that of steel cables constituting the real net.
| Polymer | Tensile modulus (GPa) | Failure stress (MPa) | Source |
|---|---|---|---|
| ASA | 2.13 | 45.4 | ASA datasheet |
| ABS | 2.31 | 40.4 | ABS datasheet |
| PSU | 5.17 | 87.2 | PSU datasheet |
| PETG | 2.59 | 40.6 | PETG datasheet |
| PLA | 2.34 | 64.5 | PLA datasheet |
| TPU | 0.78 | 37.5 | TPU datasheet |
| TPE | 0.24 | 9.8 | TPE datasheet |
Note: ABS = acrylonitrile butadiene styrene; and PSU = polysulfone.
Source: Data from MatWeb (2021).
The following parameters were considered in view of reaching the printed components targeted mechanical characteristics: fusing temperature, nozzle diameter, printing velocity, number of passes, single pass deposit thickness, ironing, and ventilation (Warnung et al. 2018).
Since there is important variability in the mechanical properties of the same material (for example, the ABS average tensile modulus is 2.31 GPa in a range of according to the matweb datasheet), depending on its manufacturer, as well as on the manufacturing parameters (3D printing), samples printed from all the polymers listed in Table 1 were submitted to pseudo-static tensile tests. The tests were performed 7 days after manufacturing, so that the mechanical characteristics of the components were stabilized after internal stress relaxation. The mechanical response during unloading was not characterized as in the studied case where the barrier is exposed to progressive loading only. A linear response was considered in determining the printed cable strands’ tensile moduli and printed net panels’ stiffness. The characteristics provided in the sections “Main Cables Model and Net Model” are average values obtained from a minimum of 5 tests.
Flume Experiments
The flume used by Piton et al. (2020) to study rigid barriers as woody-debris retention structures was reused in this study. The flume was 6 m in length, 0.4 m in width. The maximum amount of pumped water discharge was . The Froude number approaching the barrier varied in the 0.5–1.4 range in the absence of large wood and dropped to 0.05–0.4 when the barrier was partially clogged. The flume was equipped to measure the water discharge and water depth 20 cm upstream from the barrier. Further details concerning the flume and the measurements are provided in Piton et al. (2020).
To conduct the tests presented in the sections “Barrier Model Assessment and Barrier Deformation to Flows Loaded with Woody Debris,” the barriers were installed at the extremity of the flume, laterally fixed to a transparent and rigid plexiglass sheet delineating a 300 mm in width free section. No pre-tension was applied to the main cables (two horizontal cables and two lateral cables) during installation. To evaluate its deformation in the presence of water, the barrier was equipped with three cable extension transducers to measure the barrier elongation along the bottom and top horizontal cables as well as along the barrier mid-height. The top cable elongation gives an indication of the barrier lowering, which is associated with the barrier overflowing. Unfortunately, we were unable to measure this lowering during the experiments (using image-based techniques or intrusive sensors), and, in particular, those where logs and water reached the top cable and passed through the barrier (see the companion paper, Piton et al. 2022).
To apply the hydro-static loading considered in the “Barrier Model Assessment” section, a thin film was placed upstream of the barrier to contain the water [see Figs. 10(e and f) of the companion paper]. This film was much larger and higher than the barrier and was folded prior to use. The folds, in both the vertical and horizontal directions, resulted in 1-cm overlaps in film width every 3 cm. The progressive film unfolding, associated with film overlap width reduction, allowed it to accommodate to the very large barrier deflection without inducing tensile stress in the film. The test was progressively conducted by increasing the water depth up to 1.1 times the initial barrier height. This loading aimed at replicating that resulting from the full barrier clogging, with overflow.
The tests presented in the “Barrier Deformation to Flows Loaded with Woody Debris” section were performed considering floating woods having geometrical and density similitude with the real scale but made of real wood [see (Piton et al. 2020) for further details]. Achieving full mechanical similitude of the wood material is a very complicated challenge that deserves further research.
DEM Modelling
Two different barriers were modeled in this study. First, a simple barrier was exposed to hydro-dynamic loading and, second, a more realistic barrier was exposed to hydro-static loading. For both of these barriers, a discrete element method (DEM) model has been developed using YADE software, an extensible open-source framework for discrete numerical models, focused on DEM (Šmilauer et al. 2015). Among many other applications, YADE has been widely and successfully used to model flexible barriers (Thoeni et al. 2013; Albaba et al. 2017; Dugelas et al. 2019; Xu et al. 2020; Pol and Gabrieli 2021).
The DEM models of these two flexible barriers share common features. The barriers are modeled as an assembly of nodes located along the main cables and at the connections between the strands forming the net. The cable strands, or segments, between two successive nodes are given an elastic linear response except for two out of five segments forming the mesh of the second barrier. These latter segments have a bilinear elasto-plastic response able to mimic the effect of the progressive mesh shape evolution (see the “Barrier Description” section) (Dugelas et al. 2019). Cable rupture nor bending between two cable strands is considered in this study. Since the barrier did not contact any other object, external contact laws were were not considered.
The simple barrier is modeled as in Albaba et al. (2017), where the linear cable segments are modeled based on deformable cylinders connected to each other via nodes. The model used for the more realistic barrier is much more sophisticated, as it concerns a cable supported net with a water-drop mesh. This model, described in detail in Dugelas (2020), allows for natural accounting for the sliding between barrier components, which was shown to be of paramount importance when dealing with flexible barriers (Volkwein 2004; Coulibaly et al. 2018). To allow for comparisons with the experimental results involving this barrier, the tension in the cables of the extension transducers was accounted for in the simulation. Indeed, as the retraction force of the sensors was 1 N, it could not be neglected considering the barrier stiffness.
Both the hydro-dynamic and hydro-static loads were modelled as equivalent forces on the nodes. The hydro-static load applied to the node was computed as follows:where is the density (), is the gravity acceleration (), is the water depth (m), is the position along the vertical axis of the node with respect to the flume base (m), and is the loading area attributed to the node which is simply computed as the net total area divided by the number of nodes forming the net. The hydro-dynamic loading includes, in addition to the hydro-static load, a drag force computed aswhere and are the cylinder length and diameter, respectively, and is the flow velocity (m/s). One will note that this drag force is computed assuming a drag coefficient of 1, a relevant first order approximation for cylinders (Joulié 1998).
(1)
(2)
Scaling A Barrier in View of Flume Experiments
Considered Barrier
A simple barrier is considered at this stage as it illustrates the principles of the proposed scaling while realistically mimicking barrier response to an out-of-plane loading. The barrier is a rectangular cable-net made from repetitive square mesh (Fig. 1). It is placed vertically across a channel. The barrier geometry is defined by (1) its height, ; (2) its width, ; (3) the mesh size, ; and (4) the diameter of the cables forming the mesh, .
Complex effects associated with some specific net features, such as the mesh shape or characteristics (Coulibaly et al. 2017), are thus avoided. In the same spirit, the barrier does not integrate energy dissipating devices or brakes.
Scaling a Barrier for Flume Experiments
To design a system with similitude to the real application, it should share geometric similarity, kinematic similarity, and dynamic similarity, globally referred to as the flow characteristics, the barrier mechanical characteristics, and the flow-barrier interaction (Heller 2011).
Regarding flow, the Froude number similitude is primarily considered here. This number is relevant when dealing with a free-surface flow. The Reynolds number similitude was relaxed but for all experiments with woody debris, turbulent flows with were maintained, with as the water kinetic viscosity (Piton et al. 2022).
In particular, the flow-barrier interaction is governed by the barrier porosity, meaning the ratio of total area of the barrier apertures to the barrier total area. The flow-barrier interaction also refers to the mesh size, which allows for trapping of boulders and large wood (Wendeler and Volkwein 2015). The flow-barrier interaction is also governed by the mechanical characteristics of the barrier, which is the ability of the barrier to change its conformation under flow-induced loading. The barrier deformation ability is an important feature due to its influence on the material deposition and flow evolution upstream of the barrier (dead zone formation, flow diversion). In the end, the points to consider in view of designing a scaled barrier meeting similitude requirements appear to be: (1) width of the net components with respect to the flow direction, (2) mesh size (aperture), and (3) mechanical characteristics of the barrier components.
The net is defined by four geometrical parameters (, , , and ) and by the modulus of the cables. The flow is described by its density, , its velocity, , and its depth, h. For the sake of simplicity and not to introduce an additional dimensionless number, the depth is considered equal to the barrier height. Last, the whole system is subjected to gravity, . Thus, the system is governed by height variables with three physical dimensions (distance, mass, time). By exploiting the Buckingham theorem, the response of the system can be described by a set of five dimensionless parameters, for instance the following
(3)
The three first parameters account for the barrier geometrical characteristics, is the Froude number, and the mechanical characteristics of the barrier are accounted for using . In this expression, is the tensile modulus describing the tensile loading response of the component (e.g., a cable strand or a piece of the net mesh, recall Fig. 3) over a given strain-range. It implies that the material has, or is considered to have, a linear response over this range. If strain remains small and if the material response is linear elastic, will be attributed the Young’s modulus value.
Achieving similitude requires that each of these five parameters have the same value at the reduced scale and at the real scale. Thus, parameters to can be used to design scaled systems to be used for experiments in flumes of any size. to drive the barrier geometry, drives the flow velocity, and drives the modulus of the strands forming the net.
Limitations in Current Practices
Current practices for the design of small-scale flexible barriers is to perform Froude scale models, i.e., to use undistorted small barrier height ( & ) and Froude similitude (). To avoid using excessively thin wires, cable diameters do not rigorously respect geometric similitude (), which is acceptable providing that the full barrier porosity remains very high. The common practice in using nets made from commercially available steel nets or strands bypasses questions related to the barrier deformation while playing a role in the retention capacity of the barrier and the flow-barrier interaction.
To evaluate the consequences of neglecting the mechanical characteristics of the cables in the design of a model, DEM modeling was used to simulate the response of the simple barrier at various scales. The real-scale barrier is 4 m high and 12 m wide. The water depth considered in simulating the barrier response equals the barrier initial height. In accordance with numerous real situations where high solid transport enables the recruitment of woody debris by bank erosion, the Froude number was taken as approximately critical, i.e., (Piton and Recking 2019). The scale ratio range was chosen to be very large to cover a wide range of situations. At each scale, the parameters defining the flow and the barrier model were determined considering variables to , but not considering . Thus, it is considered that steel was used at all scales.
The parameter values considered in running the simulations at different scales are those presented in Table 2, except the modulus, which is kept the same as that at the real scale.
| Scale | Tensile modulus (GPa) | Flow velocity () | Barrier height (m) | Barrier width (m) | Mesh size (mm) | Cable diameter (mm) |
|---|---|---|---|---|---|---|
| 1 | 100 | 6 | 4 | 12 | 200 | 10 |
| 10 | 1.897 | 0.4 | 1.2 | 20 | 1 | |
| 3.3 | 1.095 | 0.133 | 0.4 | 6.67 | 0.333 | |
| 2 | 0.849 | 0.08 | 0.24 | 4 | 0.2 | |
| 1 | 0.6 | 0.04 | 0.12 | 2 | 0.1 |
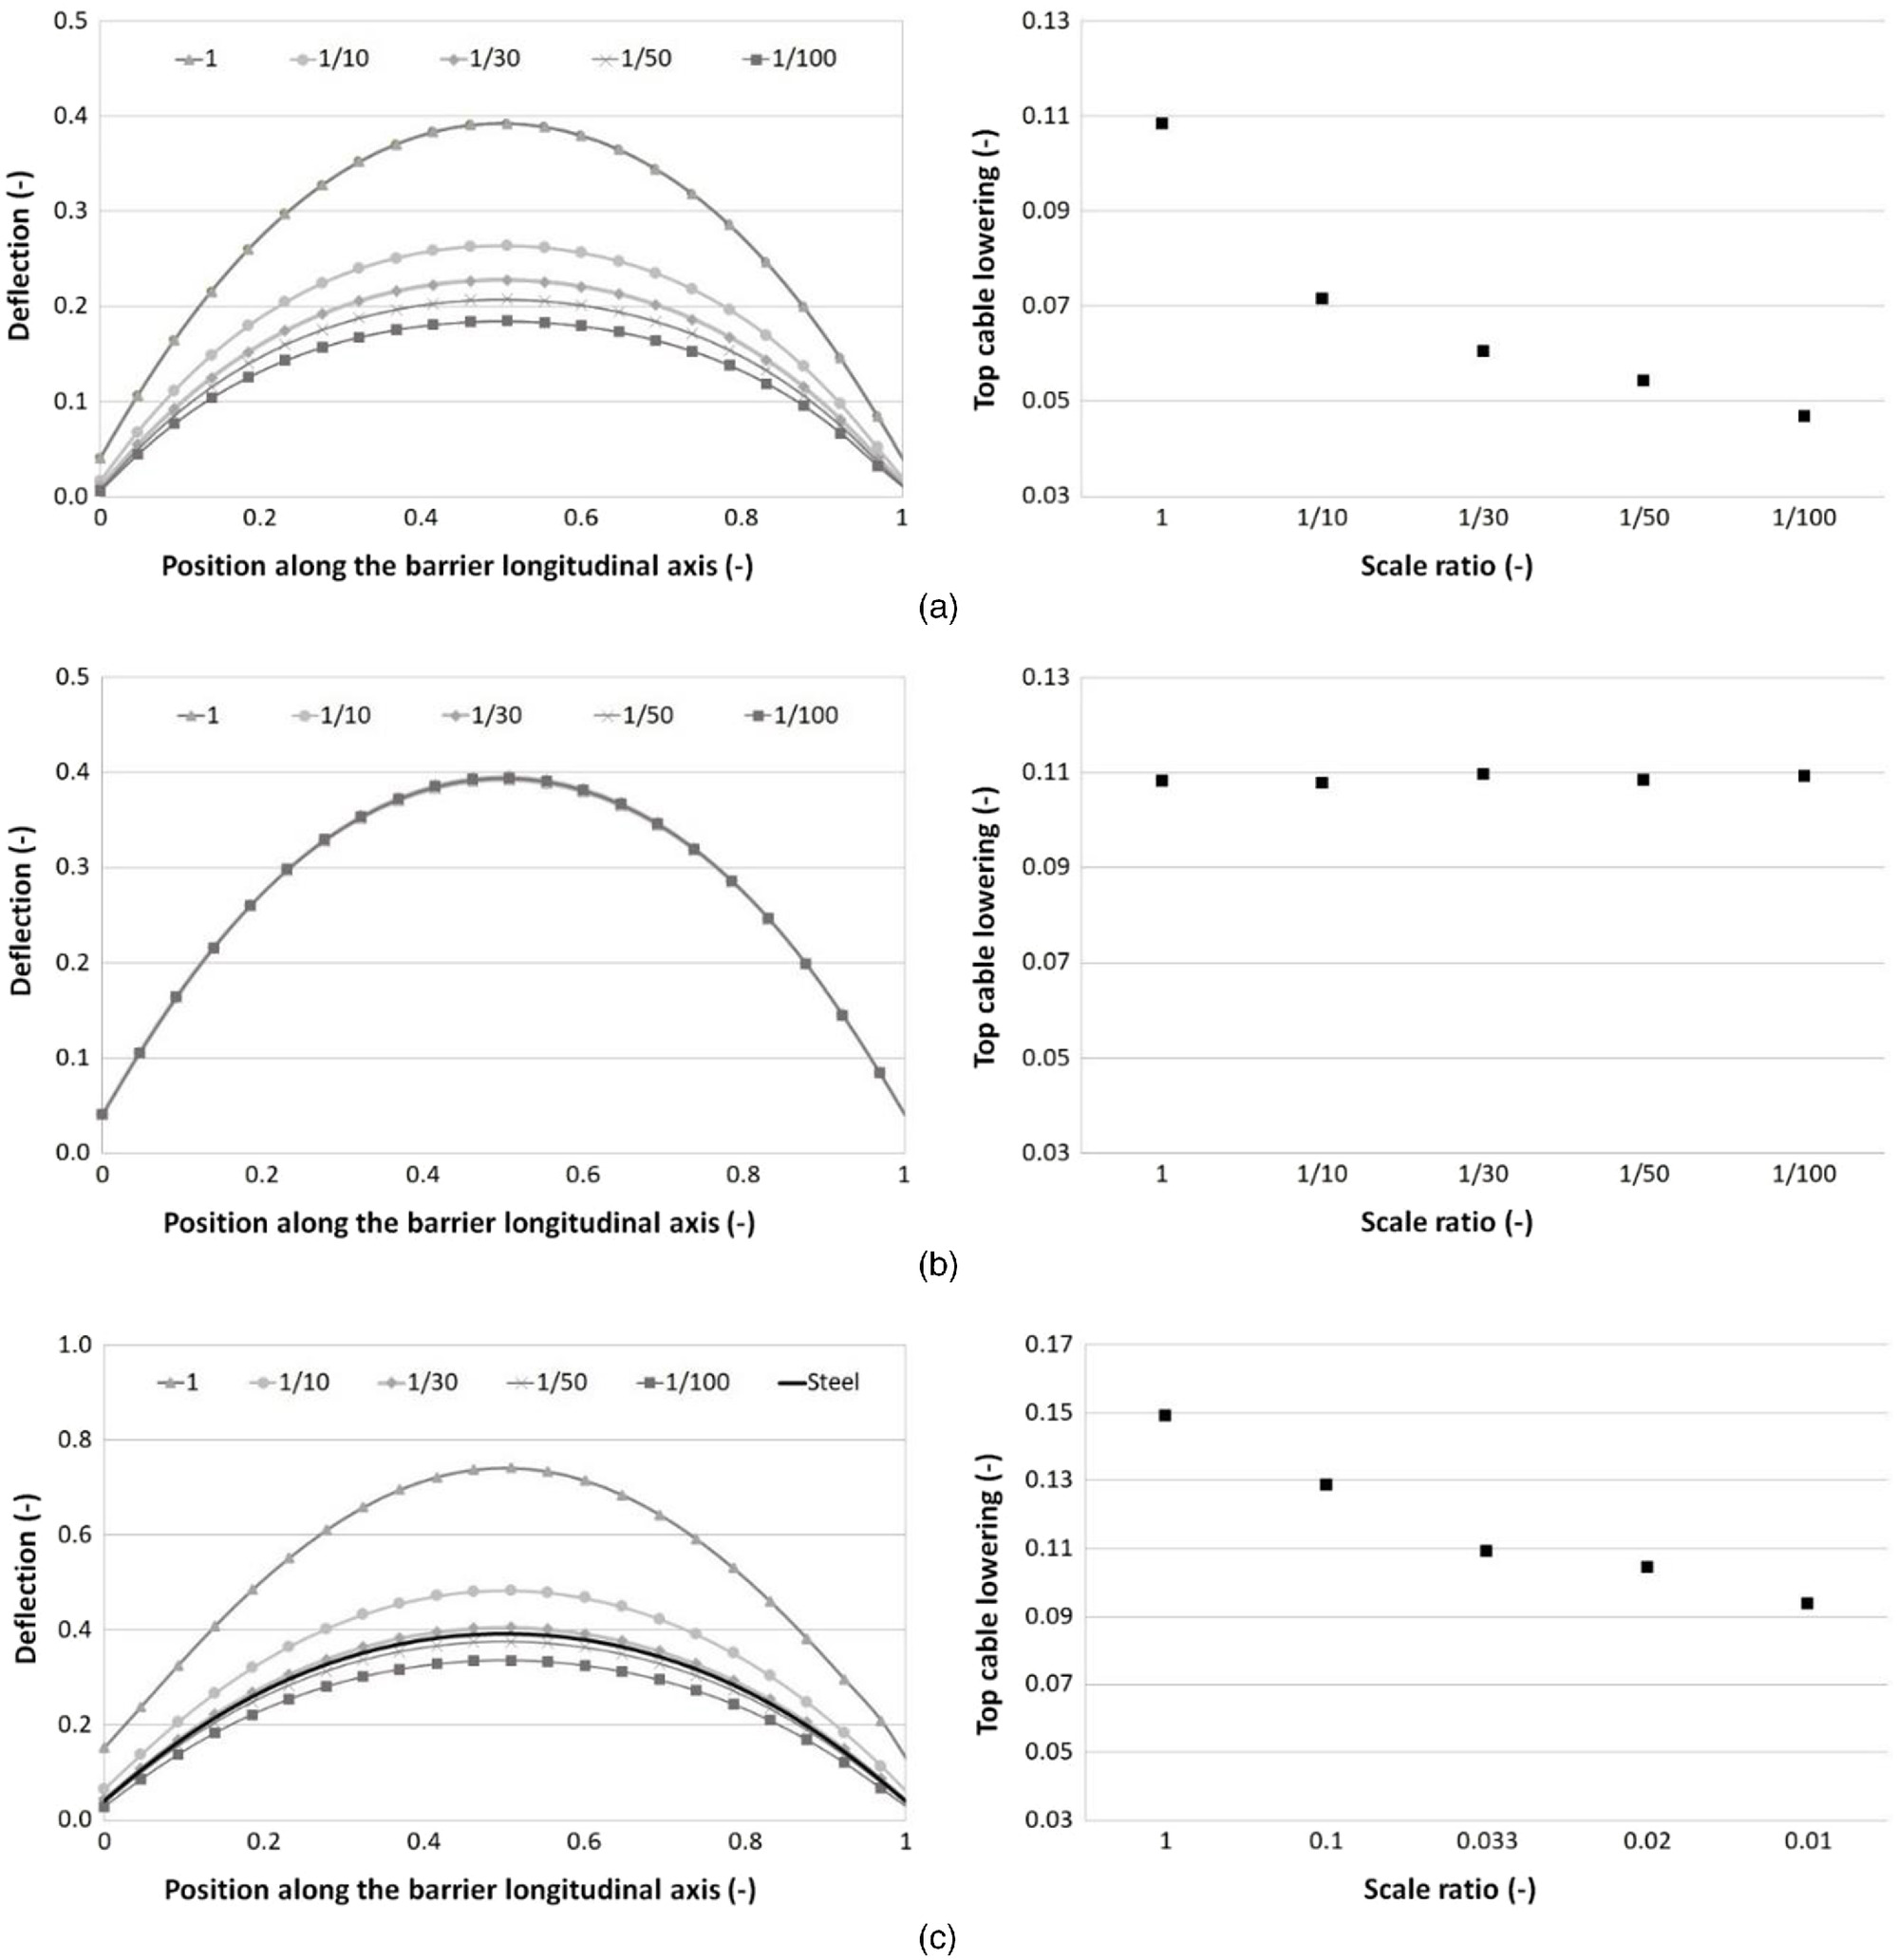
The simulation results are discussed in terms of barrier deflection and barrier lowering, which can be related to the barrier performance. The left panels of Fig. 2(a) show the displacement in the flow direction at the net mid-height (i.e., deflection) versus the initial position of the net element (node). Both of these values are normalized by the net width to facilitate comparisons between scales. The right panel of Fig. 2(a) shows the downward displacement (lowering) of the highest point in the net center, normalized by the barrier height.
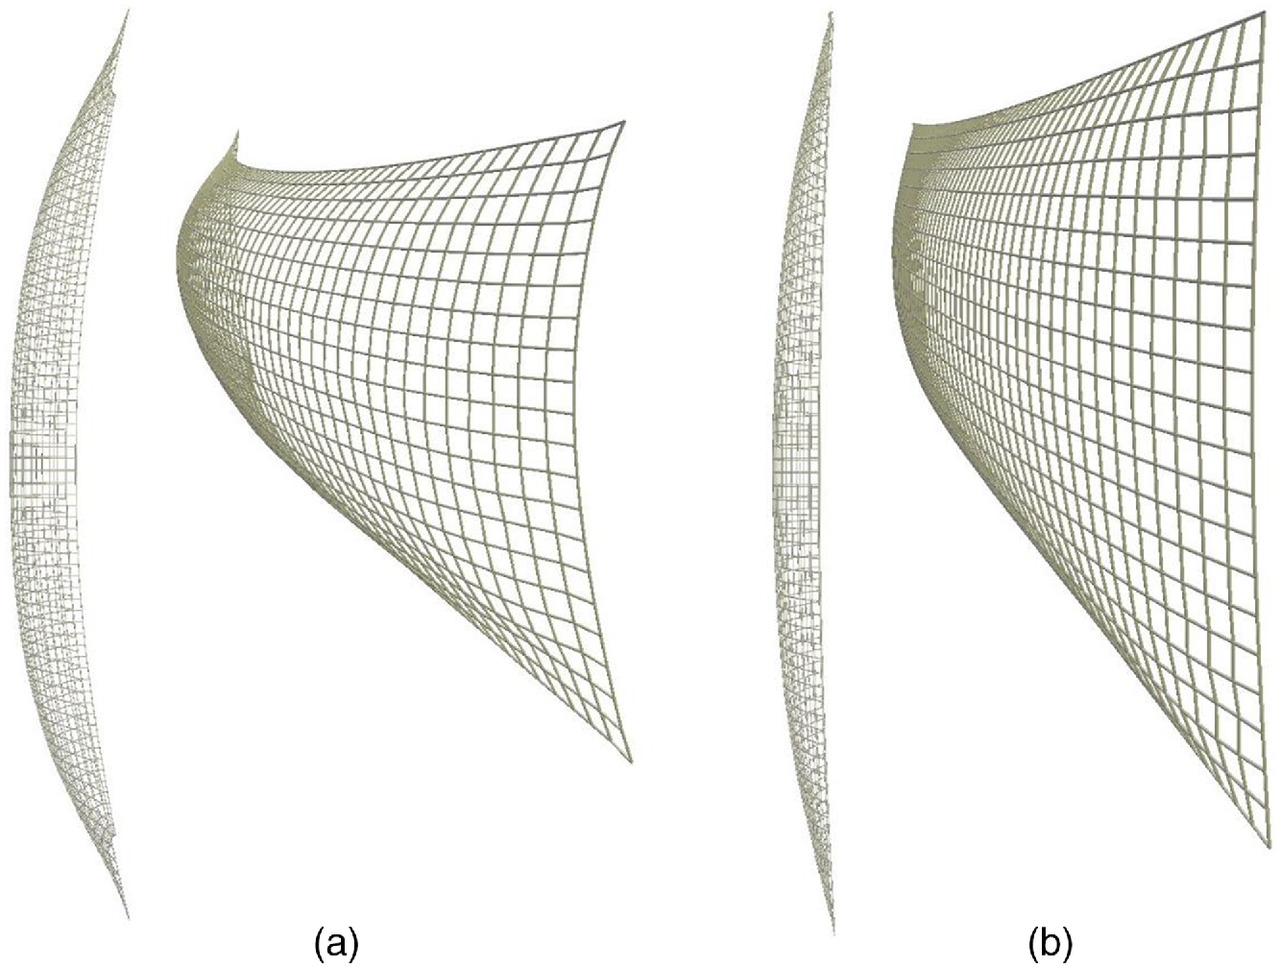
These two figures reveal differences in net deformation depending on the scale, as suggested in Figs. 1(a and b). The deflection of reduced scale barriers is much smaller than that of the real-scale barrier, with underestimations of 33%, 42%, 47%, and 53% for scales of 1/10, 1/30, 1/50, and 1/100, respectively. In parallel, the barrier lowering is underestimated by 34%, 44%, 50%, and 56% for the same scales. These high differences obviously result from an excessive modulus of the barriers at the reduced scales. The first consequence is that the barrier retention capacity will be erroneous if extrapolated from small scale experiments. Second, and more importantly, such barrier models offer an excessively rigid surface to the flow, altering the barrier-flow mechanical interaction, with consequences on both the flow dynamics and force transferred within the barrier (Song et al. 2019a; Kong et al. 2021).
These results confirm the need to consider barrier mechanical characteristics, for example based on variable , when designing reduced scale barriers to be used in flume experiments.
Approach Efficiency Assessment
The scaling approach previously proposed takes into consideration the modulus of the strands but does not account for the discontinuous and structured nature of the net, which is made from interconnected strands. This may constitute a limitation resulting in a shortage of the proposed approach in guaranteeing similarity when dealing with the response of a net exposed to an out-of-plane loading. The efficiency of the approach was assessed simulating the response of nets to the previously described hydrodynamic loading at various scales and considering the parameter values given in Table 2, all meeting the five similitude criteria. The simulation results reveal that the net deformation is the same at all scales in terms of both barrier deflection and lowering [Fig. 2(b), left and right, resp.]. This demonstrates that , the tensile characteristics of the strands forming the net, allows determining the modulus so that, in the end, the deformation of the reduced scale net exposed to an out-of-plane loading has similitude with the real scale one.
As an illustration, let’s consider a scale ratio for which Table 2 suggests a strand modulus of 3.3 GPa. Among the various operable polymers, polyethylene terephthalate glycol (PETG) appears to be a good candidate as it has a declared modulus of 2.59 GPa. The response of a net made from this polymer was modeled at different scales [Fig. 2(c)]. Not surprisingly, PETG at scale 1 leads to excessive deflection, 90% higher than that of the steel net. An excessive cable lowering is also observed. On the contrary, the ability of this material to reproduce the real net deformation is confirmed for , with a difference in deformation of less than 4%. A very similar conclusion is drawn from the cable lowering [right panel of Fig. 2(c)]. These results also suggest that PETG could be used for other values of . Indeed, for , the difference in maximum deflection with the expected value is 4%. Conversely, for , the net experiences excessive deformation, with a 24% difference compared to the real scale version. This means that 3D-printed barriers may be used in flume testing for a rather large range of scale with reasonable bias (here, this range is larger than ). Conversely, the results obtained in a given flume, of a given size, may be extrapolated to real-scale structures with dimensions that cover a wide range.
Design of a Reduced Scale Barrier
Barrier Description
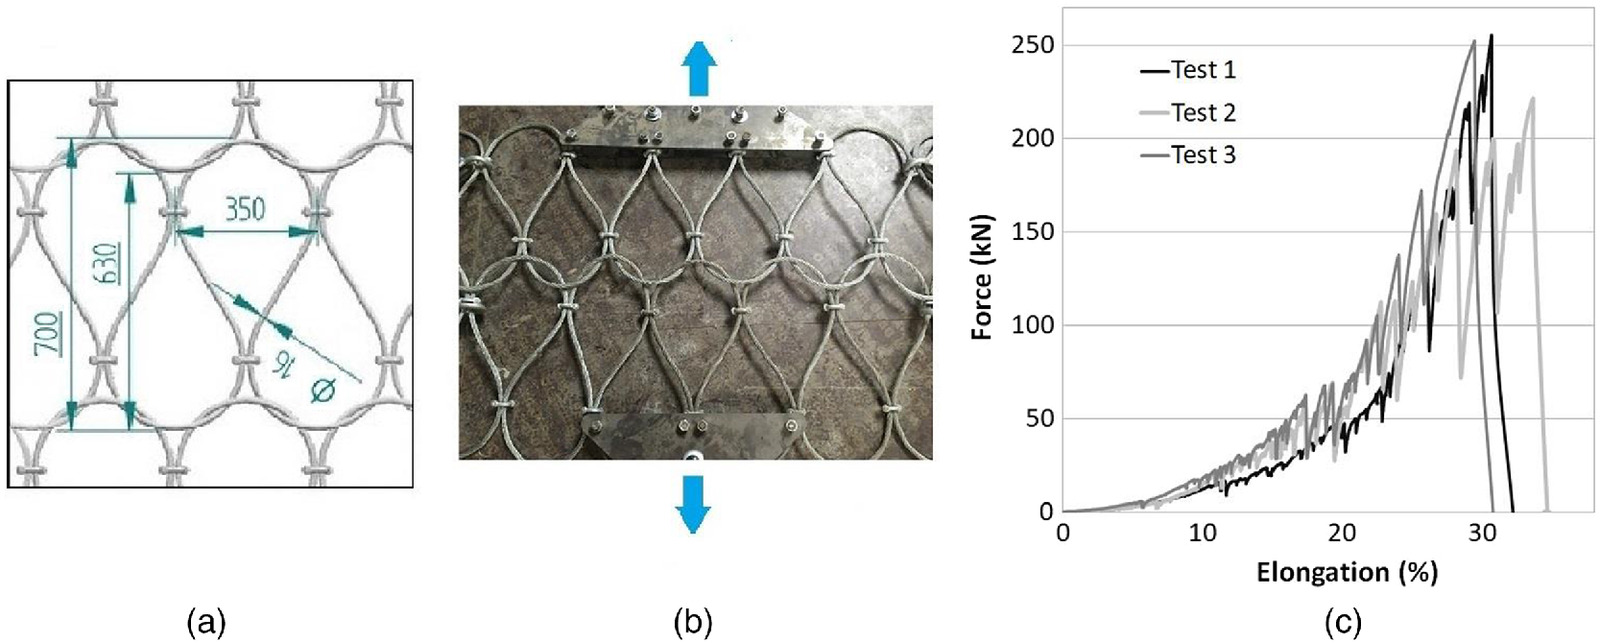
The considered real-scale barrier is 13.2 m long and 4 m high. The interception net is made from the repetition of a water-drop mesh, in dimensions [Fig. 3(a)]. This type of net was initially developed to be the interception structure in rockfall protection barriers (Bertrand et al. 2012). The detailed description of the net reveals that each mesh, created by a cable loop, is connected to adjoining ones through five contact points. Two of these contact points are sliding contacts. The three other contacts are connected by rigid clips. Sliding between the cables at these latter contact points occurs when the net experiences high loads, allowing the net to reach high strain. When the net is at rest, the strands between these contact points are curvilinear with variable bending radii. These features make this net much more complex than that considered in the previous section and than most of cable nets and ring nets widely used in flexible barriers.
The cables forming the mesh are 16 mm in diameter. The net was characterized by conducting tensile tests on a net panel 1.33 m in dimension in the loading direction while blocking the transverse displacement of the panel lateral sides. The loading was applied in the direction parallel to the longitudinal axis of the water drop-shaped mesh [Fig. 3(b)]. Similar to ring nets (Coulibaly et al. 2017), this type of net exhibits a bi-linear force-displacement response which is associated with the geometrical non-linearity resulting from the mesh shape [Fig. 3(c)]. During the first stage, up to 20% axial deformation, the curvilinear strands progressively turn linear, leading to a situation where the succession of cable strands from one contact point to the other is almost straight, i.e., the mesh elements take diamond shapes. This change leads to the second stage, where higher stiffness is observed (approximately compared to during the first stage). During this second stage, sliding at the contact points between strands occur, resulting in the sudden force drops observed on the curves.
The rectangular interception net is bordered by two horizontal cables and two lateral cables. The four cables are woven into the net to allow sliding and have their extremities connected to four anchors. The diameter and modulus of the main cables are 24 mm and 100 GPa, respectively.
This barrier design is rather simple compared to barriers installed in torrents in terms of shape, component number, and lay out. There is no intermediate horizontal cable. The rectangular shape is most relevant to flume experiments mainly but less so for real torrents. The barrier does not include brakes to avoid barrier crest lowering and sudden release of the trapped material.
Design of the Model Barrier: General Considerations
Designing a 1:40 (1: ) barrier model must address issues related to the realism of the barrier model, the similitude criteria, and the FDM technique. Scaling the barrier requires compromises between the various constraints, particularly for the net model.
Due to the difference in scaling complexity between the cable and the net, these two components are treated separately in the following. For each of these, the assumptions and simplifications made in the design process are mentioned.
Various combinations of manufacturing parameters and polymers (Table 1) were considered to converge towards the required mechanical characteristics for the cable on one side, and the net on the other. Based on the measurement of the components tensile characteristics, the data presented in the following result from this optimization process.
Main Cables Model
Considering parameters and and given the scale ratio of 40, the targeted values for the cable model section and modulus are and 2.5 GPa, respectively. The selection of the appropriate polymer was based on tensile tests performed on printed cable specimens. The modulus and failure stress of cables made from acrylonitrile styrene acrylate (ASA), PETG, and polylactic acid (PLA) were measured to be 1.27, 1.30, and 2.27 GPa and 34, 35, and 36 GPa, respectively. From these values, PLA appeared to be a good polymer candidate for the cables model. Nevertheless, FDM printing does not allow for the creation of such small diameter cables (0.6 mm) with controlled mechanical characteristics. As a compromise, the cable was produced from a polymer with a lower modulus while increasing the section to a printing-compatible value. PETG, with a measured modulus, , of 1.3 GPa was chosen. The cable section, , was determined to from where and .
As a circular section could not be printed for such a small section, the cables were given a rectangular cross-section, 0.9 mm in width and 0.6 mm in thickness, printed in four successive passes. Due to this difference in cable dimension, the criterion based on parameter is not strictly met, but the influences on the barrier permeability and drag force are considered negligible considering the number and position of these cables in the structure. Each cable extremity consists in an eyelet to attach the net to the flume extremity.
Net Model
The real net presented in Fig. 3 is extremely difficult to reproduce at a reduced scale using the FDM technique. This mainly results from the shape of the unit mesh and contact types of the strands. Even if FDM printing is highly versatile in creating complex shape objects, it seems necessary to simplify the net structure for 3D printing.
First, it is not achievable to manufacture a reduced scale net with sliding contacts between strands associated with two adjoining cable loops. Second, having parallel strands in the vicinity of the contact points could lead to early failures at these contact points. Also, creating curvilinear cable strands would significantly increase the printing time, with possible deleterious consequences on the mechanical characteristics of the strands.
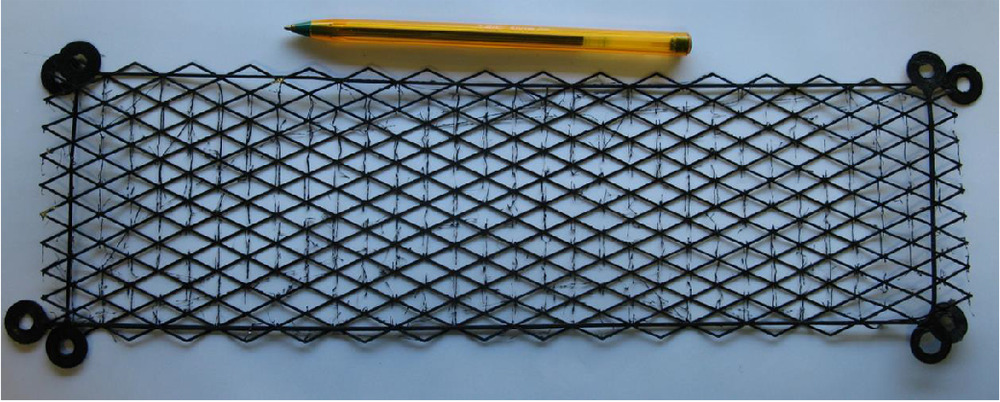
As a consequence, the net was simplified into a grid with a diamond-shape unit mesh, in dimensions (Fig. 4) coarsely reproducing the real net pattern once loaded. Contrary to the real net, all the strands are linear and all the strand connections are rigid, thus without sliding. The net was manufactured by three successive crossed passes. Due to the same constraints as those for main cables, the produced strands had a rectangular cross section, . Given its global dimensions and the dimensions of the strands, such a net is almost in geometrical similitude with the real scale.
The strategy in defining the best polymer out of the listed ones for manufacturing the net model consists of considering the whole net, and not the strands. This change in approach compared to that considered for the main cables is motivated by the complexity of the net pattern and the assumptions made in designing the net model. The similitude considered the net panel apparent stiffness per unit width, [(), i.e., dimensionally similar to a modulus]. is deduced from tensile test results on net panels with a width and an elongation (m)
(4)
Since it is dimensionally similar to a modulus, this value can be used as a similitude criterion, resulting in a ratio of between the real net stiffness, , to that of the model, , which results in (see the demonstration in the “Discussion” section)
(5)
During the first and second stages observed on the real net tensile test response, is approximately 250 and per meter of net, respectively, leading to values of approximately 6 and per meter of reduced scale net.
Uniaxial tensile tests performed on reduced scale net panels, 43 mm in the loading direction and using 23-mm wide clamps, revealed that PLA and thermoplastic polyurethan (TPU) were not appropriate as they led to a net stiffness greater than [Fig. 5(b)]. Other polymers presented in Table 1 were rejected due to their even higher modulus. The net made from thermoplastic elastomer (TPE), as well as that made from TPU, exhibited a non linear response, with a decrease in stiffness with increasing strain. The stiffness of the TPE net progressively diminished from approximately at low strain down to approximately above a 40% axial strain [Fig. 5(c)]. The concavity of this curve is oriented downward, while that of the real net panel is oriented upward (Fig. 3). This difference, in particular, comes from the simplification made for designing the net model. The net model cannot reproduce the evolution of the real mesh shape which results from the fact that, in the real net, the strands’ shapes transform from curvilinear to linear. The real net response at low elongation is governed by this key feature, which is not replicated with the small scale net.
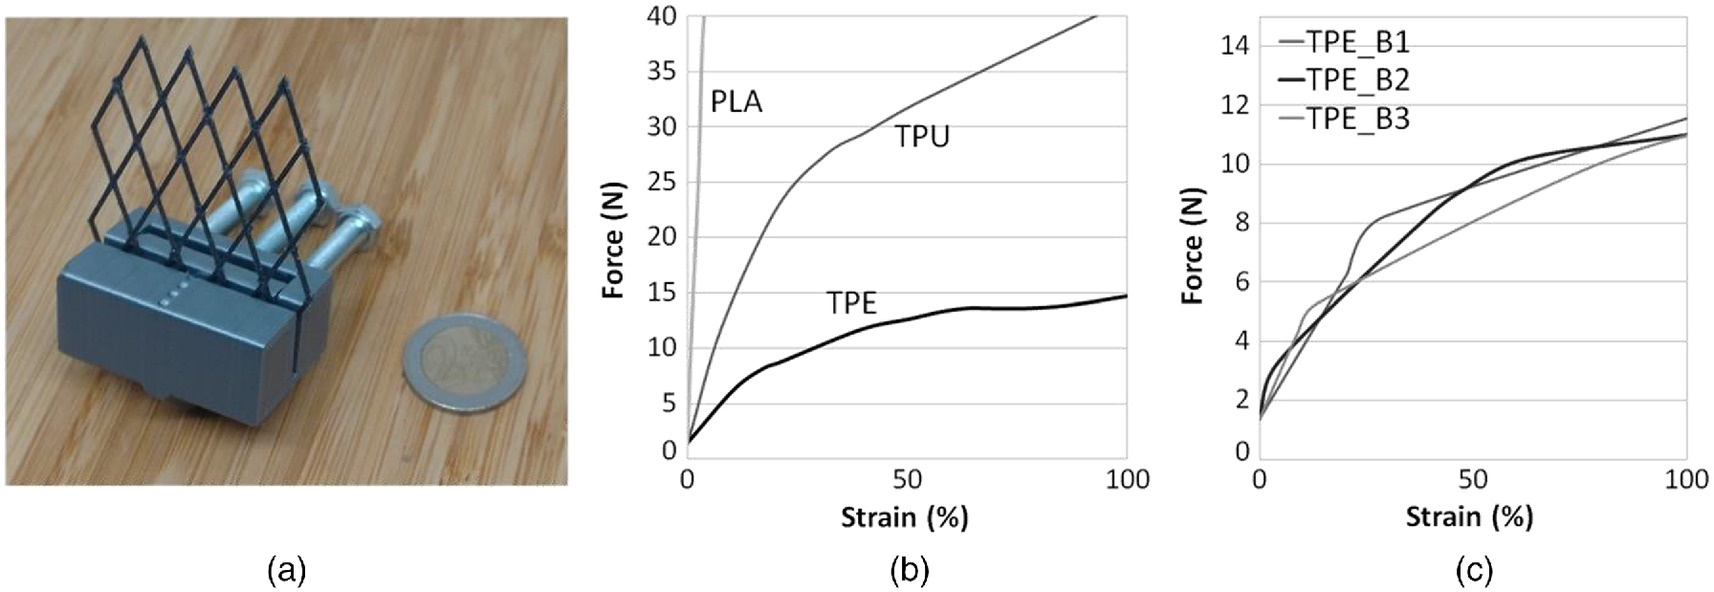
In spite of these differences, TPE was selected for printing reduced scale nets to be used in the flume experiments. TPE is a compromise accounting for the constraints related to the FDM technique and the various requirements derived from similitude. It permits the printing of nets with a stiffness in the expected range when considering a strain range relevant to the application case. The validation of this choice is addressed in the following section.
Barrier Model Assessment
The hydro-static loading response of the reduced scale barrier printed from TPE was compared to that obtained from DEM simulations considering the real-scale barrier presented in the “Barrier Description” section. The comparison is based on the barrier elongation along its lower and upper cables and at its mid-height. The same 3D-printed barrier was loaded twice. The results are presented in terms of relative elongation versus the ratio of water level to the barrier height, which defines the loading (Fig. 6). The continuous measurements presented in Fig. 6(a) reveal that the two tests exhibit very similar results. For a relative loading less than 50%, the barrier elongation remains negligible, with a maximum relative elongation less than 0.5% recorded at the lower cable. Then, the barrier elongation increases significantly. The highest increase in elongation is observed at the barrier mid-height, reaching a value of 10.5% for a 100% relative loading. In contrast, the elongation along the upper cable for this relative loading is .
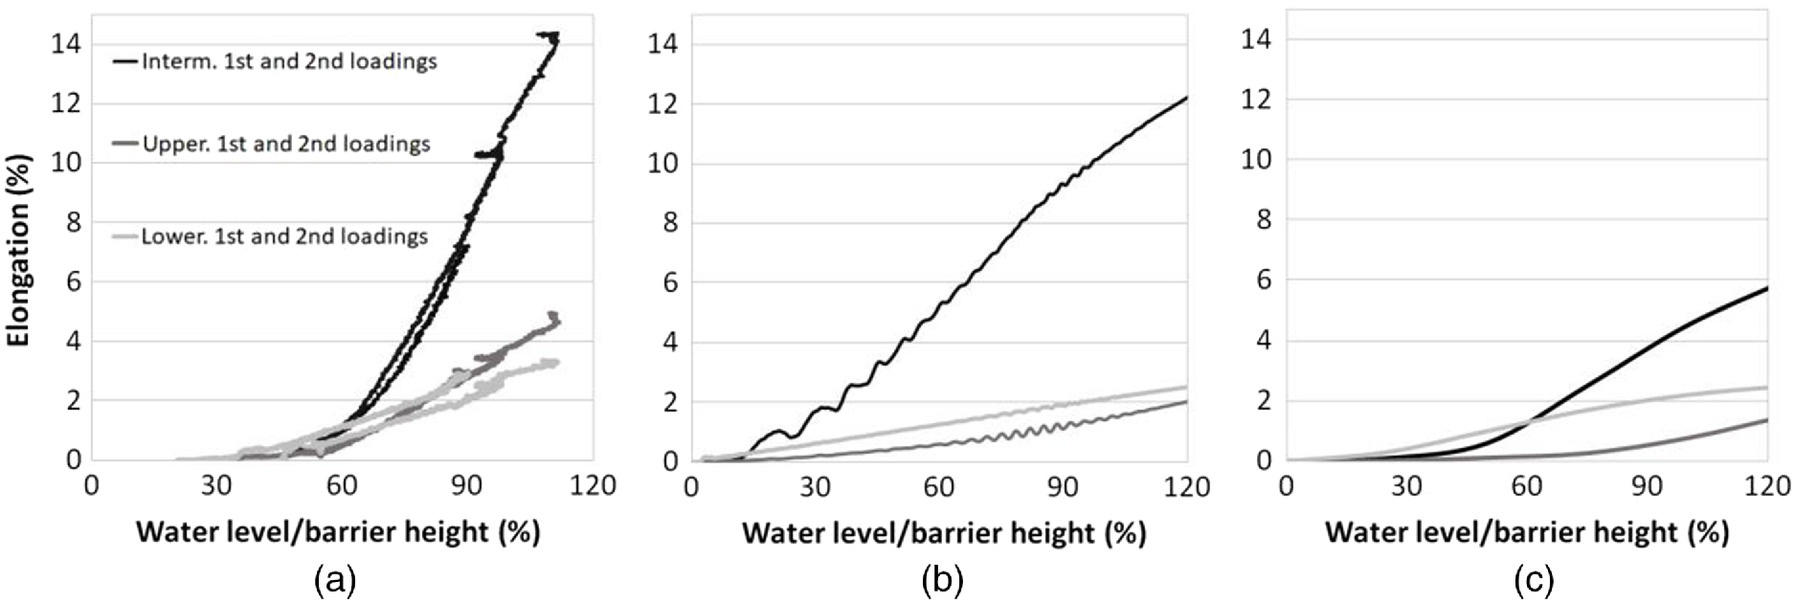
The DEM simulation at the real scale leads to similar global trends [Fig. 6(b)]. The elongation starts increasing after a given loading is reached, and the elongation at mid-height is much larger than along the upper and lower cables. Nevertheless, the elongation starts increasing for a smaller relative hydro-static loading (20%) compared to the experiments. Also, the difference in elongation between the cables and at the barrier mid-height is larger than during the experiments. Under 100% relative loading, the elongation at the barrier mid-height and along the upper and lower cables equal 10.3% and approximately 2%, respectively. These values globally match those measured on the printed barrier (10.5% and approximately 3.5%, respectively). For lower relative loads, the agreement is declines. The mid-height elongation was simulated to be 8% for the real barrier under a 80% relative loading, compared to 5% for the barrier model. The differences in terms of both curve shapes and values are attributed to the simplifications made when designing the small scale barrier, where shape mesh and low-elongation stiffness differ from that of the real barrier. To a lesser extent, this lower barrier elongation may also be attributed to the presence of the thin plastic film, even though it was folded. Nevertheless, this discrepancy is not critical for the application case where the main focus is placed on the 100% relative loading and slightly above, which is associated with barrier over-topping by the woody debris (Piton et al. 2022).
This comparison shows that, in spite of the simplifications made designing the net model and the difference in its stiffness with the required values, the 3D printed barrier model exhibits very similar deformation as that observed from DEM simulation of a real barrier exposed to hydro-static loading.
Barrier Deformation to Flows Loaded with Woody Debris
A 3D printed barrier manufactured according to the previously described design was installed at the flume extremity and exposed to a water flow loaded with woody debris as shown Fig. 7. The woody debris mainly consisted of large logs (Piton et al. 2022). The water discharge was increased stepwise from 2 to . The progressive barrier clogging led to the increase in water level upstream of the barrier. In parallel, a carpet of floating woody debris rapidly developed at the flow surface. Fig. 6(c) presents interpolated curves from measurements made at each water discharge step.
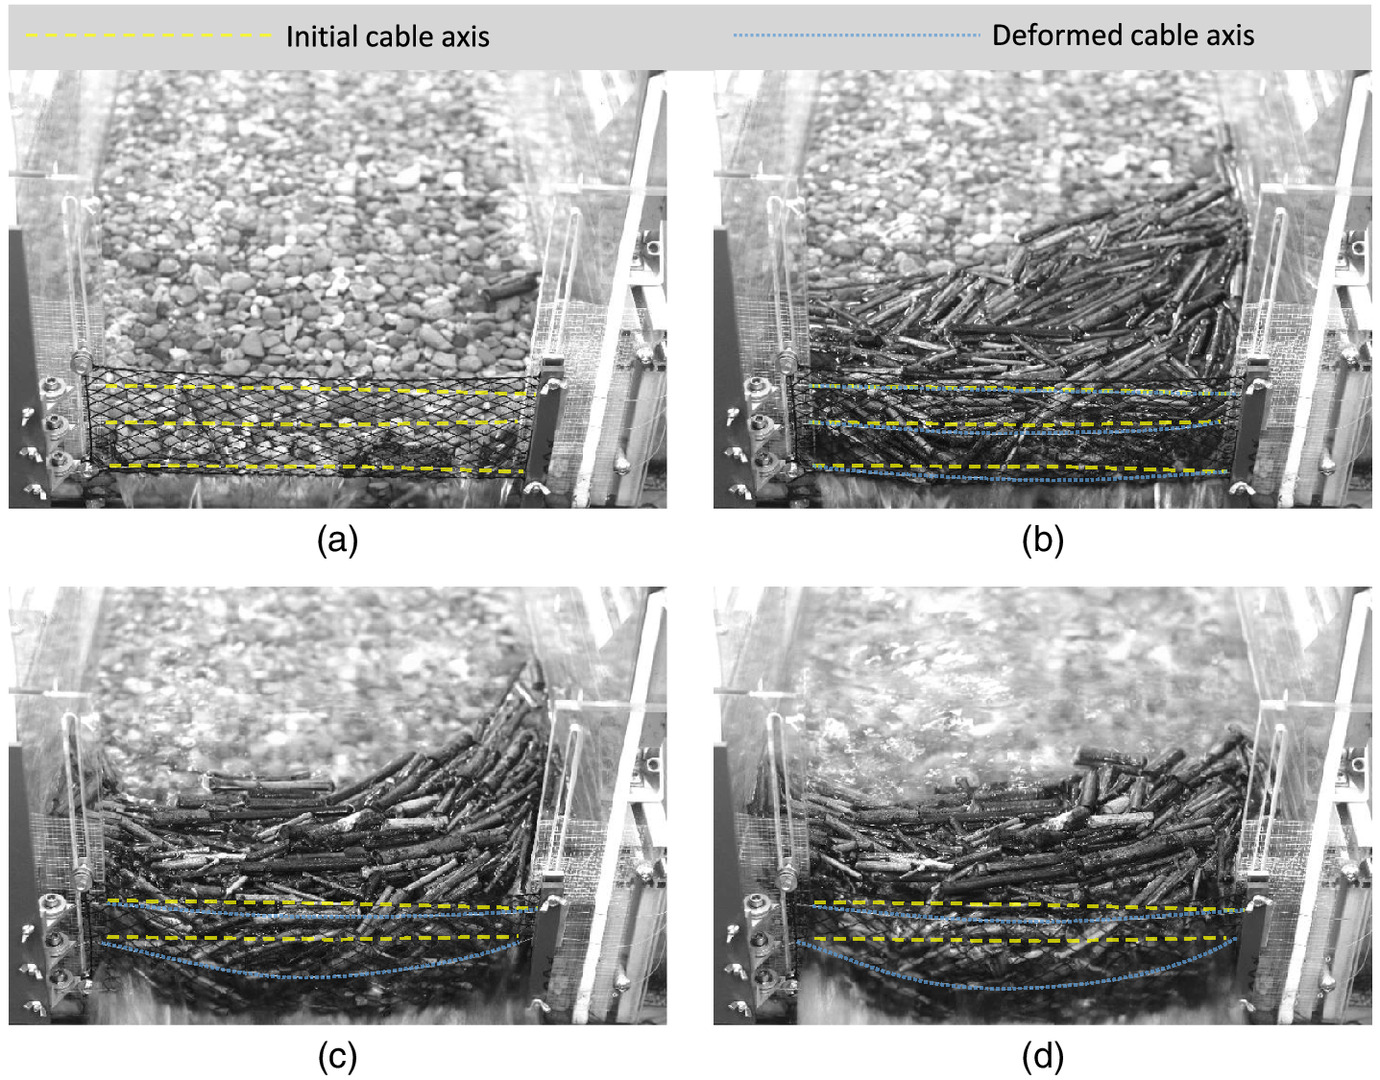
The barrier deformation globally shows similar trends as that observed in Fig. 6(a). The elongation at barrier mid-height significantly increases from a 50% relative loading and is much higher than along the upper and lower cables. The differences are related to the elongation amplitude and curve shapes. Notably, it can be seen that the elongation at the barrier mid-height reaches 6% compared to 10.5% during the hydrostatic loading test. The elongation along the upper and lower cables are also smaller. This difference is attributed to the hydrostatic loading which is associated with the assumption of a fully clogged barrier, while during the experiments water seeps through the logs and the barrier (Fig. 7). In spite of the difference in barrier deformation, these experiments suggest that assuming a load case of full hydro-static loading on a flexible barrier seems reasonable, though slightly conservative. Thus, this loading may be used in view of validating the reduced scale barrier for this application, which is also likely for other applications where high levels of barrier obstruction are expected. In addition, this difference in deformation may be considered as an indicator of the barrier obstruction, as discussed in the companion paper (Piton et al. 2022).
Discussion
Comments on the Proposed Similitude Criteria
We followed the classical approach of Buckingam to introduce the five dimensionless parameters to be used as similitude criteria. Another simpler approach may be considered to explain why structures experiencing tensile loads can be down-scaled using a reduction of their modulus by a factor .
Indeed, the criterion based on is met when the ratio of flow velocity between the model and reality equals (Heller 2011). Considering parameter , this leads to a ratio of between the modulus of the strand used in the model to that of the strand used in the real barrier when the same fluid is used at the two scales. This observation is in line with an analysis considering that the strand strain, , should be the same at the reduced scale to that at the real scalewhere the subscript refers to the scaled model, is the tensile force in the strand (N) and is the strand section (). In view of calculating the modulus of the strand at the reduced scale () and accounting for the similitude ratio between forces that are scaled by a similitude of (Heller 2011), this expression may be rearranged aswhich confirms the ratio between the strand modulus at the reduced scale to that at the real scale.
(6)
(7)
Limitation in This Approach Dealing with a Complex Mesh
The mesh of the studied barrier has a water-drop shape and is made from curved metallic cables. In addition, two out of the three contact points with adjacent unit meshes consist of sliding contacts. The difficulties associated with the 3D printing and down-scaling of this type of fence have been emphasized and resulted in some simplifications and assumptions.
The most important simplification concerns the printed net characteristics for achieving similarity. The choice of a diamond shape and TPE for printing the down-scaled barrier was a compromise between various constraints associated with the geometric similarity and the 3D printing technique. This choice could be questioned considering the differences between the targeted characteristics for the down-scaled net, under tensile loading, and the measured ones [Fig. 3(c) versus Fig. 5(b)]. The differences concern the force versus strain curve shape and, consequently, the stiffness evolution. In fact, the constraint associated with the net panel characteristics was relaxed based on a comparison between the tensile load test conditions and the loading experienced by meshes in the real net.
During the tensile test, the net panel is loaded in the longitudinal direction of the water-drop mesh while blocking the displacements in the transverse direction. In contrast, meshes in the real barrier globally experience an increase in dimension in their longitudinal direction (along the barrier width) coupled to a reduction in dimension in the transverse direction (along the barrier height). The latter phenomenon results from the net necking made possible by the upper and lower cables’ displacement. In addition, the mesh width-to-length ratio variation strongly depends on the mesh location in the real net, meaning that, at a given time, the meshes forming the net exhibit different conformations depending on their location. It results from this comparison that the loading experienced by the net panel during the tensile test may not be representative of the loading applied on the meshes in the real barrier. Based on this and considering the difference in mesh shape between the real net and the printed one, a deviation of the measured printed net characteristics with respect to the targeted ones was accepted during the small-scale net design process. The choice to consider a mesh printed from TPE and with a diamond shape was made considering the targeted range of stiffness over the strain range relevant to this application case. In the end, the rather good agreement between the small and real scale barriers under hydro-static loading confirmed the relevance of this choice, particularly for the 100% loading which is associated with barrier overflowing.
This issue is associated with the complexity of this type of mesh, which is possibly the most difficult to scale down and 3D print. It is true that other net types would pose much less problems, particularly those made from linear cables forming a mesh with a square, rectangular or diamond shape. In these cases, the use of 3D printing for creating flexible barriers to be used in flume experiments is expected to be simpler and even more efficient in achieving similitude.
Application to Other Types of Structures
Our approach accounts for the modulus of the structure elements to achieve mechanical similitude, not considering dissipating devices. Nevertheless, several other mechanical parameters are necessary to comprehensively model complex flow-structure interactions. Our simple approach makes sense only because supporting cables and net elements all experience loading mostly related to traction and their response can be considered as linear. Their deformation is thus driven by the tensile force and their tensile strength computed as the product of their cross sectional area times their modulus.
When studying structures made of beams subjected to bending deformation, additional mechanical parameters should be included and reaching full mechanical similitude becomes very complicated. However, the proposed approach of performing simple, multi-scale numerical simulations of the structural behavior is a relevant way to define which material and shape will reasonably behave at small scale as its prototype counterpart. In practice, the deformation of structures made of beams are usually neglected during small scale experiment and mechanical similitude of the structure is dismissed.
Conversely, flexible barriers are not the only structures used in rivers and waterways that primarily experience tensile loads: mooring line to fix boat and floaters, as well as debris boom, also called floating dam, intended to trap debris or chemicals floating on lakes, are also flexible hydraulic structures. We believe that the similitude criteria introduced in this paper and 3D printing technology would be relevant in achieving more rigorous small scale modelling of these structures.
Conclusion
In view of conducting flume experiments involving structures aimed at containing flow-driven solid materials, this article has proposed a method for designing small scale barriers having geometrical and mechanical similitude with real-scale ones. After demonstrating that the mechanical similitude was a key issue in reaching realistic barrier deformation during lab experiments, a similitude criterion (based on parameter ) has been proposed for determining the mechanical characteristics of small scale barriers. The relevance of this parameter has been assessed using a DEM model to simulate the deformation of a simple barrier exposed to an out-of-plane loading at different scales.
Then, a small scale model of a more complex barrier was 3D printed taking advantage of the variety in commercially available polymers for achieving similitude. Constraints associated with this technique when used for this purpose have been highlighted. In particular, the difficulty with the interception structure (the net) lies in the replication of mechanisms observed at the real scale. These concern the deformation of meshes with particular shapes or the sliding at the contact points between cable strands within the net. These mechanisms play a significant role in the net mechanical response but can hardly be reproduced with 3D printed nets. In such cases, this technique may fail in reaching a perfect net mechanical similitude.
In the end, the comparison of DEM simulation results with experimental measurements confirmed that 3D printing allows manufacturing barrier models with improved ability in mimicking the deformation of real-scale barriers when exposed to out-of-plane loading. The first results from flume tests where a printed barrier was exposed to water flows loaded with woody-debris were presented and discussed. The efficiency of flexible barriers in containing woody debris is further investigated in the companion paper, varying the logs’ characteristics (shape, length, volume), water discharge, barrier height, and slope inclination (Piton et al. 2022).
Notation
The following symbols are used in this paper:
- loading area attributed to a barrier node ();
- cable strand cross section area ();
- reduced scale cable strand cross section area ();
- mesh size (m);
- diameter of the cables forming the mesh (m);
- modulus describing the tensile response of a cable strand (kPa);
- modulus describing the tensile response of a reduced scale cable strand (kPa);
- tensile force applied on a strand (N);
- drag force applied on a node, in the DEM simulations (N);
- tensile force applied on a strand at the reduced scale (N);
- tensile force applied on a net panel (N);
- hydro-static load applied on a node (N);
- gravity acceleration ();
- water depth (m);
- barrier height (m);
- cable portion length, in the DEM simulations (m);
- flow velocity ();
- barrier width (m);
- mesh panel width (m);
- z
- position of a DEM node along the vertical axis (m);
- net panel elongation (m);
- net panel apparent stiffness per unit width ();
- scale ratio;
- with to 5 dimensionless parameters;
- density of the flow (); and
- water kinetic viscosity ().
Data Availability Statement
Some or all data, models, or code that support the findings of this study are available from the corresponding author upon reasonable request, especially the measurements reported in Figs. 3(c) and 5(b and c). The measurements used to draw Fig. 6(a) are available in a repository online in accordance with funder data retention policies: FilTor: Interaction between flexible barriers and flows (INRAE), https://data.inrae.fr/dataverse/filtor. Flexible barrier elongation measurement: https://doi.org/10.15454/CHHYIX.
Acknowledgments
The authors would like to thanks Firmin Fontaine, Hervé Bellot, Alexis Buffet, and Christian Eymond-Gris for their assistance and support in the preparation of the flume and measurement devices. This work was funded by the French Ministry of Environment (Direction Générale de la Prévention des Risques—Ministíre de la Transition Ecologique et Solidaire) within the multirisk agreement SRNH-IRSTEA 2019 (Action FILTOR). The authors are grateful to the two anonymous referees who provided precise and helpful comments on previous versions of this paper.
References
Albaba, A., S. Lambert, F. Kneib, B. Chareyre, and F. Nicot. 2017. “Dem modeling of a flexible barrier impacted by a dry granular flow.” Rock Mech. Rock Eng. 50 (11): 3029–3048. https://doi.org/10.1007/s00603-017-1286-z.
Ashwood, W., and O. Hungr. 2016. “Estimating total resisting force in flexible barrier impacted by a granular avalanche using physical and numerical modeling.” Can. Geotech. J. 53 (10): 1700–1717. https://doi.org/10.1139/cgj-2015-0481.
Barbero, M., F. Barpi, M. Borri-Brunetto, V. De Biagi, G. Olivero, and O. Pallara. 2014. “Snow pressure on a semiflexible retaining structure.” J. Cold Reg. Eng. 28 (2): 04014002. https://doi.org/10.1061/(ASCE)CR.1943-5495.0000065.
Bertrand, D., A. Trad, A. Limam, and C. Silvani. 2012. “Full-scale dynamic analysis of an innovative rockfall fence under impact using the discrete element method: From the local scale to the structure scale.” Rock Mech. Rock Eng. 45 (5): 885–900.
Brighenti, R., A. Segalini, and A. M. Ferrero. 2013. “Debris flow hazard mitigation: A simplified analytical model for the design of flexible barriers.” Comput. Geotech. 54 (Oct): 1–15. https://doi.org/10.1016/j.compgeo.2013.05.010.
Brighenti, R., L. Spaggiari, A. Segalini, R. Savi, and G. Capparelli. 2021. “Debris flow impact on a flexible barrier: Laboratory flume experiments and force-based mechanical model validation.” Nat. Hazard. 106 (1): 735–756. https://doi.org/10.1007/s11069-020-04489-5.
Canelli, L., A. M. Ferrero, M. Migliazza, and A. Segalini. 2012. “Debris flow risk mitigation by the means of rigid and flexible barriers—Experimental tests and impact analysis.” Nat. Hazards Earth Syst. Sci. 12 (5): 1693–1699. https://doi.org/10.5194/nhess-12-1693-2012.
Coulibaly, J. B., M.-A. Chanut, S. Lambert, and F. Nicot. 2017. “Nonlinear discrete mechanical model of steel rings.” J. Eng. Mech. 143 (9): 04017087. https://doi.org/10.1061/(ASCE)EM.1943-7889.0001303.
Coulibaly, J.-B., M.-A. Chanut, S. Lambert, and F. Nicot. 2018. “Sliding cable modeling: An attempt at a unified formulation.” Int. J. Solids Struct. 130–131 (Jan): 1–10. https://doi.org/10.1016/j.ijsolstr.2017.10.025.
Dugelas, L. 2020. “Stratégies probabilistes appliquées à la modélisation numérique discrète: Le cas des filets pare-pierres.” Ph.D. thesis, Dept. of Mechanical Engineering, Univ. Grenoble Alpes.
Dugelas, L., J. B. Coulibaly, F. Bourrier, S. Lambert, M.-A. Chanut, I. Olmedo, and F. Nicot. 2019. “Assessment of the predictive capabilities of discrete element models for flexible rockfall barriers.” Int. J. Impact Eng. 133 (Nov): 103365. https://doi.org/10.1016/j.ijimpeng.2019.103365.
Heller, V. 2011. “Scale effects in physical hydraulic engineering models.” J. Hydraul. Res. 49 (3): 293–306. https://doi.org/10.1080/00221686.2011.578914.
Jiang, R., W. P. Fei, H. W. Zhou, M. Huo, J. W. Zhou, J. M. Wang, and J. J. Wu. 2020. “Experimental and numerical study on the load and deformation mechanism of a flexible net barrier under debris flow impact.” Bull. Eng. Geol. Environ. 79 (5): 2213–2233. https://doi.org/10.1007/s10064-019-01692-y.
Joulié, R. 1998. Mécanique des Fuides Appliquée. Paris: Ellipses.
Kong, Y., X. Li, and J. Zhao. 2021. “Quantifying the transition of impact mechanisms of geophysical flows against flexible barrier.” Eng. Geol. 289 (Aug): 106188. https://doi.org/10.1016/j.enggeo.2021.106188.
Lambert, S., D. Toe, A. Mentani, and F. Bourrier. 2020. “A meta-model-based procedure for quantifying the on-site efficiency of rockfall barriers.” Rock Mech. Rock Eng. 54 (2): 487–500. https://doi.org/10.1007/s00603-020-02298-7.
Leonardi, A., F. K. Wittel, M. Mendoza, R. Vetter, and H. J. Herrmann. 2016. “Particle-fluid-structure interaction for debris flow impact on flexible barriers: Debris flow impact on flexible barriers.” Comput.-Aided Civ. Infrastruct. Eng. 31 (5): 323–333. https://doi.org/10.1111/mice.12165.
Li, X., J. Zhao, and J. S. H. Kwan. 2020. “Assessing debris flow impact on flexible ring net barrier: A coupled CFD-DEM study.” Comput. Geotech. 128 (14): 1643–1670. https://doi.org/10.1016/j.compgeo.2020.103850.
MatWeb. 2021. “Material property data.” Accessed April 9, 2021. http://www.matweb.com/.
Mentani, A., A. Giacomini, O. Buzzi, L. Govoni, G. Gottardi, and S. Fityus. 2016. “Numerical modelling of a low-energy rockfall barrier: New insight into the bullet effect.” Rock Mech. Rock Eng. 49 (4): 1247–1262. https://doi.org/10.1007/s00603-015-0803-1.
Ng, C. W. W., D. Song, C. E. Choi, R. C. H. Koo, and J. S. H. Kwan. 2016. “A novel flexible barrier for landslide impact in centrifuge.” Géotech. Lett. 6 (3): 221–225. https://doi.org/10.1680/jgele.16.00048.
Ng, C. W. W., D. Song, C. E. Choi, L. H. D. Liu, J. S. H. Kwan, R. C. H. Koo, and W. K. Pun. 2017. “Impact mechanisms of granular and viscous flows on rigid and flexible barriers.” Can. Geotech. J. 54 (2): 188–206. https://doi.org/10.1139/cgj-2016-0128.
Nicot, F., M. Gay, and J.-M. Tacnet. 2002. “Interaction between a snow mantel and a flexible structure: A new method to design avalanche nets.” Cold Reg. Sci. Technol. 34 (2): 67–84. https://doi.org/10.1016/S0165-232X(01)00052-0.
Piton, G., A. R. Ceron-Mayer, and S. Lambert. 2022. “Small-scale modeling of flexible barriers. II: Interactions with large wood.” J. Hydraul. Eng. 149 (3): 04022044. https://doi.org/10.1061/JHEND8.HYENG-13071.
Piton, G., T. Horigushi, L. Marchal, and S. Lambert. 2020. “Open check dams and large wood: Head losses and release conditions.” Nat. Hazards Earth Syst. Sci. 20 (12): 3293–3314. https://doi.org/10.5194/nhess-20-3293-2020.
Piton, G., and A. Recking. 2019. “Steep bedload-laden flows: Near critical?” J. Geophys. Res. Earth Surf. 124 (8): 2160–2175. https://doi.org/10.1029/2019JF005021.
Pol, A., and F. Gabrieli. 2021. “Discrete element simulation of wire-mesh retaining systems: An insight into the mechanical behavior.” Comput. Geotech. 134 (Jun): 104076. https://doi.org/10.1016/j.compgeo.2021.104076.
Šmilauer, V., et al. 2015. “Using and programming.” In YADE Documentation. 2nd ed. Burkina Faso: The YADE Project.
Song, D., G. D. Zhou, C. E. Choi, and Y. Zheng. 2019a. “Debris flow impact on flexible barrier: Effects of debris-barrier stiffness and flow aspect ratio.” J. Mountain Sci. 16 (7): 1629–1645. https://doi.org/10.1007/s11629-018-5314-6.
Song, D., G. G. D. Zhou, M. Xu, C. E. Choi, S. Li, and Y. Zheng. 2019b. “Quantitative analysis of debris-flow flexible barrier capacity from momentum and energy perspectives.” Eng. Geol. 251 (Mar): 81–92. https://doi.org/10.1016/j.enggeo.2019.02.010.
Tan, D. Y., J. H. Yin, W. Q. Feng, J. Q. Qin, and Z. H. Zhu. 2018. “Large-scale physical modelling study of a flexible barrier under the impact of granular flows.” Nat. Hazards Earth Syst. Sci. 18 (10): 2625–2640. https://doi.org/10.5194/nhess-18-2625-2018.
Tan, D. Y., J. H. Yin, J. Q. Qin, Z. H. Zhu, and W. Feng. 2020. “Experimental study on impact and deposition behaviours of multiple surges of channelized debris flow on a flexible barrier.” Landslides 17 (7): 1577–1589. https://doi.org/10.1007/s10346-020-01378-7.
Thoeni, K., C. Lambert, A. Giacomini, and S. W. Sloan. 2013. “Discrete modelling of hexagonal wire meshes with a stochastically distorted contact model.” Comput. Geotech. 49 (Apr): 158–169. https://doi.org/10.1016/j.compgeo.2012.10.014.
Vagnon, F., A. M. Ferrero, G. Umili, and A. Segalini. 2017. “A factor strength approach for the design of rock fall and debris flow barriers.” Geotech. Geol. Eng. 35 (6): 2663–2675. https://doi.org/10.1007/s10706-017-0269-x.
Volkwein, A. 2004. “Numerische simulation von flexiblen steinschlagschutzsystemen.” Ph.D. thesis, Eidgenössische Technische Hochschule, Swiss Federal Inst. of Technology.
Volkwein, A., C. Wendeler, and G. Guasti. 2011. “Design of flexible debris flow barriers.” In Proc., 5th Int. Conf. on Debris-Flow Hazards Mitigation: Mechanics, Prediction and Assessment, 1093–1100. Padova, Italy: Univ. of Padova.
Warnung, L., S.-J. Estermann, and A. Reisinger. 2018. “Mechanical properties of fused deposition modeling (FDM) 3d printing materials.” RTejournal Fachforum für Rapid Technologien 2018 (1).
Wendeler, C. 2008. “Murgangrückhalt in wildbächen—grundlagen zu planung und berechnung von flexiblen barrieren.” Ph.D. thesis, Eidgenössische Technische Hochschule, ETH Zurich.
Wendeler, C., and A. Volkwein. 2015. “Laboratory tests for the optimization of mesh size for flexible debris-flow barriers.” Nat. Hazards Earth Syst. Sci. 15 (12): 2597–2604. https://doi.org/10.5194/nhess-15-2597-2015.
Wendeler, C., A. Volkwein, B. W. McArdell, and P. Bartelt. 2019. “Load model for designing flexible steel barriers for debris flow mitigation.” Can. Geotech. J. 56 (6): 893–910. https://doi.org/10.1139/cgj-2016-0157.
Xu, C., D. D. Tannant, W. Zheng, and K. Liu. 2020. “Discrete element method and support vector machine applied to the analysis of steel mesh pinned by rockbolts.” Int. J. Rock Mech. Min. Sci. 125 (Jan): 104163. https://doi.org/10.1016/j.ijrmms.2019.104163.
Yu, H., J. Xiaoyan, and J. Junji. 2022. “Effects of barrier stiffness on debris flow dynamic impact. I: Laboratory flume test.” Water 14 (2): 177. https://doi.org/10.3390/w14020177.
Information & Authors
Information
Published In

Journal of Hydraulic Engineering
Volume 149 • Issue 3 • March 2023
Copyright
This work is made available under the terms of the Creative Commons Attribution 4.0 International license, https://creativecommons.org/licenses/by/4.0/.
History
Received: Sep 14, 2021
Accepted: Oct 15, 2022
Published online: Dec 27, 2022
Published in print: Mar 1, 2023
Discussion open until: May 27, 2023
Authors
Metrics & Citations
Metrics
Citations
Download citation
If you have the appropriate software installed, you can download article citation data to the citation manager of your choice. Simply select your manager software from the list below and click Download.
Cited by
- Deep Roy, Michele Palermo, Simone Pagliara, Control of Surface Plastic Transport in Natural Streams, Journal of Hydraulic Engineering, 10.1061/JHEND8.HYENG-13832, 150, 4, (2024).
- Guillaume Piton, Ana Rocio Ceron-Mayo, Stéphane Lambert, Small-Scale Modeling of Flexible Barriers. II: Interactions with Large Wood, Journal of Hydraulic Engineering, 10.1061/JHEND8.HYENG-13071, 149, 3, (2022).