Permanent Sheet Pile Wall in Soft Sensitive Clay
This article has been corrected.
VIEW CORRECTIONPublication: Journal of Geotechnical and Geoenvironmental Engineering
Volume 149, Issue 6
Abstract
Reports on the serviceability stage and long-term performance of embedded retaining structures are scarce, even more so in areas with background settlements. This paper presents a case study of an excavation with a permanent sheet pile wall in soft sensitive clay in Uppsala, Sweden. The monitoring data span the short-term and four years of the serviceability stage. The monitoring data are compared with finite element analyses using the rate-dependent Creep-SClay1S model. A historic groundwater drawdown is accounted for in the modeling and challenges with respect to the proper initialization of the in situ stress state, preconsolidation pressure, fabric, and bonding are discussed. The results show that even though the background settlements are somewhat underpredicted, the horizontal displacements as well as anchor forces were captured rather accurately. This valuable case study of the short- and long-term behavior of a permanent sheet pile wall in soft sensitive clay confirms the performance of using this cost-effective solution for a permanent construction. Furthermore, the paper highlights the challenges of an accurate description and modeling of the initial in situ state.
Introduction
When constructing underground structures in areas of soft sensitive clay with ongoing creep settlements, it is important to estimate displacements, differential settlements, as well as the magnitudes of actions, such as earth pressures, during the construction as well as the serviceability stage including the long-term performance. For accurate predictions of the serviceability stage and long-term performance of underground structures in such areas, it is important to consider (among other characteristic features) the rate-dependent behavior of soft clays, including the background creep deformations. Accurate predictions are necessary to ensure appropriate levels of safety as well as to aid optimization of construction materials, thus contributing to sustainable construction via optimal (ideally reduced) carbon footprints.
The simulation of the response of excavations and underground structures in soft sensitive clays with ongoing background creep settlements requires constitutive models that incorporate the relevant soil features. In addition to the viscous behavior of clay (rate-dependency), this includes factors such as the initial and evolving anisotropy and destructuration. An example of such soil models, Creep-SClay1S (Sivasithamparam et al. 2015; Gras et al. 2018), was recently benchmarked against the response of a well instrumented excavation (Göta Tunnel) in soft sensitive Swedish clay (Tornborg et al. 2021). However, in the case of the Göta Tunnel, the measurements of displacements and earth pressures were discontinued at the end of the construction, and thus there were no long-term measurements available. This is not unusual, as to our knowledge, semi-empirical methods for the design of sheet pile walls (SPWs) and retaining structures in general mostly stem from observations of short-term performance DURING the construction phase (e.g., Peck 1969; Bjerrum et al. 1972; Stille 1976; Clough and Reed 1984; Finno et al. 1989). In contrast, observations of long-term performance (e.g., Carder and Darley 1998; Carder et al. 1999; Richards et al. 2007; Tan and Paikowsky 2008; O’Leary et al. 2016) are generally scarce, especially concerning sheet pile walls in soft sensitive clays.
Modeling of excavations by means of finite element (FE) analyses takes complex soil behavior into account in soil–structure interaction problems. As such, numerous FE-studies of excavation problems (case studies as well as generalization studies) have contributed to the current body of knowledge (e.g., Hashash and Whittle 1996, 2002; Ukritchon et al. 2003; Karlsrud and Andresen 2005; Zdravkovic et al. 2005; Finno and Calvello 2005; Osman and Bolton 2006; Finno et al. 2007; Scharinger et al. 2009; Whittle et al. 2015; Dong et al. 2016; Rouainia et al. 2017; Summersgill et al. 2018; Bertoldo and Callisto 2019; Xiao et al. 2019; Ignat et al. 2020). An important aspect of FE-studies is an accurate description and modeling of the initial in situ stress state. This was pointed out already by Potts and Fourie (1984) who exemplified that whereas the required length of sheet pile walls may not be significantly affected by the initial stress state, the earth pressures acting on the structure might be. The importance of correct initial stresses for effective stress based models was also emphasized by e.g., Corral and Whittle (2010) in the use of the MIT-E3 model and by Zhou et al. (2005) considering a rate-dependent model.
Recently, a sheet pile wall was adopted as part of the temporary, as well as the permanent, construction works for a new double railway track in Uppsala, Sweden. The sheet pile wall was installed in soft sensitive clay and, due to the vicinity to the planned railway track, monitoring of displacements and anchor forces were conducted during the construction period (2015–2017), as well as during the service life (available for 2017–2021, measurements are ongoing). The case is considered as a valuable example of the long-term performance of a sheet pile wall in soft sensitive clay. What makes the case most challenging is the stress history and ongoing background settlements. The stress history of the clay layers at Uppsala includes the effects of a groundwater drawdown, caused by pumping in the aquifer below the clay layers. In order to model the background settlements, the use of a rate-dependent model is desirable.
This paper highlights the challenges in modeling the initial conditions (before construction) in an area of soft sensitive clay with historic anthropogenic loading caused by decades of groundwater drawdown in the studied case. To make the most of the sheet pile wall monitoring data, the aim of the paper is to present the case study and compare the measured response to that of finite element analyses using the rate-dependent Creep-SClay1S model (Sivasithamparam et al. 2015; Gras et al. 2018). An objective is to present and discuss the challenges in modeling the evolution of stresses and state parameters from the initial stage (before groundwater drawdown) to the stage prior to construction.
Site Description and Soil Characterization
Project Location and Construction Activities
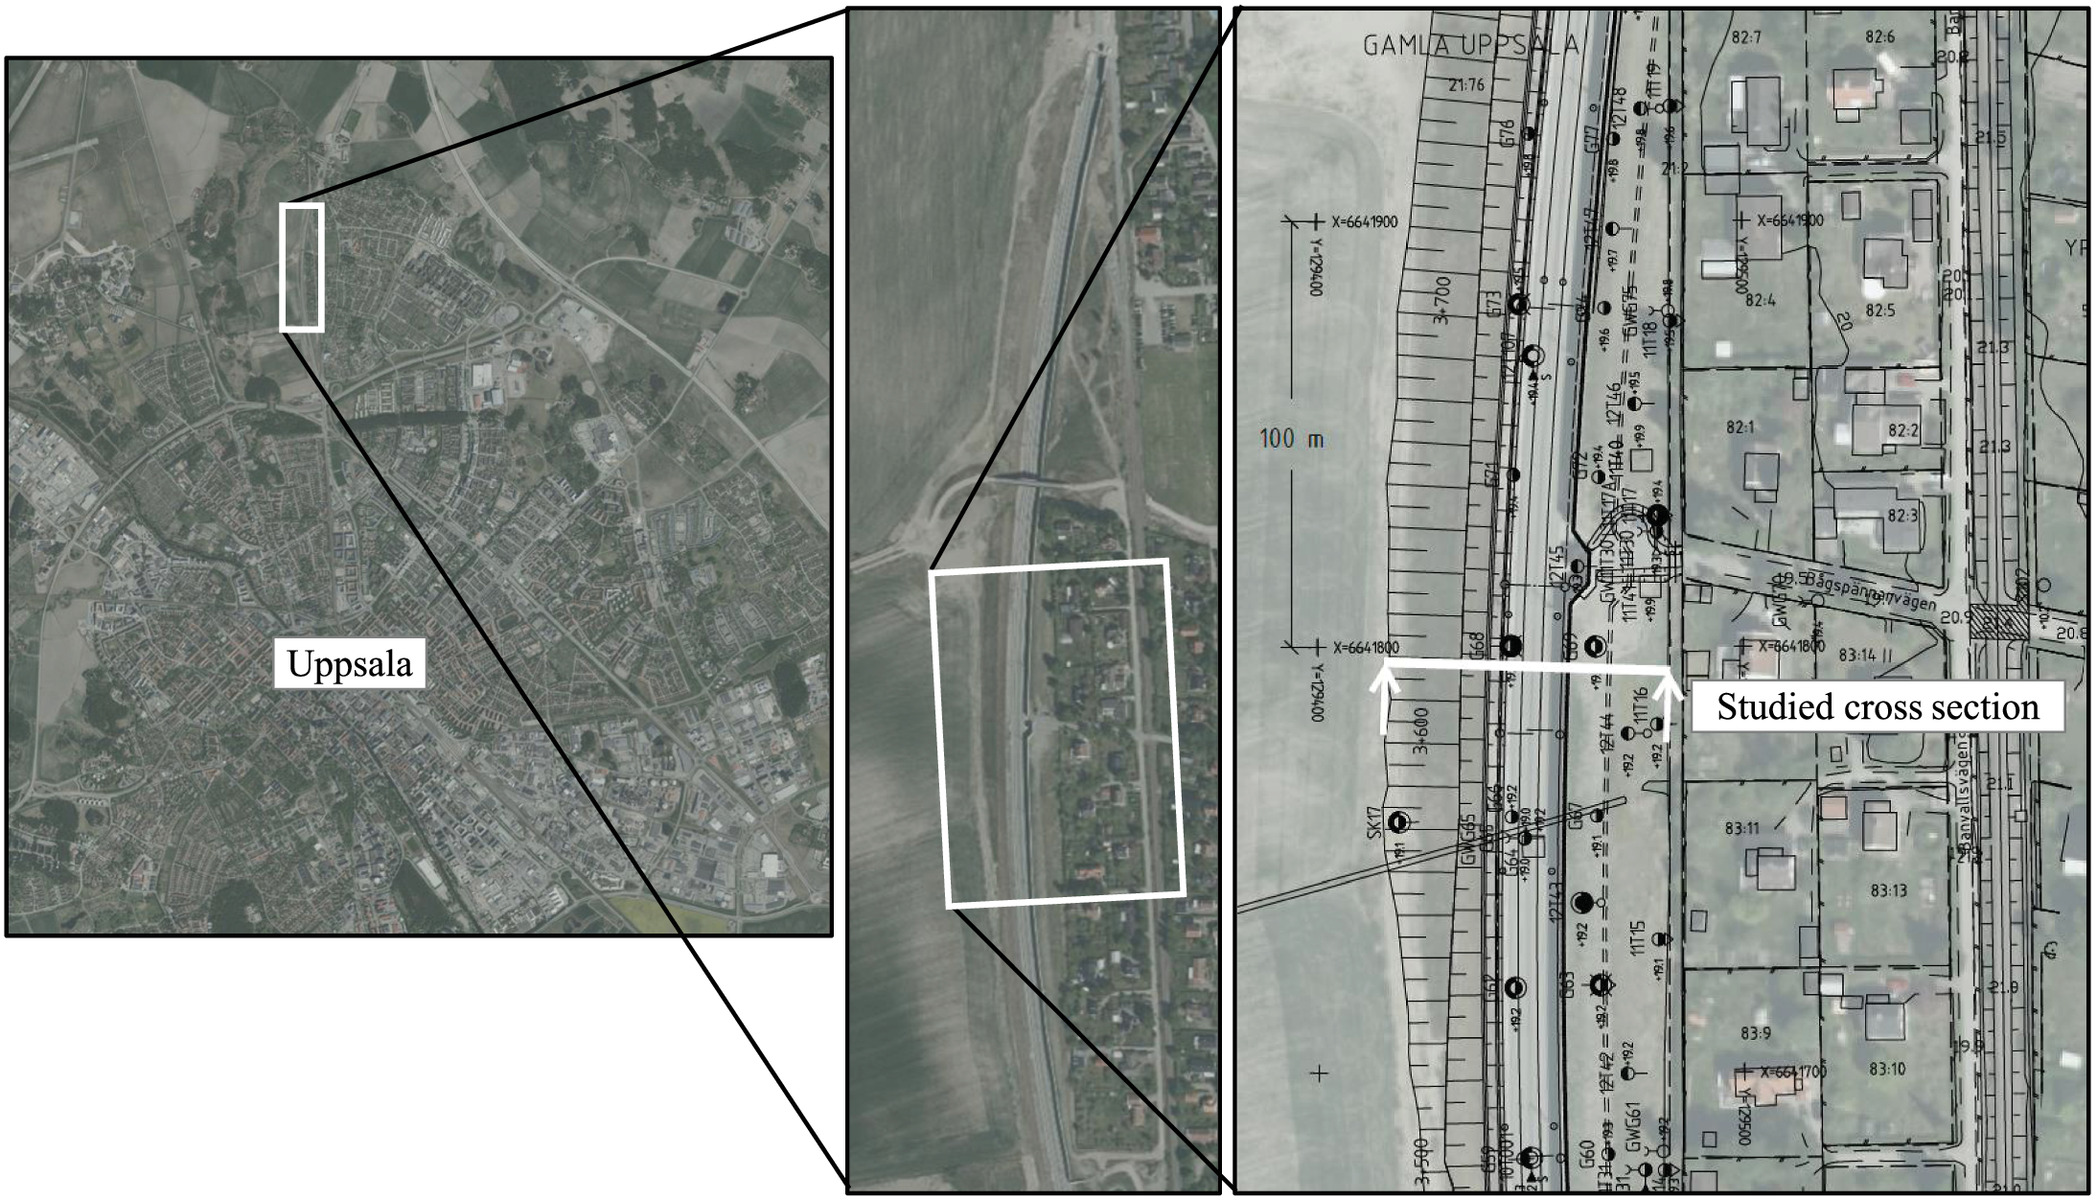
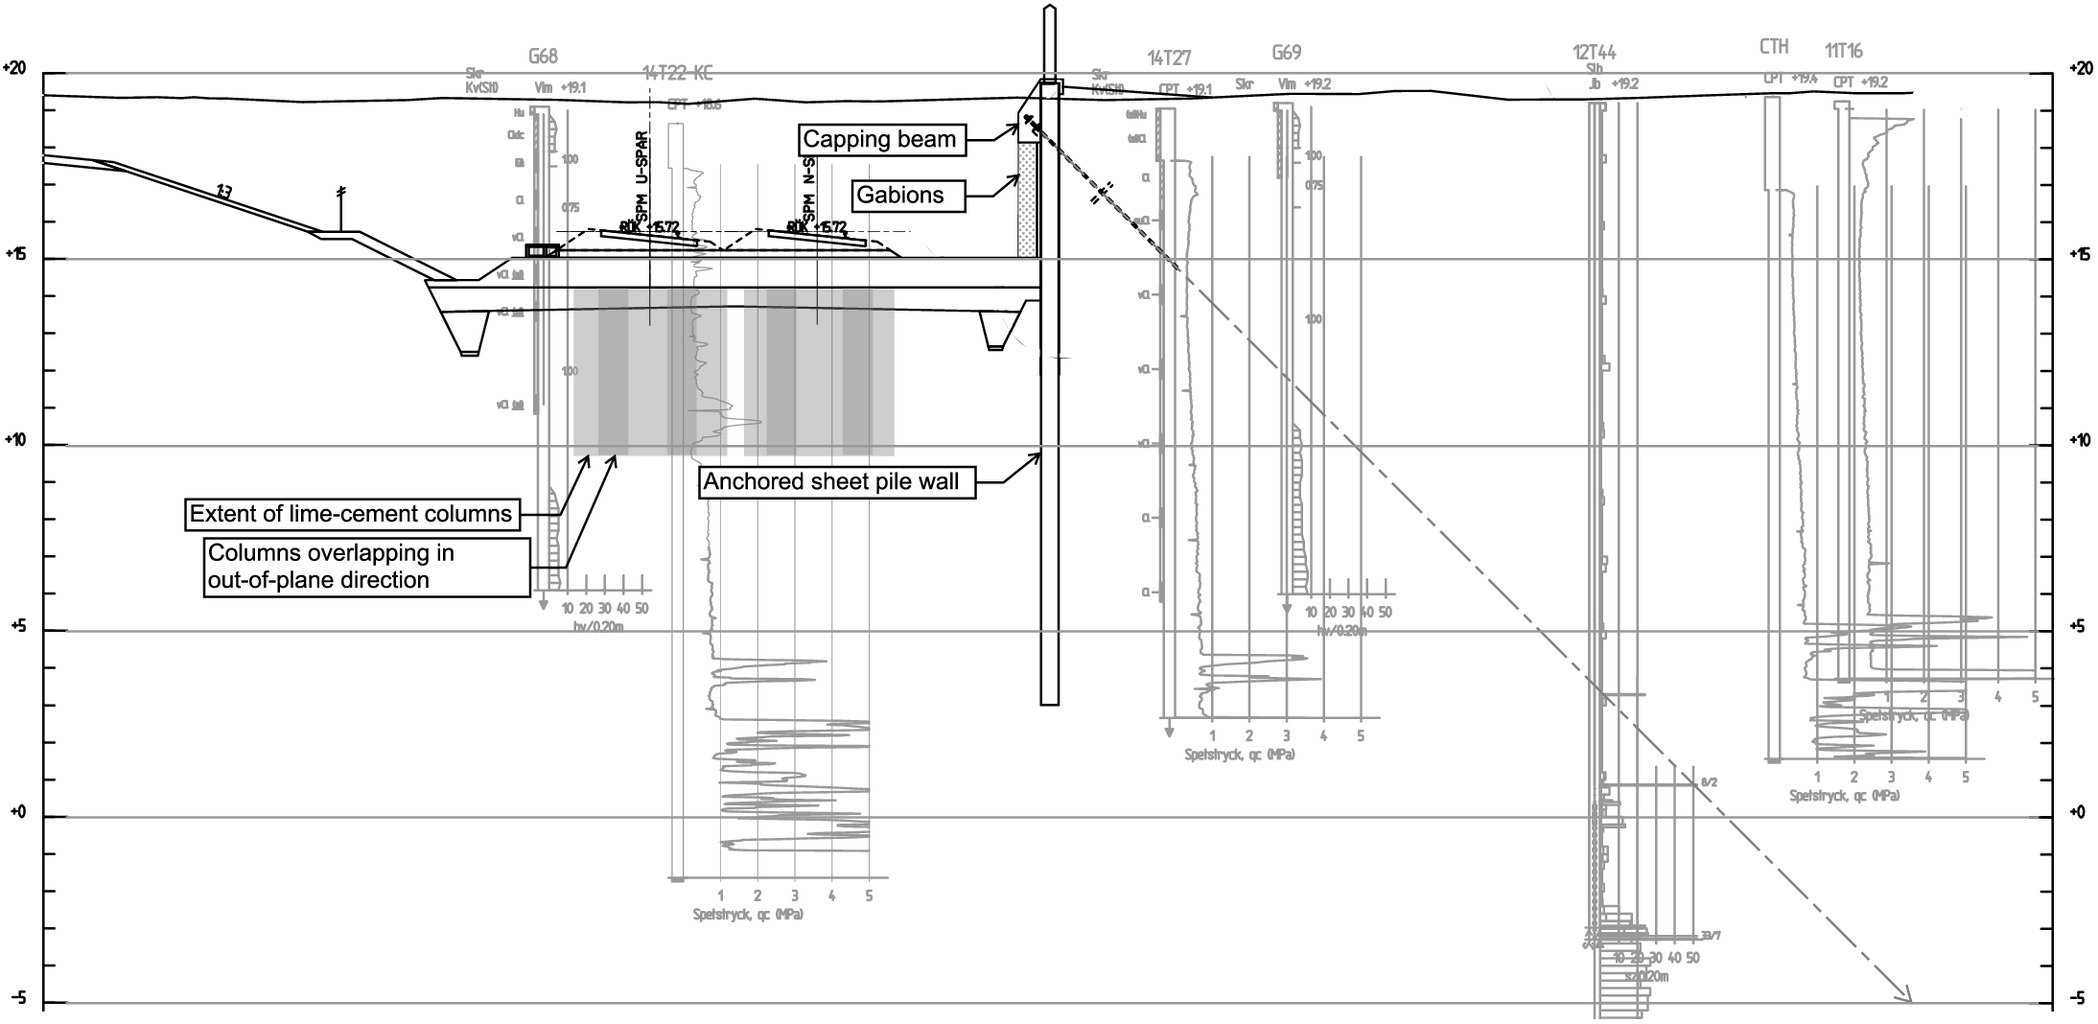
During 2013 to 2017, two railway tracks were constructed just north of Central Uppsala, a city located approximately 60 km N-NW of Stockholm, in Sweden. The elevation of the planned tracks was such that a retaining structure was needed to avoid damage to residential buildings west of the tracks. A tied-back steel sheet pile wall was utilized to handle the height difference during the construction period, as well as in the serviceability stage. The original design consisted of a cast-in-place anchored concrete retaining wall. However, a SPW was considered to be the best alternative from both construction and economical points of view, and it would also reduce the carbon footprint. Monitoring of the SPW performance was carried out using conventional surveying, inclinometers, and anchor force measurements (three anchors at five cross sections). The measurement data from Section 3+615, see Fig. 1, is presented in this paper. Fig. 2 presents the cross section and Table 1 the general schedule of construction activities.
| Construction activity | Time |
|---|---|
| Installation of lime-cement columns | 2014 Q1 |
| Installation of SPW | 2014 Q2 |
| Excavation for waler beam and anchors | 2014 Q4–2015 Q1 |
| Anchor installation | 2015 Q1 |
| Waler beam assembly | 2015 Q1 |
| Prestressing of anchors | 2015 Q2 |
| Construction of concrete capping beam | 2015 Q2–Q3 |
| Excavation to final depth followed by sub-ballast constructiona | 2015 Q3 |
| Assembly of gabions and insulation | 2016 Q1–Q2 |
| Ballast, sleepers, and rails | 2016 Q3 |
| Trains in operation | 2017 Q2 |
a
Estimated to within 1 week after excavation.
The sheet pile wall consists of AZ24-700 profiles installed to elevation , resulting in a total length of approximately 16 m. At the location of each anchor, single sheet piles were driven into the bearing stratum consisting of coarse-grained material. Anchors consisted of MAI T76S (Minova, Wales, UK) rods grouted into the bedrock, with a center-to-center (c.t.c.) distance of every second 2.8 and 3.5 m. However, adjacent to the studied section the c.t.c., distances varied from 1.3 to 3.9 m due to the presence of some existing and new pipes. The retained height was approximately 6 m in the construction phase and 4.5 m in the long-term. After the final excavation, 0.1 m of insulation and gabions were placed in front of the wall.
Soil Characterization
The geology of Uppsala is dominated by soft clay deposits with the Uppsala esker ridge running approximately N-S through the city. The clay layers started to form during the last deglaciation as the ice front retreated from the Uppsala area approximately 10,000 years ago (Lundin 1991; Fréden 2002). Postglacial deposits, formed during subsequent isostatic uplift, overlay the varved glacial deposits. The extent and depth of the postglacial deposits varies within the city. At the studied site, varved clay is in general found all the way up to the dry crust. Due to the isostatic uplift the ground surface at the site became exposed approximately 2,500–3,000 years ago (Eriksson 1999).
Pumping of drinking water from various locations along the Uppsala esker started in 1875 in Central Uppsala. As the city grew, the system was expanded. The groundwater well galleries and recharge plant located nearest the studied site were put into operation in the late 1960s to early 1970s (Hummel 2014). Allowable upper and lower groundwater levels for the pumping-recharge system were described by Sidenvall (1981) and are in line with measurements of pore pressures in the lower part of the clay layer at the studied site. The pumping has caused lowering of the groundwater in the aquifer below the clay layer. This contributes to increased effective stresses in the soft clay, and consequently ongoing background settlements of up to have been monitored within the city center (Fryksten and Nilfouroushan 2019).
The studied cross section of the railway project is located approximately three kilometers north of Central Uppsala. The ground surface at site is located approximately at elevation (Swedish National reference system RH2000). The soil stratigraphy consists of dry crust down to an approximate depth of 2.5 m below ground surface. Soft sensitive varved clay is found down to an approximate depth of 15 to 16 m, corresponding to elevation to in the location of the sheet pile wall. Layers of coarse-grained soils underlay the clay down to approximately followed by bedrock.
The index properties of the clay, as well as the undrained shear strength and hydraulic conductivity (from here on referred to as permeability) are summarized in Fig. 3. Fig. 3 also contains generalized trends (denoted “FE” in Fig. 3) as input for FE analyses. Soil samples were extracted with a standard Swedish 50mm STII piston sampler. Samples denoted with “CTH” were analyzed and tested in the geotechnical laboratory at Chalmers University of Technology. This supplementary testing was carried out in late 2020–early 2021 to obtain data on the stress-strain response upon shearing (triaxial tests), as well as to investigate the unloading-reloading behavior and the intrinsic properties in oedometer tests.
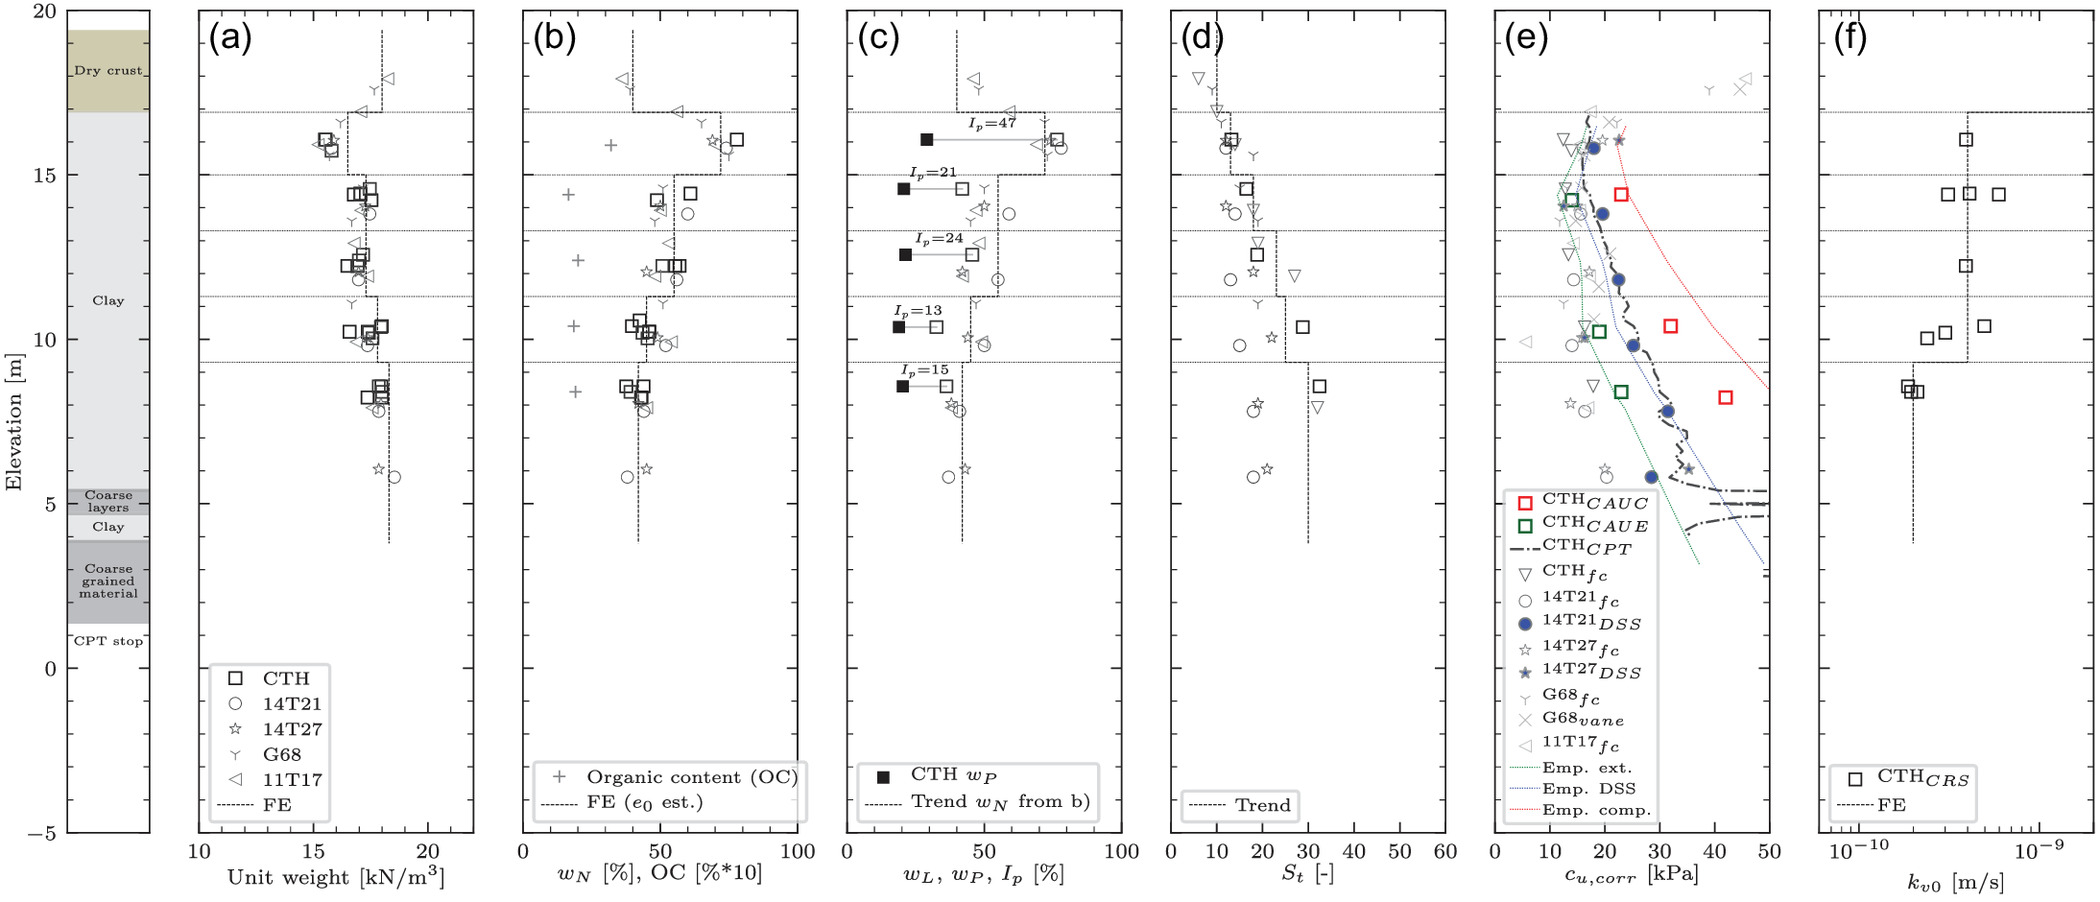
As seen in Fig. 3 the unit weight of the clay ranges from 15.5 to . The liquid limit is in general 0%–10% lower than the natural water content, and the plasticity index ranges from 13% to 47%. The sensitivity varies from approximately 10–35 and the organic content from 1.7% to 3.2% [Fig. 3(b)]. Sedimentation analysis on a sample from 5 m depth indicates a clay and silt content of 54% and 46% respectively. Fine silt (2–6.3 μm) dominates the silt fraction. According to Casagrandes plasticity chart, the clay is classified as medium plasticity, except the sample from 3 m depth, which classifies as high plasticity clay.
Cone penetration (CPTU) and direct simple shear (DSS) tests indicate an undrained shear strength of 15–20 kPa to elevation and an increase of below. Results from CPTU, evaluated according to Larsson (2015), and DSS tests are in general in good agreement with empirical estimates [“Emp.” in Fig. 3(e)] based on Larsson et al. (2007). The low undrained shear strength measured in the two lowermost anisotropically () consolidated undrained triaxial compression (CAUC) tests is likely to be attributed to sample disturbance.
The vertical permeability, , was evaluated from the constant rate of strain (CRS) oedometer tests according to Swedish practice (Larsson and Sallfors 1986). At stress levels corresponding to the vertical effective stress in situ, varies from 2 to [Fig. 3(f)].
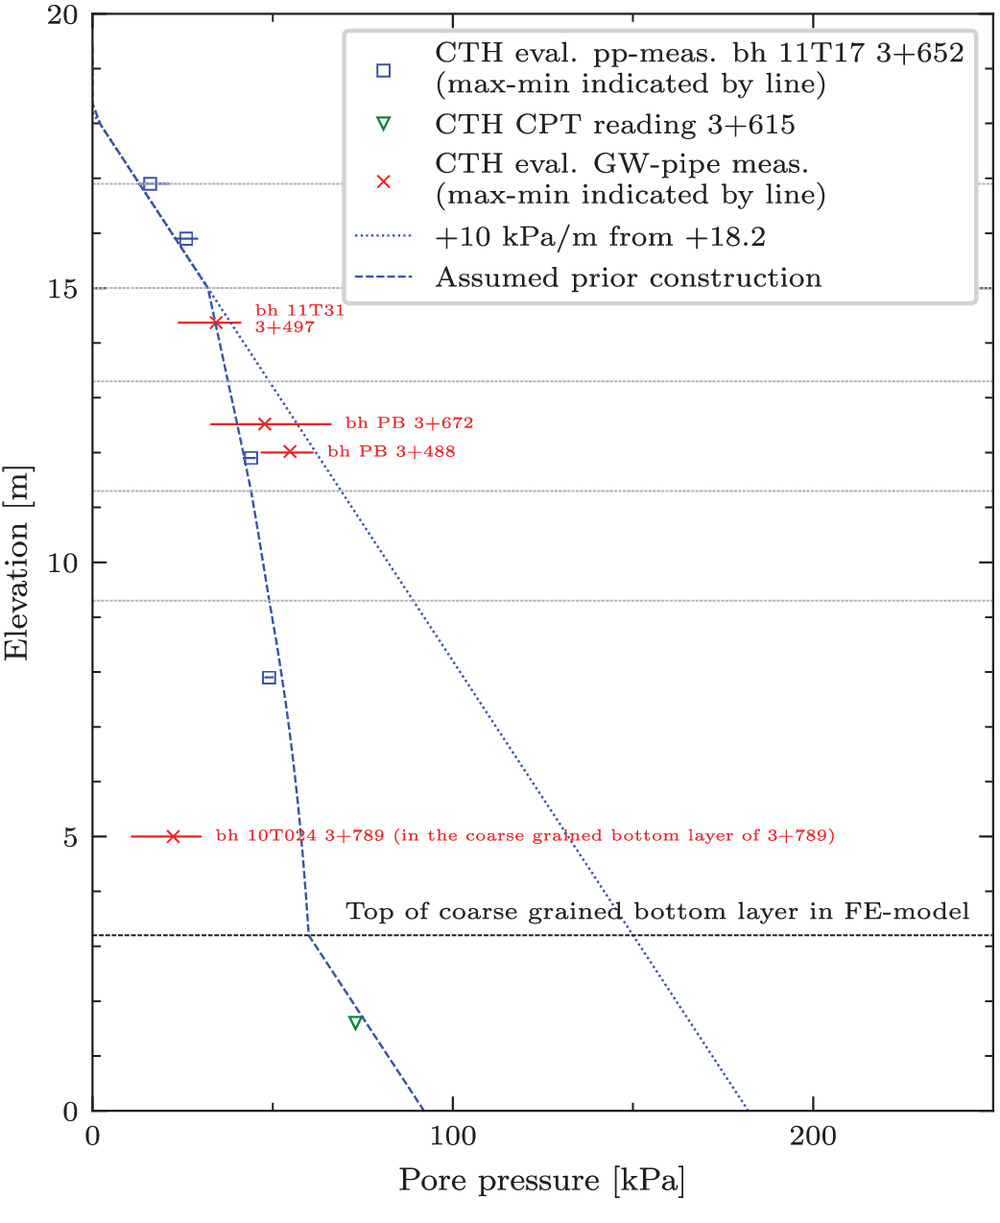
The pore pressure in the clay layer and the coarse-grained material below was measured by consulting company Tyréns, as well as by Chalmers with one CPTU test. Pressure levels in the upper part of the clay layer corresponded to a groundwater level located at . Due to the history of the pumping of groundwater within Uppsala in the lower aquifer, the pore pressure in the clay is lowered compared to the hydrostatic pore pressure distribution, as seen in Fig. 4. The groundwater level measured in 10T024, at elevation in Fig. 4, deviates due to a higher elevation of the coarse-grained bottom material to that of the studied section. Previously described allowable upper and lower groundwater levels for the pumping-recharge system are in line with the present pore pressure levels measured in the lower part of the clay layer. There is, however, an uncertainty if the measured pore pressures also include excess pore pressures (due to ongoing settlements). Thus, the measured profile does not necessarily correspond to a steady state.
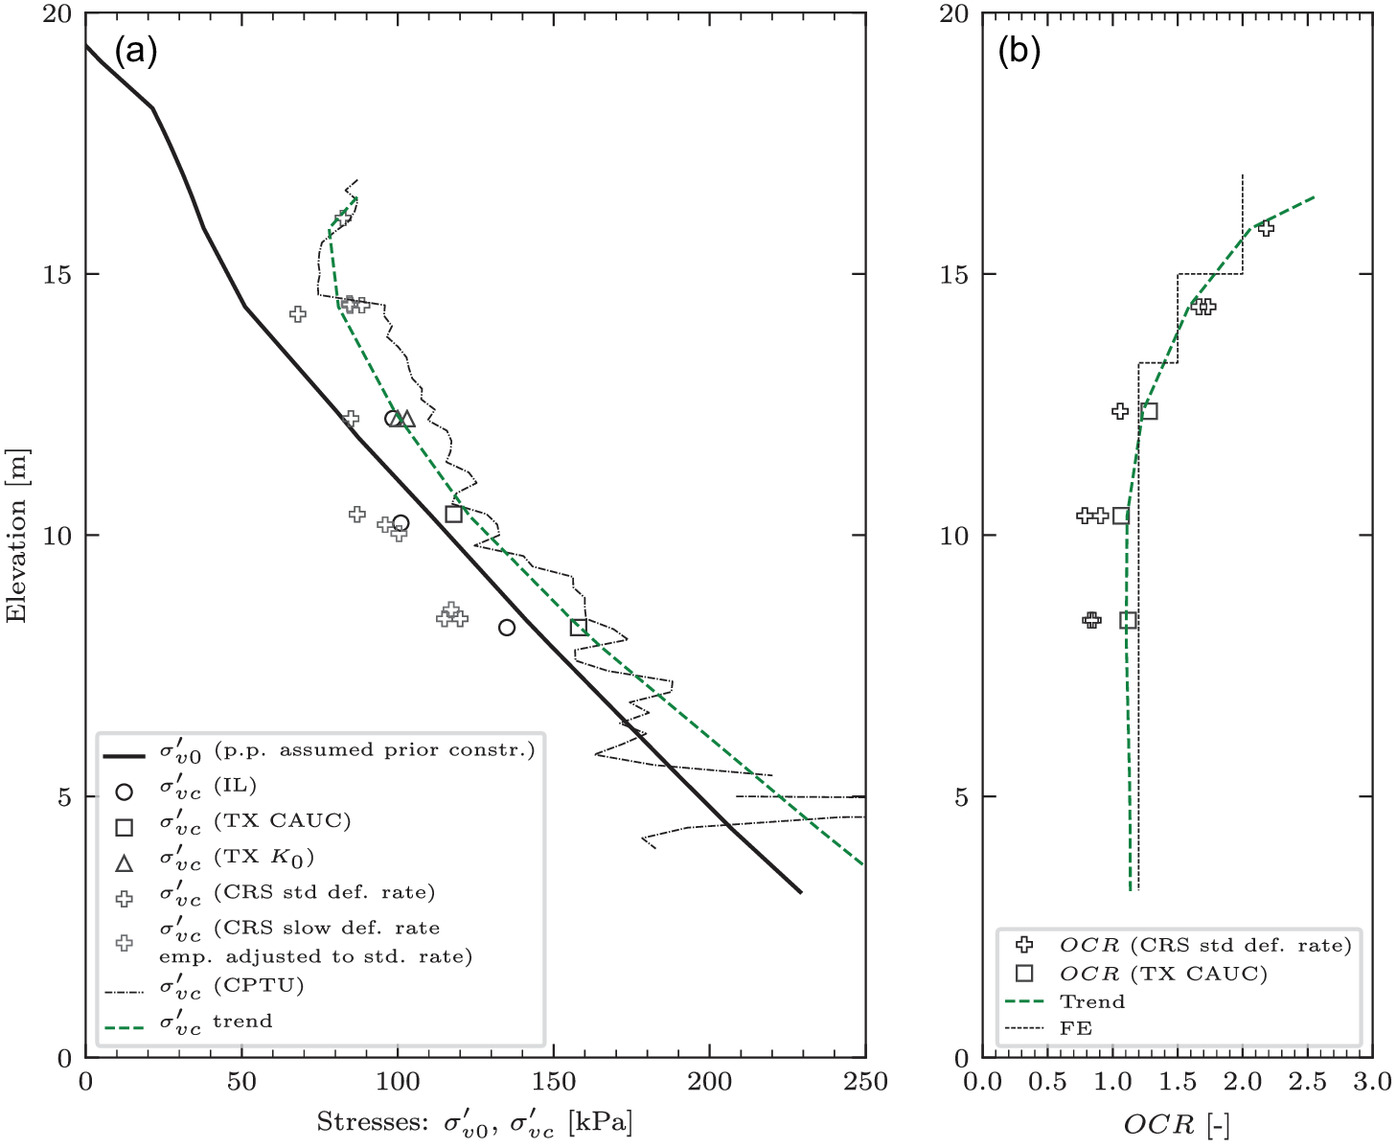
The vertical preconsolidation pressure, , of the clay layer has been determined by means of CRS and incremental loading (IL) oedometer tests, as well as triaxial (TX) CAUC and -tests (zero radial deformation). The CRS-tests were carried out with different strain rates (0.17%–0.71%/h), since some initial tests with the Swedish standard rate (0.72%/h) resulted in high pore pressures ( of the measured total stress).
Based on the unit weight of the soil, the estimated pore pressure distribution, and the preconsolidation pressure, a trend of the overconsolidation ratio (OCR) is presented in Fig. 5. OCR varies from 2.5 in the upper part of the clay layer to approximately 1.1–1.2 in the bottom. If the pore pressure had been hydrostatic (i.e., no underdrainage), OCR would be in the range 1.6–1.8 in the bottom of the clay layer. However, such a range (1.6–1.8) of a possible historic OCR is likely an overestimate, since measured values of most likely have evolved during and after the pore pressure drawdown and the associated effective stress increase. An OCR unaffected by anthropogenic loading, would due to aging (Bjerrum 1967) be expected in the range of 1.2–1.3 based on experience from other Swedish clays; 1.15–1.2 for East Coast and 1.25–1.3 for West Coast (Larsson 2007; Sallfors and Larsson 2016).
As previously mentioned, the background settlement rate in Central Uppsala is up to . However, no detailed data of background settlement rates before construction were available for the studied area. The publicly available InSAR data (WSP 2021) indicates an ongoing, present day, settlement rate of at approximately 10 m distance behind the sheet pile wall in the studied section. The distribution of settlements versus depth is unknown.
Numerical Model
Constitutive Model
To model the response of the clay layers, the Creep-SClay1S model (Sivasithamparam et al. 2015; Gras et al. 2018) was adopted. The model originates from the modified Cam-Clay model and critical state soil mechanics. The advantage of the Creep-SClay1S model is the ability to incorporate typical soft sensitive clay features such as initial and evolving anisotropy, destructuration, and rate-dependency. A main advantage of including these features and rate-dependency in particular is that one parameter set can be used for predictions of the short- and long-term response in areas with soft, sensitive clay layers and background creep settlements. Rate-dependency also allows for automatic mapping between strain rates adopted in laboratory tests and element level simulations and those predicted in the boundary level modeling. For a brief summary of model details and formulations see Tornborg et al. (2021), and for the history and successive development of the model see Wheeler et al. (2003), Karstunen et al. (2005), Sivasithamparam et al. (2015), and Gras et al. (2018).
The clay layer at the site was divided into five layers according to Table 2. For estimation of initial void ratio, , the clay layers were assumed to be fully saturated and with a specific gravity of (Larsson 1981). The vertical permeability of the clay was calculated from CRS-tests, and for the dry crust was estimated to be based on Ringesten (1988). The horizontal permeability of the clay layers was estimated to based on Tavenas et al. (1983) and Müller and Larsson (2012), with the exception of the dry crust, where was assumed based on Ringesten (1988).
| Layer | Depth (mbgs) | Elevation (m) | a | b | c | ||
|---|---|---|---|---|---|---|---|
| Clay 1 | 2.5 to 4.4 | to | 2.00 (1.69) | 1.9 | 0.53 | 13 | 0.69 |
| Clay 2 | 4.4 to 6.1 | to | 1.50 (1.43) | 1.5 | 0.53 | 18 | 0.56 |
| Clay 3 | 6.1 to 8.1 | to | 1.20 (1.18) | 1.5 | 0.50 | 45 | 0.53 |
| Clay 4 | 8.1 to 10.1 | to | 1.20 (1.18) | 1.2 | 0.50 | 55 | 0.50 |
| Clay 5 | below | 1.20 (1.18) | 1.1 | 0.46 | 75 | 0.56 |
a
Initial anisotropy.
b
Initial amount of bonding.
c
Earth pressure coefficient at rest, from (Schmidt 1966) with .
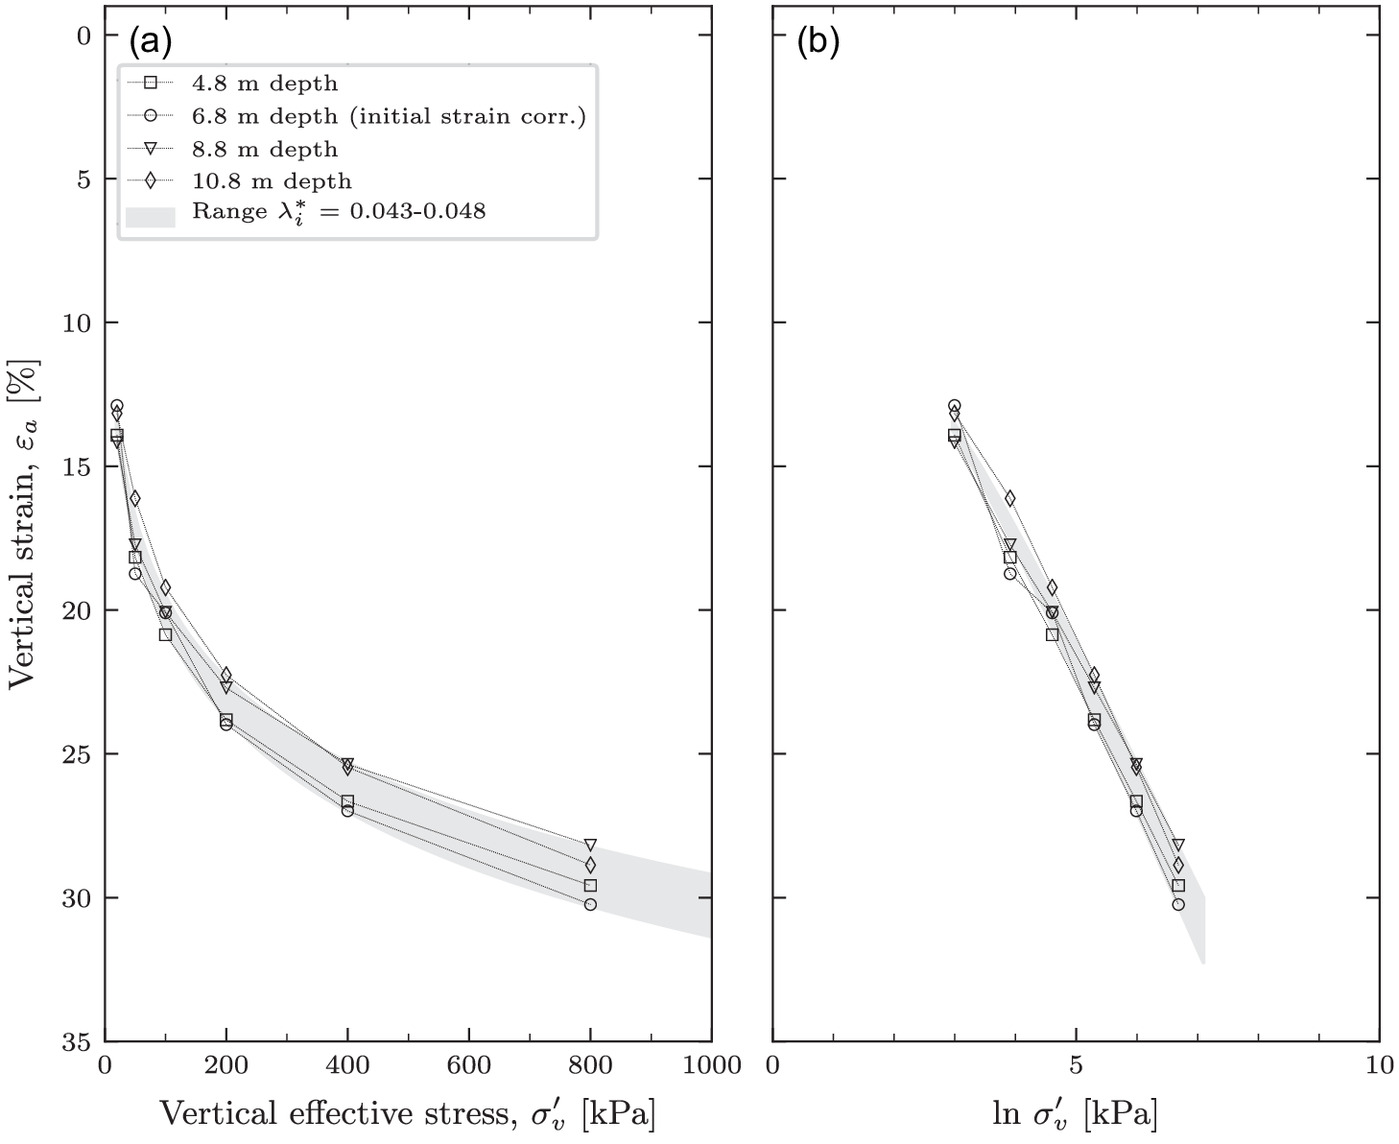
The model parameters of Creep-SClay1S are presented in Table 3. Parameter values in Table 3 were estimated based on index, oedometer, and triaxial tests. See Table 3 for symbols relating to the Creep-SClay1S model. The intrinsic modified compression, , and creep, , indices were derived from IL tests on remolded clay, see Fig. 6. The value of is rather low compared to other studies on similar clays, e.g., Karstunen and Koskinen (2008) range 0.08–0.10. However, Karstunen et al. (2005) reported in range 0.03–0.09.
| Parameter | Description | Clay 1 | Clay 2 | Clay 3 | Clay 4 | Clay 5 |
|---|---|---|---|---|---|---|
| Unit weight () | 16.5 | 17.3 | 17.3 | 17.8 | 18.3 | |
| Modified intrinsic compression index | 0.045 | 0.045 | 0.045 | 0.045 | 0.045 | |
| Modified swelling index | 0.005 | 0.005 | 0.005 | 0.005 | 0.005 | |
| Poisson’s ratio | 0.20 | 0.20 | 0.20 | 0.20 | 0.20 | |
| Stress ratio at critical state in triaxial compression | 1.37 | 1.37 | 1.29 | 1.29 | 1.20 | |
| Stress ratio at critical state in triaxial extension | 0.83 | 0.83 | 0.80 | 0.80 | 0.74 | |
| Rate of rotational hardening | 200 | 200 | 200 | 200 | 200 | |
| Relative rate of rotational hardening due to deviation strain | 0.93 | 0.93 | 0.85 | 0.85 | 0.76 | |
| Rate of destructuration | 15 | 15 | 15 | 12 | 12 | |
| Relative rate of destructuration due to deviation strain | 0.8 | 0.8 | 0.8 | 0.8 | 0.8 | |
| Modified intrinsic creep index | 0.0010 | 0.0011 | 0.0011 | 0.0011 | 0.0011 | |
| Reference time (days) | 1 | 1 | 1 | 1 | 1 | |
| a | Earth pressure coefficient at primary loading | 0.44 | 0.44 | 0.47 | 0.47 | 0.53 |
Note: Additionally, the vertical permeability, , is for Clays 1–4 and for Clay 5.
a
From (Jáky 1944) with .
Model parameters , , and were initially calibrated based on element level simulations of laboratory tests. Parameters and would ideally be based on drained triaxial tests probing an isotropic stress path for subsequent numerical optimization of , and respectively, a highly deviatoric stress path for (Koskinen et al. 2002). Koskinen (2014) recommended values of and based on extensive testing of Finnish soft sensitive clays, whereas and were used in simulations of soft sensitive Swedish West Coast (Gothenburg) clay (Petalas et al. 2019; Tornborg et al. 2021). Upper and lower bounds for and are given by Gras et al. (2018). The value of can be estimated initially from the sensitivity of the clay (Koskinen et al. 2002). However, some calibration of is typically needed to fit laboratory data.
Modeling of Previous Stress History
As previously mentioned, a groundwater drawdown is present at the site due to historic pumping in the aquifer below the clay layer. This stress history was modeled in order to initialize the stress situation and state parameters prior to construction. However, an inherent challenge in such modeling is that the laboratory tests indicate the in situ state at present day. In other words, the initial state (before the man-made increase of effective stresses due to groundwater pumping) is unknown. Therefore, in modeling of the stress history, “unknown” initial values of the state variables were estimated and assigned. The state then evolves during the boundary value simulation of the stress history. This means that the values of the state variables are not prescribed as input at the start of the construction (phase 01 in Table 5). Rather, they are checked so that they, during the simulation of the groundwater drawdown and up until start of construction, evolve to be within reasonable limits, i.e., in line with the available laboratory test data.
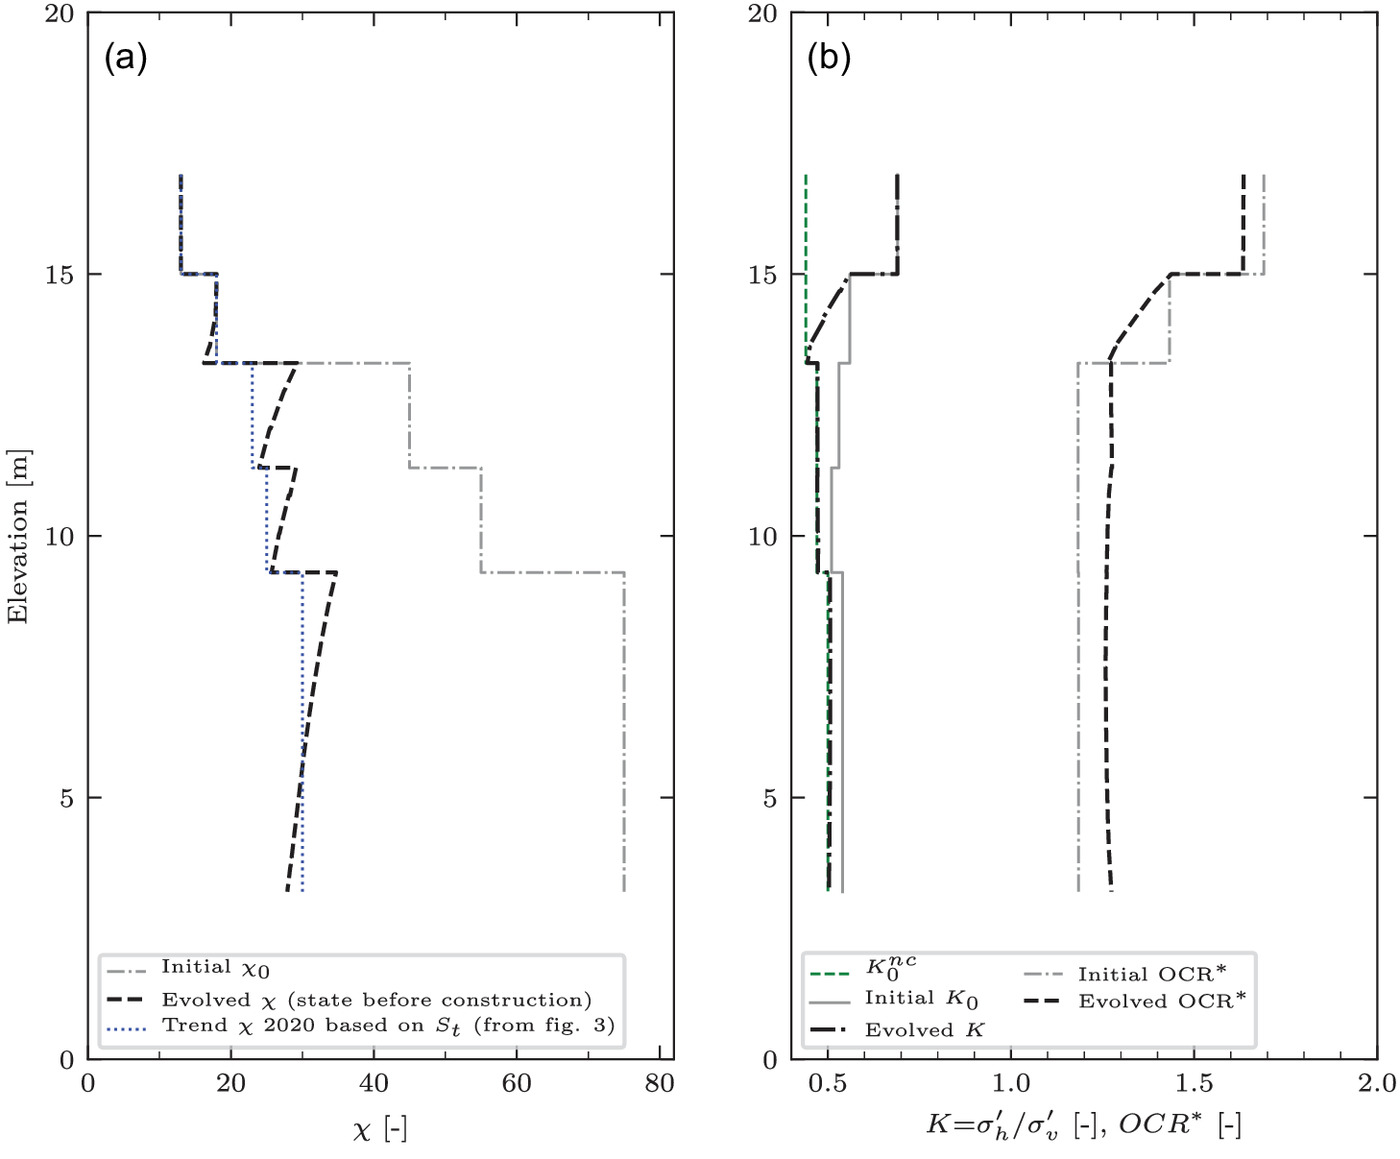
In all, this required an iterative procedure adjusting the initial values of the state variables. Foremost, the initial value of required some iterations to have it evolve to values in line with laboratory values of sensitivity. The initial values of the state parameters are given in Table 2. Table 2 includes the initial values of the isotropic overconsolidation ratio, where is the equivalent isotropic mean effective stress level and the corresponding preconsolidation pressure, for details see Tornborg et al. (2021). Evolved values of , , and after modeling of the historic groundwater drawdown are presented in Fig. 7.
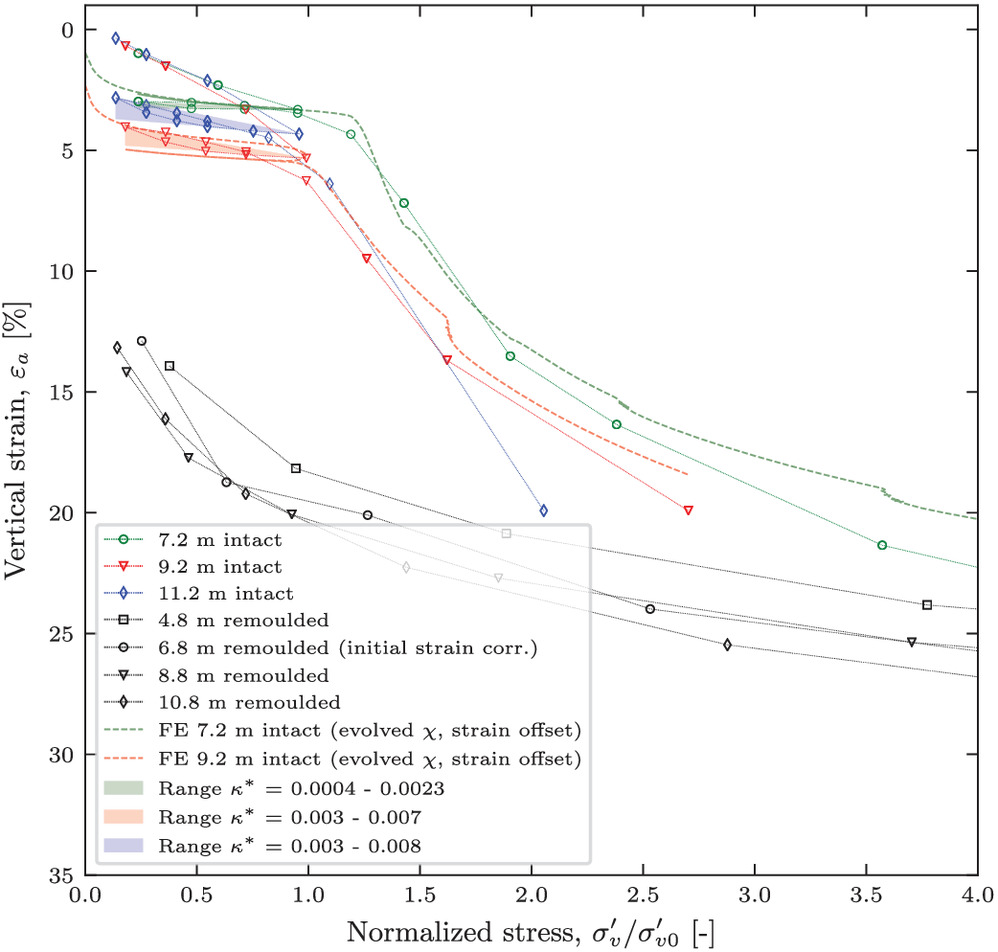
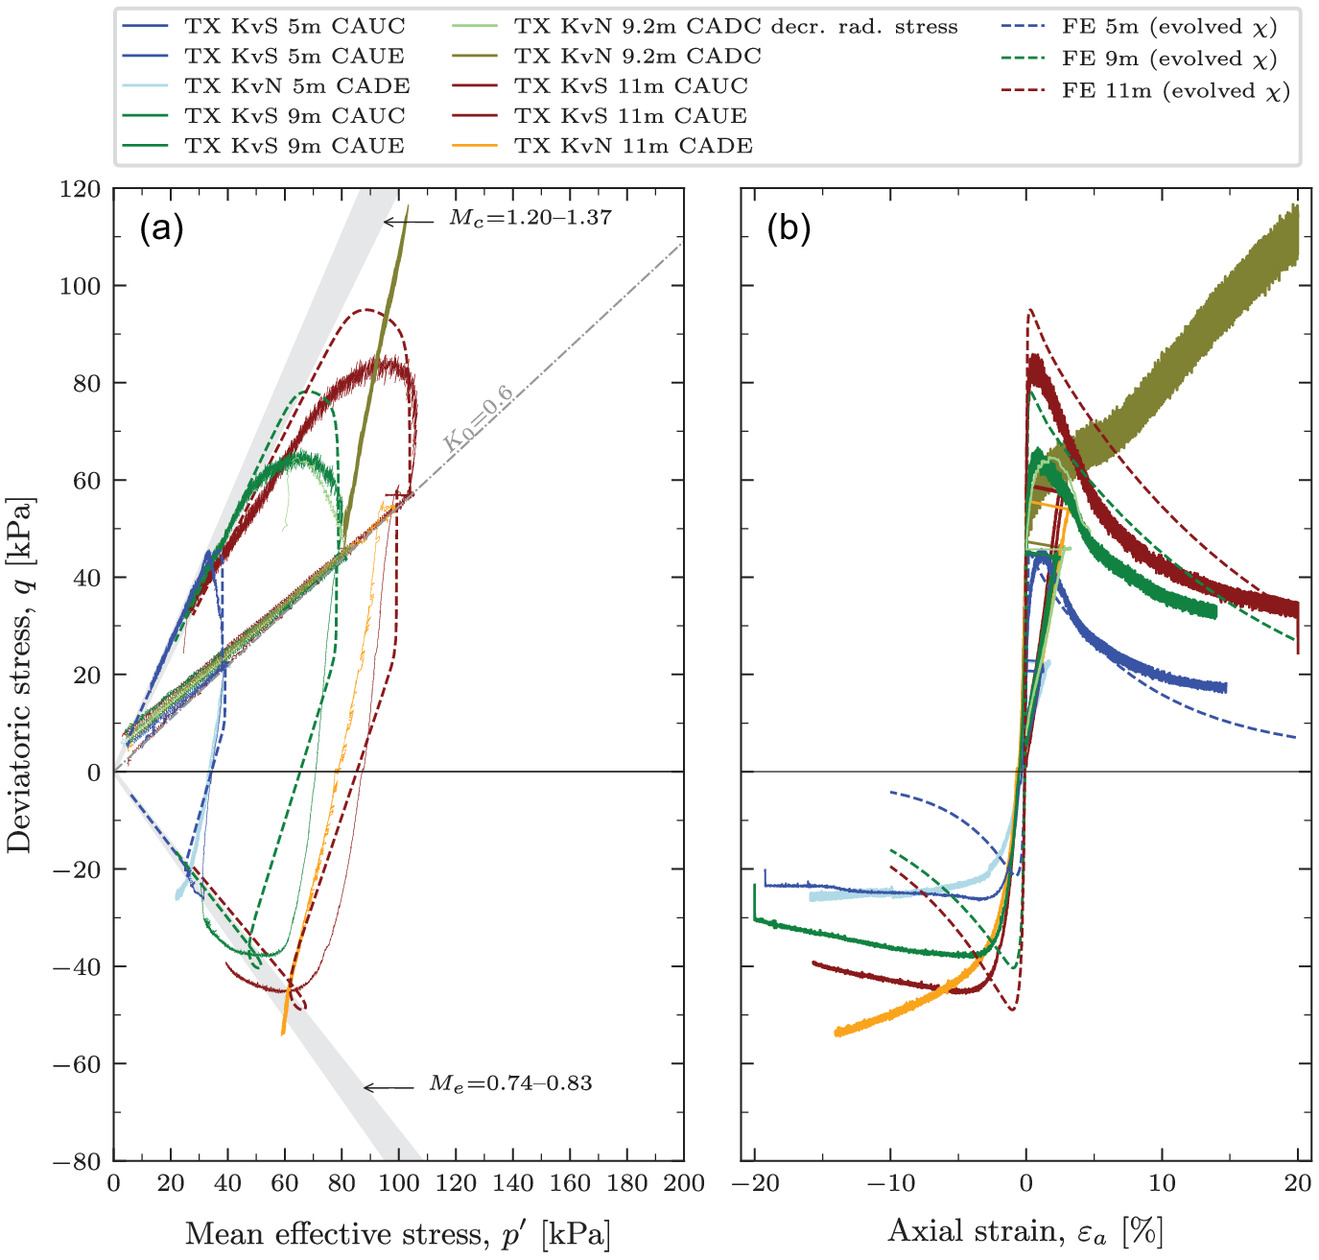
Figs. 8 and 9 present data from incremental loading oedometer and anisotropically consolidated undrained triaxial compression (CAUC) and extension (CAUE) tests, respectively. The figures include element level simulations of some of the tests. The element level simulations were carried out with the evolved values of , but with consolidation stresses and as imposed, respectively, derived from the individual tests. As previously pointed out [considering Fig. 3(e)] the measured peak strengths in the triaxial CAUC tests were lower than empirical estimates. The element level simulations resulted in emerging peak strengths that were more in line with the empirical estimates. The difference in laboratory data and element level simulations emerge, due to sample disturbance effects and/or consolidation to stress levels approaching the in situ preconsolidation pressure, causing some gradual destructuration of the sample (whereas element level simulations correspond to nonexisting sample disturbance). For instance, the CAUC tests on the samples from 9 and 11 m depth experienced and 0.069, respectively, during reconsolidation and thus, according to Lunne et al. (1997), classified as “good to fair” (the 11 m test on the border to “Poor”). It can also be noted in Fig. 9(b) that since (derived from unloading in IL tests) is rather low, the stiffness emerging in the CAUC and CAUE simulations is overestimated compared to the triaxial test data. However, the value of was kept unadjusted, since sampling with a block sampler would most likely result in a higher sample quality and elastic stiffness, see Karlsson et al. (2016).
The response of the dry crust, the coarse-grained materials (below the clay layer), the compacted fill and the lime-cement stabilized part of the soil, were simulated using the Mohr-Coulomb model with parameter values according to Table 4.
| Parameter | Dry crust | Coarse-grained material | Compacted fill | Lime-cement stabilized claya | |
|---|---|---|---|---|---|
| Elevation | Elevation | ||||
| () | 18/8 | 18/10 | 18/10 | 19/11 | 18/8 |
| (MPa) | |||||
| 0.2 | 0.3 | 0.3 | 0.3 | 0.2 | |
| (kPa) | 10 | 1 | 1 | 1 | |
| (degrees) | 30 | 33 | 35 | 45 | — |
| (degrees) | 0 | 3 | 5 | 15 | — |
| 0.7 | 0.46 | 0.43 | 0.29 | 0.7 | |
a
Modeled as an undrained material cluster with an estimated stiffness based on .
Two-Dimensional FE-Model
A two-dimensional finite element (2D FE) model of the studied cross section, 3+615, was constructed in the commercial FE code Plaxis 2D (version 2021). The model geometry is presented in Fig. 10 and consists of 5,763 triangular 6-noded elements.
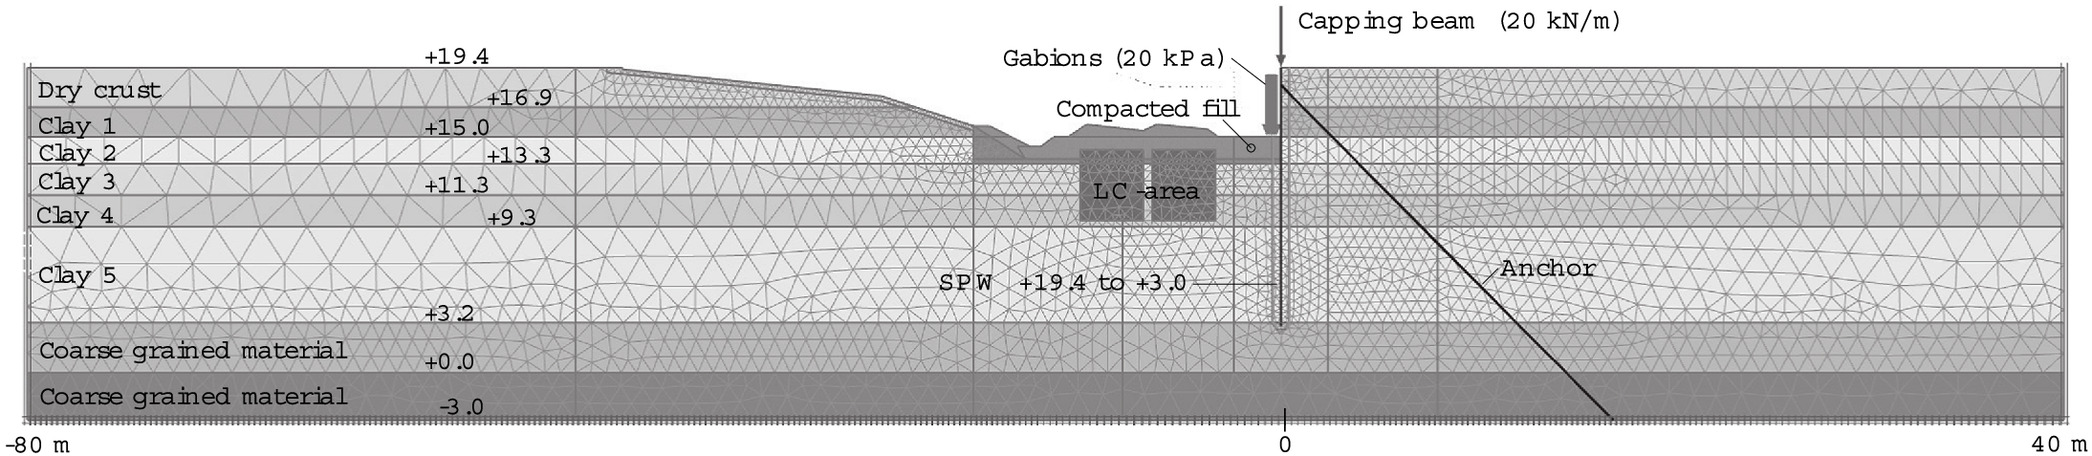
The analyses were carried out as consolidation analyses, representing the construction activities and times as-built, see Table 5. The analyses starts with modeling of the historic drawdown, which is assumed to have been rapid, followed by 50 years of consolidation. The properties of the structural elements are summarized in Table 6. The analysis is classified as a “Class C” prediction according to the definition of Lambe (1973). The modeling involves the following limitations and assumptions:
•
The bottom of the SPW was fixed in the vertical direction. This simplification was made since at the location of every anchor, single sheet piles were installed down to very firm coarse-grained material or bedrock to handle the vertical component of the anchor force. This motivated the use of a vertical boundary condition for the SPW;
•
The SPW was modeled as impermeable and the clay-SPW interface was modeled with the soft soil model using , and a strength reduction factor, ;
•
For the lime-cement stabilized part of the clay, the Mohr-Coulomb model was adopted with unit weight and undrained shear strength corresponding to the area weighted average of intact clay-lime-cement (parameters in Table 4). The clay layers above the lime-cement soil cluster were assumed to be intact, however some lime-cement stabilization was most likely conducted also at these elevations to provide adequate bearing capacity for the construction machinery; and
•
Lime-cement columns, SPW, and anchors were modeled as wished-in-place. In the case of the lime-cement columns, this simplification is partially motivated by the columns being installed in Q1 2014 and the excavation being carried out in September 2015.
| Phase | Description | Time (days) |
|---|---|---|
| 00a | Initial stress generation (-procedure) | — |
| 00b | Groundwater drawdown | 10 (18,250) |
| 01a | Installation of lime-cement columns | 3 (227) |
| 02 | Installation of SPW | 5 (65) |
| 03 | Excavation to level for waler beam and anchor installation | 5 (81) |
| 04 | Installation of anchors | 5 (56) |
| 05 | Prestressing of anchors | 1 (65) |
| 06 | Casting of SPW capping beam | 1 (63) |
| 07 | Excavation to final level | 2 (2) |
| 08 | Backfill to b | 2 (120) |
| 09 | Gabions to 1/2 height | 10 (72) |
| 10 | Gabions to full height | 10 (143) |
| 11 | Final backfill incl. rails | 10 (251) |
| First train in traffic May 2017 (assuming May 15, 2017) | — | |
| 12 | Consolidation stage May 15, 2017–March 1, 2020 | 1,021 |
| 13 | Consolidation stage March 1, 2020–March 1, 2021 (for check of present-day deformation rates) | 365 |
| 14 | Consolidation stage March 1, 2021–May 15, 2117 (long-term 100 years from first train in operation) | 35,138 |
Note: All phases except initial 00a are calculated as consolidation analysis. Time column above represents the modeled execution time for each activity with stall/consolidation times given within ().
a
Start: February 1, 2014 (reset displacements and time).
b
Requirement was completion within 1 week after excavation.
| Structural element | Material set | Parameter | Value |
|---|---|---|---|
| Sheet pile wall | Plate | 210 GPa | |
| AZ24-700 | |||
| S355GP | |||
| 0.20 | |||
| Anchors | Node-node | 205 GPa | |
| MAI T76S | Anchor | ||
| Yield load | 1,500 kN | ||
| c.t.c-distance | 3.3 m | ||
| Prestress | 500 kN |
Results and Discussion
The rate of the background settlement prior to the construction was computed to . For present day conditions, a rate of was indicated based on InSAR measurements and surveying of the SPW capping beam. Hence, the computed rate prior to construction is reasonable, although an underestimate. This indicates that during simulation of the historic groundwater drawdown and the corresponding increase in the effective stresses, the model predicted a slightly higher overconsolidation ratio ( ca. 1.3) then evaluated () in the lower parts of the clay layer. This leads to underestimation of the creep strains in subsequent calculation phases. The computed present day settlement rate was , which also is an underestimate compared to the measured . However, the current rate of settlement may also be partially a result of cyclic load accumulation and destructuration in the clay below the tracks and the lime-cement reinforced area. Such effects were not included in the modeling, but an approach as presented by Zuada Coelho et al. (2021) could be considered in future studies.
Effects resulting from lime-cement columns and sheet pile wall installations were neglected in the simulations. These effects are, however, unlikely to have major impact on the construction performance and the present day settlement rates, as the installations were carried out well in advance of the excavation. The modeling of the installation effects may however in some cases be an important and integral part of the modeling of the initial stress state.
Fig. 11 presents measured and computed horizontal displacements at the location of the sheet pile wall. In Fig. 12 the data are plotted versus time. With exception of the maximum displacement, the general trend of the computed displacements were in good agreement with the measurement data. The computed results underestimate the displacement by a maximum of approximately 10–15 mm at the end of this study (March 1, 2021). The inclinometer was located approximately in the middle of two anchors with a c.t.c. distance of 3.9 m whereas a c.t.c. of 3.3 m was used in the FE-model. The bending of the waler beam may thus have partly contributed to the offset between the measured and computed horizontal displacements in Fig. 11. The inclinometer base was assumed fixed from translation due to its location at an elevation of ca. , in the coarse-grained material and well below the SPW and clay layer. Thus no significant error (offset) was expected in the measured absolute horizontal displacement.
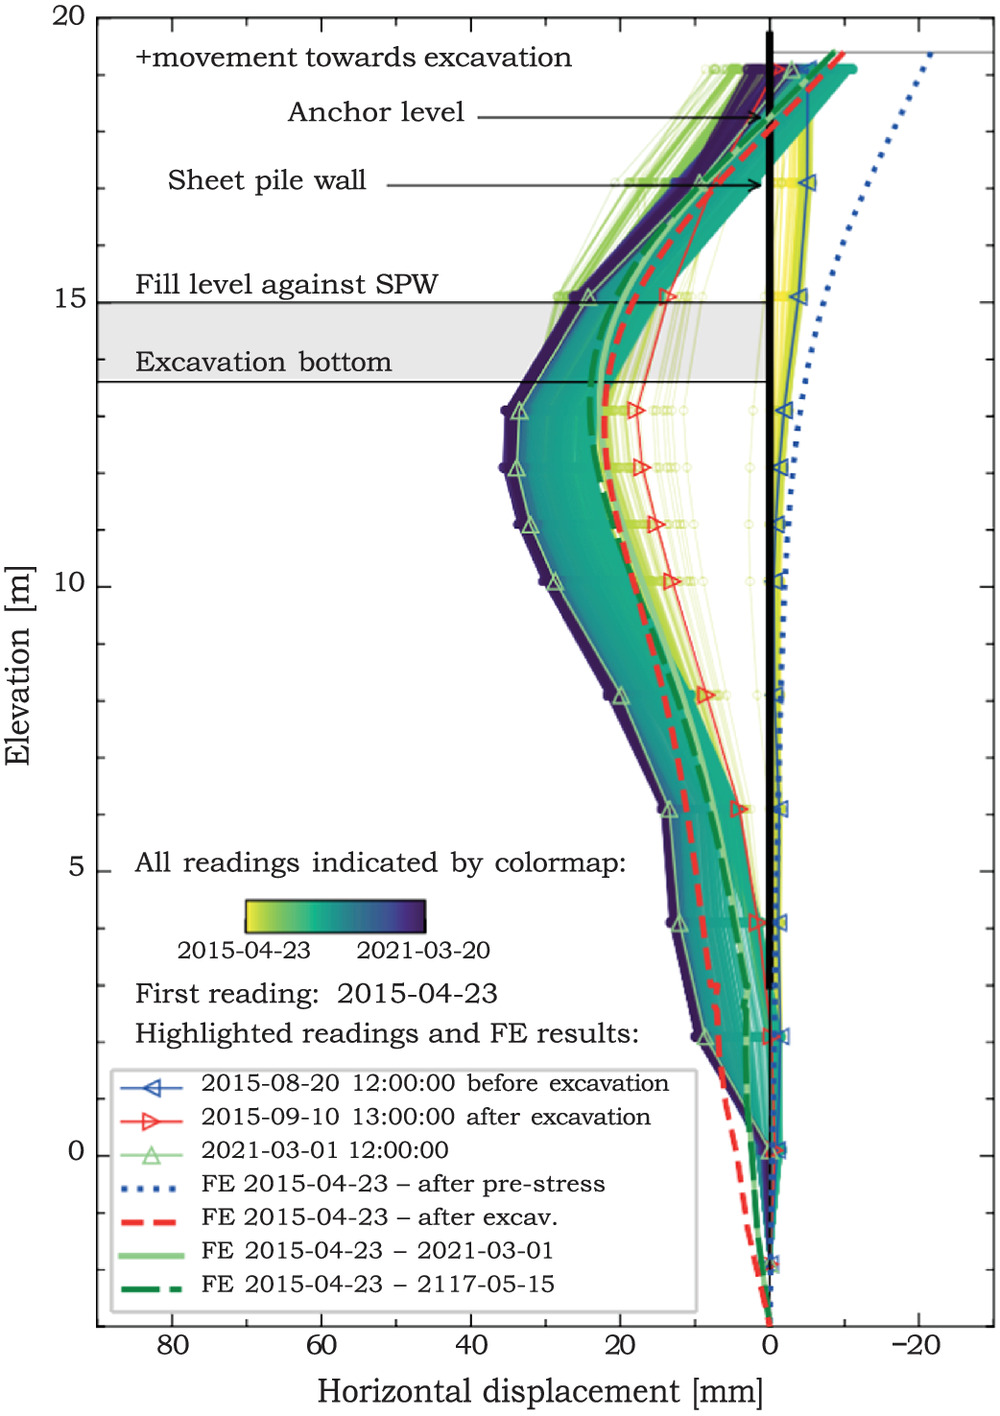
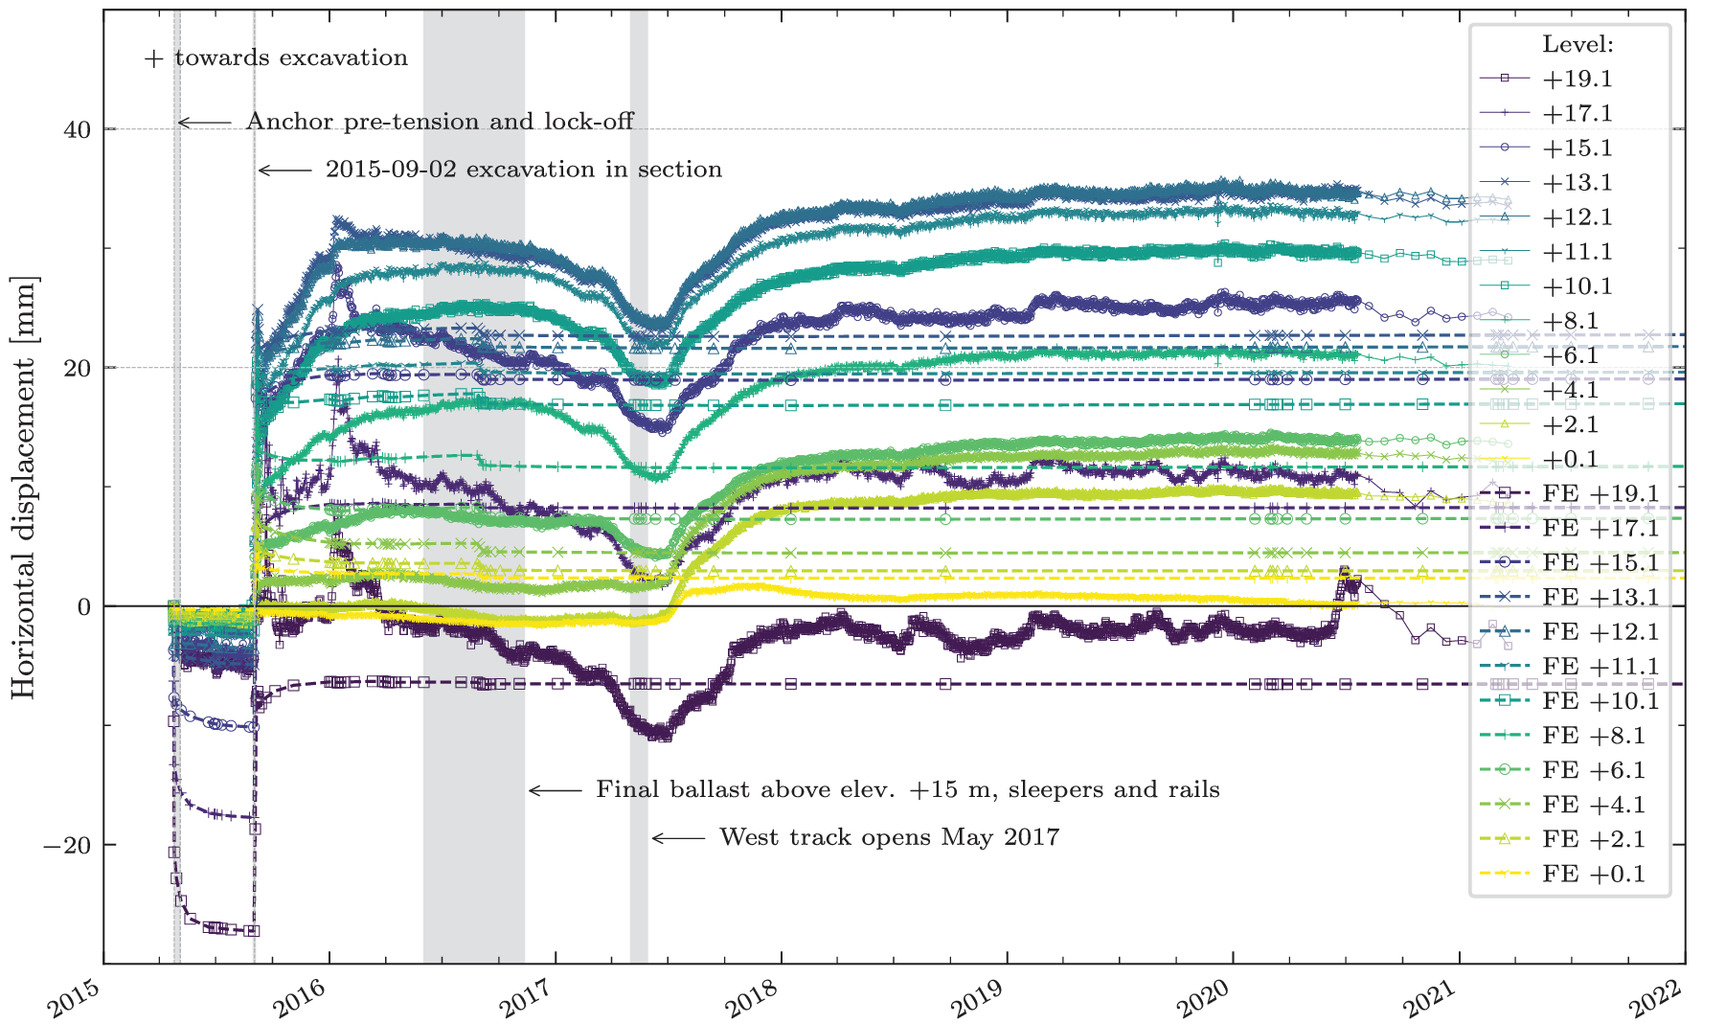
It can also be seen in Fig. 11 that the simulation of the anchor prestressing resulted in excessive computed displacements “away” from the excavation, which contributed to the offset in measured and computed displacements in subsequent phases. During mid-2016 to mid-2017, the monitoring data (Fig. 12) indicated movement of the sheet pile wall toward the retained soil. A physical reason for this deviating trend could be the placing of the final ballast layer (above elevation ) and the opening of the West track in May 2017, resulting in reloading on the excavated side. The deviating trend was, however, not indicated by the computed results.
The computed horizontal displacements did not increase significantly with time (May 15, 2117 in Fig. 11 corresponds to 100 years after the track was opened in 2017). If the SPW would have been installed as a “floating” wall in the clay layer, most likely larger (creep) displacements would evolve in time. Such displacements due to the increase of shear stresses would depend on the degree of the shear strength mobilization that the excavation impose in the clay layers. Furthermore, corrosion of the SPW was not included in the long-term analysis (Table 5 phase 14). However, accounting for a corrosion rate in the range of per side of the AZ24-700 SPW during 100 years had a small to negligible impact on the computed displacements.
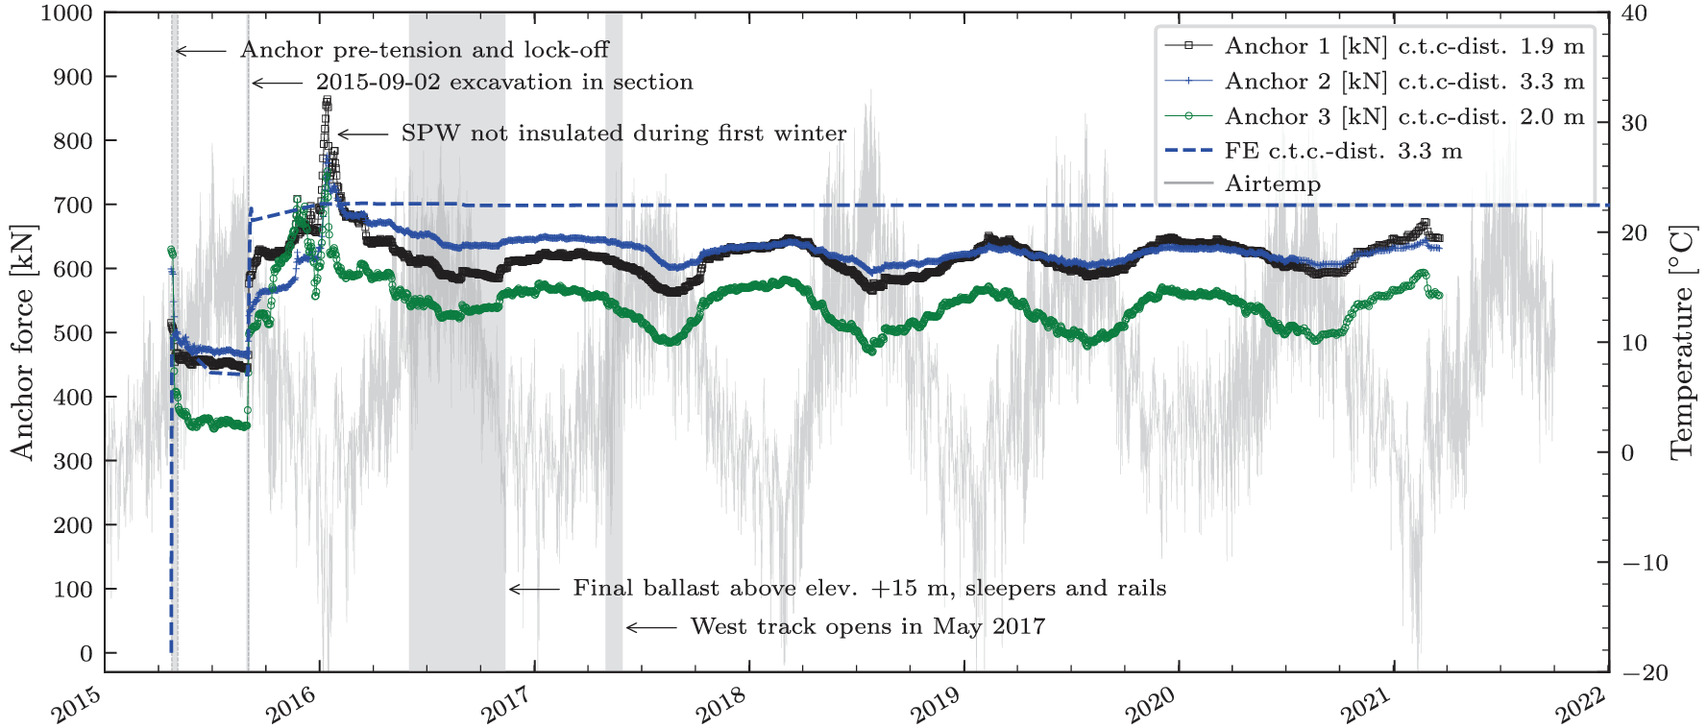
Fig. 13 presents the measured and computed anchor forces, as well as the air temperature, versus time. Anchors 1, 2 and 3 are located at sections 3+612, 3+617, and 3+623. The c.t.c. distances vary (as previously mentioned) due to the location of some existing and new pipes. The c.t.c. distances in Fig. 13 respresent the average distances to neighboring anchors. In the FE-simulation, a c.t.c. distance of 3.3 m was used to resemble the middle anchor, “2,” located in 3+617. The prestress force was set to 500 kN, chosen to resemble the force applied to anchor 2. As annotated in Fig. 13, the SPW insulation in the form of gabions including 0.1 m of insulation was not yet finalized during the cold winter of 2015–2016. This resulted in a 30%–40% increase of anchor loads before temporary measures were taken (coating the SPW with tarps and then heating). Except for this peak in measured force and continued seasonal temperature dependence, the computed force shows good agreement, although the computed results overestimate the measured anchor 2 force by 50–100 kN or . The anchors with smaller c.t.c. distances attract higher loads per meter wall (than computed with c.t.c. 3.3 m)—which is expected due to increased restraint on ground displacements.
Conclusions
This paper presents an original case study on the long-term performance of a permanent sheet pile wall in soft sensitive clay, in Uppsala, Sweden. Monitoring data comprises the temporal response of displacements and anchor forces, from the construction (short-term) to the serviceability stage covering the long-term performance. The monitoring data was compared with the computed displacements and anchor forces using the Creep-SClay1S model to simulate the response of the soft sensitive clay layers. The motivation for using the Creep-SClay1S model is that it accounts for characteristic features of soft sensitive clay such as anisotropy, destructuration, and rate-dependency. Including these features enables to capture the complex soil response and account for the background settlements due to the historic pumping of groundwater in the area.
An objective of this paper was to highlight the challenges in modeling the initial conditions (before construction) in an area of soft sensitive clay with historic anthropogenic loading, in the studied case caused by decades of groundwater drawdown. Since soil properties prior to the historic drawdown were and remain unknown, an iterative approach was used. The Creep-SClay1S state variables, primarily the destructuration, , and the isotropic overconsolidation ratio, , namely evolve during modeling of the drawdown. After some iterations it was possible to get reasonable values for evolved (in line with measured sensitivity), whereas evolved to somewhat higher values than indicated by the analyses of the laboratory results. This resulted in an underestimation of the present day settlement rate, to which cyclic loading (unaccounted for in the modeling) may have contributed, due to accumulated destructuration of the sensitive clay.
Regardless, the Creep-SClay1S model captures the response of the construction and serviceability stage of the permanent sheet pile wall in soft sensitive clay with good accuracy. The main advantage, in addition to the rate-dependency, is that one consistent parameter set can be used for the prediction of the temporal response in terms of wall displacements and anchor forces. This gives opportunities for model updating strategies where monitoring data is used with forecasting models to improve the prediction of the future response of geotechnical structures in sensitive clays.
Notation
The following symbols are used in this paper:
- apparent cohesion;
- undrained shear strength;
- Young’s modulus;
- oedometer stiffness;
- initial void ratio;
- shear modulus;
- earth pressure coefficient ();
- coefficient of earth pressure at rest;
- coefficient of earth pressure at rest for normally consolidated state;
- vertical and horizontal hydraulic conductivity (permeability), respectively;
- vertical hydraulic conductivity at in situ stress level;
- overconsolidation ratio;
- isotropic overconsolidation ratio;
- equivalent isotropic mean effective stress;
- equivalent isotropic mean effective preconsolidation pressure;
- sensitivity;
- natural water content;
- liquid limit;
- ()
- unit weight (submerged);
- vertical and horizontal effective stress, respectively;
- initial vertical effective stress;
- vertical preconsolidation pressure;
- friction angle; and
- critical state friction angle in triaxial compression.
Data Availability Statement
Some or all data, models, or code that support the findings of this study are available from the corresponding author upon reasonable request.
Acknowledgments
The financial support provided by Skanska, SBUF (Development fund of the Swedish construction industry, Grant 13995), BIG (Better Interaction in Geotechnics, Grant A2021-06, from the Swedish Transport Administration) and Formas (Grant 2019-00456) are greatly acknowledged. The work is done as part of Digital Twin Cities Centre that is supported by Sweden’s Innovation Agency VINNOVA under Grant No. 2019-00041. Finally, the authors would like to thank Anna Gjers (Swedish Transport Administration) and Dr. Rasmus Müller (Tyréns) for providing details regarding monitoring data and the construction process. Thanks are also due to, at Chalmers University of Technology; Dr. Georgios Birmpilis for assistance during the laboratory investigations and to Prof. Jelke Dijkstra and Dr. Ayman Abed for their valuable comments on the manuscript.
References
Bertoldo, F., and L. Callisto. 2019. “Delayed response of excavations in structured clays.” Can. Geotech. J. 56 (11): 1584–1595. https://doi.org/10.1139/cgj-2018-0512.
Bjerrum, L. 1967. “Engineering geology of norwegian normally-consolidated marine clays as related to settlements of buildings.” Géotechnique 17 (2): 83–118. https://doi.org/10.1680/geot.1967.17.2.83.
Bjerrum, L., C. J. Frimann Clausen, and J. M. Duncan. 1972. “Earth pressures on flexible structures.” In Proc., 5th European Conf. Soil Mechanics and Foundation Engineering, 169–196. Madrid, Spain: International Society for Soil Mechanics and Geotechnical Engineering.
Carder, D. R., and P. Darley. 1998. The long term performance of embedded retaining walls. Crowthorne, UK: Transport Research Laboratory.
Carder, D. R., G. V. R. Watson, R. J. Chandler, and W. Powrie. 1999. “Long-term performance of an embedded retaining wall with a stabilizing base slab.” Proc. Inst. Civ. Eng. Geotech. Eng. 137 (2): 63–74. https://doi.org/10.1680/gt.1999.370201.
Clough, G. W., and M. W. Reed. 1984. “Measured behavior of braced wall in very soft clay.” J. Geotech. Eng. 110 (1): 1–19. https://doi.org/10.1061/(ASCE)0733-9410(1984)110:1(1).
Corral, G., and A. J. Whittle. 2010. “Re-analysis of deep excavation collapse using a generalized effective stress soil model.” In Proc., Earth Retention Conf. Reston, VA: ASCE.
Dong, Y. P., H. J. Burd, and G. T. Houlsby. 2016. “Finite-element analysis of a deep excavation case history.” Géotechnique 66 (1): 1–15. https://doi.org/10.1680/jgeot.14.P.234.
Eriksson, J. A. 1999. “Land-use history in Gamla Uppsala.” Laborativ Arkeologi 12 (6): 25–34.
Finno, R. J., D. K. Atmatzidis, and S. B. Perkins. 1989. “Observed performance of a deep excavation in clay.” J. Geotech. Eng. 115 (8): 1045–1064. https://doi.org/10.1061/(ASCE)0733-9410(1989)115:8(1045).
Finno, R. J., J. T. Blackburn, and J. F. Roboski. 2007. “Three-dimensional effects for supported excavations in clay.” J. Geotech. Geoenviron. Eng. 133 (1): 30–36. https://doi.org/10.1061/(ASCE)1090-0241(2007)133:1(30).
Finno, R. J., and M. Calvello. 2005. “Supported excavations: Observational method and inverse modeling.” J. Geotech. Geoenviron. Eng. 131 (7): 826–836. https://doi.org/10.1061/(ASCE)1090-0241(2005)131:7(826).
Fréden, C. 2002. Berg och jord—Sveriges nationalatlas [Rock and soil—National atlas of Sweden]. Stockholm, Sweden: Sveriges nationalatlas.
Fryksten, J., and F. Nilfouroushan. 2019. “Analysis of clay-induced land subsidence in Uppsala City using Sentinel-1 SAR data and precise leveling.” Remote Sens. 11 (23): 2764. https://doi.org/10.3390/rs11232764.
Gras, J. P., N. Sivasithamparam, M. Karstunen, and J. Dijkstra. 2018. “Permissible range of model parameters for natural fine-grained materials.” Acta Geotech. 13 (2): 387–398. https://doi.org/10.1007/s11440-017-0553-1.
Hashash, Y. M. A., and A. J. Whittle. 1996. “Ground movement prediction for deep excavations in soft clay.” J. Geotech. Eng. 122 (6): 474–486. https://doi.org/10.1061/(ASCE)0733-9410(1996)122:6(474).
Hashash, Y. M. A., and A. J. Whittle. 2002. “Mechanisms of load transfer and arching for braced excavations in clay.” J. Geotech. Geoenviron. Eng. 128 (3): 187–197. https://doi.org/10.1061/(ASCE)1090-0241(2002)128:3(187).
Hummel, A. 2014. “Skattning av den integrerade hydrauliska konduktivitetens variation kring Tunåsens infiltrationsanläggning” [Estimate of the variation of the integrated hydraulic conductivity around Tunåsen infiltration facility]. [In Swedish]. Ph.D. thesis, Dept. of Earth Sciences, Uppsala Univ.
Ignat, R., S. Baker, M. Karstunen, S. Liedberg, and S. Larsson. 2020. “Numerical analyses of an experimental excavation supported by panels of lime-cement columns.” Comput. Geotech. 118 (16): 103296. https://doi.org/10.1016/j.compgeo.2019.103296.
Jáky, J. 1944. “The coefficient of earth pressure at rest.” J. Soc. Hungarian Archit. Eng. 30 (4): 647–666. https://doi.org/10.1139/t93-056.
Karlsrud, K., and L. Andresen. 2005. “Loads on braced excavations in soft clay.” Int. J. Geomech. 5 (2): 107–113. https://doi.org/10.1061/(ASCE)1532-3641(2005)5:2(107).
Karlsson, M., A. Emdal, and J. Dijkstra. 2016. “Consequences of sample disturbance when predicting long-term settlements in soft clay.” Can. Geotech. J. 53 (12): 1965–1977. https://doi.org/10.1139/cgj-2016-0129.
Karstunen, M., and M. Koskinen. 2008. “Plastic anisotropy of soft reconstituted clays.” Can. Geotech. J. 45 (3): 314–328. https://doi.org/10.1139/T07-073.
Karstunen, M., H. Krenn, S. J. Wheeler, M. Koskinen, and R. Zentar. 2005. “Effect of anisotropy and destructuration on the behavior of Murro test embankment.” Int. J. Geomech. 5 (2): 87–97. https://doi.org/10.1061/(ASCE)1532-3641(2005)5:2(87).
Koskinen, M. 2014. “Plastic anisotropy and destructuration of soft Finnish clays.” Ph.D. thesis, Dept. of Civil and Environmental Engineering, Aalto Univ.
Koskinen, M., M. Karstunen, and S. J. Wheeler. 2002. “Modelling destructuration and anisotropy of a natural soft clay.” In Proc., 5th European Conf. on Numerical Method Geotechnical Engineering, 11–20. Paris: Presses de l’ENPC/LCPC.
Lambe, T. W. 1973. “Predictions in soil engineering.” Géotechnique 23 (2): 151–202. https://doi.org/10.1680/geot.1973.23.2.151.
Larsson, R. 1981. Drained behaviour of Swedish clays. Linköping, Sweden: Swedish Geotechnical Institute.
Larsson, R. 2007. Långtidsobservationer av konsolideringsprocesser [Long-term observations of consolidation processes]. Linköping, Sweden: Swedish Geotechnical Institute.
Larsson, R. 2015. CPT-sondering, utrustning-utförande-utvärdering [CPT-sounding, equipment-execution-evaluation]. Linköping, Sweden: Swedish Geotechnical Institute.
Larsson, R., and G. Sallfors. 1986. Automatic continuous consolidation testing in Sweden. West Conshohocken, PA: ASTM.
Larsson, R., G. Sällfors, P. Bengtsson, C. Alén, U. Bergdahl, and L. Eriksson. 2007. Skjuvhållfasthet—Utvärdering i kohesionsjord [Shear strength—Evaluation in cohesive soil]. Linköping, Sweden: Swedish Geotechnical Institute.
Lundin, S.-E. 1991. Ingenjörsgeologisk kartering [Engineering geological mapping]. Linköping, Sweden: Swedish Geotechnical Institute.
Lunne, T., T. Berre, and S. Strandvik. 1997. “Sample disturbance effects in soft low plastic Norwegian clay.” In Proc., Symp. on Recent Developments in Soil and Pavement Mechanics, 81–102. Rotterdam, Netherlands: A.A. Balkema.
Müller, R., and S. Larsson. 2012. “Hydraulic conductivity and coefficient of consolidation of two Sulphide clays in Sweden.” Geotech. Geol. Eng. 30 (1): 173–186. https://doi.org/10.1007/s10706-011-9459-0.
O’Leary, F., M. Long, and M. Ryan. 2016. “The long-term behaviour of retaining walls in Dublin.” Proc. Inst. Civ. Eng. Geotech. Eng. 169 (2): 99–109. https://doi.org/10.1680/jgeen.15.00041.
Osman, A. S., and M. D. Bolton. 2006. “Ground movement predictions for braced excavations in undrained clay.” J. Geotech. Geoenviron. Eng. 132 (4): 465–477. https://doi.org/10.1061/(ASCE)1090-0241(2006)132:4(465).
Peck, R. B. 1969. “Deep excavations and tunneling in soft ground.” In Proc., 7th Int. Conf. on Soil Mechanics and Foundation Engineering, 225–290. London: International Society for Soil Mechanics and Geotechnical Engineering.
Petalas, A. L., M. Karlsson, and M. Karstunen. 2019. “Modelling of undrained shearing of soft natural clays.” In Vol. 92 of Proc., 7th Int. Symp. on Deformation Characteristics of Geomaterials (IS-Glasgow 2019), 15001. Paris: EDP Sciences. https://doi.org/10.1051/e3sconf/20199215001.
Potts, D. M., and A. B. Fourie. 1984. “The behaviour of a propped retaining wall: Results of a numerical experiment.” Géotechnique 34 (3): 383–404. https://doi.org/10.1680/geot.1984.34.3.383.
Richards, D. J., W. Powrie, H. Roscoe, and J. Clark. 2007. “Pore water pressure and horizontal stress changes measured during construction of a contiguous bored pile multi-propped retaining wall in Lower Cretaceous clays.” Géotechnique 57 (2): 197–205. https://doi.org/10.1680/geot.2007.57.2.197.
Ringesten, B. 1988. “Dry crust: Its formation and geotechnical properties.” Ph.D. thesis, Dept. of Geotechnical Engineering, Chalmers Univ.
Rouainia, M., G. Elia, S. Panayides, and P. Scott. 2017. “Nonlinear finite-element prediction of the performance of a deep excavation in Boston blue clay.” J. Geotech. Geoenviron. Eng. 143 (5): 04017005. https://doi.org/10.1061/(ASCE)GT.1943-5606.0001650.
Sällfors, G., and R. Larsson. 2016. Bestämningar av odränerad skjuvhållfasthet med specialiserade metoder i praktiska tillämpningar. Gothenburg, Sweden: Trafikverket.
Scharinger, F., H. F. Schweiger, and G. N. Pande. 2009. “On a multilaminate model for soil incorporating small strain stiffness.” Int. J. Numer. Anal. Methods Geomech. 33 (2): 215–243. https://doi.org/10.1002/nag.710.
Schmidt, B. 1966. “Discussion of: Earth pressures at rest related to stress history.” Can. Geotech. J. 3 (4): 239–242. https://doi.org/10.1139/t66-028.
Sidenvall, J. 1981. “Fossil ground water of marine origin in the Uppsala Area, Sweden.” In Proc., 7th Salt Water Intrusion Meeting, 40–44. Uppsala, Sweden: Geological Survey of Sweden.
Sivasithamparam, N., M. Karstunen, and P. Bonnier. 2015. “Modelling creep behaviour of anisotropic soft soils.” Comput. Geotech. 69 (2015): 46–57. https://doi.org/10.1016/j.compgeo.2015.04.015.
Stille, H. 1976. “Behaviour of anchored sheet pile walls.” Ph.D. thesis, Dept. of Soil and Rock Mechanics, Royal Institute of Tech.
Summersgill, F. C., S. Kontoe, and D. M. Potts. 2018. “Stabilisation of excavated slopes in strain-softening materials with piles.” Géotechnique 68 (7): 626–639. https://doi.org/10.1680/jgeot.17.P.096.
Tan, Y., and S. G. Paikowsky. 2008. “Performance of sheet pile wall in peat.” J. Geotech. Geoenviron. Eng. 134 (4): 445–458. https://doi.org/10.1061/(ASCE)1090-0241(2008)134:4(445).
Tavenas, F., P. Jean, P. Leblond, and S. Leroueil. 1983. “The permeability of natural soft clays. Part II: Permeability characteristics.” Can. Geotech. J. 20 (4): 645–660. https://doi.org/10.1139/t83-073.
Tornborg, J., M. Karlsson, A. Kullingsjö, and M. Karstunen. 2021. “Modelling the construction and long-term response of Göta Tunnel.” Comput. Geotech. 134 (33): 104027. https://doi.org/10.1016/j.compgeo.2021.104027.
Ukritchon, B., A. J. Whittle, and S. W. Sloan. 2003. “Undrained stability of braced excavations in clay.” J. Geotech. Geoenviron. Eng. 129 (8): 738–755. https://doi.org/10.1061/(ASCE)1090-0241(2003)129:8(738).
Wheeler, S. J., A. Näätänen, M. Karstunen, and M. Lojander. 2003. “An anisotropic elastoplastic model for soft clays.” Can. Geotech. J. 40 (2): 403–418. https://doi.org/10.1139/t02-119.
Whittle, A. J., G. Corral, L. C. Jen, and R. P. Rawnsley. 2015. “Prediction and performance of deep excavations for Courthouse Station, Boston.” J. Geotech. Geoenviron. Eng. 141 (4): 04014123. https://doi.org/10.1061/(ASCE)GT.1943-5606.0001246.
WSP. 2021. “Settlement map.” Accessed June 3, 2021. https://sättningskartan.se/en-us/.
Xiao, H., S. Zhou, and Y. Sun. 2019. “Wall deflection and ground surface settlement due to excavation width and foundation pit classification.” KSCE J. Civ. Eng. 23 (4): 1537–1547. https://doi.org/10.1007/s12205-019-1712-8.
Zdravkovic, L., D. M. Potts, and H. D. John. 2005. “Modelling of a 3D excavation in finite element analysis.” Géotechnique 55 (7): 497–513. https://doi.org/10.1680/geot.2005.55.7.497.
Zhou, C., J.-H. Yin, J.-G. Zhu, and C.-M. Cheng. 2005. “Elastic anisotropic viscoplastic modeling of the strain-rate-dependent stress—Strain behavior of -consolidated natural marine clays in triaxial shear tests.” Int. J. Geomech. 5 (3): 218–232. https://doi.org/10.1061/(ASCE)1532-3641(2005)5:3(218).
Zuada Coelho, B., J. Dijkstra, and M. Karstunen. 2021. “Viscoplastic cyclic degradation model for soft natural soils.” Comput. Geotech. 135 (Apr): 104176. https://doi.org/10.1016/j.compgeo.2021.104176.
Information & Authors
Information
Published In

Journal of Geotechnical and Geoenvironmental Engineering
Volume 149 • Issue 6 • June 2023
Copyright
This work is made available under the terms of the Creative Commons Attribution 4.0 International license, https://creativecommons.org/licenses/by/4.0/.
History
Received: Apr 8, 2022
Accepted: Dec 20, 2022
Published online: Apr 11, 2023
Published in print: Jun 1, 2023
Discussion open until: Sep 11, 2023
Authors
Metrics & Citations
Metrics
Citations
Download citation
If you have the appropriate software installed, you can download article citation data to the citation manager of your choice. Simply select your manager software from the list below and click Download.