Foundation Settlement and Tilt of Millennium Tower in San Francisco, California
Publication: Journal of Geotechnical and Geoenvironmental Engineering
Volume 149, Issue 6
Abstract
The Millennium Tower is a 58-story reinforced concrete building that was constructed in San Francisco, California, between 2005 and 2009. The Tower is founded on an embedded pile-supported mat with pile tips bearing in dense marine deposits that overlie an overconsolidated marine clay layer known locally as Old Bay clay. This clay layer experienced stress increases from Tower self-weight and from multiple episodes of dewatering between 2006 and 2018 at the Tower site and neighboring sites, including one that was sustained for 6 years. Settlements of the Tower foundation have been measured since 2006, and lateral deflections of the Tower have been inferred and measured since 2009. The data show that during multiple episodes of “loading” (from stress increase or dewatering), settlements initially accelerated and then gradually slowed over time, as expected from consolidation principles. Similarly, lateral deflections (from foundation tilt) (1) accelerated following foundation construction activities at adjacent sites (dewatering and excavation); and (2) oriented toward adjacent excavations, which at various times occurred to the project south, north, east, and west of the Tower site. An objective of this paper is to describe this case history, including the geotechnical site conditions and results of a monitoring program that tracked foundation settlements, Tower tilt, groundwater levels at the Tower site, and ground inclinations over time. We also evaluate soil deformation mechanisms that likely produced the movements. We find that settlement amounts and time variations are well captured by one-dimensional and three-dimensional analyses of volume change in Old Bay clay and other foundation soils from primary consolidation and secondary compression, provided that time variations of stress increase and groundwater level are accounted for. Three-dimensional analyses also capture time variations of lateral deflections, which were caused by volume change and shear deformations in foundation soils, the latter having been affected by unloading from adjacent excavations.
Introduction
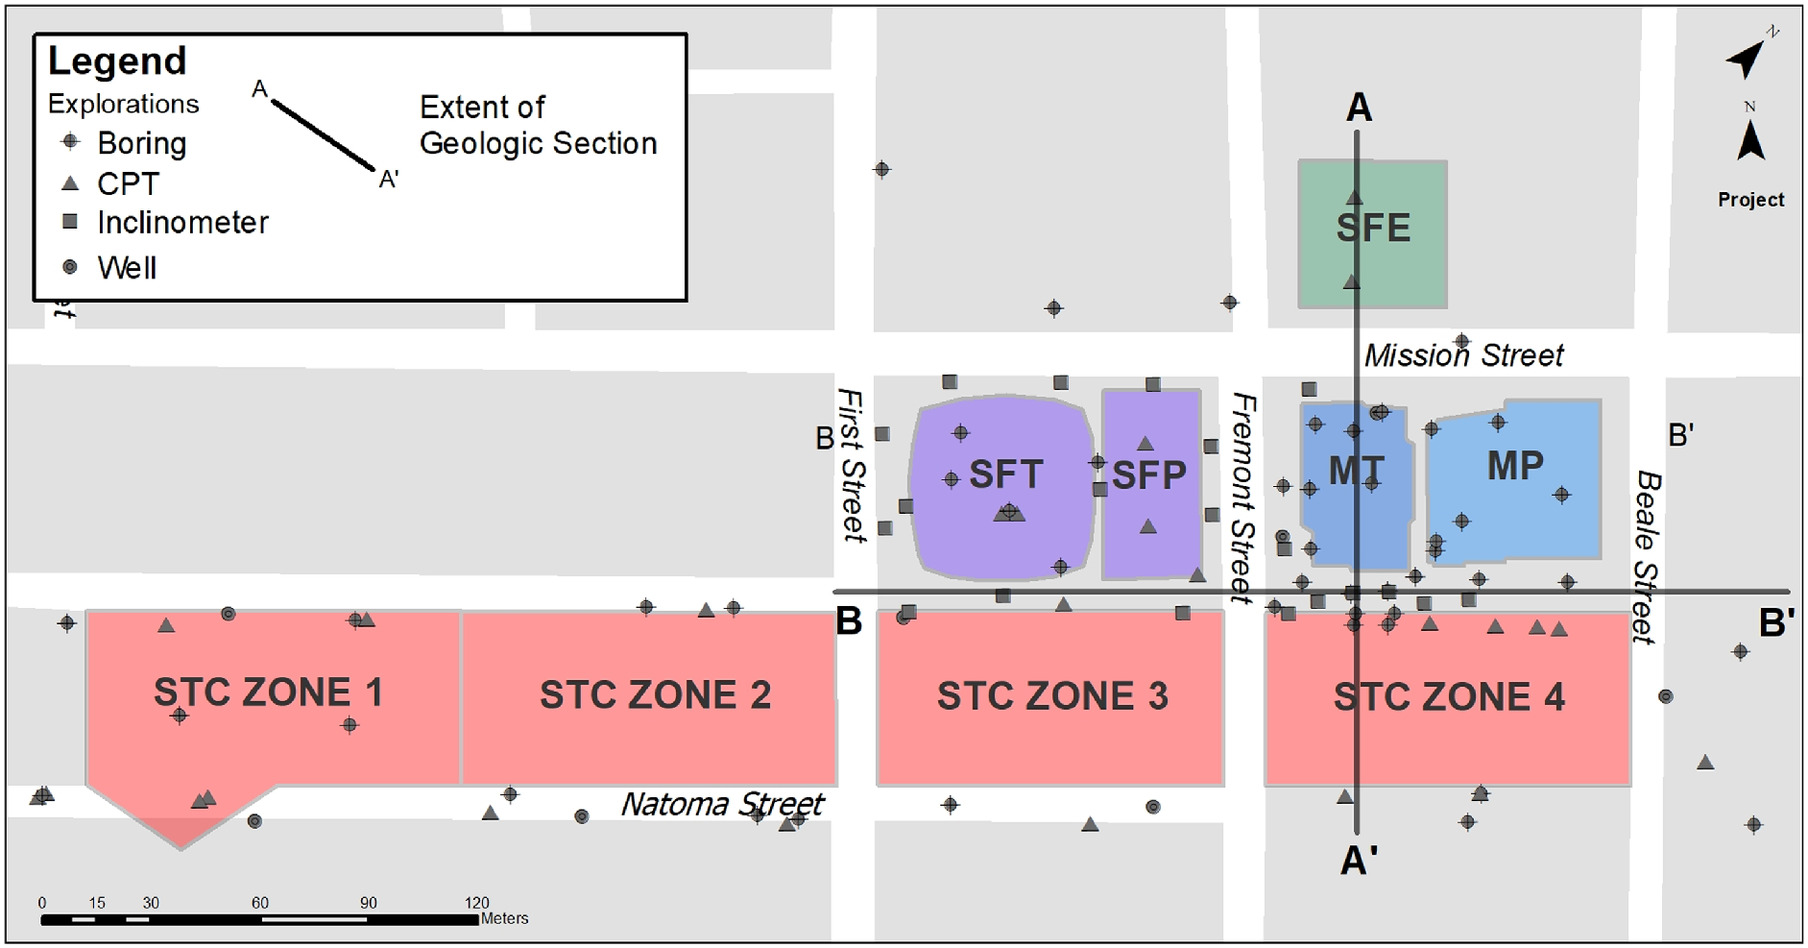
The Millennium Tower (referred to herein as the “Tower” in the text and as “MT” in figures) was constructed at the southeast corner of Mission and Fremont Streets in San Francisco, California, between 2005 and 2009 (Fig. 1). The Tower has 58 floors (approximately 184 m tall) and one basement level. An adjoining midrise and podium (MP) were constructed concurrently with the Tower on the same city block. Following Tower construction, major neighboring developments were constructed from 2011 to 2017 to the project south and west (Salesforce Transit Center, STC; known initially as the Transbay Transit Center), to the project north (Salesforce East, SFE), and to the project west (Salesforce Tower and Plaza, SFT and SFP).
The Tower began to settle during construction, and by approximately March 2008, settlements had exceeded the original geotechnical report estimate. The rate of initial settlements slowed with time following construction, and settlement estimates were updated in February 2009 as part of a permitting process prior to Tower occupancy. Multiple episodes of accelerated foundation settlement and tilt, which were recorded as part of a monitoring program, occurred in subsequent years.
The settlement and tilt of the Tower attracted media attention (e.g., CBS 2017), and eventually disputes arose between various parties as to the cause of the foundation movements and what (if any) mitigation measures should be undertaken. The data and interpretations presented here were initially developed during legal proceedings.
This case history has value as a data set of multiepoch recorded foundation movements, several eras of which provide insights into mechanisms by which dewatering and deep excavations can affect adjacent structures and that can be used to validate various analysis methods. The aims of this paper are to (1) objectively document the foundation movement data and other data on groundwater levels and ground inclination profiles so that the information can be accessed and used by geotechnical engineers, (2) interpret and analyze the data to illustrate the volumetric and shear soil deformation mechanisms that caused the foundation movements, and (3) evaluate whether the observed movements could be predicted using one-dimensional and three-dimensional analytical models. We do not evaluate what could have been done differently during foundation design, nor do we analyze hypotheticals in which certain elements of the case history were not present. Moreover, we do not address the design and construction of the foundation remediation for the Tower, which is ongoing as of this writing.
Subsequent sections present site characteristics, structure characteristics, and results of field monitoring programs. We interpret the collective data set and describe mechanisms of foundation movement suggested by the data. We describe one-dimensional analyses that illustrate the extent to which volume change from consolidation and secondary compression can explain observed settlement variations over time. We also present three-dimensional analyses that elucidate the impacts of combined volumetric and shear deformations on settlements and lateral deflections of the Tower foundation.
Site Characteristics
Geotechnical site conditions (stratigraphy, soil properties) near the Tower site have been investigated in a series of studies since 1967. The most critical stratigraphic interval is an overconsolidated marine clay locally known as Old Bay clay, for which extensive testing to establish stress history, undrained shear strength, consolidation, secondary compression, and index properties has been performed. Soil properties presented herein reflect the state of knowledge circa 2020, which is different from that at the time of foundation design.
Stratigraphy
Table 1 catalogs geotechnical investigations at the Tower and neighboring sites that were considered in developing models for layer stratigraphy and soil properties. Fig. 1 shows locations of borings and cone penetration test (CPT) soundings. A spreadsheet file in the Supplemental Materials contains example boring logs (Slate Geotechnical Consultants, Inc. 2019), and the “Data Availability” section provides information on how to access additional borings, CPT soundings, and other site data.
| Location | No. of borings | Max. depth [m (ft)] | Lab tests | Citation |
|---|---|---|---|---|
| 50 Beale | 7 | 76.2 (250) | — | Dames and Moore (1966), Boring logs for 50 Beale Street, San Francisco, California, prepared for Bechtel Corporation San Francisco Office Building by Skidmore, Owings & Merrill (SOM), January 17 [From Treadwell & Rollo, Inc. (2012)]. |
| 50 Fremont | 5 | 45.7 (150) | M/D, AL, TXUU, DS/CD | Dames and Moore (1981), Geotechnical Investigation, Proposed Five Fremont Center Project, San Francisco, California, prepared for Metropolitan Bechtel Shorenstein, March 13 [From Treadwell & Rollo, Inc. (2012)]. |
| 350 Mission | 2 (cone pene. tests only) | 15.8 (52) | — | Treadwell & Rollo, Inc. (1997), Geotechnical Investigation, 350 Mission Street Building Seismic Strengthening, San Francisco, California, Project No. 2152.01, July 3 [From Treadwell & Rollo, Inc. (2012)]. |
| 301 Mission | 7 | 67.1 (220) | M/D, G, AL, TXUU, ILC | Treadwell & Rollo, Inc. (2005), Revised Geotechnical Investigation 301 Mission Street, San Francisco, California, Project No. 3157.02, January 13. |
| STC | 22 | 106.7 (350) | M/D, AL, G, ILC, CRS, DS, DSS, TXICU, , TCUU, Sk | Arup North America, Ltd. (2010), Transbay Transit Center Program: Transbay Transit Center, Contract No. 08-04-CMGC-000, Volume 7A/B, February 26. |
| 415 Mission | 10 | 90.2 (296) | M/D, G, F, AL, ILC, CRS, TXICU, TXICD, C | Arup North America, Ltd. (2013), Transbay Tower Final Geotechnical Data Report, Job Number 229478-00, May 17. |
| 301 Mission | 3 | 57.0 (187) | — | Arup North America, Ltd. (2018), Memorandum, Salesforce Transit Center, Supplemental Instrumentation Installation, March 20. |
| 301 Mission | 1 | 51.5 (169) | M/D, SG, AL, TXUU, TXICU, ILC | SAGE Engineers, Inc. (2018), Data Report for Geotechnical Investigation and Piezometer Installation, 301 Mission Street, City and County of San Francisco, California, November 27. |
| 301 Mission | 2 | 79.3 (260) | ILC, CRS, HC | Slate Geotechnical Consultants, Inc. (2019), Geotechnical Investigation & Instrumentation Installation - Plenum Area, 301 Mission Street, San Francisco, California, July 19. |
Note: Laboratory test abbreviations: M/D = moisture/density; AL = Atterberg limits; G = gradation; F = fines percent; SG = specific gravity; Sk = slake durability; C = corrosivity; HC = (falling head) hydraulic conductivity; ILC = incremental loading consolidation; CRS = constant rate of strain consolidation; DS = direct shear; DSS = direct simple shear; DSCD = consolidated, drained direct shear, TXUU = unconfined, undrained triaxial compression; TXICU = isotropically consolidated, undrained triaxial compression; TXICD = isotropically consolidated, drained triaxial compression; and = -anisotropically consolidated, undrained triaxial compression.
The stratigraphy at the Tower and neighboring sites is illustrated in the cross-sections in Fig. 2. The north–south and east–west directions indicated in the section are oriented relative to “project-north” (parallel to Fremont Street, Fig. 1). As shown in Fig. 2, surficial soils at the site consist of heterogeneous fills ranging in thickness from approximately 4.6 to 7.6 m. The fill was removed during construction of the Tower and MP structures at the project site. Underlying the fill is a soft to medium stiff marine clay deposit, known locally as recent Bay deposits or upper young Bay mud (YBM), which ranges in thickness from 6.1 to 9.1 m (thicker on the west side of the Tower site). Underlying the upper YBM is a zone of dense clayey sand and sand with clay (labeled in Fig. 2 as “Marine Sands”), which in turn is underlain by interbedded stiff to very stiff sandy clay (labelled as “Lower Bay Mud”) and medium-dense to dense clayey sand and sand with clay (“Lower Marine Sands” or “Colma Sands”) to depths of approximately 27.4–30.5 m (elevation NAVD88 to ). This unit has historically been commonly used as a foundation bearing layer in this portion of San Francisco.
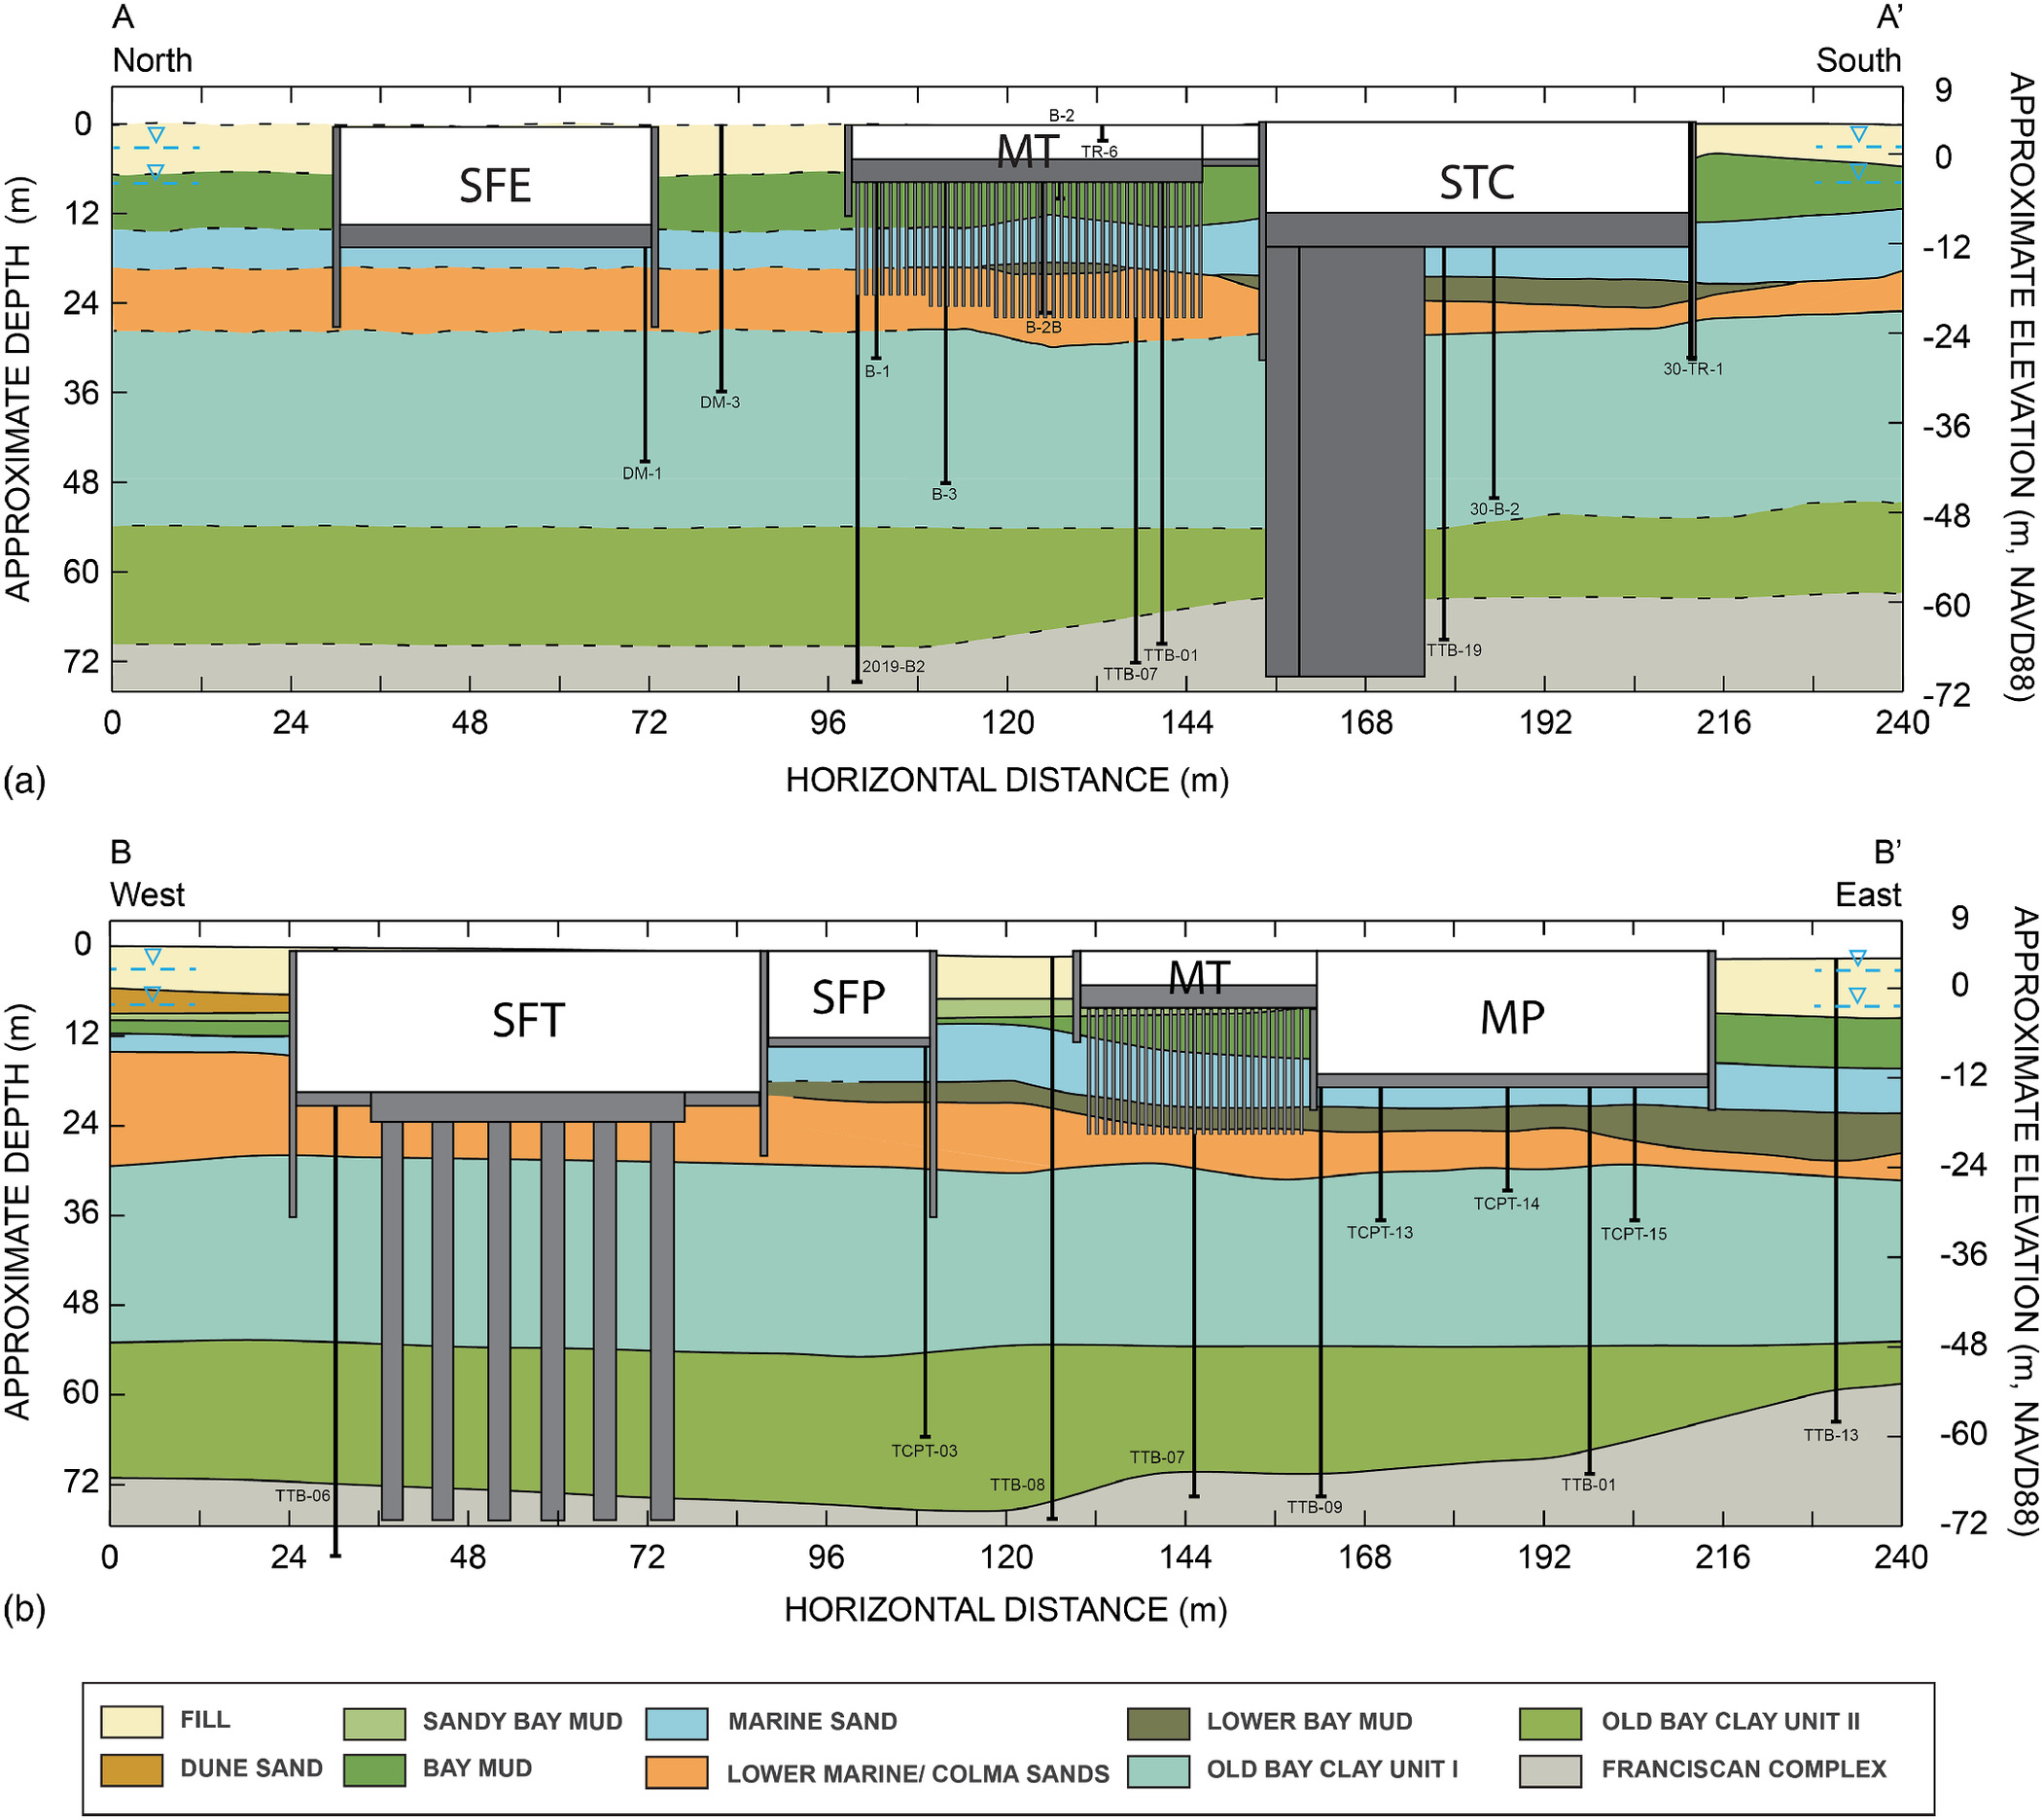
The Old Bay clay (OBC) unit underlies the lower marine/Colma sands. The OBC is divided into upper and lower units (Arup North America, Ltd. 2010), with the transition marked by a stiffer, sandier crust occurring at depths between approximately 48.8 and 54.9 m (elevation NAVD88 and ) depending on the location. The thickness of the upper OBC unit ranges from 21.3 to 24.4 m, being thickest (and encountered at the shallowest depth) on the west and north sides of the structure (Fig. 2). The thickness of the lower OBC unit ranges from 15.2 to 24.4 m depending on the location. The lower OBC unit is also referred to as the Alameda formation. Franciscan Complex bedrock underlies the lower OBC unit at depths ranging from about 67.0 to 76.2 m (elevation NAVD88 to within the Tower footprint). The Franciscan Complex bedrock is a mélange matrix locally characterized by very soft, weathered shale and occasional blocks of serpentinite and sandstone.
Properties of Old Bay Clay Layers
The OBC layer within the site profile has been the subject of multiple programs of laboratory testing in the investigations listed in Table 1. The soil specimens used in laboratory testing were derived from samples of variable quality, having been obtained from split-barrel driven samplers [standard penetration test (SPT), and larger diameter versions known locally as California samplers] and various pushed, thin-walled tube samplers (Shelby tubes, pitcher-barrel, various types of piston tubes). The investigations identified in the last five rows of Table 1 were not available at the time of the Tower design, but these data are considered here because our aim is not to interrogate the foundation design process but rather to document and evaluate the case history given currently available information.
We compiled laboratory test results from the various investigations (Table 1), focusing on thin-walled pushed tube samples for the case of consolidation and undrained strength properties. Consolidation properties compiled as a function of depth are (Fig. 3): preconsolidation pressure (), which is compared to preconstruction vertical effective stress in the figure; virgin and recompression strain indices ( and , respectively); secondary compression strain index following an increment of virgin compression (); and coefficient of consolidation following virgin or recompression load increments (). Consolidation properties of the layers overlying the OBC are not shown because the contributions to the overall settlement of the Tower from these layers are relatively small, as shown subsequently.
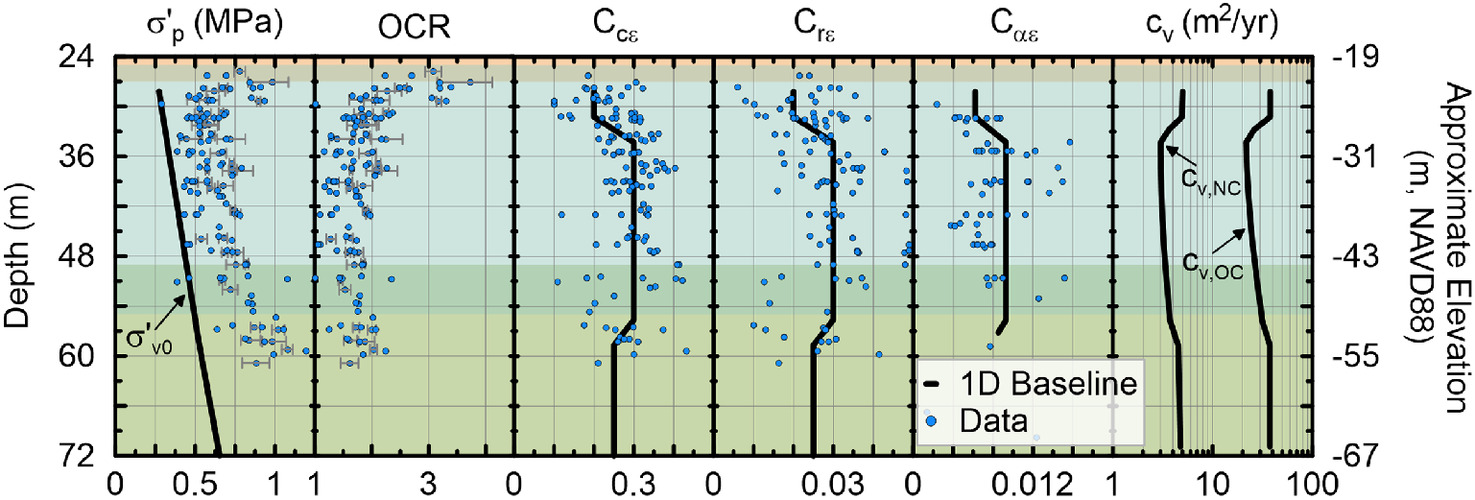
As shown in Fig. 3, prior to construction, the upper OBC unit was moderately overconsolidated [over-consolidation ratio (OCR) to 2.3] in the upper , reducing to OCRs of 1.6 to 1.7 at the base of this unit. This unit is also compressible (high compression indices) relative to lower OBC units. Secondary compression properties of the upper OBC unit were investigated to characterize response following primary consolidation (as in Fig. 3) and also following stress reduction (Wagner et al. 2021). We investigated whether OCR or compressibility parameters demonstrated a pattern of horizontal variability across the project site but did not identify systematic trends.
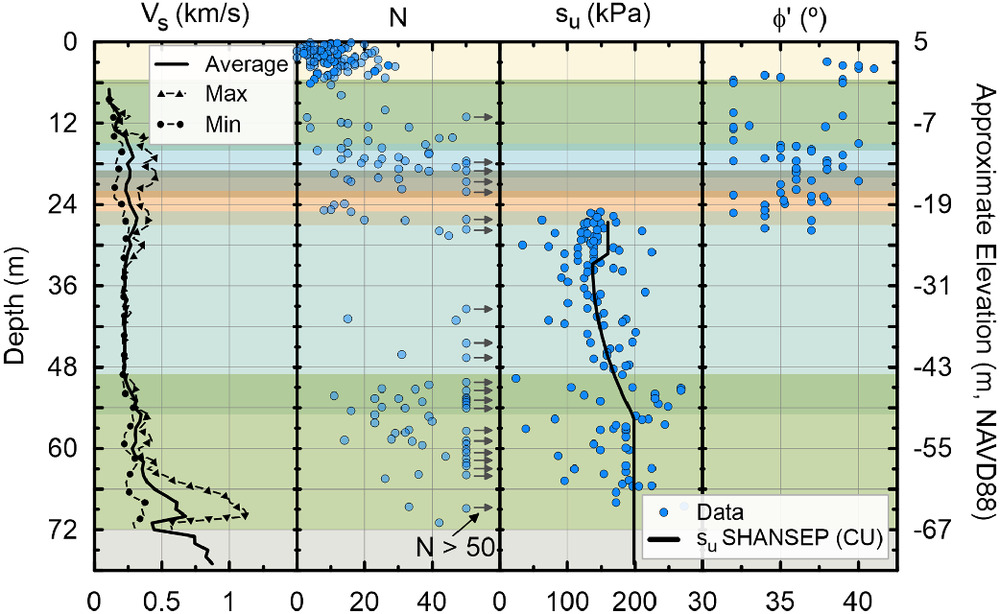
Fig. 4 shows stiffness and strength properties of OBC layers as reported in Arup North America, Ltd. (2010) (this report also includes such properties for other soil units). Stiffness is taken from in situ shear wave velocity () from downhole measurements near the Tower site. Indirect and direct strength data are compiled as SPT blow count (no energy or overburden correction applied) and laboratory and in situ undrained strength. The undrained strength data points in Fig. 4 are from unconsolidated–undrained triaxial compression tests. In addition, consolidated–undrained test programs that applied the SHANSEP approach (Ladd and Foote 1974) found normalized undrained strength parameters () of and (Arup North America, Ltd. 2009). An undrained strength profile based on those parameters and an OCR profile derived from preconsolidation pressures are shown in Fig. 4. Undrained strengths derived from additional pocket penetrometer and field torvane results are not shown in Fig. 4.
Structures
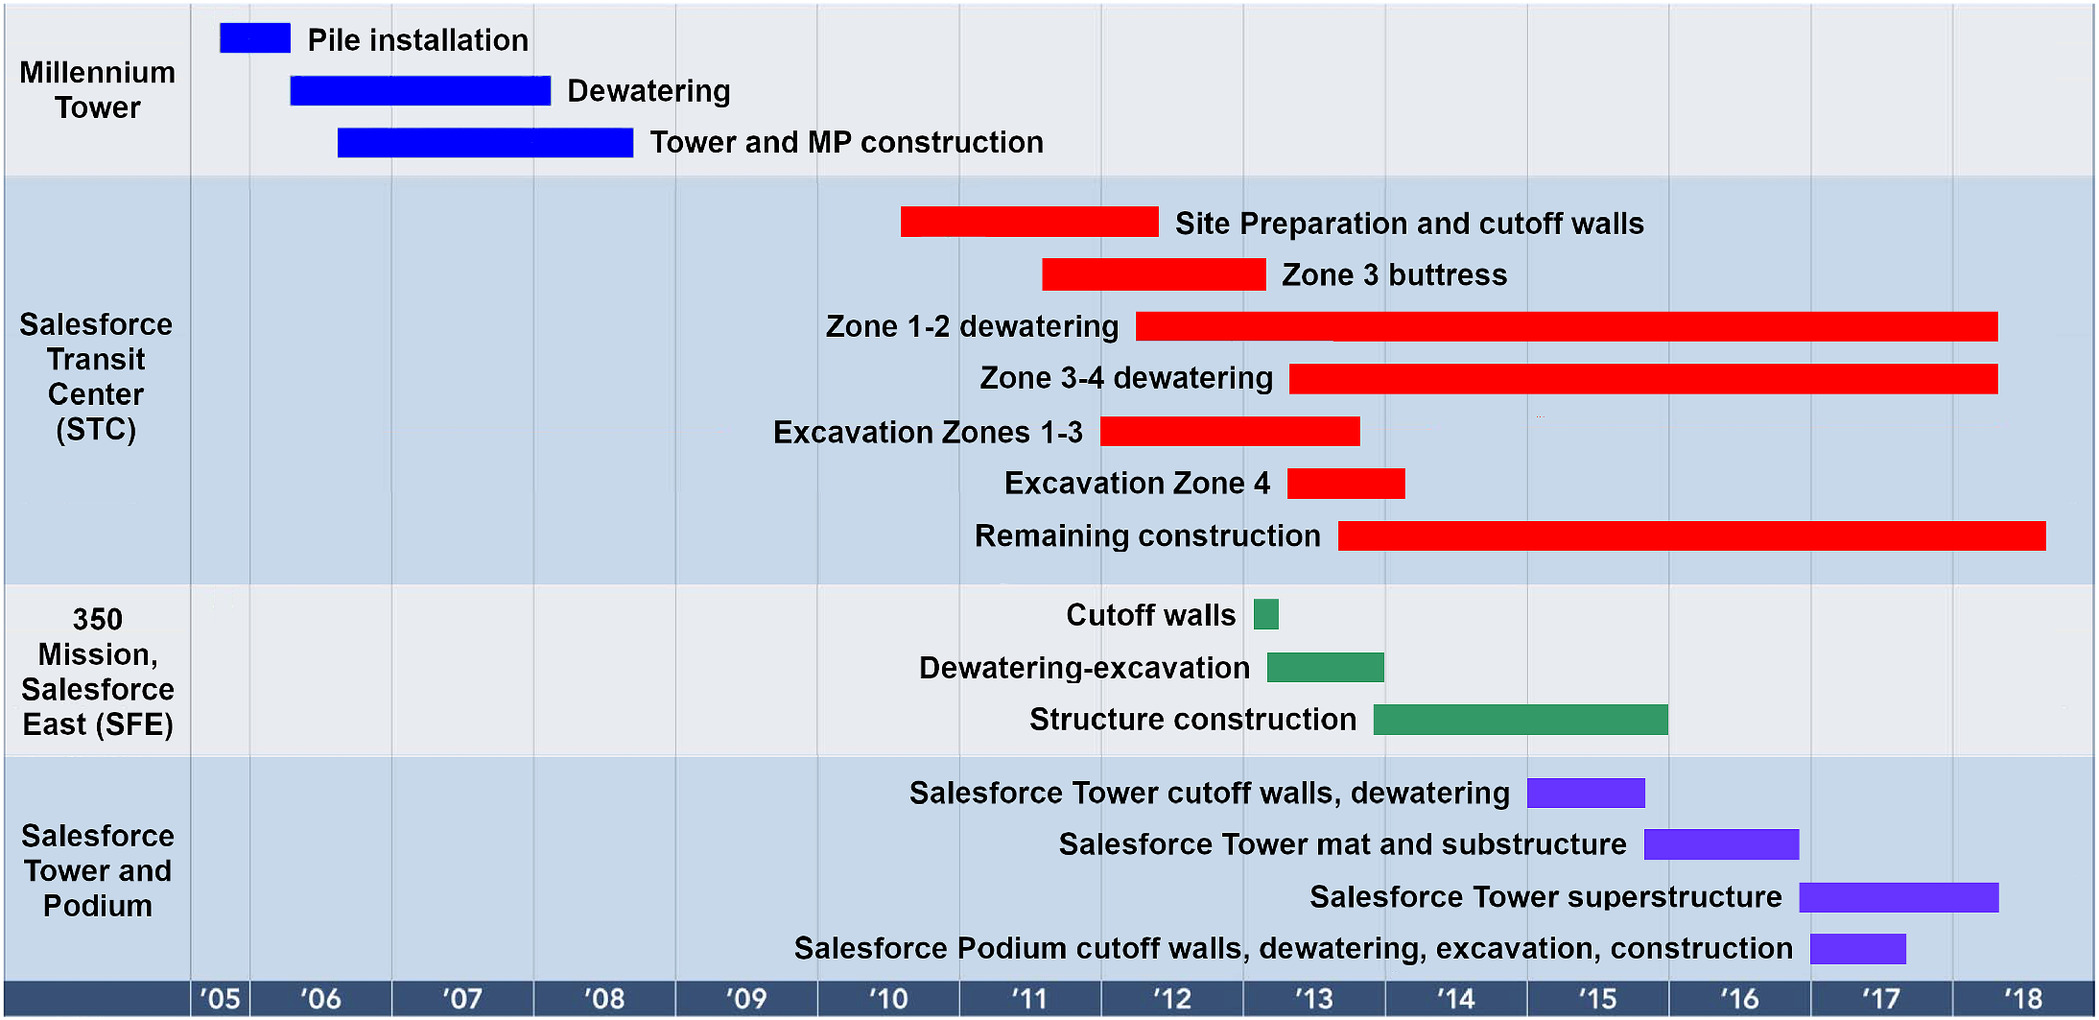
Fig. 5 shows a construction timeline for the Millennium Tower and the three major nearby projects. The following sections describe the Tower and pertinent foundation construction for adjacent projects. This information on features of the construction and their timing is important for understanding linkages to foundation performance.
Millennium Tower
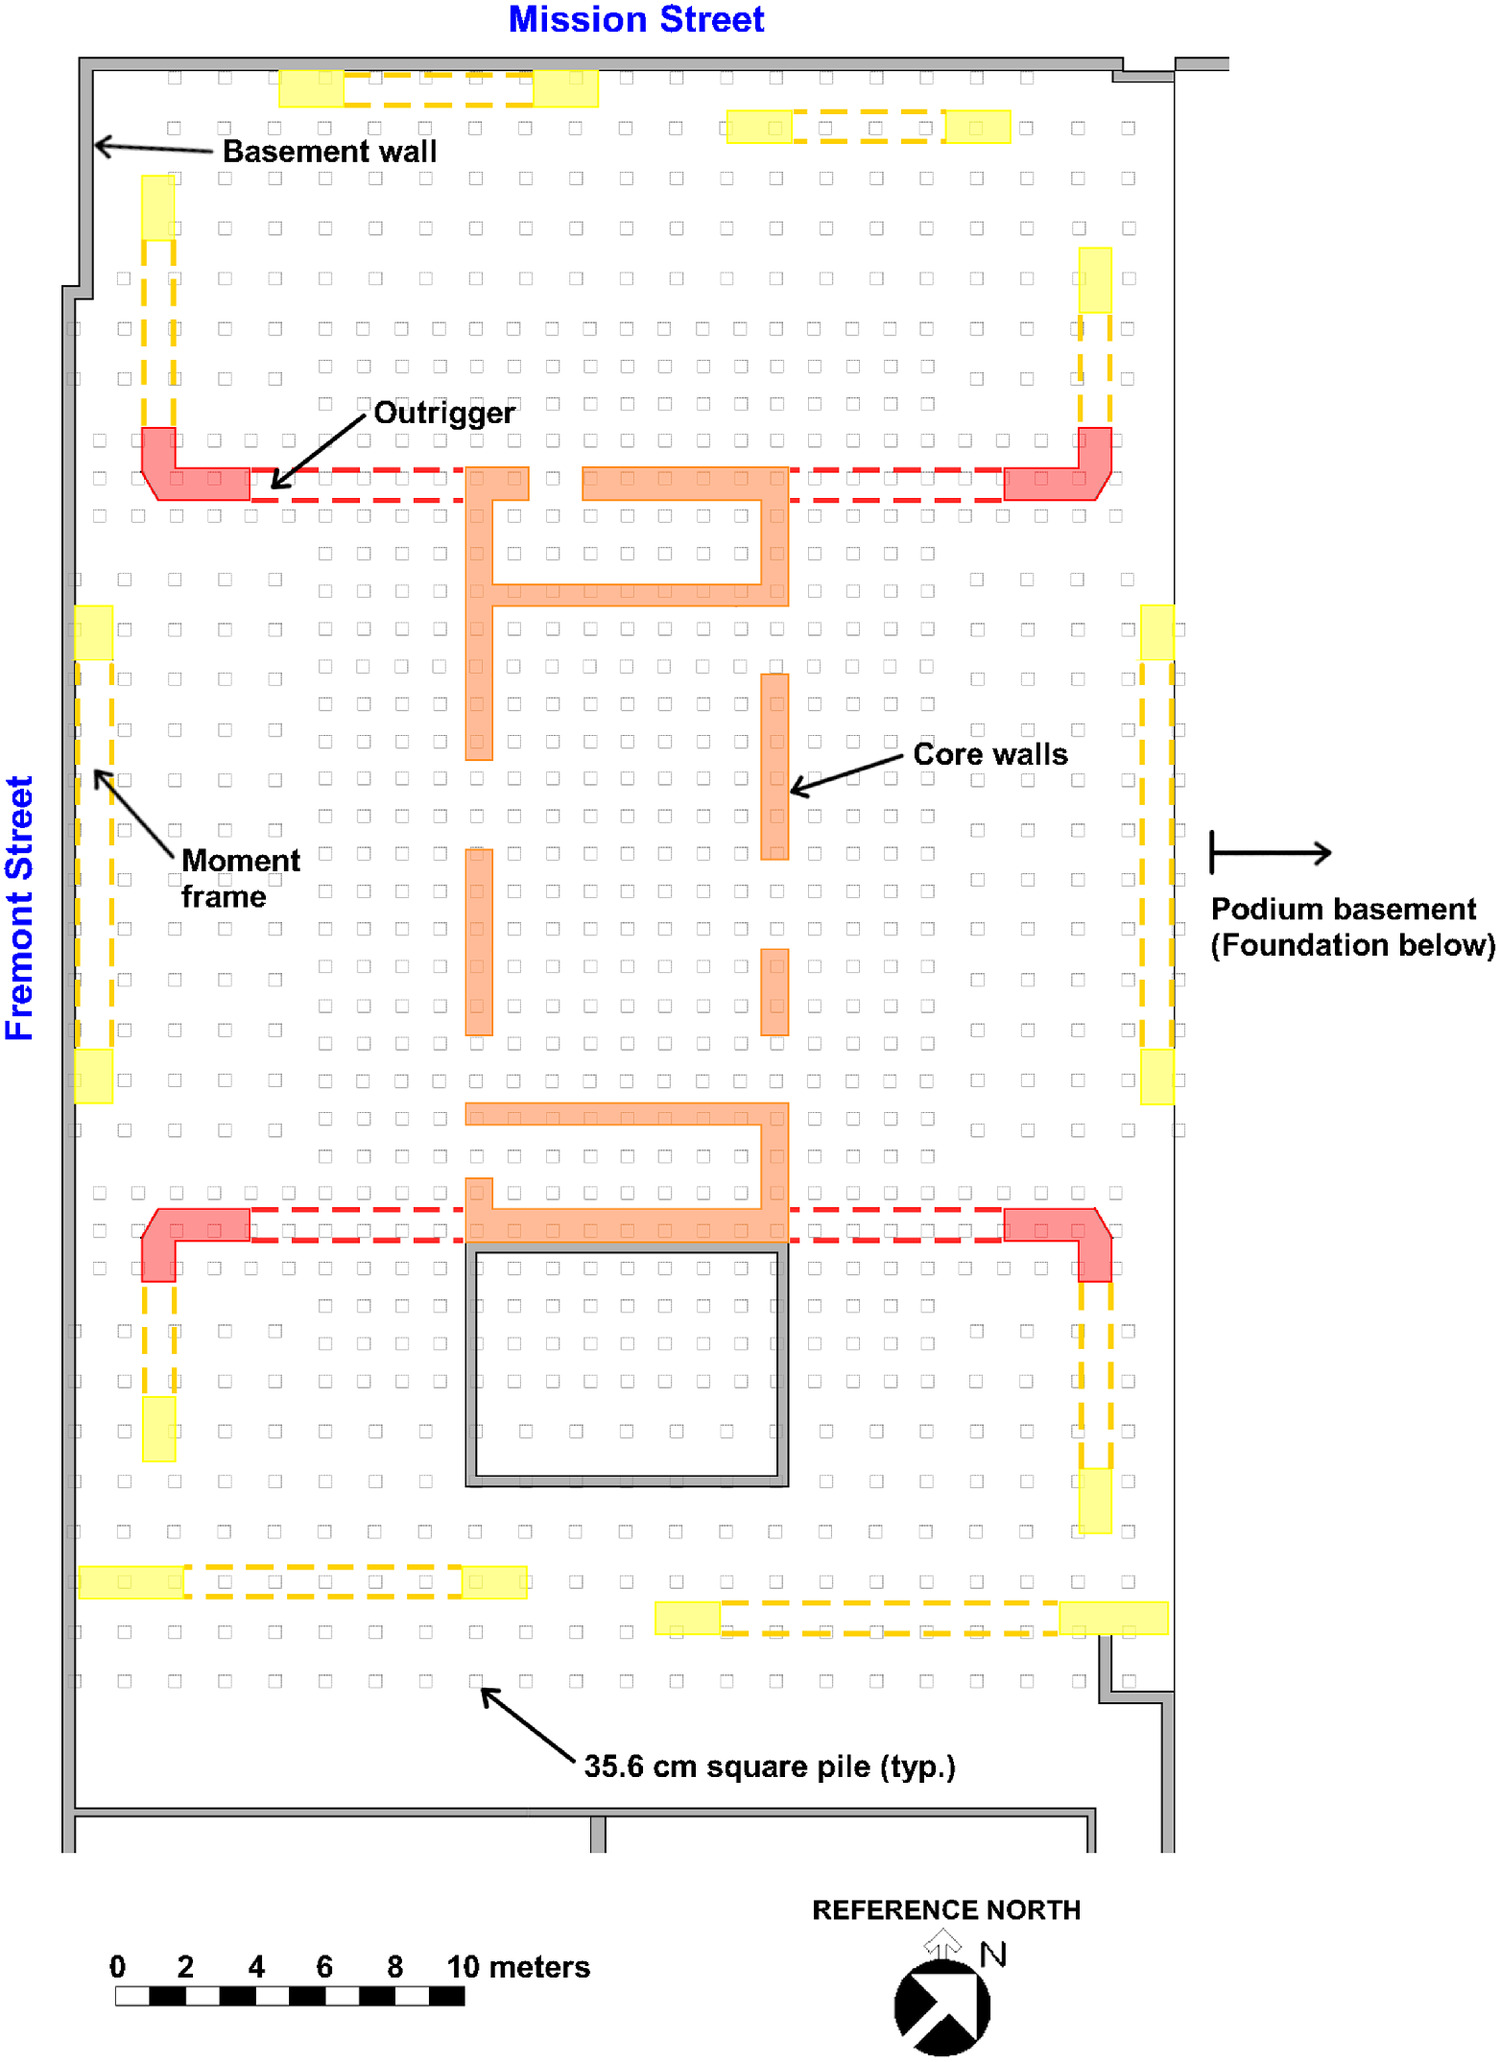
The Millennium Tower is a 184-m-tall, 58-story, reinforced concrete frame with a central core of shear walls. The substructure consists of a one-level basement, 4.6 m deep, with a 3-m-thick foundation mat over 945 driven reinforced concrete piles (DeSimone Consulting Engineers, LLC 2005). The piles are driven into the lower marine/Colma sand unit (Fig. 2). The piles have a 35.6-cm square cross section and center-to-center spacing ranging from 1.07 to 1.42 m.
Immediately adjacent to the Tower is an 11-story (38-m-tall) midrise and three-story podium structure. As shown in Fig. 2, the MP substructure consists of a four-level basement, 16.7 m deep, supported on a shallow mat foundation bearing on the upper marine sand layer. The Tower and MP are separated by a soil–cement mixture cutoff wall containing embedded steel H-beam soldier piles, installed during construction of the MP. Fig. 6 shows a foundation plan for the Tower.
Tower construction commenced with indicator pile installation in late 2005, which was followed in early 2006 by installation of production piles (Treadwell & Rollo, Inc. 2006), installation of the MP cutoff wall, and excavation dewatering for the Tower and MP sites (Fig. 5). As shown subsequently, this dewatering temporarily lowered the groundwater at the site by 9–10 m. The Tower mat was poured at the end of June 2006. Construction of the Tower superstructure started in August 2006, followed by excavation for the MP starting in September 2006. Tiedown anchors were installed through the foundation mat on the west side of the MP to counteract buoyancy effects following groundwater rebound. Dewatering ended in February 2008, and superstructure construction finished in late 2008. The Tower was opened for residents in April 2009.
Adjacent Construction
Following construction of the Millennium Tower, three projects were completed at adjacent sites (Fig. 1). The Transbay Transit Center (now Salesforce Transit Center) is located to the project south and west and was constructed from 2010 to 2018. A structure at 350 Mission (now Salesforce East) is located to the north and was constructed from 2013 to 2015. The Salesforce Tower and Plaza are located to the west and were constructed from 2015 to 2018.
For the purpose of understanding Tower foundation performance, the most pertinent aspects of adjacent construction are related to dewatering and excavation, which are highlighted in the Fig. 5 timeline. Major elements of substructure construction include installation of cutoff walls along the project perimeter that are intended to have limited conductivity and thereby maintain groundwater levels beyond the project perimeter as dewatering occurs within the site during excavation and substructure or superstructure construction. Dewatering is normally terminated immediately following substructure construction, although in the case of the STC, the dewatering continued beyond the period of substructure construction, as discussed further subsequently.
Transit Center
The STC project extends over four blocks, and the construction was subdivided into four zones, as shown in Fig. 1, with Zone 3 being immediately true south of the Tower (i.e., project southwest) and Zone 4 being adjacent to and true southeast (i.e., project south) of the Tower. The information on the STC timeline in Fig. 5 is from Transbay Joint Powers Authority (TJPA 2019). Demolition of the former Transbay Terminal started in mid-2010, and cement deep soil mixing (CDSM) cutoff walls were installed throughout 2011 and into early 2012 (including pretrenching, timber pile removal, and shallow dewatering). A prototype CDSM wall was installed at the west end of the site to test the construction procedure and resulting material properties (Kluzniak et al. 2010). Dewatering began in March 2012 for Zones 1–2 and in May 2013 for Zones 3–4. Excavation to approximately 13.5 m depth (Fig. 2) started in Zone 1 in early 2012 and moved east toward Zone 4 through early 2014; excavation in Zone 4 (adjacent to the Tower) started in early 2013. Prior to the excavation in Zone 4, a subsurface buttress was installed adjacent to the Tower from mid-2011 to early 2013 (Arup North America, Ltd. 2009; TJPA 2019), which was intended to limit Tower foundation movements related to STC construction. The buttress consists of 182 drilled shafts 2.1 m in diameter extending into the Franciscan Complex. Substructure construction was completed by early 2014 for Zones 1–2 and late 2014 for Zones 3–4, which was followed by superstructure construction. Dewatering was not concluded upon the completion of substructure construction, instead extending to mid-2018 when the STC was opened.
350 Mission
The SFE project developed a 129-m-tall, 30-story building. The substructure consists of a four-level basement, 15 m deep, and a 2.5-m-thick foundation mat that bears on the upper marine sand layer. Demolition of the prior structure occurred in early 2013, followed shortly thereafter by cutoff wall construction (similar in configuration to that for MP) and dewatering and excavation that essentially coincided with dewatering of Zones 3–4 and excavation of Zone 4 at the STC site. Substructure construction began in late 2013 and was followed by superstructure construction that began in early 2014.
Salesforce Tower and Plaza
The project has two major components: a 326-m-tall, 61-story tower supported on a 15.2-m-deep, four-level basement (Salesforce Tower), and a ground-level Plaza that consists of a 10.6-m-deep, two-level subsurface garage extension (Salesforce Plaza). As shown in Fig. 1, SFP is located between SFT and the Millennium Tower. The SFT foundation consists of a barrette foundation-supported mat, with the barrettes extending into bedrock. The SFP foundation is a 1.5-m-thick foundation mat. For the SFT, cutoff wall construction, dewatering, and excavation started at the end of 2014 and continued through 2015. The foundation mat and substructure construction occurred from late 2015 through early 2016, with superstructure construction occurring through late 2017. Excavation and dewatering for the SFP occurred in early 2017, and basement construction was completed in 2017.
Performance Monitoring
Millennium Tower foundation settlement at limited benchmarks has been monitored since Tower construction began in 2006. Subsequently, as construction occurred at neighboring properties, numerous additional settlement markers and instruments were installed at and around the Tower, including piezometers, inclinometers, extensometers, survey prisms, and tiltmeters. In this section, we present results from representative piezometers, inclinometers, settlement markers, and survey prisms to describe groundwater variations, foundation movements, and soil deformations at the Tower site for time intervals with available data from 2006 to 2020.
Groundwater
The preconstruction groundwater table in the vicinity of the Tower occurred at a depth of approximately 3 m (Treadwell & Rollo, Inc. 2005). As shown in Fig. 7, starting with the construction of the Tower in 2006 and continuing through 2018, the water table was lowered by a series of dewatering programs at and adjacent to the Tower site. The significance of dewatering for the Tower foundation performance is that it reduces buoyancy of surficial soils (fill and young Bay mud) and of the Tower, thus increasing effective stresses on deeper layers, including the upper OBCs. Whereas piezometers have been installed in various soil units, Fig. 7 shows groundwater depths associated with measurements in the upper/lower marine sand and Colma sand units that directly overlie the upper OBC.
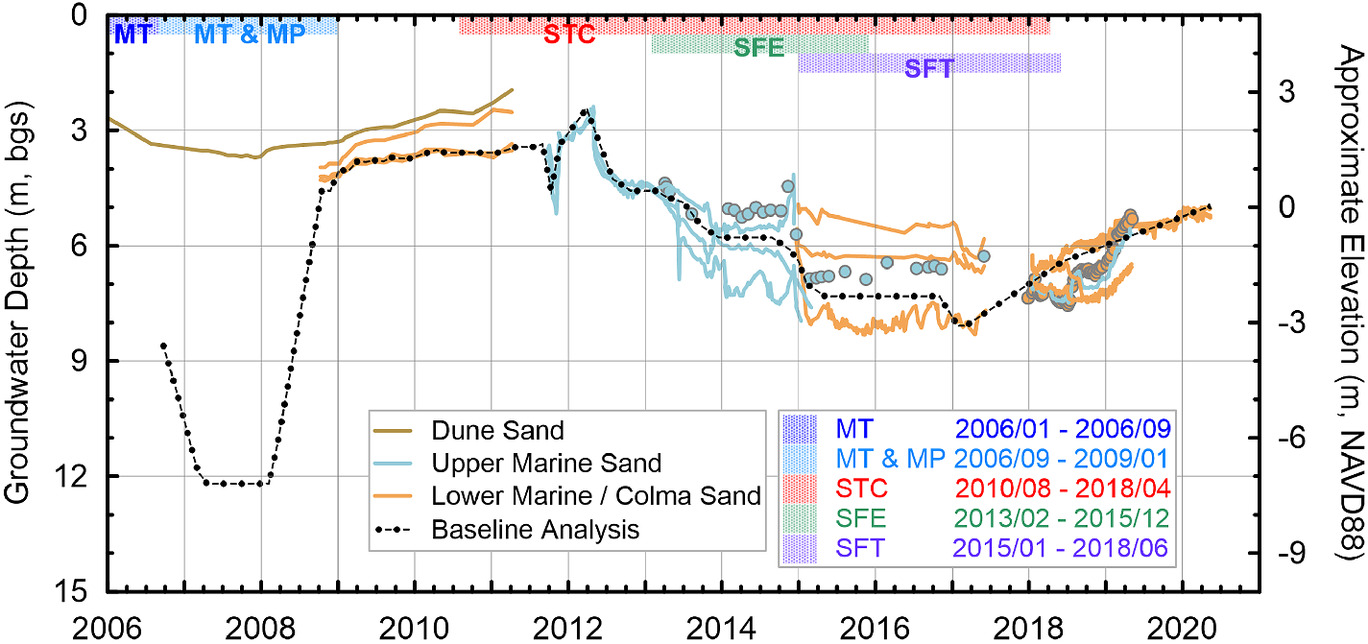
Dewatering activities during substructure construction of the Tower and MP were tracked by water table depth measurements in a series of standpipes, including nine wells used for dewatering in the MP excavation and two wells on the Tower side of the cutoff wall separating the two excavations. Measuring ground water depths from the same wells used for dewatering overestimates drawdown relative to the expected value within excavation areas due to local cones of depression at the wells from pumping. Nonetheless, the available data indicate that the tips of “cones” were at about 23–26 m depth within the MP cutoff walls, whereas depths measured in the two wells on the Tower side of the cutoff wall separating the excavations were approximately 12–13 m (the difference is likely influenced by limited conductivity through the cutoff walls). These measurements establish the baseline analysis water table depth shown in Fig. 7 for the period March 2007–February 2008. Piezometers west of the Tower site outside of cutoff walls recorded 1–1.5 m of drawdown and tracked subsequent recovery, which was essentially complete by early 2011 (Fig. 7).
Piezometers were installed near the Tower in 2011 to monitor the effects of construction at the STC site, at the end of 2014 to monitor the effects of construction at the SFT and SFP site (Arup North America, Ltd. 2015–2017), and from 2016 to 2019 (Arup North America, Ltd. 2018; SAGE Engineers, Inc. 2018; Slate Geotechnical Consultants, Inc. 2019). The data from these piezometers are not sufficient in their spatial coverage to establish the three-dimensional (3D) groundwater surface across the Tower site, which is expected to be nonuniform. However, they provide valuable representations of water table elevation at multiple points that allow patterns in time to be identified. As shown in Fig. 7, following some initial fluctuations in these data from mid-2011 to March 2012, a series of reductions in piezometric head in the upper and lower marine sand and Colma sand units occurred as follows:
•
April–May 2012: drawdown that coincided with the start of STC Zone 1–2 dewatering.
•
Throughout 2013: drawdown that coincided with the start of STC Zone 3–4 dewatering and SFE dewatering.
•
November 2014–February 2015: drawdown that coincided with start of SFT dewatering.
•
Start of 2017: drawdown that coincided with start of SFP dewatering.
As shown in Fig. 5, dewatering at the STC site was sustained through 2018, whereas other dewatering programs were relatively brief. The effects of the sequenced dewatering were a cumulative drawdown of approximately 5 m by early 2017 (i.e., drawdown to a depth of approximately 8 m), which began to recover in mid-2017 following the completion of SFP dewatering. As of mid-2020, groundwater had recovered to approximately 4.9 m depth (1.9 m of residual drawdown).
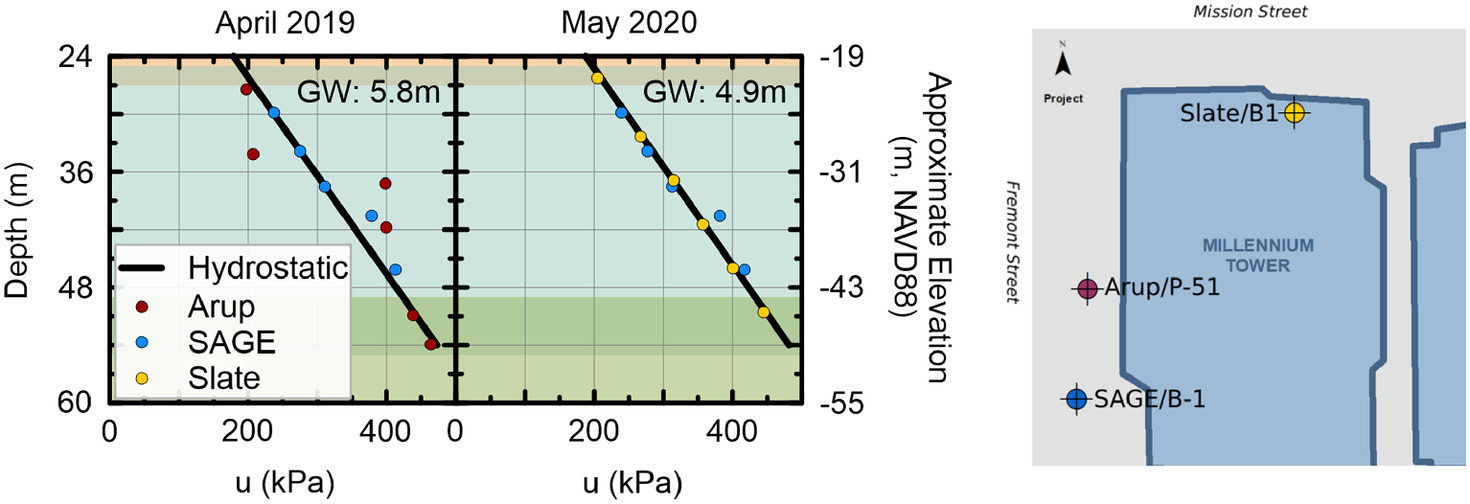
In addition to the piezometers in the upper and lower marine sand and Colma sand units used to monitor groundwater drawdown, several arrays of piezometers were installed in the upper OBC very close to the building perimeter (Arup North America, Ltd. 2018; SAGE Engineers, Inc. 2018) and within the building envelope (Slate Geotechnical Consultants, Inc. 2019) to investigate the possible presence of excess pore pressures (i.e., water pressures exceeding hydrostatic) that if present would be associated with ongoing consolidation at the time the measurements were made. Data from such piezometers are available from May 2018 and May 2019 onward, respectively. Fig. 8 shows profiles of water pressures measured in April 2019 and May 2020. Although there are some piezometers that indicate water pressures that exceed hydrostatic (e.g., Arup piezometers at 37 and 42 m), the preponderance of evidence suggests that excess water pressures are essentially nil.
We interpret the multiepoch groundwater lowerings that coincide with dewatering at adjacent sites as an indication that there was “communication” between water levels at the Tower site and those within cutoff walls at adjacent sites. Such effects could be caused by potential leakage through cutoff walls or flow beneath the walls.
The interpreted groundwater level for use in the one-dimensional (1D) analysis (Fig. 7) was established as described previously for the period 2006–2010 and was interpreted from piezometric data for the period since 2011. The interpretation considered the proximity of piezometers to the Tower site and as such is not a simple average of the measured water table depths. The interpreted groundwater levels in the upper and lower marine sand and Colma sand units were considered representative for use as a boundary condition in the 1D consolidation analysis. Minute weekly or monthly fluctuations were not considered in the interpretation; instead, piecewise linear approximations were used to smoothly transition between major drawdown episodes. The interpretation was done “by eye” following the general trends of the data.
As a result of the excess water pressures at the site being essentially nil (Fig. 8), it appears that primary consolidation of the OBCs had effectively concluded by mid-2020, and possibly earlier.
Foundation Settlement
Foundation settlement has been recorded since September 2006 using three monitoring programs: (1) September 2006–February 2009: a monument mounted on the first floor of the Tower core wall was surveyed by Martin M. Ron Associates, Inc. at approximately monthly intervals, (2) May 2009–present: 31 settlement markers (SM-XX, where XX is the settlement marker identification number) were installed on the Tower mat by Arup North America, Ltd. and surveyed to record vertical position at approximately monthly to bimonthly intervals through January 2017, weekly intervals March 2017–February 2019, and roughly 1.5-month intervals since February 2019, and (3) January 2017–present: the SM markers were supplemented with an additional 30 settlement markers (LE-XX, where XX is the settlement marker identification number) installed on the Tower mat by Langan Engineering. The locations of the markers are shown in Fig. 9.
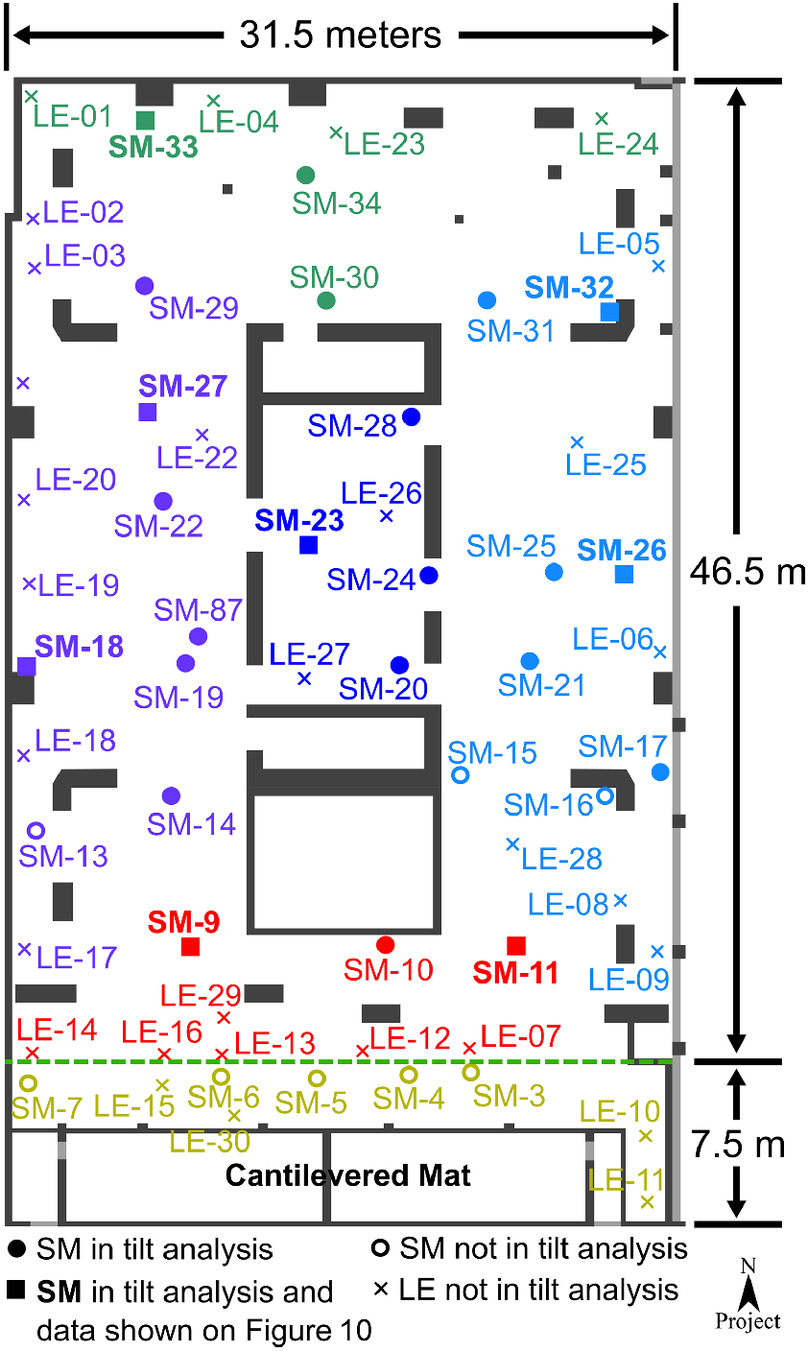
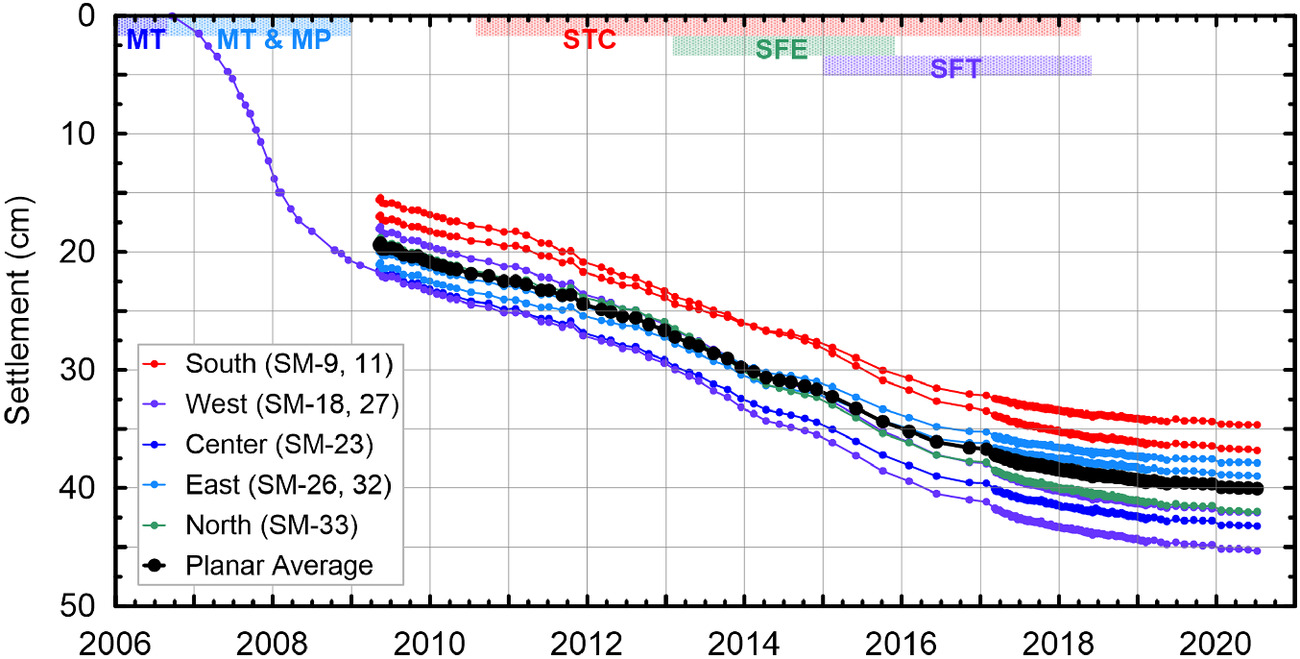
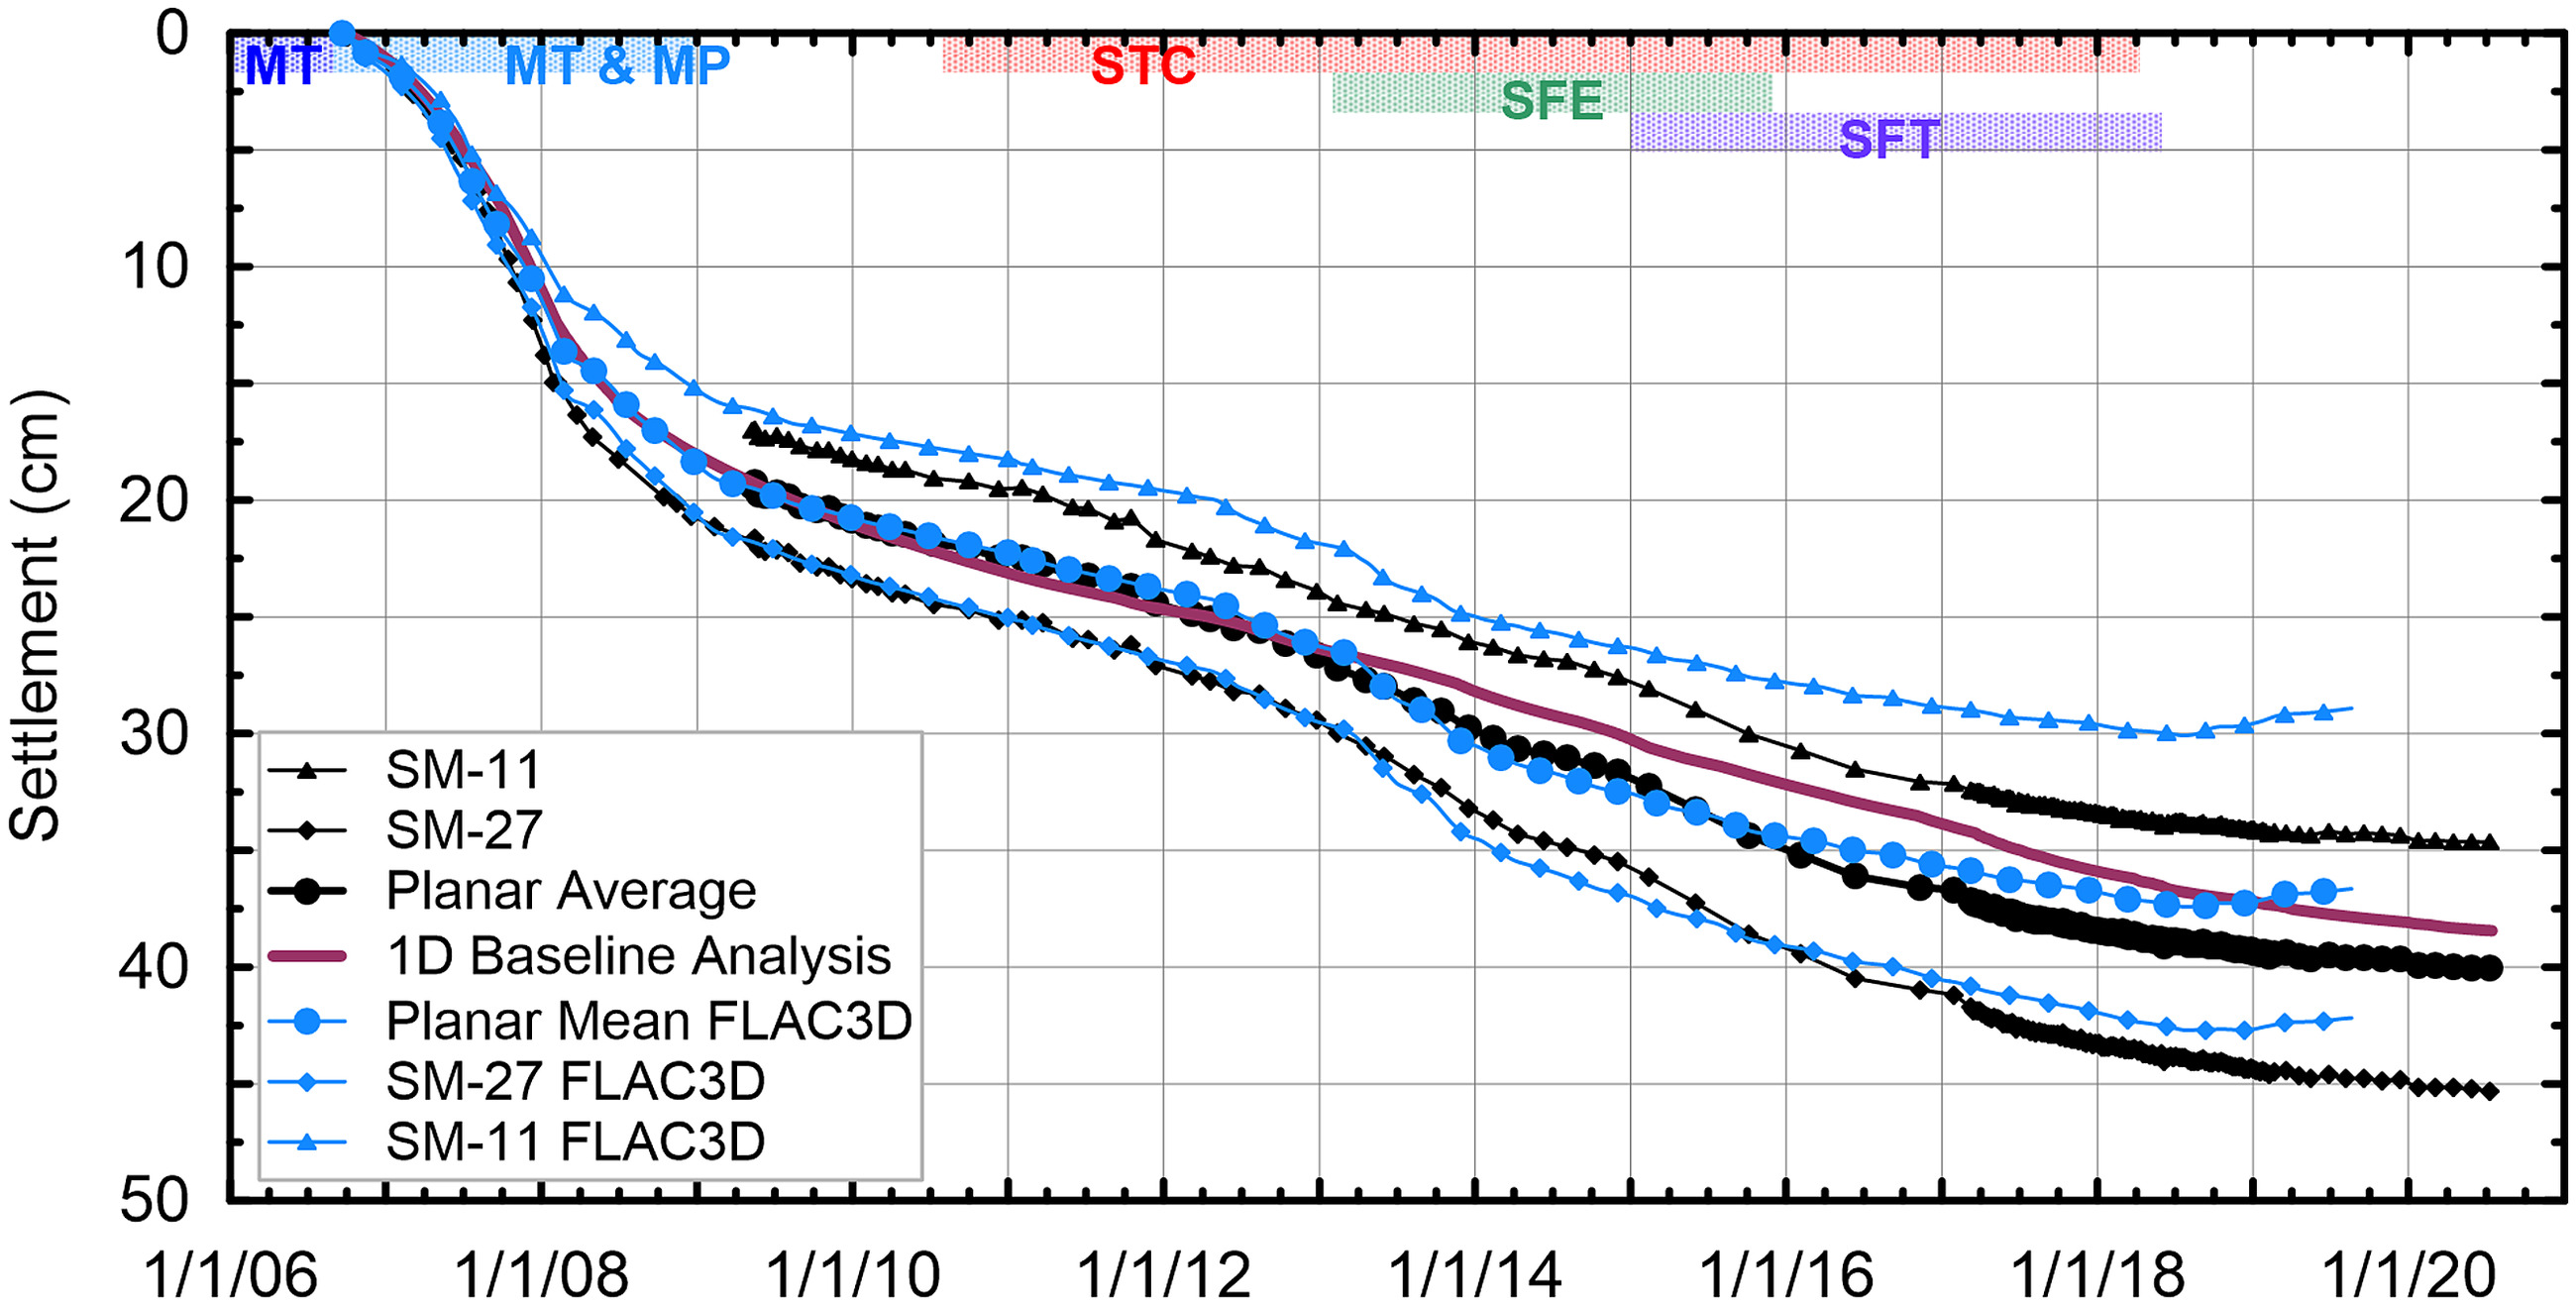
Fig. 10 shows the variation of settlement with time from the monitoring program. The single-location data set through 2008 was merged with the survey monument data by linking the MM Ron data from the wall monument to displacement at SM-27, which is the closest settlement marker. The merging procedure was verified by comparing settlements for overlapping time intervals. The initial (as of April 2009) settlement at every other marker was calculated relative to SM-27 using elevation differences established using a manometer survey. The LE data set is based on the same elevation datum as the SM data set, so a merging procedure was not required. As shown in Fig. 10, there are vertical shifts in the data for different settlement markers, but the pattern with time is common to each of them.
We represent the position of the foundation mat at a particular time with a plane fit to the 3D survey data from the monuments using bilinear least squares regression. By doing so, the vertical position (settlement) and angles relative to horizontal in two reference directions (tilts) can be established at each time that settlement markers were surveyed. Although the mat is not perfectly planar (it has a low point in the northwest quadrant), analysis of residuals between actual position and planar fit indicate a misfit standard deviation increasing only slightly (from approximately 1.25 to 1.50 cm) between the start of monitoring in 2009 and 2020 and a reasonably consistent contour map of residuals with time. In establishing the planar fit, we exclude settlement markers that were inaccessible at some of the survey times (SM-13), those located on walls instead of the foundation mat (SM-15 and 16), and those located on a cantilevered and relatively thin (0.3 m thickness) portion of the foundation mat (noted in Fig. 9) that is not supported by piles (SM-3, 4, 5, 6, and 7).
The mean settlement from the planar fit is marked in Fig. 10, and falls near the middle of the range from individual settlement markers. The planar fit to the settlement marker data also establishes foundation slab tilt that can be measured in any horizontal direction. We denote tilt angles in the reference north–south and east–west directions (parallel to Fremont and Mission Streets, respectively) as and . We interpret the time-dependent tilt established by this data in the next subsection.
Our interpretations of notable features of the settlement-time data in Fig. 10 are as follows:
•
September 2006–February 2008: During this period of local dewatering and Tower construction, settlements developed rapidly but decelerated toward the end of the construction interval.
•
February 2008–April 2011: During this period following Tower and MP construction but prior to other major construction activities adjacent to the Tower, settlements slowed with time.
•
April 2011–April 2012: During this period, construction activities commenced at the STC site, including CDSM wall installation (April 2011) and Zone 1–2 dewatering (April 2012). Settlement rates moderately increased.
•
Early 2013, December 2014, February 2017: During each of these three periods when dewatering and excavation commenced adjacent to the Tower, settlements initially accelerated and then gradually slowed with time.
Tower Tilt
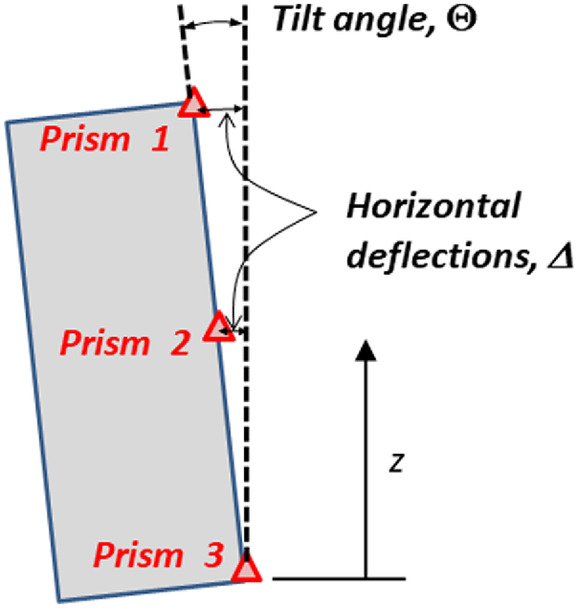
We define tilt of the Millennium Tower as the vertical angle of the vertical faces of the building. Tilt is denoted and for the project north–south and east–west directions, respectively. As shown in Fig. 11, tilt is directly related to horizontal deflection () aswhere = vertical distance from the base slab to the position where horizontal deflection is measured. Eq. (1) applies if building deflections from tilt do not appreciably distort structural members, which has been confirmed by structural analyses (Hamburger et al. 2021).
(1)
Three sources of data have been used to estimate the lateral deflection or tilt and their variations with time:
1.
External survey data (January 2017 to present): Consist of total station surveys of prisms on east and west sides of the Tower at the top of the 2nd, 5th, 14th, 20th, and 40th floors and the top of the façade (heights of 5.2, 14.6, 40.8, 58.5, 121.0, and 180.4 m above street level). For each prism, location is provided (latitude, longitude, elevation) with high precision ().
2.
Interferometric synthetic-aperture radar (InSAR) data (May 2009 to March 2017): Provide geodetic coordinates of a point on the roof of the Tower as a function of time. Referred to herein as “satellite data,” this information was provided by 3v Geomatics as horizontal (easting and northing) and vertical movement relative to an initial reading in May 2009 (InSAR would not be useful during noisy construction periods preceding this date). As a consequence of the satellite flight path, north–south movements are more accurate (uncertainty of 2.8 cm) than the east–west movements (5.8 cm). As shown subsequently, these uncertainties introduce transient data scatter but do not obscure long-term data trends (particularly when movements are much larger than the uncertainties).
3.
Horizontally gridded foundation mat settlement data (May 2009 to present): Data are described in the previous subsection. Planar fits of data were used to establish foundation tilt angles relative to horizontal, , and at each measurement date.
The Tower vertical tilt angles and , could potentially differ from the foundation horizontal tilt angles and . A departure in these angles would occur if the Tower mat foundation underwent tilt simultaneously with settlement during construction, in which case incremental releveling of the structure during construction may have occurred.
To present results on directional lateral deflection (or tilt) versus time, we require an estimate of tilt at the onset of measurements, which is May 2009 from the InSAR and settlement data. We do not consider foundation slab angles and suitable for this purpose (due to the potential for correction of tilt during construction) and instead adopt the following approach:
1.
Begin with tilt angles and from January 2017 provided by external survey data.
2.
For times prior to January 2017, estimate changes in tilt angles and using InSAR and mat settlement data, as follows:
•
Changes in time of InSAR-based directional horizontal deflections () are converted to directional changes in tilt as .
•
Changes in time of directional mat tilt are taken as equivalent to changes in directional Tower tilt, that is, .
3.
Compute tilt for time aswhere = reference time with known tilt (January 2017).
(2)
4.
Compute the deflection of the highest survey prism using Eq. (1). The vertical distance () in this case is 185.0 m above the mat level.
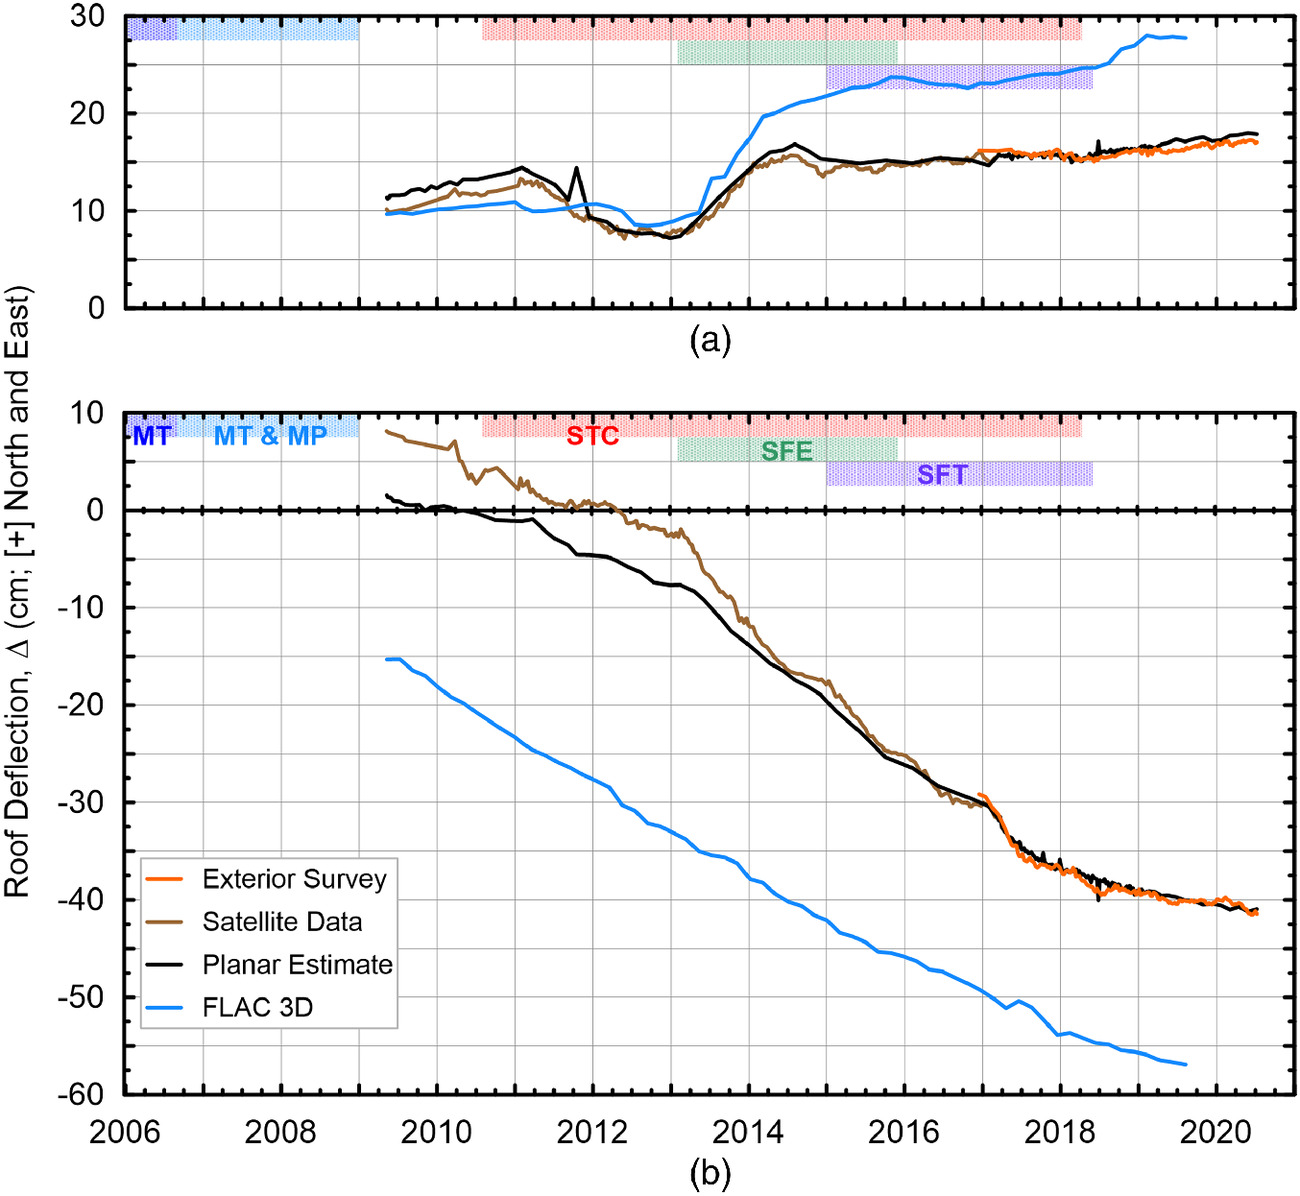
Using the previous procedure, the variations of roof position in the horizontal plane over time since May 2009 are shown in Fig. 12. Fig. 13 shows the roof deflection trajectory in the horizontal plane since May 2009, with line coloration indicating different construction intervals, as shown in Fig. 12. Separate results are shown for survey, InSAR, and settlement monument data. The estimated deflections in May 2009 (at the onset of measurements from InSAR and basement monuments) are 1.3–7.5 cm to the east and 10–12 cm to the north.
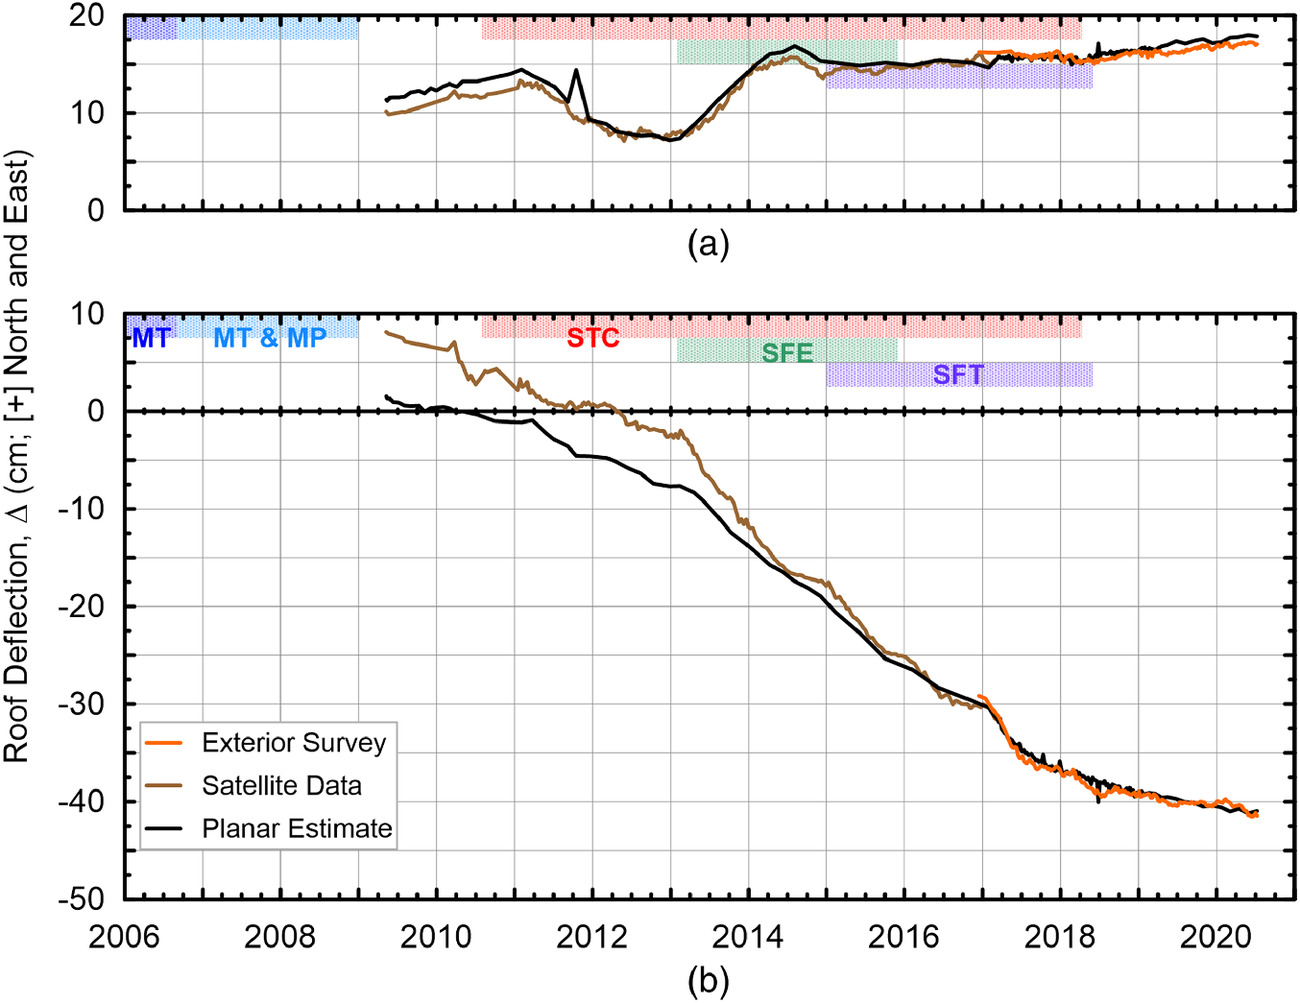
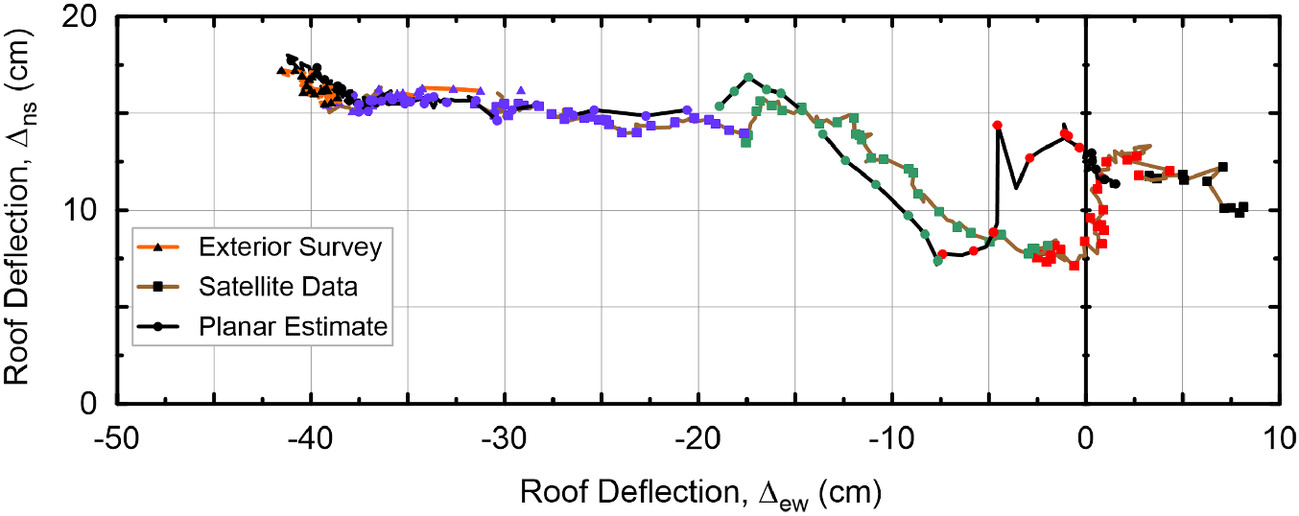
Our interpretations of notable features of the deflection-time data in Figs. 12 and 13 are as follows:
•
May 2009–April 2011: During this period following Tower/MP construction, the planar estimate data (from foundation settlements) indicate lateral movements progressed toward the project north and west at a relatively slow pace. InSAR data are relatively sparse in time during this interval.
•
April 2011–April 2012: During this period in which construction activities commenced at the STC site, deflections in the project north–south direction were redirected toward the south, and deflections toward project west modestly accelerated.
•
2013–2014: Following the onset of dewatering and excavation in Zones 3–4 of the STC (south and west of the Tower) and SFE (north of the Tower) in early 2013, project north–south deflections reoriented toward the north and project west deflections substantially accelerated. Deflections in both directions slowed throughout most of 2014.
•
December 2014, February 2017: Following the onset of dewatering and excavation at SFT and SFP (west of the Tower), deflections accelerated toward the west, whereas north–south deflections did not change. These westerly deflections have slowed since 2018.
Potential mechanisms causing these deflections are discussed in the “Performance Assessment” section subsequently.
Inclinometers
Inclinometers were installed near the Tower, mainly on the south side (to track ground deformations related to STC construction) and west side (to track ground deformation related to SFT and SFP construction). Locations of inclinometers are shown in Fig. 1, and they were installed between 2011 and 2016.
Some difficulties were encountered in analysis of inclinometer data south of the Tower; we did not have access to raw data, and the available processed data had been adjusted in a manner that cumulative horizontal displacements (relative to the base of the inclinometer) could not be evaluated. These issues were not encountered in data collected west of the Tower, the results of which are shown in Fig. 14. The figure shows cumulative horizontal displacements relative to the base of the profile at different times.
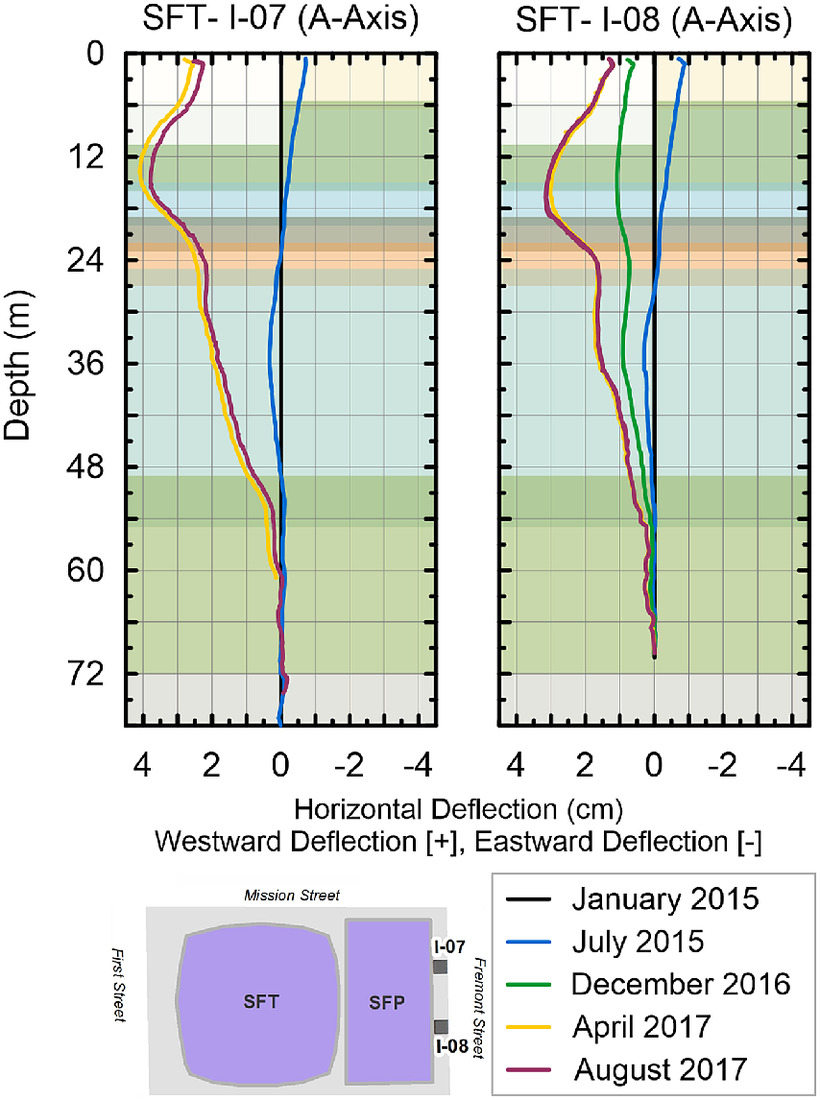
The inclinometer data in Fig. 14 track horizontal ground deformations in the area between the Tower and SFT and SFP on the west side of Fremont Street. Displacements are referenced to baseline readings at the onset of construction in January 2015. Small displacements toward the east had occurred by July 2015, perhaps as a result of tiebacks or bracing installed during SFT excavation. The December 2016 profile shows conditions prior to SFP excavation, which include modest westward deflections within the depth range of the SFT excavation and at greater depths. Following SFP excavation, westward deflections increased markedly over the depth range of the excavation. Potential mechanisms producing these deflections are described in the next section.
Performance Assessment
Performance monitoring data, in combination with the timeline of construction at and near the Tower site, can be interpreted to provide insight into the soil deformation mechanisms that caused the Tower’s foundation settlement and tilt since 2006. Anticipated soil deformation mechanisms include volume change and shear deformation. Volume change is expected from effective stress-dependent void ratio change (primary consolidation) triggered by construction activities that induce effective stress increase (as pore pressures dissipate) in the upper OBC. In addition, time-dependent void ratio change (volumetric creep) coincident with and following effective stress-dependent void ratio change is also expected. Although creep is often modeled as secondary compression that follows primary consolidation, creep actually occurs simultaneously with effective stress-dependent volumetric change (e.g., Taylor and Merchant 1940; Bjerrum 1967; Mesri and Choi 1985; Kutter and Sathialingam 1992; Terzaghi et al. 1996; Brandenberg 2017). Further discussion is provided in Section S1 in the Supplemental Materials. Shear deformations in upper OBC and other foundation soils are expected from building self-weight and neighboring excavations and would contribute to Tower foundation movements.
The purpose of this section is to interpret the performance monitoring data to evaluate the soil deformation mechanisms that caused the foundation movements. Although they are informed by first principles pertaining to volumetric and shear deformations, these interpretations are independent of simulations. Simulations are useful, but it is always possible to question simulation results because of sensitivity to uncertain input parameters and boundary conditions.
Movement Patterns Preceding Adjacent Construction
Settlement
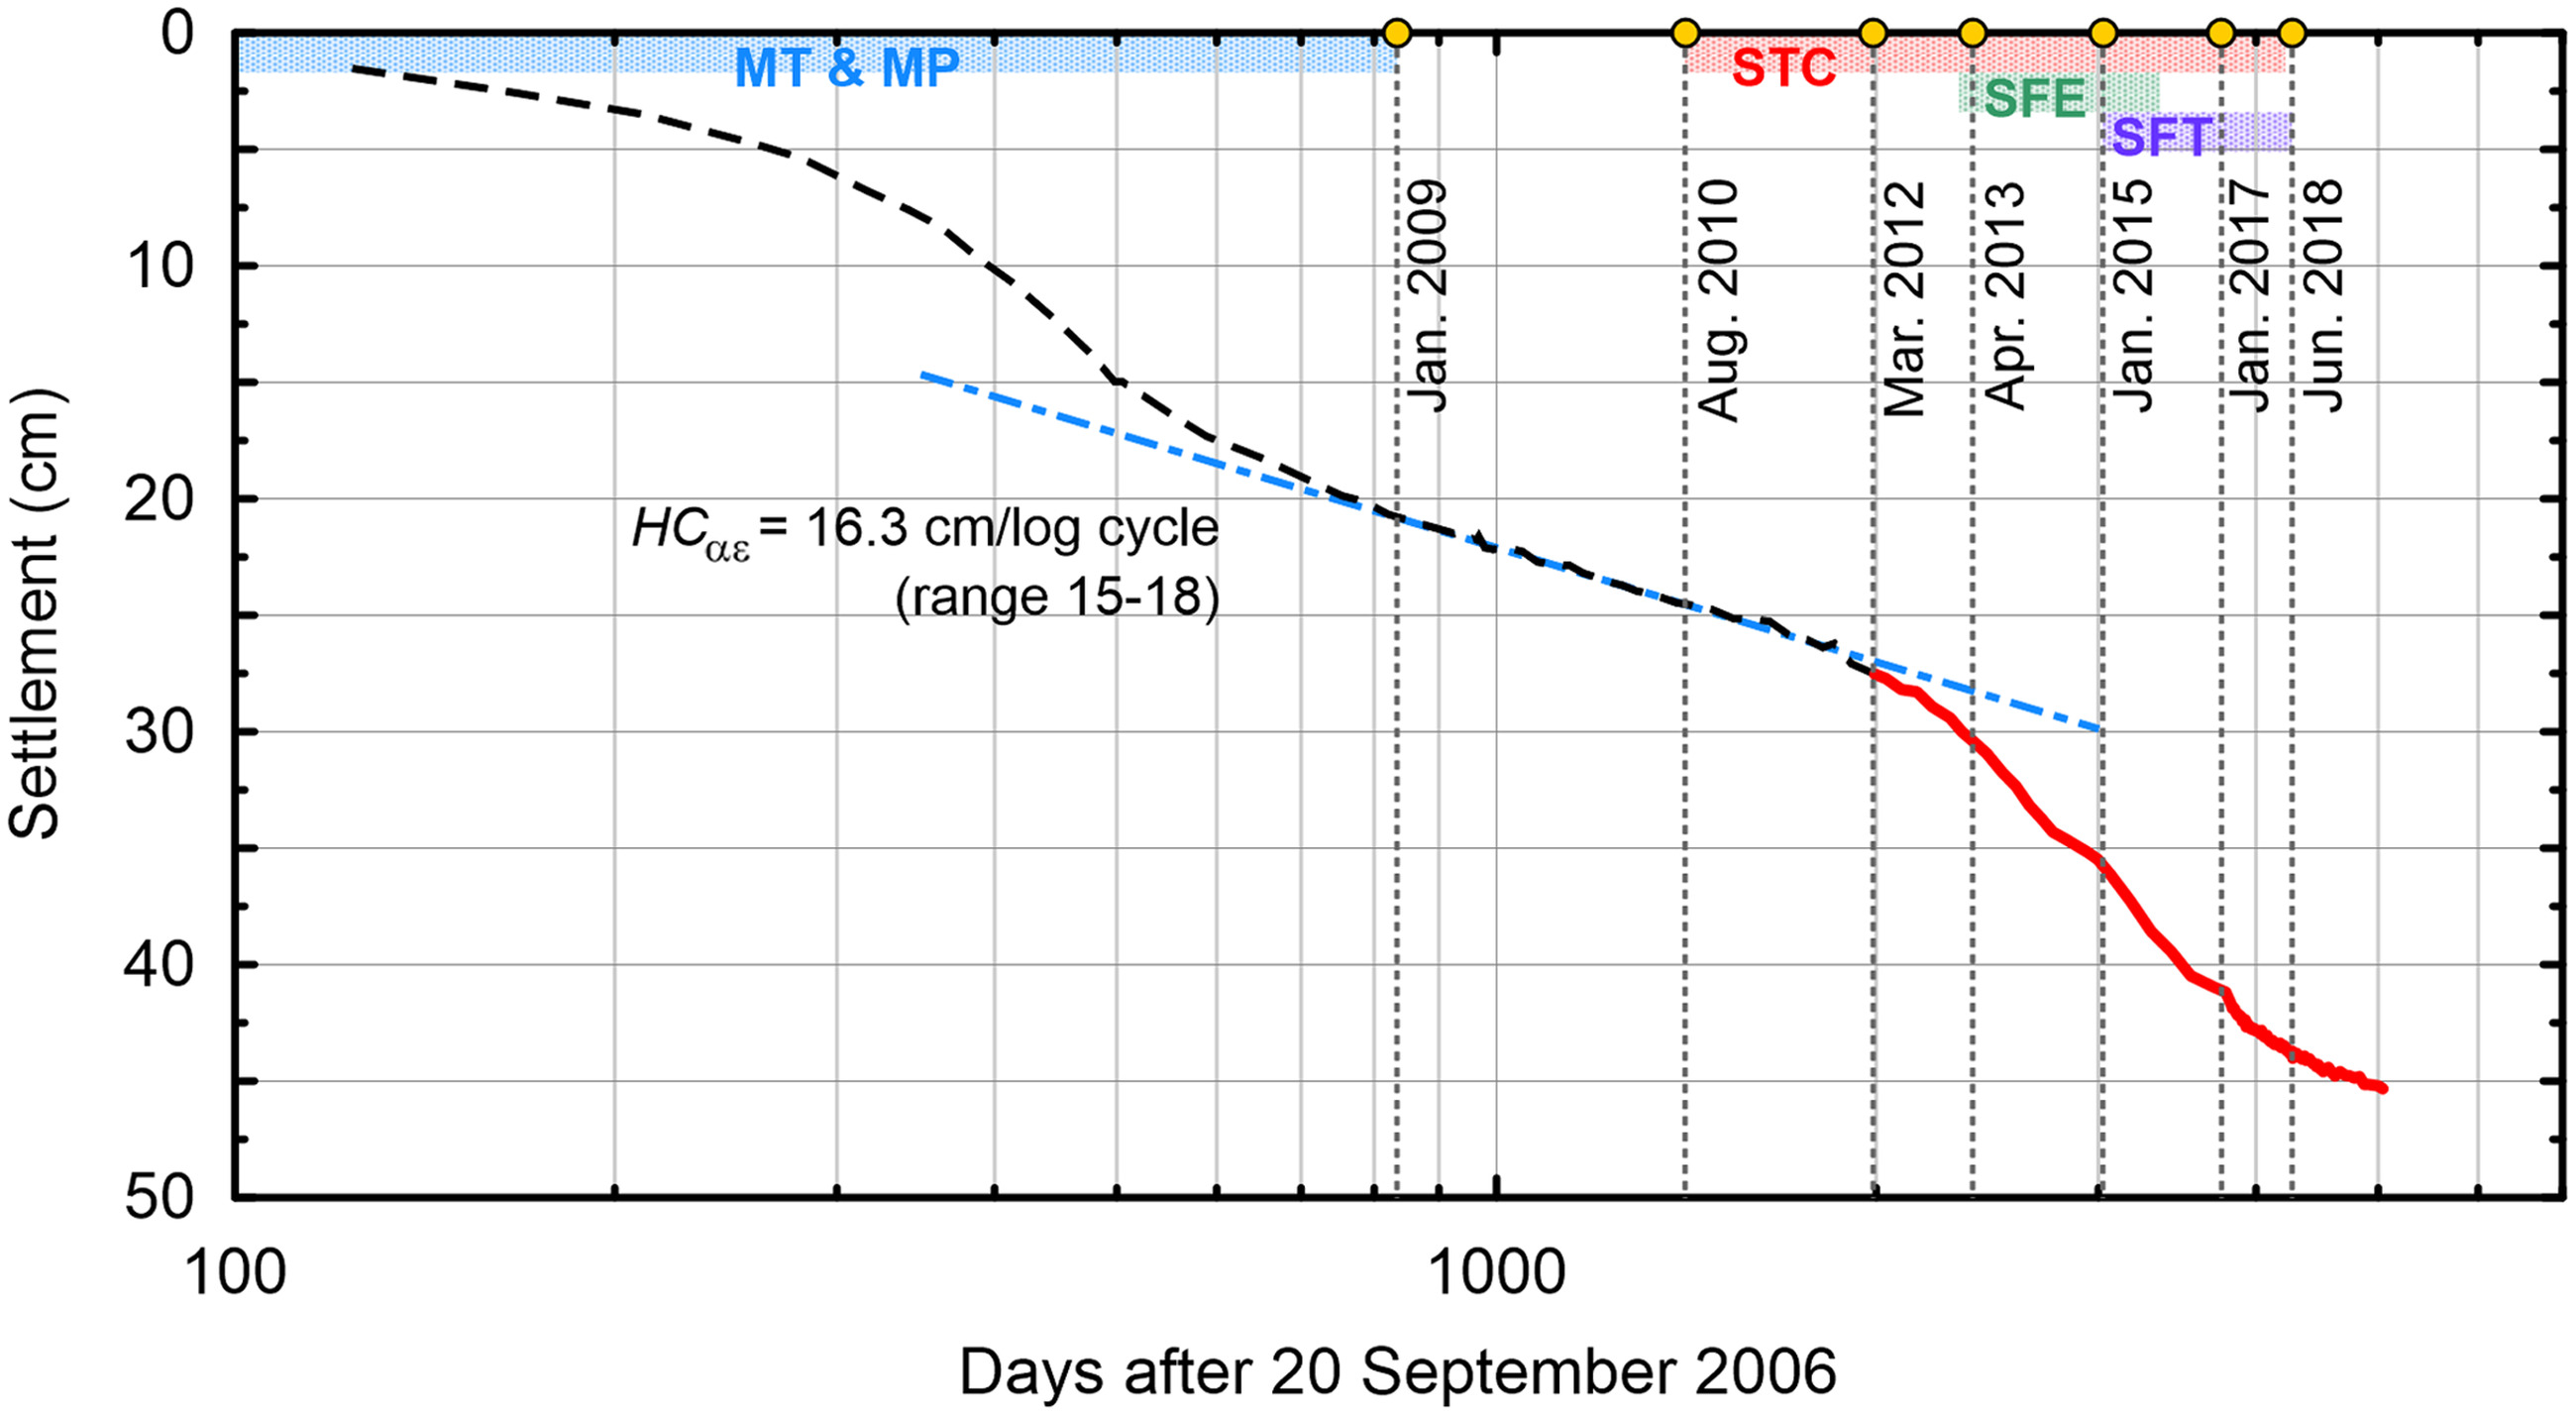
Fig. 15 shows (with a dashed line) foundation settlements with respect to log time from the MM Ron data and SM-27 for the time period September 2006 to March 2012. This time period precedes large-scale dewatering from adjacent construction. The data present a classical shape for a process of primary consolidation followed by secondary compression (e.g., Fig. 9.16 of Holtz et al. 2011), with an apparent transition to secondary compression from primary consolidation at (March 2008). The deceleration of settlement at the apparent is influenced both by groundwater recovery (reducing effective stress in the upper OBC) and pore pressure dissipation. The slope of the settlement–log time curve beyond is approximately 16 cm per log cycle of time (range considering alternate start or end times for fitting is cycle time). If interpreted as possible secondary compression, this rate would be equivalent to , where is the soil layer thickness contributing to secondary compression, and is the secondary compression strain index in effect following primary consolidation.
Secondary compression rates depend on whether the preceding primary consolidation was recompression of overconsolidated soil or virgin compression. Fig. 16 shows the effective stress profile data from Fig. 3 (left frame), three interpreted profiles, and two estimates of the stress increase from net building weight and dewatering following initial loading (2009–2010) added to the effective stresses from soil self-weight (Methods 1 and 2 used to develop these stress increases, including the effects of the piles, are described in the next section). These results show that the upper OBC was likely brought into virgin compression over the approximate depth range of 33 to to 45 m. If is estimated using the full thickness of the upper OBC (), the implied by the data is 0.0071. Alternatively, if is taken as the thickness of the normally consolidated depth interval ( to 12 m), then the implied is 0.013–0.022. The range of for the upper OBC unit from laboratory tests in which secondary compression followed virgin compression is 0.006 to 0.016, with an average of 0.010 (Fig. 3). The implied from field performance data only modestly exceeds that from laboratory tests, suggesting that whereas some primary consolidation likely remained during this period (approximately January 2009 to March 2012), secondary compression was a strong contributor to the settlement. This hypothesis is evaluated further in the “Simulations of Foundation Movement” section.
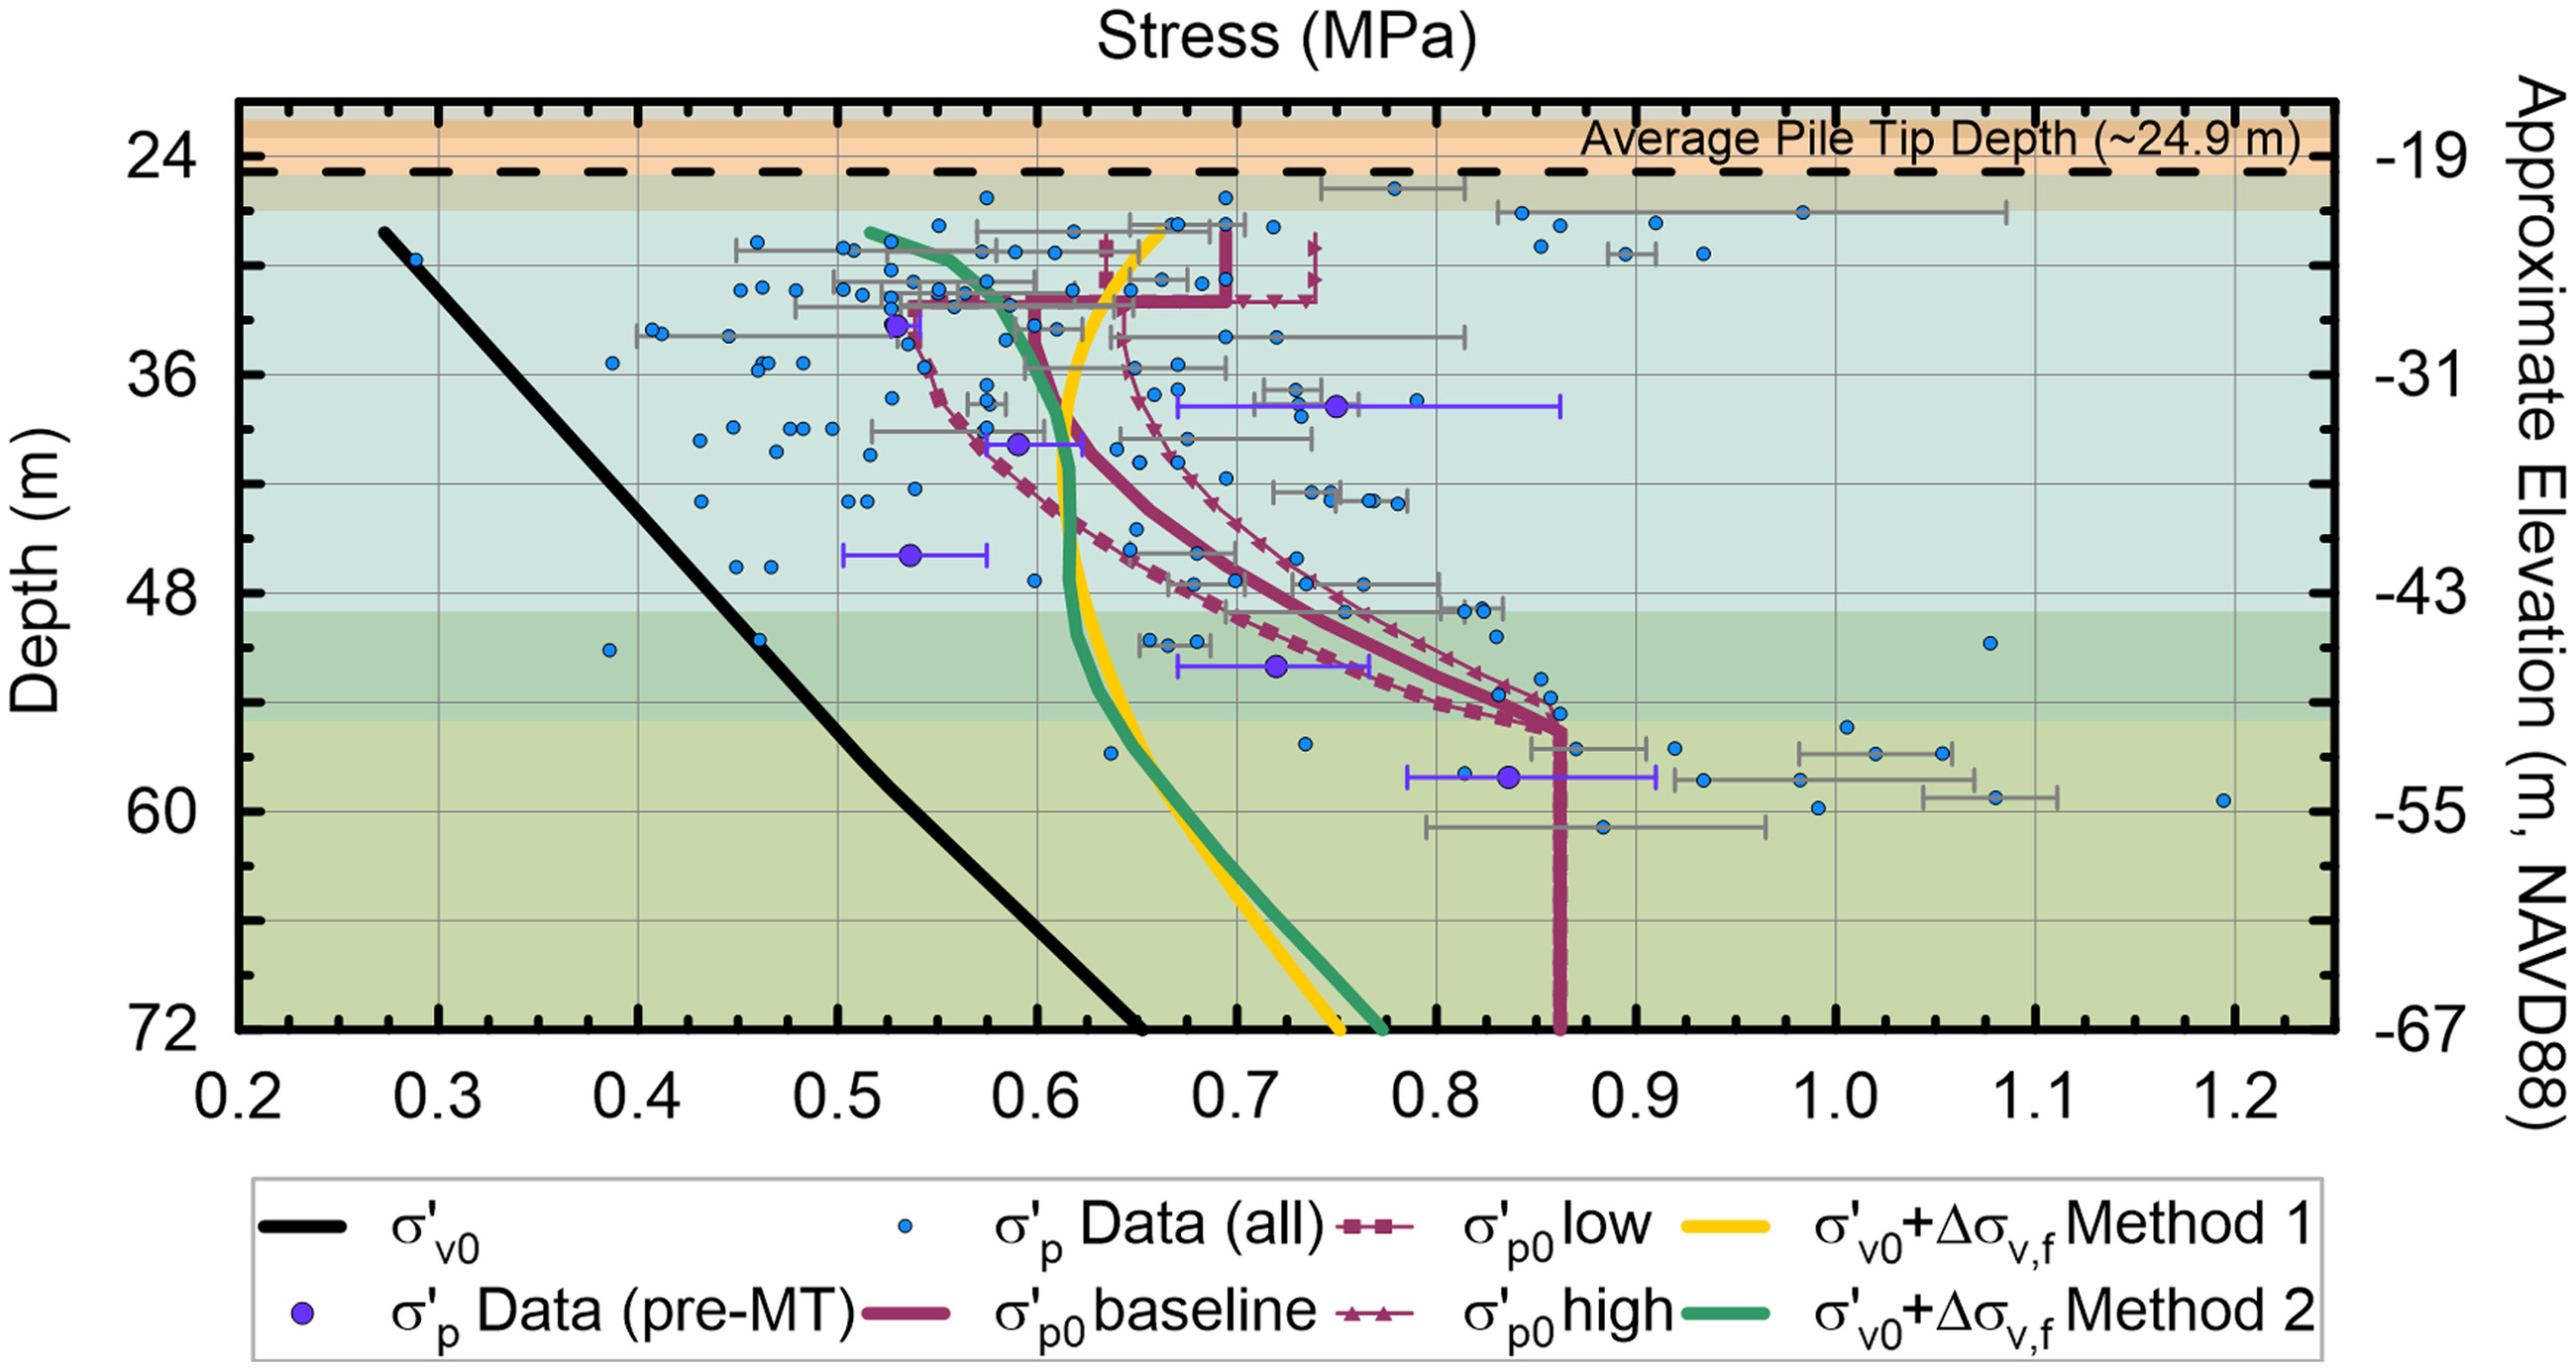
The interpreted profiles in Fig. 16 were used in simulations of consolidation settlement, discussed in the next section. The position of the baseline profile was set: (1) to capture the trend of the data, with emphasis given to samples taken at the Tower site prior to construction (highlighted in Fig. 16), (2) to include a relatively more overconsolidated crust at the top of the upper OBC from approximately 27–32 m, the presence of which is well established from consolidation and CPT data (from reports cited in Table 1), and (3) to produce a reasonable match between simulated and observed settlements. Because the interpreted profile was established in consideration of each of these criteria, it does not necessarily pass through the mean of the full body of data at all depth ranges. Most notably, the baseline profile does not appear to go through the mean of the data for the 30–39 m depth interval, although it is broadly consistent with the highlighted points from the Tower site. The high and low profiles bracket the baseline profile and are used to investigate sensitivity of simulated settlements to uncertainties, as discussed further in “Simulations of Foundation Movement” section.
Tower Tilt
Figs. 12 and 13 show that Tower movements in May 2009 were approximately 10–12 cm to the north and about 1.3–7.5 cm to the east. Subsequently, tilt continued toward the north and reversed direction toward the west at a relatively steady rate in the 2010–2011 time frame. The northward tilt is likely a consequence of nonuniform stratigraphy (shallower depth to OBC layer to the north, as seen in Fig. 2). Potential causes for the changes in east–west direction tilt are more nuanced, and the subject of our interpretation here is whether the observed directions of movement could be reasonably expected.
The initial (i.e., May 2009) tilt toward the east is consistent with expectations. As shown in Fig. 17(a), groundwater drawdown related to dewatering at the adjacent podium was likely nonuniform beneath the Tower footprint, with the lowest levels closest to the east cutoff wall (the lowering near the wall would occur due to leakage through the wall or underseepage). Although the nonuniform groundwater drawdown during this time interval cannot be confirmed explicitly, the spatial distribution is well informed by similar repeated observations during other time intervals, as described in the “Groundwater” section. The larger the drawdown, the greater the stress increase in the upper OBC driving the consolidation process—hence, more volume change would be anticipated beneath the east side of the structure than the west, producing tilt. Moreover, shear deformations associated with the MP excavation would be expected to produce tilt.
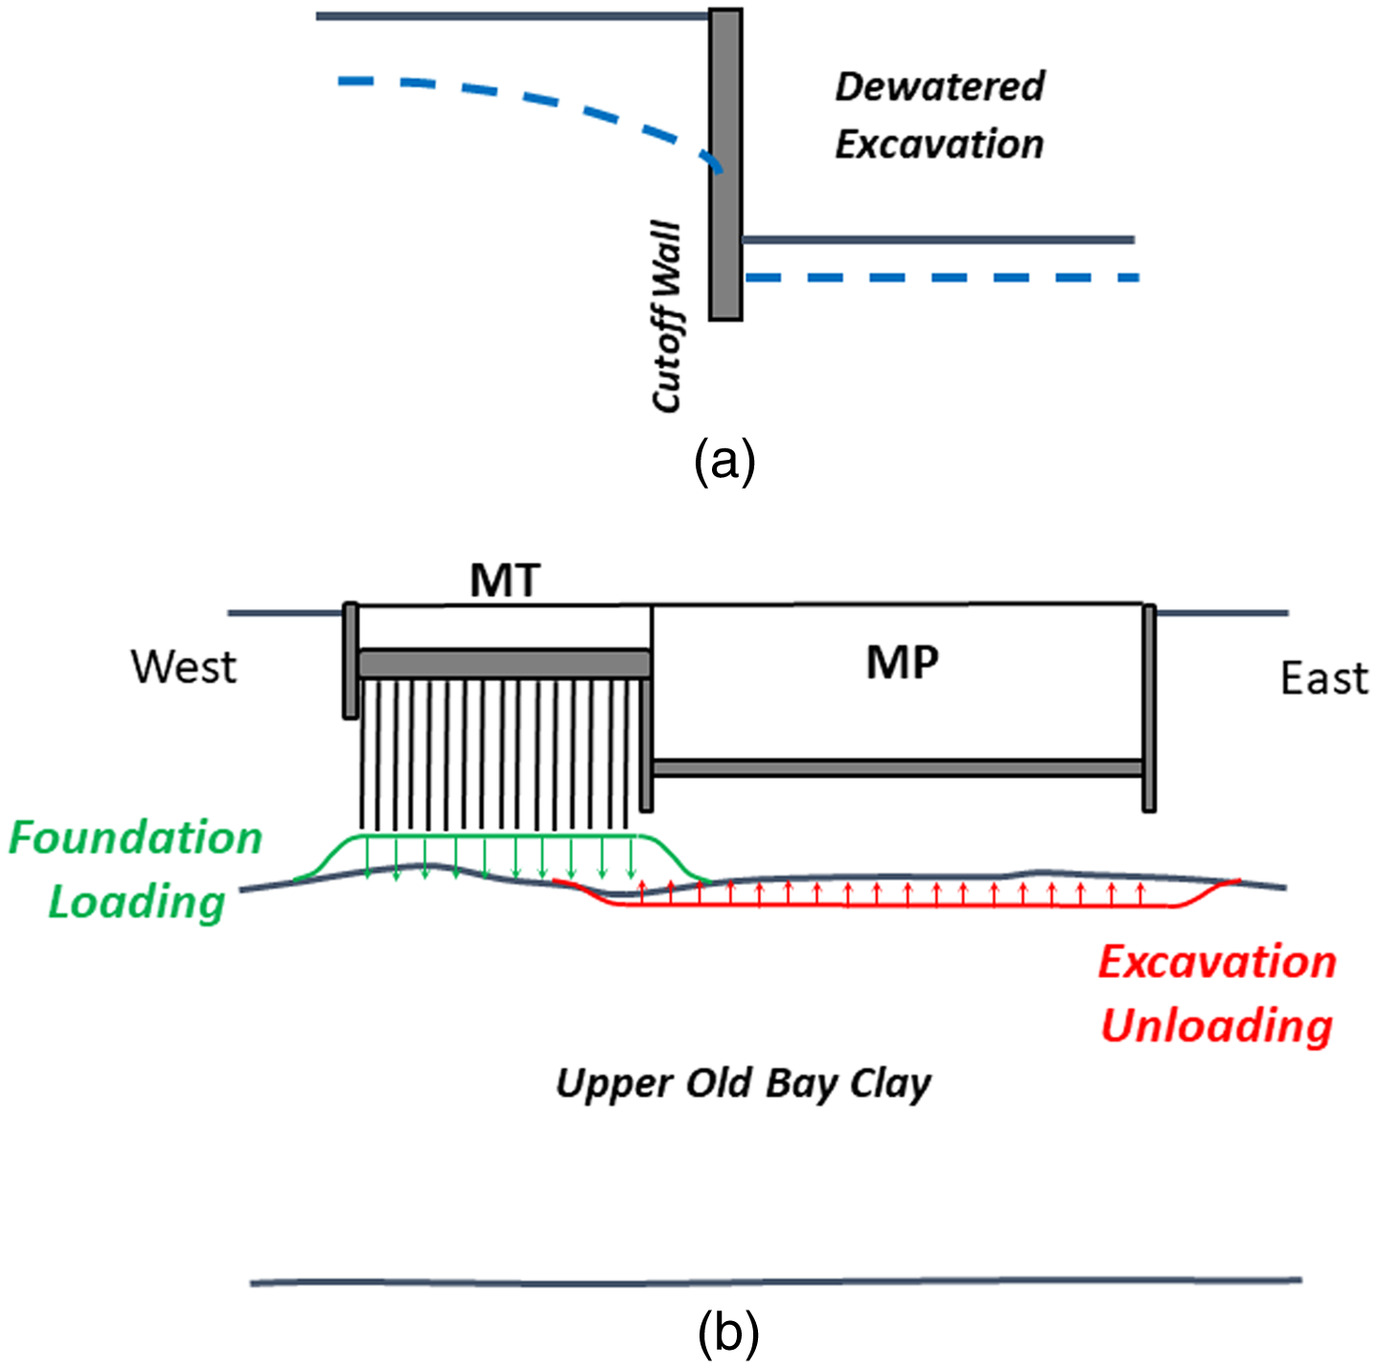
Following the completion of MP construction and groundwater recovery, the mechanisms producing eastward tilt ceased. At this stage, the main driver of tilt is expected to be nonuniform stress increase on the upper OBC from the combination of Tower weight (producing loading) and the overcompensated MP (the difference between excavated soil weight and MP structure weight amounts to an average unloading of approximately 140 kPa within the podium footprint). As shown in Fig. 17(b), this nonuniform stress change produced a greater stress increase on the west side of the Tower, which would be expected to produce gradual westward tilt tracking the foundation settlement, as observed.
Movement Patterns since Adjacent Construction
Settlement
The solid line in Fig. 15 (after March 2012) shows foundation settlements with respect to log time following the onset of significant dewatering activities at adjacent sites. There is clear acceleration of the preceding settlement rate, which coincides with groundwater lowering in 2012 (Fig. 7). We interpret this acceleration of settlement as a renewal of primary consolidation associated with dewatering.
As shown in Fig. 7, multiple episodes of dewatering affected the water table at the Tower site between 2012 and 2017, each of which would be expected to produce additional primary consolidation by increasing the effective stress below the Tower. Among those episodes, the STC dewatering was likely the most consequential, because it was maintained for 6 years. Fig. 18(a) shows the settlement since April 2012 with the log time scale reset to correspond with a new stage of primary consolidation. As with the initial settlement–log time data starting in 2006 (Fig. 15), the data since 2012 exhibit the characteristic shape expected from primary consolidation that gradually transitions toward secondary compression. Although the shapes are similar, the time span of primary consolidation is much longer in Fig. 18(a) () than in Fig. 15 (). This difference results from different time intervals over which the loading that induced primary consolidation was applied. Initially, the loading was applied over a relatively short time interval (2006–2007) from Tower construction and MP dewatering, whereas the later stages were applied from multiple stages of dewatering at adjacent sites between 2012 and 2017.
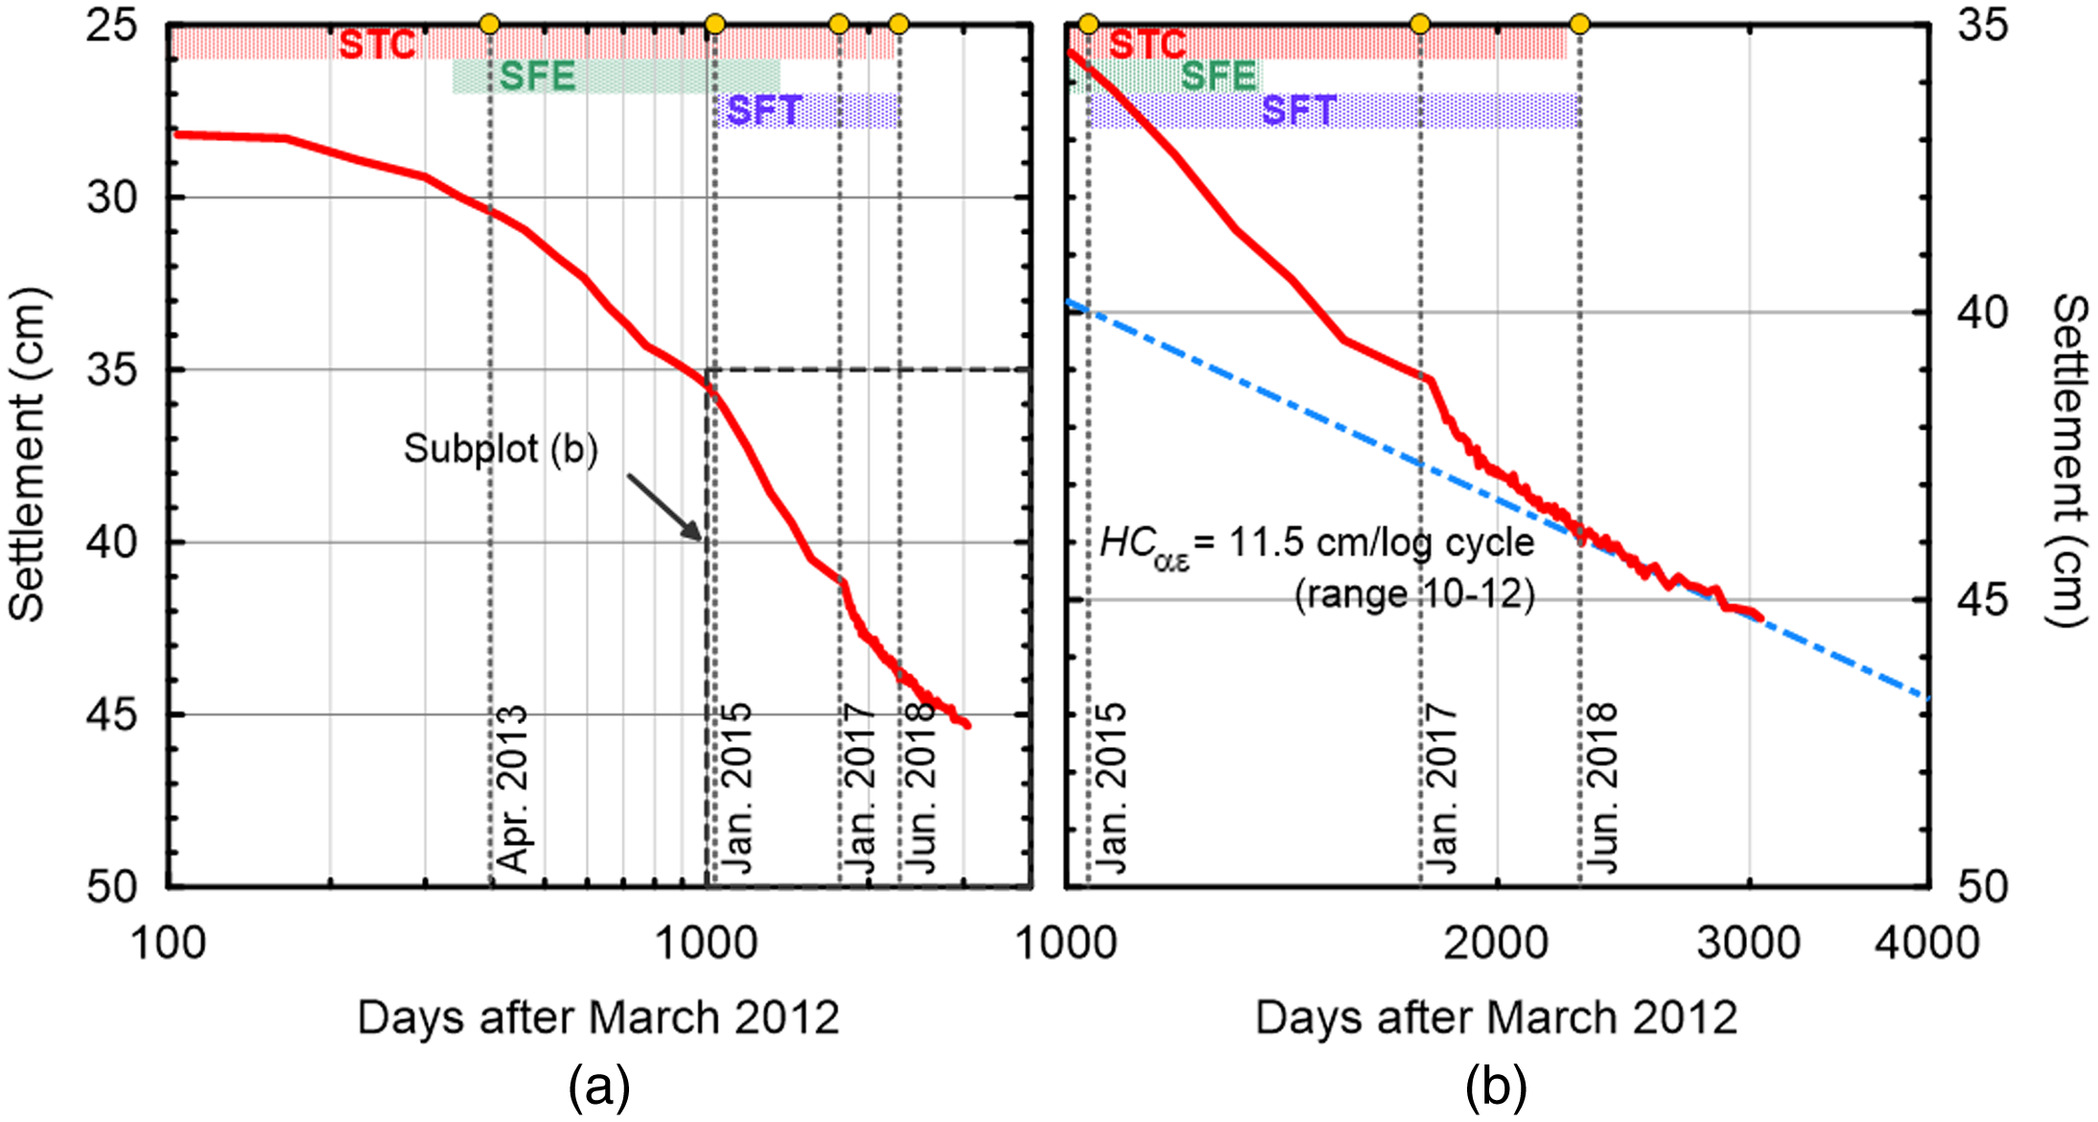
Fig. 18(b) expands the view for a recent time interval (1,000 to 3,000 days since April 2012) along with a line fit to the final data stage with slope cycle time. This slope, which characterizes the settlement rate since late 2017, is smaller than that found for 2009–2011 and is relatively consistent with laboratory-based estimates of . This suggests that primary consolidation had effectively ended by that time, which is also consistent with lack of excess water pressures from piezometers (Fig. 8).
We recognize that resetting the start time for consolidation to April 2012 affects the logarithmic slope calculations (Brandenberg 2017). An alternative that was considered was to reject the 2012 reset by maintaining the 2006 start time, which results in cycle time for the same time interval considered in Fig. 18(b). This rate exceeds considerably that in Fig. 15, when consolidation may not have been complete, which would require incomplete consolidation in the period since late 2017. Because the pore pressure data indicate that consolidation is complete during this period (Fig. 8), we conclude that effective reset in 2012 is the more reasonable interpretation.
Tower Tilt
Figs. 12 and 13 show that Tower movements toward the west accelerated at several times, including 2012, 2013, 2015, and 2017. At each of these times, dewatering and excavations occurred west of the Tower site (STC, SFT, SFP). In the north–south direction, following very gradual northward tilt pre-2011, tilt abruptly changed direction toward the south in 2011 (commencement of STC construction), toward the north in 2013 (SFE and STC construction), and effectively did not change from mid-2014 onward (during SFT and SFP construction).
When the post-2011 and pre-2011 tilt observations are viewed in aggregate, a pattern emerges in which the Tower consistently tilts toward dewatered excavations at adjacent sites. This response can be explained based on nonuniform volume change [Fig. 17(a)] and shear deformation effects. Simulations are required to provide insight into the relative significance of these effects, which is the subject of the next section.
Simulations of Foundation Movement
The emphasis of this paper to this point has been on the presentation and interpretation of objective data on the Millennium Tower foundation movement case history. Modeling of the foundation performance is taken up in this section. We acknowledge that these analyses are necessarily somewhat subjective and other modelers might make different assumptions and produce different findings. Our main objectives with the simulations presented here are to: (1) evaluate the degree to which methods used in practice can capture measured settlements and their variation with time; and (2) provide insight into the relative significance of volume change and shear deformations on foundation settlements. The second objective is investigated by evaluating differences between foundation movement predictions from 1D to 3D models. A series of 1D analyses at different locations within the Tower footprint could be used to predict tilt related to spatially variable volume change–related settlements. However, for the sake of brevity in this paper, only 3D models are used to analyze foundation tilt.
The following subsections present the depth-dependent stress increases considered in the analyses, describe calculations of immediate settlement (from shear distortion), present 1D analyses of consolidation and secondary compression, and present 3D analyses of combined volumetric and shear responses.
Stress Increase
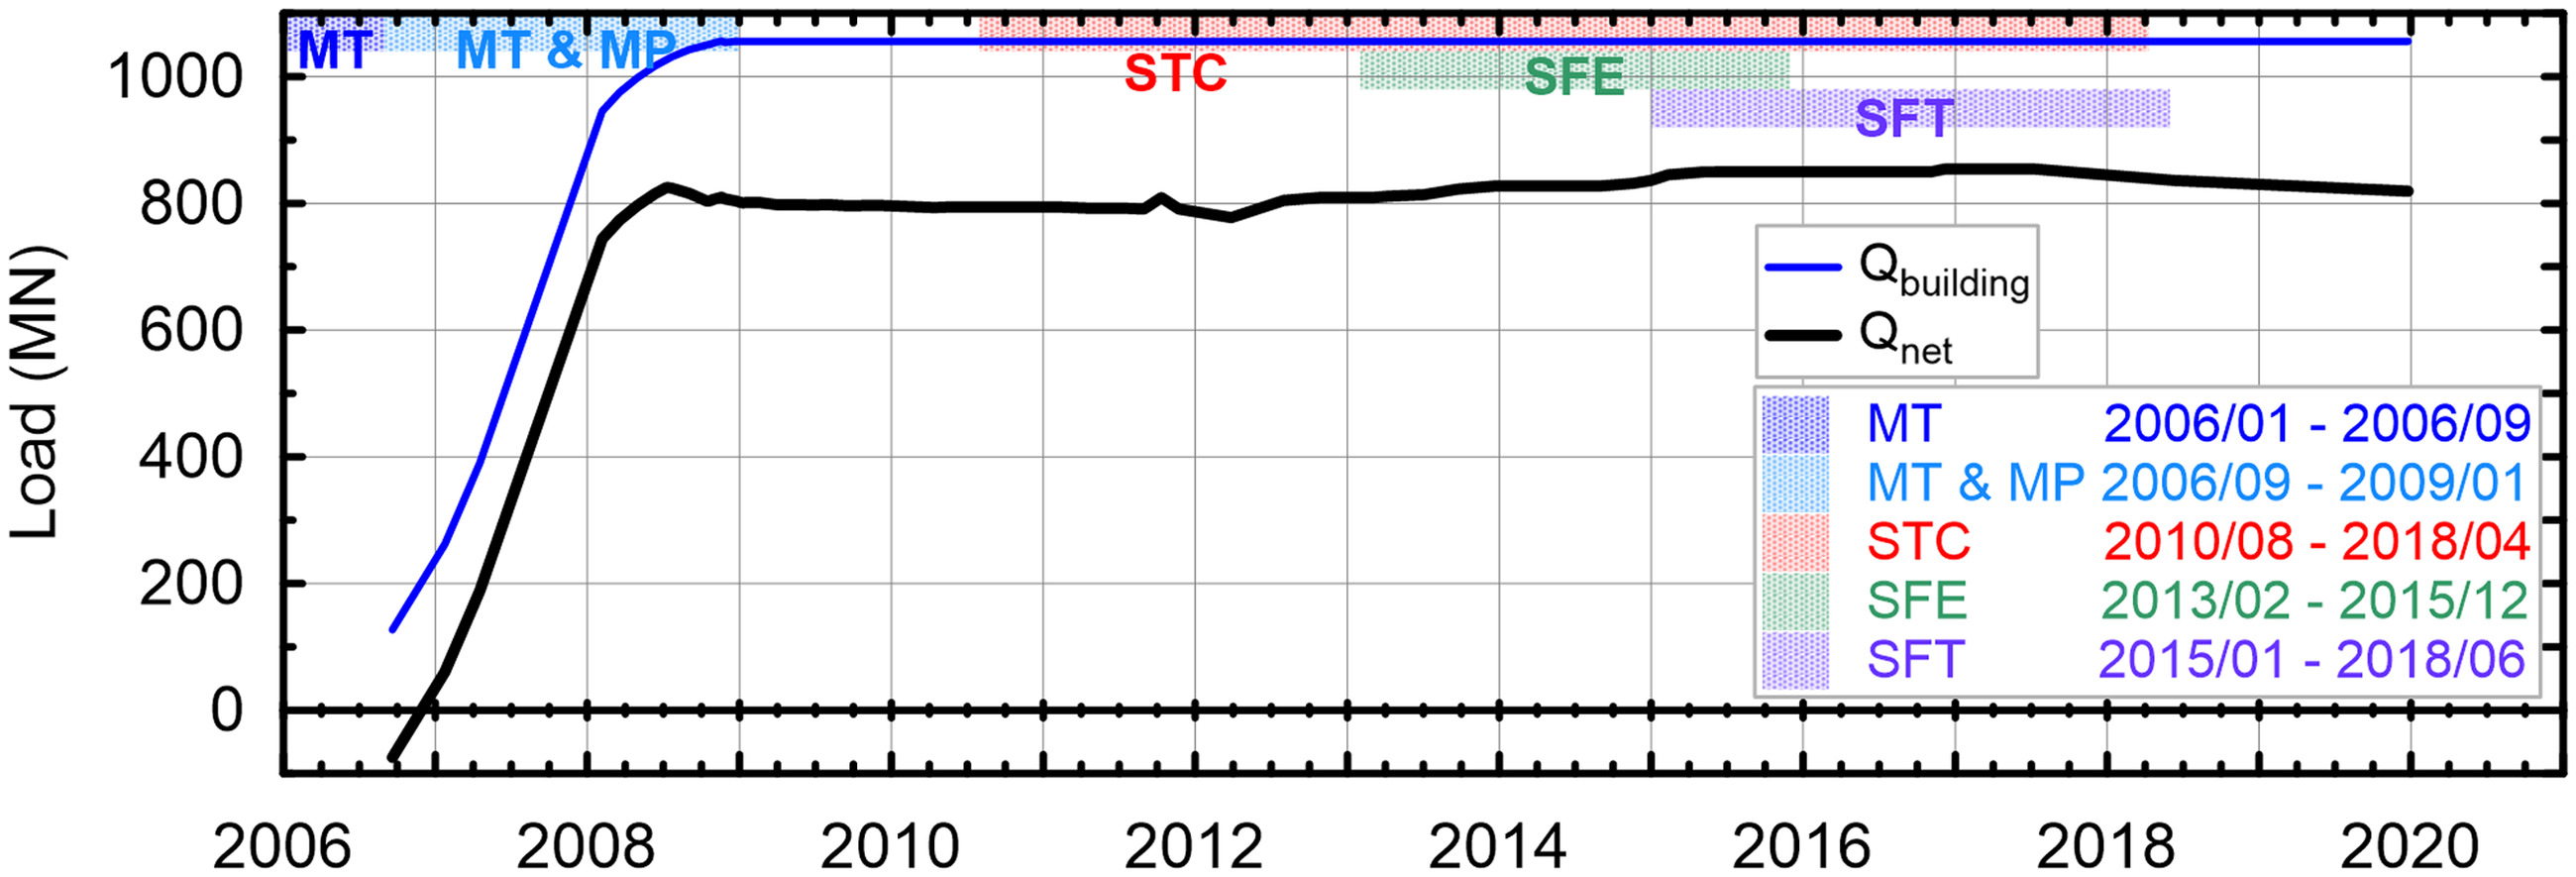
The Tower self-weight () was derived from column loads in permit documents. The time rate of self-weight application () was developed from documented construction milestones. Self-weight was reduced in consideration of the excavated soil mass and the buoyant force from the average groundwater level in Fig. 7. Fig. 19 shows the resulting time variation of net building load (range is from to 790 MN).
For a specific value of (corresponding to a particular time), we considered two methods for analysis of stress increase as a function of depth in the upper OBC soils. Method 1 assumed transfer of net loads from the piles to the lower marine sand and Colma sand units through side friction and end bearing (equivalent raft method; Terzaghi and Peck 1967; Peck et al. 1974; Meyerhof 1976). Those loads were distributed at a 4:1 slope with depth along the length of the piles within the lower marine sand and Colma sand units and then distributed with depth below the equivalent raft according to the 2:1 method (Hannigan et al. 2006, adapted from Cheney and Chassie 1993). An average pile tip elevation of (depth of 24.9 m) was used in these analyses. The equivalent raft was taken at a depth of 23.6 m, which is approximately middepth in the combined marine sand/lower marine sand/Colma sand units. Its lateral dimensions were . The stress distribution from the equivalent raft method was found to be broadly consistent with stress transfer from the piles to the soil as informed by the 3D model, described subsequently.
Method 2 evaluated stress increase from the 3D model of the site. Details of the 3D model are presented subsequently (“Three-Dimensional Deformation Analysis” section). This method of analysis included the individual piles (thus avoiding the need for the equivalent raft approximation) and the horizontally variable stratigraphy of the site. Stress increase from this model depended on horizontal position beneath the building footprint as well as depth. Within the footprint of the Tower foundation, an area about ⅓–½ of the footprint area located northwest of center generally experienced the largest stress increases (details in Section S2 in the Supplemental Materials). The total stress increase in this area without effects of adjacent construction was compared to that from Method 1 in Fig. 16. Because the stress increases from Methods 1 and 2 were similar over the depth range that most strongly contributes to the settlement (i.e., below the especially overconsolidated crust from 27 to 32 m depth), only a single result (from the equivalent raft method) was used in the 1D analyses presented subsequently in this section. The 3D analyses of settlement used the spatially variable stress increases derived in those analyses.
Immediate Settlement
We considered three sources of immediate settlement: elastic pile shortening, immediate settlements in the Colma sand unit, and shear deformations in the upper OBC unit. Elastic pile shortening above the equivalent raft was computed from axial strains integrated over effective pile lengths of 16 m (distance from foundation mat to equivalent raft) and Young’s moduli from ACI (2008) (34,000 MPa). Immediate settlements in the Colma sand were computed by applying the method of Burland and Burbidge (1985) to the equivalent raft. These analyses considered the problem geometry, including the layer thickness below the equivalent raft (3.8 m), and the average standard penetration test blow count of 29 over this depth range.
Immediate settlement from shear deformation of the upper OBC was calculated using elastic methods applicable for the case of a vertical uniform stress applied to a finite area. Using procedures by Mayne and Poulos (1999), we considered the effects of modulus increase with depth, the location of a rigid layer at limited depth (taken as 15 m below the top of the upper OBC, corresponding approximately to the depth below which the upper OBC only experiences recompression in the analysis), the rigidity of the foundation, and the depth of embedment of the equivalent raft.
The 3D analyses considered these same mechanisms, but they are directly incorporated into the model using the same material properties.
One-Dimensional Settlement Analysis
One-dimensional methods of analysis are commonly used to assess the effects of primary consolidation and secondary compression. The 1D assumption implies horizontal soil layering and vertical seepage of pore fluids during consolidation. The analyses produce time-dependent volumetric strains in the soil column (which are integrated to settlement) but do not consider the effects of shear deformations. The effects of adjacent construction are considered in these analyses through groundwater lowering as reflected in the “Baseline” model shown in Fig. 7. We applied 1D methods to evaluate their ability to capture observed foundation responses and to evaluate the effects of soil parametric variability.
Analysis Approach
The time-dependent consolidation settlement of clay is governed by the diffusion differential equation, which was recast in one dimension by Terzaghi (1925) as the consolidation differential equation. Analytical solutions to the consolidation equation exist for simple cases, but those solutions do not consider time variations in loading, hydrostatic pressures, and coefficient of consolidation that are important for the present application. Accordingly, we solved the consolidation equation using a finite-difference recurrence approach. This approach, which adapts recurrence relations developed by Harr (1966) as presented in Section 9.3.2 of Holtz et al. (2011) to incorporate the aforementioned time-variable quantities, is described in Section S1 in the Supplemental Materials. The 1D analyses assumed double drainage at the top and bottom of both the upper and lower OBC units (relatively granular soils at the interface of these units were taken as a drainage boundary).
Secondary compression was considered in the analysis both during primary consolidation () and following primary consolidation () in a manner that accounted for the effects of OCR on the secondary compression strain index () of individual layers. Section S1.5 in the Supplemental Materials describes how secondary compression was considered simultaneously with primary consolidation, and Section S1.6 describes how the overconsolidation effect on secondary compression rates was accounted for.
Secondary compression settlement for a layer of thickness over time interval was computed aswhere = secondary compression strain index at depth ; = ratio of the reduced secondary compression strain index due to overconsolidation and the secondary compression strain index at depth ; = elapsed time since the load was applied that induced primary consolidation; and to =time interval for which the secondary compression increment is computed. During initial loading, the ratio is taken as zero for and is otherwise estimated as described in Section S1.6 . Because secondary compression is neglected for high OCRs during initial loading, analysis of secondary compression associated with recompression requires an assessment of the time when , which is denoted .
(3)
Using these procedures for analysis of secondary compression increments, the secondary compression settlement for the entire stratum was computed aswhere is from Eq. (3).
(4)
Soil Properties
Material parameters used in the consolidation and secondary compression analyses are derived from the test data presented in the “Site Characteristics” section. The specific soil layering and baseline properties used in the analyses are given in Table 2. As shown in Figs. 3 and 16, baseline profiles for each property were established for the upper and lower OBC units based on the data trends. Variations of compressibility parameters (i.e., and ) and rate parameters ( for normally consolidated and overconsolidated conditions; ) were considered in formulating 12 alternative parameter sets (referred to as Runs 1–12), as shown in Table 3. The specific changes in compressibility parameter values shown in Table 3 are up to approximately one standard deviation (i.e., , , ) based on the data scatter shown in Fig. 3. Two additional parameter sets were considered for higher and lower profiles in the upper OBC, as shown in Fig. 16 (referred to as Runs 13 and 14). These alternative parameter sets were formulated in consideration of data scatter, parameter correlations (e.g., , , and were varied from baseline in a similar manner), and degree of realism given data trends (discussed further subsequently). Variations in the depth to groundwater over the time horizon of the initial construction (i.e., through 2007) were considered in additional runs and found not to significantly influence results; these results are not presented here for brevity.
| Layer no. | Depth at center of layer (m) | () | () | (kPa) | |||
|---|---|---|---|---|---|---|---|
| 1 | 28.2 | 0.200 | 0.0200 | 0.00620 | 5.02 | 37.82 | 694 |
| 2 | 29.7 | 0.200 | 0.0200 | 0.00620 | 4.97 | 37.82 | 694 |
| 3 | 31.2 | 0.200 | 0.0200 | 0.00620 | 4.93 | 37.82 | 694 |
| 4 | 32.8 | 0.250 | 0.0250 | 0.00775 | 3.64 | 26.08 | 599 |
| 5 | 34.3 | 0.300 | 0.0300 | 0.00930 | 3.02 | 21.73 | 599 |
| 6 | 35.8 | 0.300 | 0.0300 | 0.00930 | 3.02 | 21.91 | 603 |
| 7 | 37.3 | 0.300 | 0.0300 | 0.00930 | 3.02 | 22.08 | 608 |
| 8 | 38.9 | 0.300 | 0.0300 | 0.00930 | 3.04 | 22.43 | 618 |
| 9 | 40.4 | 0.300 | 0.0300 | 0.00930 | 3.06 | 22.78 | 627 |
| 10 | 41.9 | 0.300 | 0.0300 | 0.00930 | 3.10 | 23.30 | 642 |
| 11 | 43.4 | 0.300 | 0.0300 | 0.00930 | 3.14 | 23.82 | 656 |
| 12 | 45.0 | 0.300 | 0.0300 | 0.00930 | 3.19 | 24.52 | 675 |
| 13 | 46.5 | 0.300 | 0.0300 | 0.00930 | 3.24 | 25.21 | 694 |
| 14 | 48.0 | 0.300 | 0.0300 | 0.00930 | 3.31 | 26.08 | 718 |
| 15 | 49.5 | 0.300 | 0.0300 | 0.00930 | 3.38 | 26.95 | 742 |
| 16 | 51.1 | 0.300 | 0.0300 | 0.00930 | 3.46 | 27.99 | 771 |
| 17 | 52.6 | 0.300 | 0.0300 | 0.00930 | 3.55 | 29.04 | 800 |
| 18 | 54.1 | 0.300 | 0.0300 | 0.00930 | 3.64 | 30.25 | 833 |
| 19 | 55.6 | 0.300 | 0.0300 | 0.00930 | 3.73 | 31.30 | 862 |
| 20 | 57.2 | 0.275 | 0.0275 | 0.00853 | 4.09 | 34.14 | 862 |
| 21 | 58.7 | 0.250 | 0.0250 | — | 4.52 | 37.56 | 862 |
| 22 | 60.2 | 0.250 | 0.0250 | — | 4.54 | 37.56 | 862 |
| 23 | 61.7 | 0.250 | 0.0250 | — | 4.57 | 37.56 | 862 |
| 24 | 63.2 | 0.250 | 0.0250 | — | 4.60 | 37.56 | 862 |
| 25 | 64.8 | 0.250 | 0.0250 | — | 4.63 | 37.56 | 862 |
| 26 | 66.3 | 0.250 | 0.0250 | — | 4.66 | 37.56 | 862 |
| 27 | 67.8 | 0.250 | 0.0250 | — | 4.69 | 37.56 | 862 |
| 28 | 69.3 | 0.250 | 0.0250 | — | 4.72 | 37.56 | 862 |
| 29 | 70.9 | 0.250 | 0.0250 | — | 4.76 | 37.56 | 862 |
| 30 | 72.4 | 0.250 | 0.0250 | — | 4.79 | 37.56 | 862 |
| 31 | 73.9 | 0.250 | 0.0250 | — | 4.82 | 37.56 | 862 |
Results
Using the approach described previously with the net foundation loading in Fig. 19 and the groundwater variations in Fig. 7, consolidation, secondary compression, and immediate settlements were computed for baseline soil properties. These are shown in Fig. 20, as well as the total predicted settlements and measured settlements (planar average and SM11 and 27 to indicate the range). Consolidation made up about 70% of the cumulative settlement as of early 2020, the balance being roughly equally divided among immediate settlements and secondary compression. Immediate settlements have been essentially constant since 2009. Secondary compression has been a significant portion of the continuing settlement since early 2019.
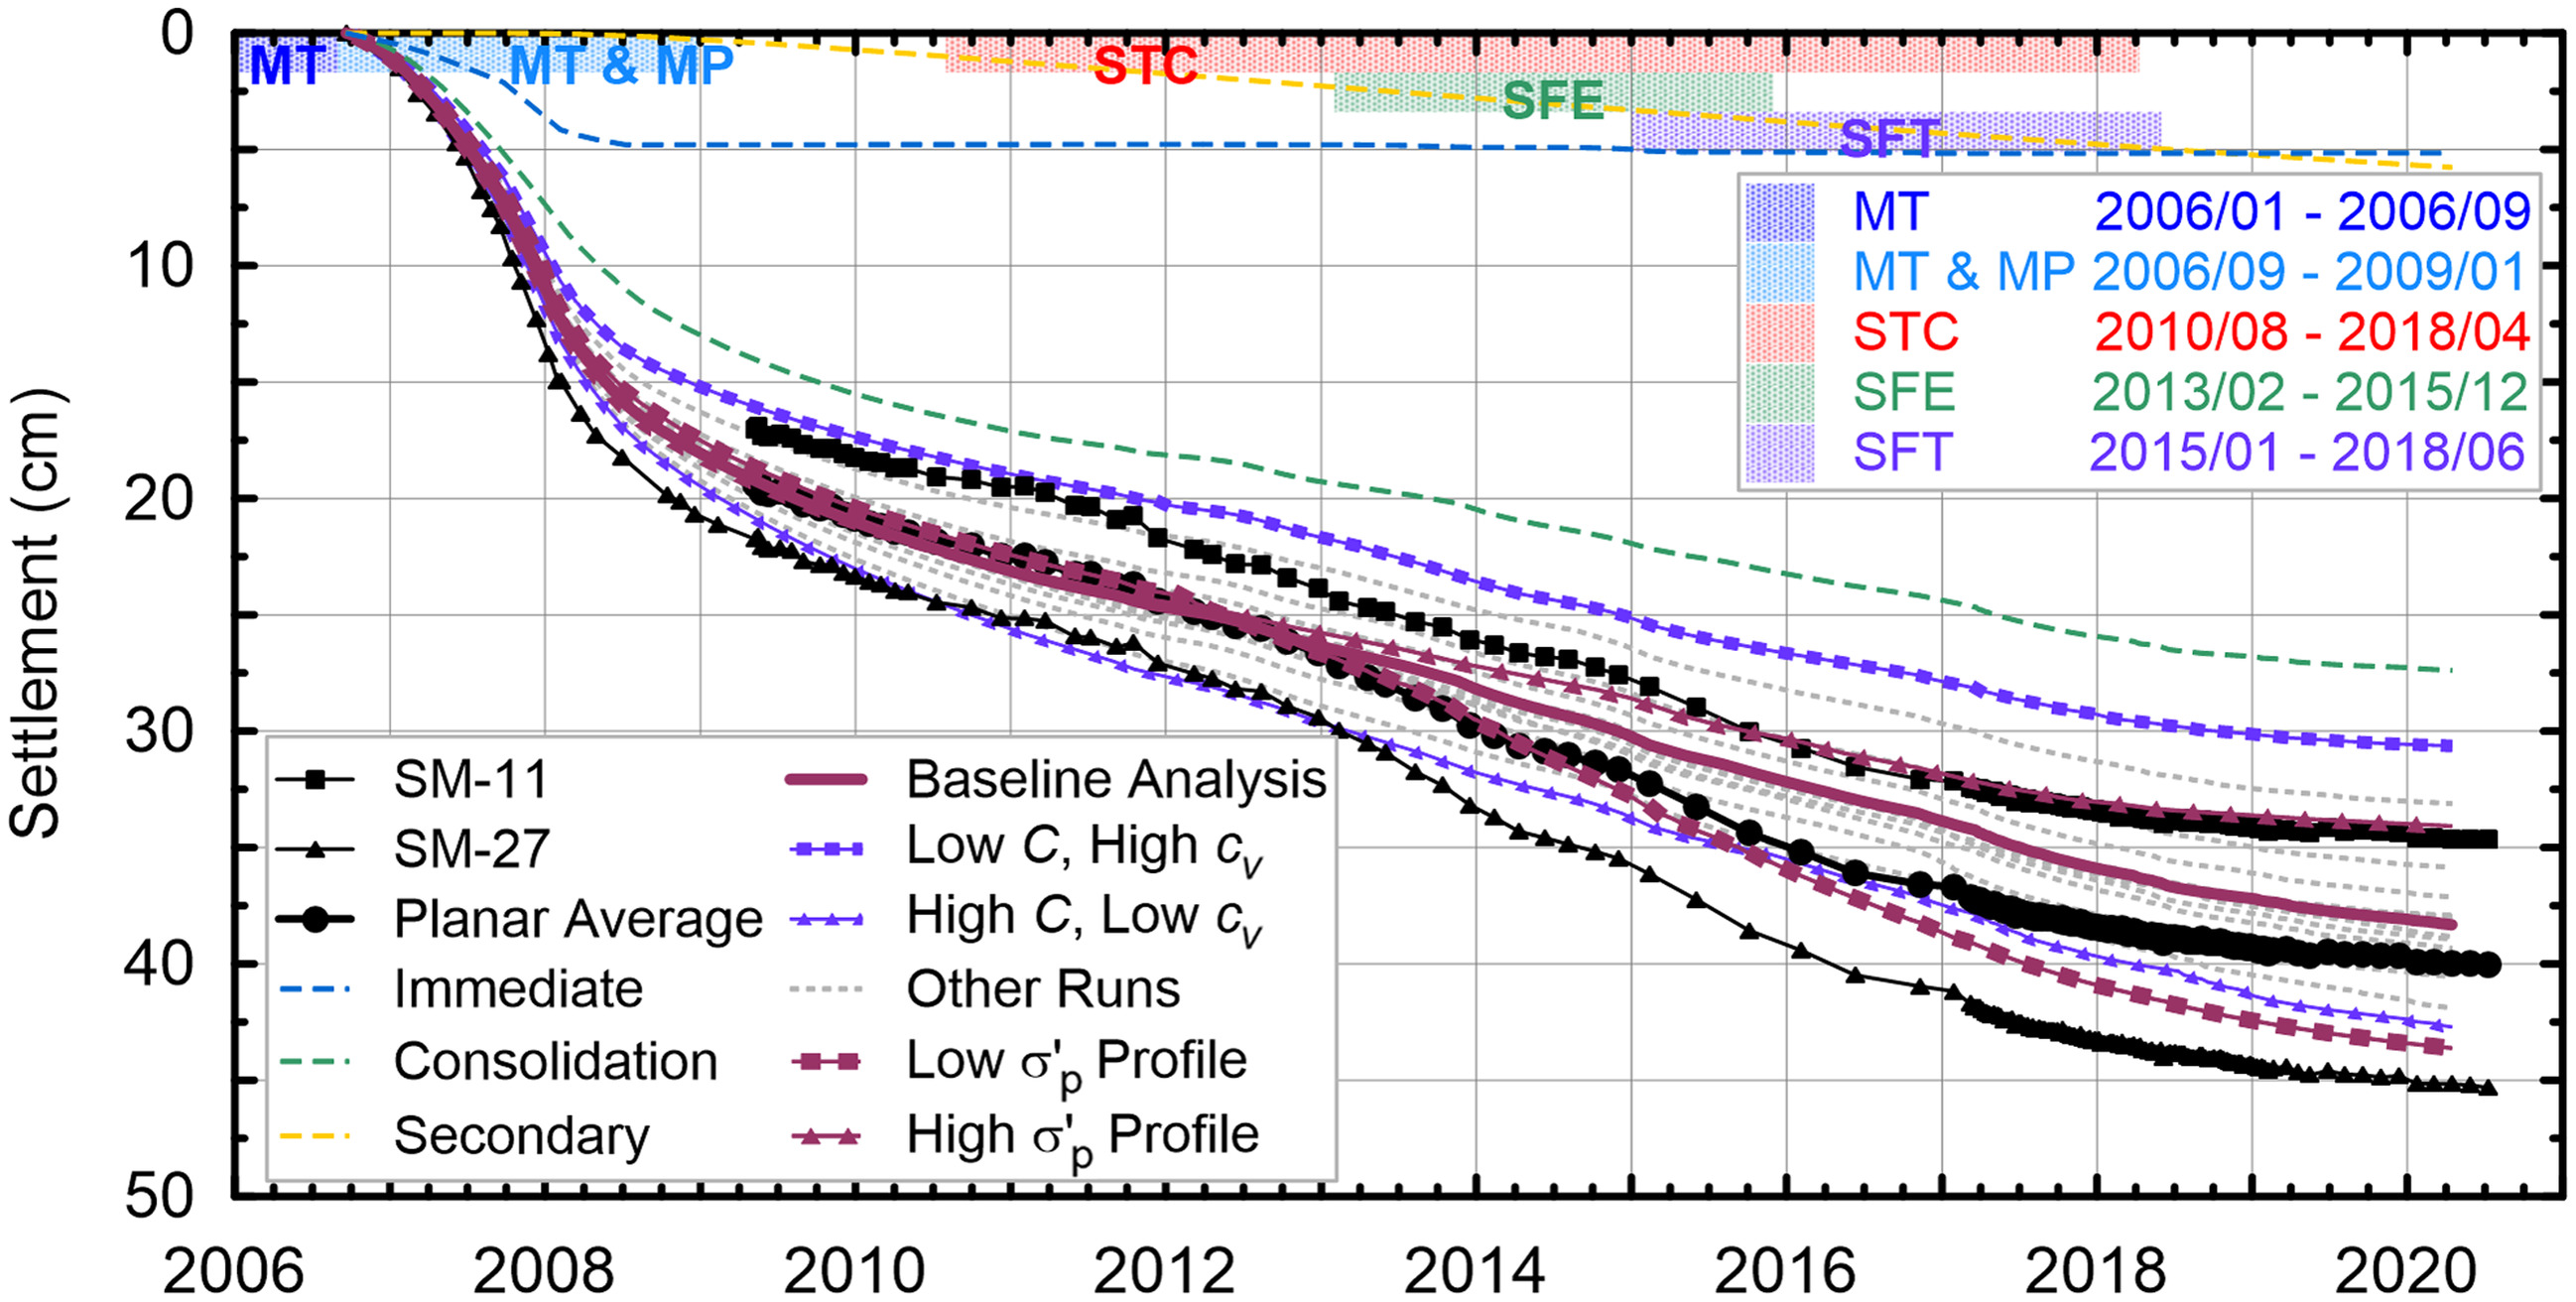
The overall settlement amount compares favorably to the planar average, including the relatively modest rate of settlement since early 2019. As described in the “Foundation Settlement” section, measured foundation settlements accelerated at several points in time coinciding with construction activities (excavation, dewatering) at adjacent sites. These effects were also evident from the simulations, most notably as downward inflections of consolidation settlements in mid-2012 and the start of 2015. The principal misfit of the 1D simulations from the planar average settlement was an underprediction of settlement rate starting in 2013, at the time of STC Zone 3–4 and SFE dewatering. This underprediction causes simulated settlements to fall below measurements from 2013 to 2018. Potential causes of underpredicted settlement rates in 2013 include too-slow consolidation in the 1D model resulting from 3D flow dissipating excess pore pressures and potentially shear-related movements from excavations (examined further in the next subsection).
In the “Performance Assessment” section, we inferred the relative contributions of primary consolidation and secondary compression on observed settlement rates. This issue is explored further by interpreting the excess pore water pressure distribution with depth from the 1D simulations to evaluate the average degree of consolidation (), computed aswhere = stress change inducing consolidation at depth (influenced by and groundwater changes, as discussed in Section S1 ); and = excess pore pressure at depth and time . At the end of 2011, which immediately preceded the onset of major STC construction, was approximately 81% for the upper OBC and 100% for the lower OBC. This suggests that primary consolidation may have contributed modestly to the settlement rate shown in Fig. 15. In April 2019 and May 2020, the 1D simulations indicated and 98%, respectively, for the upper OBC and for the lower OBC at both times, which is consistent with inferences of consolidation having been essentially completed from both observed settlement rates (Fig. 18) and measured pore pressures (Fig. 8).
(5)
The groundwater rebound of 2.1 m that occurred between 2018 and mid-2020 lowered and has overconsolidated portions of the upper OBC, which previously experienced virgin compression. The effective OCR of this sublayer was 1.02 in May 2020 in the 1D analysis, which slows secondary compression by reducing . This effect is included in the computed settlements shown in Fig. 20.
Fig. 20 also shows variations of total settlements across the 15 runs reflecting soil parametric variability. The variability among the settlement results was modest, which is somewhat by design—the variations shifted compressibility parameters and in opposite directions relative to baseline (e.g., Run 1 had lower compressibility, higher ; Run 2 had higher compressibility, lower ), which was done to reflect correlations between these parameters. The results show that reasonable variations in soil compressibility parameters and did not affect the ability of 1D methods to capture the main settlement features. On the other hand, uniform modifications up or down of preconsolidation pressures across the OBC profile (not included in the 15 variability runs) shifted down and up, respectively, computed settlements. Such results are not shown in Fig. 20.
As described previously, the profile used in the analysis (Fig. 16) was selected to represent trends in laboratory data while also producing computed settlements that are consistent with measurements. Variations in the profile were considered for the upper OBC as shown in Fig. 16. If these profile changes were applied while maintaining all other properties at baseline levels, settlements would shift up and accelerate for lower and shift down and decelerate for higher , producing mismatches with observation. Instead, we modestly adjusted compressibility and rate parameters along with , as shown in the last two rows of Table 3, to see if reasonable agreement with data could be obtained. For the lower case (Run 13), even with reduced compressibility parameters (within the range of data in Fig. 3), calculated settlements exceeded observations and had too-high settlement rates in mid-2020 (indicating continuing consolidation). This indicates that the lower profile cannot reasonably replicate field performance when used in 1D analyses. For the higher case (Run 14), the calculated settlement approximately matched the lower bound observed settlement for the initial loading and postconstruction time period. However, the profile was too high for significant virgin compression to occur, which produced mismatched settlement rates, especially from dewatering (since 2012).
Three-Dimensional Deformation Analysis
Three-dimensional methods of analysis have the ability to account for several factors that are neglected in 1D analyses, including spatial variations in soil layer thicknesses and properties, spatial variations in water table depths, more realistic (nonvertical) seepage paths, and shear deformations. The effects of adjacent construction were considered in these analyses through groundwater lowering (as in the 1D analyses) as well as through shear deformations from stress changes (e.g., excavations). The objective of the 3D analyses described here was to qualitatively assess the significance of these effects on the computed foundation performance. For brevity, the results reported here considered only baseline soil parameters used in 1D analyses; no “tuning” of parameters was applied to improve the fit of computed foundation deformations to measurements. Moreover, no randomization of stress history or compressibility parameters in the horizontal plane was considered.
Analysis Approach
FLAC3D version 7 (Itasca Consulting Group, Inc. 2019) was used to model the soil–structure interaction, hydromechanical coupling, and time-dependent (viscous) elastoplastic behavior of the soil in the overall system. The Supplemental Materials (Section S2.1 ) describe details of the analyses, including the sequencing of construction phases in the model.
As in the 1D analyses, variations with time of net foundation loading were considered as shown in Fig. 19. Dewatering of adjacent sites was included in the model, and groundwater levels in the model domain were allowed to fluctuate in response to the dewatering (see Section S2.3 ).
Material Models
Three constitutive models were used for different materials: elastic, plastic hardening (PH; Schanz et al. 1999), and soft soil creep (SSC) models (Stolle et al. 1999; Vermeer and Neher 1999). The fundamental soil properties used to set model parameters were taken from the baseline profiles in Fig. 3 and matched those used in the 1D analyses. Section S2.2 presents details on implementation of the material models, a calibration process undertaken for the SSC model in OBC, modeling of the Tower’s pile foundations, and the specification of soil hydraulic conductivity parameters.
Results
The FLAC3D simulations captured consolidation, secondary compression, shear deformations, and immediate settlements. Fig. 21 plots the resulting settlement versus time along with the planar average settlement and the computed settlement from 1D analysis. The 3D analyses produced similar amounts of cumulative settlement and matched the observations well. The similarity of the 1D and 3D cumulative settlements suggests that volume change was the dominant mechanism causing settlements; this is inferred because volume change is considered in both sets of analyses whereas shear deformations are only considered in the 3D case. Relative to the 1D analyses, the 3D analyses better represented the settlement inflection point in early 2013. The modeled settlements rebounded in 2019, which was not seen in the observed settlements. This rebound was due to groundwater in the model recharging more quickly than the field measurements.
To estimate the degree of consolidation from 3D analysis for a given time (), we computed stress change and excess pore pressures for the finite-difference zones within the envelope of the building foundation across the thickness of the OBC layers. The average stress change and excess pore pressure for a given depth were computed, the profiles of which were then used to estimate , as in Eq. (5). At the end of 2011, in the upper OBC and 100% for the lower OBC. The 90% consolidation in the upper OBC was higher than for this same time, due to allowance for horizontal seepage. The higher degree of pore pressure dissipation in the 3D analyses caused the inflection point in 2013 (when additional pore pressures were generated from adjacent construction) to be more pronounced, which in turn produced better agreement with the data for the time period 2013–2018. At the start of 2019, the 3D simulations indicated was about 99% in the upper OBC, which again supports the interpretation of consolidation being essentially complete.
Fig. 22 compares measured horizontal roof deflections from foundation tilt to computed results from the 3D model (these deflections were zero for the 1D model). Unlike measured deflections, computed deflections started during Tower construction, and the values at the onset of measurements (early 2009) were 10 cm to the north and 15 cm to the west, which can be compared to data-derived estimates (Figs. 12 and 13) of the deflections at that time of 10–12 cm (north) and 1–8 cm (east). Since 2009, the 3D model overestimated both cumulative deflection and change in deflection to the north by about 10 cm. The 3D model overestimated the cumulative deflection to the west by about 18 cm, but the change in deflection since 2009 (42 cm) compared favorably with measurements (44 to 50 cm).
In the north–south direction, the effects of adjacent construction were evident in the computed deflections in a similar manner to that shown by the data, including:
•
Reversal of deflection toward the south in 2012;
•
Reversal of deflection toward the north in 2013; and
•
Relatively small change in deflection from 2014 to 2020.
In the east–west direction, the effects of adjacent construction were not readily apparent in the computed deflections. Whereas the measured data showed clear inflection points in 2013, 2015, and 2017, the slope of the computed deflections was relatively constant. Computed deflections were influenced by too-large moments applied to the foundation from P-delta effects associated with overpredicted westerly deflections in 2009. Our interpretation is that these moments may have produced relatively large tilt deflections from consolidation and shear of foundation soils, reducing sensitivities to groundwater variations, as occurred in the real structure.
Summary and Conclusions
This paper documents and analyzes the Millennium Tower case history of foundation movement over the time period 2006–2020. The value of this case history stems from the detailed information on foundation movements that can be used to interpret controlling mechanisms and to validate predictive models of consolidation or secondary compression and foundation movements from adjacent excavations. The objectives of the paper are to document the case history, interpret and analyze the data to elucidate deformation mechanisms in the foundation soils that led to the foundation movements, and evaluate whether the observed movements are predictable.
We describe site stratigraphy, key attributes of which are sand units extending approximately from 10 to 24 m depth and an underlying overconsolidated marine clay (upper Old Bay Clay). Compressibility and strength parameters of OBC were established from laboratory testing. We describe the Millennium Tower structure, its adjoining podium, and a series of neighboring structures mainly constructed from 2012 through mid-2018. We found that a critical aspect of the construction of these adjacent structures was dewatering and excavation for construction of substructures. Finally, we describe measured data from instrumentation, which included pore pressure measurements from piezometers, foundation and Tower movements (both settlement and tilt), and inclinometers measuring horizontal ground deflections.
Groundwater levels at the Tower site were lowered appreciably during podium construction but recovered rapidly starting in early 2008 once on-site dewatering was discontinued. Piezometric data show that adjacent construction lowered ground water at the Tower site in multiple episodes from mid-2012 to mid-2018, one of which (STC) was maintained for 6 years. The Tower settled approximately 40 cm in total, approximately half of which has occurred since the completion of Tower construction (late 2009). At roof level, the Tower has tilted 40 cm in the project west direction (since late 2009) and 17 to 18 cm in the project north direction (which has only modestly increased since late 2009). The Tower foundation movements in both settlement and tilt have exhibited inflections at various times since Tower construction coinciding with dewatering and excavation.
Engineering analysis of the case history with 1D and 3D methods demonstrates that the observed settlements were predictable in terms of cumulative amounts and their time variations. The settlements were dominated by volumetric deformations in the OBC unit from primary consolidation and secondary compression. Portions of this unit over the approximate depth range 33–45 m experienced virgin compression, which was the principal contributor. The role of primary consolidation has changed over time, dominating during construction at the Tower site (2005–2009) and from approximately 2012–2018. On the other hand, secondary compression was a significant contributor in the period immediately preceding adjacent construction (2010–2011) and has dominated from 2019 onward. Computed horizontal deflections from 3D analyses were able to capture the general directions and inflection points from observations in the project north–south direction, but did not capture the cumulative deflection amounts nor the inflection points in the project east–west direction.
This study is not the first to document long-term foundation settlement and tilt of a tall structure. For example, prior case histories of consolidation settlement of tower structures were presented by Briaud et al. (2007, 2009, 2015), which demonstrated the combined effects of tower weight and regional groundwater drawdown on settlement patterns. Moreover, case studies of ground movements adjacent to supported excavations were presented by Peck (1969), Long (2001), Moormann (2004), Korff (2013), and Korff et al. (2016), which demonstrated that the largest settlements occurred near excavations and the amount of settlement generally decreased with distance, thus producing tilt toward the excavation. These deformation patterns are consistent with those documented here for the Millennium Tower.
Supplemental Materials
File (supplemental_materials_jggefk.gteng-10244_stewart.zip)
- Download
- 2.28 MB
Data Availability Statement
Data on consolidation and secondary compression properties of the upper OBC soils was presented in Wagner et al. (2021) and its supplemental documents. The other data provided in this case history paper were assembled from professional reports that are cited as well as the following documents:
•
Arup North America, Ltd. (2009). Transbay Transit Center: Results of Settlement Survey at 301 Mission Property, data transmission.
•
Arup North America, Ltd. (2010). Correspondence from Nick O’Riordan Re: Survey of PG&E Vault Adjacent to 301 Mission Tower, September 24.
•
Arup North America, Ltd. (2015–2017). Salesforce Tower Monitoring Reports—No. 1 through 37, January 29, 2015 through August 23, 2017.
•
Langan Engineering (2017–2020). Building Monitoring Report(s) for 301 Mission Street, data transmissions.
•
Martin M. Ron Associates (MM Ron) (2006–2009). Summary of Surveyed Settlements: 301 Mission, data transmission.
The data from these sources have been assembled into supplemental tables to accompany the figures used in the paper. The publicly available documents can be obtained by contacting the San Francisco Department of Inspections ([email protected]) with the block or lot numbers for the project area (accessible here: https://sfplanninggis.org/pim/).
Acknowledgments
The authors thank Mission Street Development, LLC, which was the developer for the Millennium Tower project, for funding the work presented here. The first author was a presenting expert in legal proceedings related to causation. Our objectives in presenting this paper are as stated in the “Introduction” and are unrelated to the interests of any party in the legal proceedings. Many individuals and groups contributed both directly and indirectly to this effort in a variety of capacities, including Ron Hamburger, Lachezar Handzhiyski, and others from Simpson Gumpertz and Heger, Inc.; Sean Culkin from Integral Consulting, Inc.; Sydney Maguire, Barry Zheng, and Tom Clifford from Slate Geotechnical Consultants, Inc.; various consultants at Langan Engineering and Environmental Services; and various consultants at ENGEO, Inc. We thank the two sets of three anonymous reviewers for different versions of this paper, whose constructive feedback has improved the paper.
References
ACI (American Concrete Institute). 2014. Building code requirement for structural concrete and commentary. ACI 318-12. Farmington Hills, MI: ACI.
Arup North America, Ltd. 2009. Report on the preliminary design of the buttress for limiting the excavation-induced deformations, 2009–2019. San Francisco: Transbay Transit Center Project.
Arup North America, Ltd. 2010. Transbay Transit Center program: Transbay Transit Center. Los Angeles: Arup North America.
Arup North America, Ltd. 2013. Transbay Tower final geotechnical data report. Los Angeles: Arup North America.
Arup North America, Ltd. 2018. Memorandum, Salesforce Transit Center, supplemental instrumentation installation. Los Angeles: Arup North America.
Bjerrum, L. 1967. “Engineering geology of Norwegian normally-consolidated marine clays as related to settlement of buildings.” Géotechnique 17 (2): 83–118. https://doi.org/10.1680/geot.1967.17.2.83.
Brandenberg, S. J. 2017. “iConsol.js: JavaScript implicit finite-difference code for nonlinear consolidation and secondary compression.” Int. J. Geomech. 17 (6): 04016149. https://doi.org/10.1061/(ASCE)GM.1943-5622.0000843.
Briaud, J. L., Y. Koohi, J. Nicks, and I. Jung. 2015. “San Jacinto monument: New soil data and analysis including subsidence.” J. Geotech. Geoenviron. Eng. 141 (6): 04015023. https://doi.org/10.1061/(ASCE)GT.1943-5606.0001299.
Briaud, J. L., J. Nicks, K. Y. Rhee, and G. Stieben. 2007. “San Jacinto monument case history.” J. Geotech. Geoenviron. Eng. 133 (11): 1337–1351. https://doi.org/10.1061/(ASCE)1090-0241(2007)133:11(1337).
Briaud, J. L., B. Smith, K. Y. Rhee, H. Lacy, and J. Nicks. 2009. “The Washington monument case history.” Int. J. Geoeng. Case Hist. 1 (3): 170–188.
Burland, J. B., and M. C. Burbidge. 1985. “Settlement of foundations on sand and gravel.” Proc. Inst. Civ. Eng. 78 (6): 1325–1381. https://doi.org/10.1680/iicep.1985.1058.
CBS (Columbia Broadcasting System). 2017. “San Francisco’s leaning tower of lawsuits.” Accessed January 30, 2017. https://www.cbsnews.com/news/millennium-tower-san-francisco-leaning-tower-of-lawsuits-60-minutes/.
Cheney, R. S., and R. G. Chassie. 1993. Soil and foundation workshop manual. 1st ed. Washington, DC: Federal Highway Administration.
Dames & Moore. 1966. Boring logs for 50 Beale Street, San Francisco, California, prepared for Bechtel Corporation San Francisco Office Building by Skidmore, Owings & Merrill (SOM). Los Angeles: Dames & Moore.
Dames & Moore. 1981. Geotechnical investigation, proposed Five Fremont Center project, San Francisco, California, prepared for Metropolitan Bechtel Shorenstein. Los Angeles: Dames & Moore.
DeSimone Consulting Engineers, LLC. 2005. Foundation permit submittal volume I—Project overview and structural analysis, Volume II—Foundation design, 301 Mission Street, San Francisco, CA. New York: DeSimone Consulting Engineers.
Hamburger, R. O., S. E. Harris, and L. V. Handzhiyski. 2021. “Stabilizing San Francisco’s leaning tower.” In Structure, 8–10. Chicago: National Council of Structural Engineers Associations.
Hannigan, P. J., G. G. Goble, G. E. Likins, and F. Rausche. 2006. Design and construction of driven pile foundations. Washington, DC: Federal Highway Administration.
Harr, M. E. 1966. Foundations of theoretical soil mechanics, 381. New York: McGraw-Hill.
Holtz, R. D., W. D. Kovacs, and T. C. Sheahan. 2011. An introduction to geotechnical engineering. 2nd ed. London: Pearson.
Itasca Consulting Group, Inc. 2019. FLAC3D 7.0 user’s manual. Minneapolis: Itasca.
Kluzniak, B., D. Koutsoftas, and N. O’Riordan. 2010. “Prototype test of soil-cement shoring walls for the Transbay Transit Center, San Francisco.” In Proc., Earth Retention Conf. 3, 294–302. Reston, VA: ASCE.
Korff, M. 2013. “Response of piled buildings to the construction of deep excavations.” Ph.D. thesis, Dept. of Engineering, Univ. of Cambridge.
Korff, M., R. J. Mair, and F. A. Van Tol. 2016. “Pile–soil interaction and settlement effects induced by deep excavations.” J. Geotech. Geoenviron. Eng. 142 (8): 04016034. https://doi.org/10.1061/(ASCE)GT.1943-5606.0001434.
Kutter, B. L., and N. Sathialingam. 1992. “Elastic-viscoplastic modelling of the rate-dependent behaviour of clays.” Géotechnique 42 (3): 427–441. https://doi.org/10.1680/geot.1992.42.3.427.
Ladd, C. C., and R. Foote. 1974. “A new design procedure for stability of soft clays.” J. Geotech. Eng. Div. 100 (7): 763–786. https://doi.org/10.1061/AJGEB6.0000066.
Long, M. 2001. “Database for retaining wall and ground movements due to deep excavations.” J. Geotech. Eng. Div. 127 (3): 203–224. https://doi.org/10.1061/(ASCE)1090-0241(2001)127:3(203).
Mayne, P. W., and H. G. Poulos. 1999. “Approximate displacement influence factors for elastic shallow foundations.” J. Geotech. Geoenviron. Eng. 125 (6): 453–460. https://doi.org/10.1061/(ASCE)1090-0241(1999)125:6(453).
Mesri, G., and Y. K. Choi. 1985. “The uniqueness of the end-of-primary (EOP) void ratio-effective stress relationship.” In Proc., 11th Int. Conf. on Soil Mechanics and Foundation Engineering, 587–590. Rotterdam, Netherlands: A.A. Balkema.
Meyerhof, G. G. 1976. “Bearing capacity and settlement of pile foundations.” J. Geotech. Eng. Div. 102 (3): 197–228. https://doi.org/10.1061/AJGEB6.0000243.
Moormann, C. 2004. “Analysis of wall and ground movements due to deep excavations in soft soil based on a new worldwide database.” Soils Found. 44 (1): 87–98. https://doi.org/10.3208/sandf.44.87.
Peck, R. 1969. “Deep excavation and tunneling in soft ground.” In Vol. 7 of 7th Int. Conf. on Soil Mechanics and Foundation Engineering, 225–290. Mexico City: Sociedad Mexicana de Mecanica.
Peck, R. B., W. E. Hanson, and T. H. Thornburn. 1974. Foundation engineering. 2nd ed. New York: Wiley.
SAGE Engineers, Inc. 2018. Data report for geotechnical investigation and piezometer installation, 301 Mission Street, City and County of San Francisco, California. Westfield, MA: SAGE Engineers.
Schanz, T., P. A. Vermeer, and P. G. Bonnier. 1999. “The hardening soil model: Formulation and verification.” In Proc., Int. PLAXIS Symposium: Beyond 2000 in Computational Geotechnics, edited by R. B. J. Breinkgreve, 281–296. Oxfordshire, UK: Taylor & Francis.
Slate Geotechnical Consultants, Inc. 2019. Geotechnical investigation & instrumentation installation—Plenum area, 301 Mission Street, San Francisco, California. South Lake Tahoe, CA: Slate Geotechnical Consultants.
Stolle, D. F. E., P. A. Vermeer, and P. G. Bonnier. 1999. “Time integration of a constitutive law for soft clays.” Commun. Numer. Methods Eng. 15 (8): 603–609. https://doi.org/10.1002/(SICI)1099-0887(199908)15:8%3C603::AID-CNM274%3E3.0.CO;2-F.
Taylor, D. W., and W. Merchant. 1940. “A theory of clay consolidation accounting for secondary compression.” J. Math. Phys. 19 (1–4): 167–185. https://doi.org/10.1002/sapm1940191167.
Terzaghi, K. 1925. “Erdbaumechanik auf Bodenphysikalischer Grundlage, Franz Deuticke, Leipzip und Wein.” In From theory to practice in soil mechanics: Selections from the writings of Karl Terzaghi with bibliography and contributions on his life and achievements, 10–13. Translated by A. Casagrande. New York: Wiley.
Terzaghi, K., and R. B. Peck. 1967. Soil mechanics in engineering practice. 2nd ed. New York: Wiley.
Terzaghi, K., R. B. Peck, and G. Mesri. 1996. Soil mechanics in engineering practice. 3rd ed. New York: Wiley.
TJPA (Transbay Joint Powers Authority). 2019. “Transbay Joint Powers Authority board meeting(s).” Accessed January 30, 2017. https://tjpa.org/news-information/calendar/board-meeting-dates.
Treadwell & Rollo, Inc. 1997. Geotechnical investigation, 350 Mission Street Building Seismic Strengthening, San Francisco, California. San Francisco: Treadwell & Rollo.
Treadwell & Rollo, Inc. 2005. Revised geotechnical investigation 301 Mission Street, San Francisco, California. San Francisco: Treadwell & Rollo.
Treadwell & Rollo, Inc. 2006. Correspondence from Christopher Ridley Re: Summary of pile driving, 301 Mission Street, San Francisco, California. San Francisco: Treadwell & Rollo.
Treadwell & Rollo, Inc. 2012. Geotechnical investigation, 350 Mission Street, San Francisco, California. San Francisco: Treadwell & Rollo.
Vermeer, P. A., and H. P. Neher. 1999. “A soft soil model that accounts for creep.” In Proc., Int. PLAXIS Symp.: Beyond 2000 in Computational Geotechnics, edited by R. B. J. Breinkgreve, 249–261. Rotterdam, Netherlands: A.A. Balkema.
Wagner, N., M. Largent, J. P. Stewart, C. Beyzaei, D. Murphy, J. Butkovich, and J. A. Egan. 2021. “Stress history-dependent secondary compression of San Francisco Bay region Old Bay clays.” J. Geotech. Geoenviron. Eng. 147 (7): 04021045. https://doi.org/10.1061/(ASCE)GT.1943-5606.0002525.
Information & Authors
Information
Published In

Journal of Geotechnical and Geoenvironmental Engineering
Volume 149 • Issue 6 • June 2023
Copyright
This work is made available under the terms of the Creative Commons Attribution 4.0 International license, https://creativecommons.org/licenses/by/4.0/.
History
Received: Jul 12, 2021
Accepted: Sep 2, 2022
Published online: Mar 27, 2023
Published in print: Jun 1, 2023
Discussion open until: Aug 27, 2023
Authors
Metrics & Citations
Metrics
Citations
Download citation
If you have the appropriate software installed, you can download article citation data to the citation manager of your choice. Simply select your manager software from the list below and click Download.