Polymer Injection and Liquefaction-Induced Foundation Settlement Mitigation: A Shake Table Testing Investigation
Publication: Journal of Geotechnical and Geoenvironmental Engineering
Volume 149, Issue 8
Abstract
Shake table experiments are conducted to assess the potential of the polymer injection technique as a liquefaction countermeasure. A large 2.9 m high (10 ft) laminar soil container on a () shake table is employed. Mitigation of liquefaction-induced settlement for a shallow foundation is explored. In a series of two shake table experiments, the system response is studied first without (baseline) and subsequently with polymer injected into the liquefiable stratum. Each test is densely instrumented to provide insights into the dynamic response of the soil and foundation system. Furthermore, cone penetration tests (CPTs) are performed pre- and postinjection to assess the extent of soil improvement. Strong base excitation is imparted by the shake table, resulting in liquefaction and excessive foundation settlement in the original baseline test. In the second test, with the polymer injection countermeasure, a significant reduction is observed in the tendency for liquefaction and the resulting foundation settlement. After this test, careful excavation provided additional insights into the polymer’s configuration within the deposit, increasing overall soil relative density, confinement and creating solidified paths for the shallow foundation load toward the lower, more competent stratum. As such, these mechanisms have the potential to allow for: (1) an increase in soil resistance to liquefaction, and (2) a significant reduction in settlement of overlying shallow foundations.
Introduction
Soil liquefaction during earthquakes results in severe damage to structures and foundations as documented in Japan (Ishihara and Koga 1981; Hamada et al. 1996; Ashford et al. 2011), Turkey (Bray et al. 2000), India (Jain et al. 2002), and New Zealand (Cubrinovski et al. 2010). For instance, during the 2010–2011 Canterbury earthquake sequence, severe liquefaction affected 3,000 buildings within the Christchurch Central Business District, of which over 50% were deemed economically unfit for further repairs (Cubrinovski 2013). Hence, in high seismic regions with loose saturated granular soils, remediation and/or retrofit measures must be undertaken to minimize the consequences of liquefaction.
Various techniques currently exist to improve liquefaction susceptible soils during earthquakes, such as densification, cementation, drainage, and replacement (Mitchell 1981; Adalier et al. 1998; Iai 2005; Yasuda and Harada 2014; Towhata 2021). Among such mitigation techniques, the injection of low viscosity polyurethane (polymer) has shown potential (Traylen et al. 2016), particularly at locations that might otherwise be difficult to treat with conventional techniques (e.g., under existing buildings and in dense urban environments).
A number of earlier laboratory studies demonstrated the beneficial effects of polymer remediation across various soil types (Maher et al. 1994; Yamazaki et al. 2005; Kim et al. 2017; Lee et al. 2017a, b; Shigang et al. 2013; Liu et al. 2019; Gatto et al. 2021). In addition to laboratory studies, field trials in Turkey (Erdemgil et al. 2007) reported significant increases in the postinjection standard penetration test blow counts (SPT N-value) at sites that suffered extensive damage during the 1999 Kocaeli earthquake.
In New Zealand, polymer injection field studies and applications (EQC 2016; Traylen et al. 2017) noted clear increases in CPT tip resistance (), shear wave velocity (), and lateral earth pressure coefficient (). Cyclic shear strains generated through a vibroseis machine and controlled blasting were considerably reduced. Thereafter, excavation of the treated area revealed that the composite (hardened polymer and solidified sand) formed veins/dykes (Traylen et al. 2017), with a thickness of few centimeters. More recently, this remediation technique was studied in-situ (Blake 2022) under conditions of controlled blasting. The outcome was quite positive, with reduced excess pore pressures and free-field ground settlement.
As a complement to these earlier studies, this paper presents results from two large-scale shake table experiments to study the effectiveness of polymer injection in mitigating liquefaction-induced settlement of a shallow foundation. In these two experiments, the ground-foundation system response is studied first without (baseline), and subsequently with polymer injected into the ground. Consequences, including excess pore pressure generation, foundation settlement, and soil/foundation accelerations, are targeted as key performance metrics to assess the polymer injection technique as a liquefaction countermeasure.
Details of the baseline test can be found in Jahed Orang et al. (2021). Results from the additional polymer test are presented herein and compared to the baseline counterpart. In the next sections, the following aspects are discussed: (1) polymer remediation, (2) experimental setup and model preparation, (3) configuration of the polymer-sand composite, (4) model characterization, (5) recorded dynamic response, and (6) the resulting mitigation mechanisms. Finally, conclusions are presented with remarks toward adoption of this remediation technique in practice.
Polymer Remediation
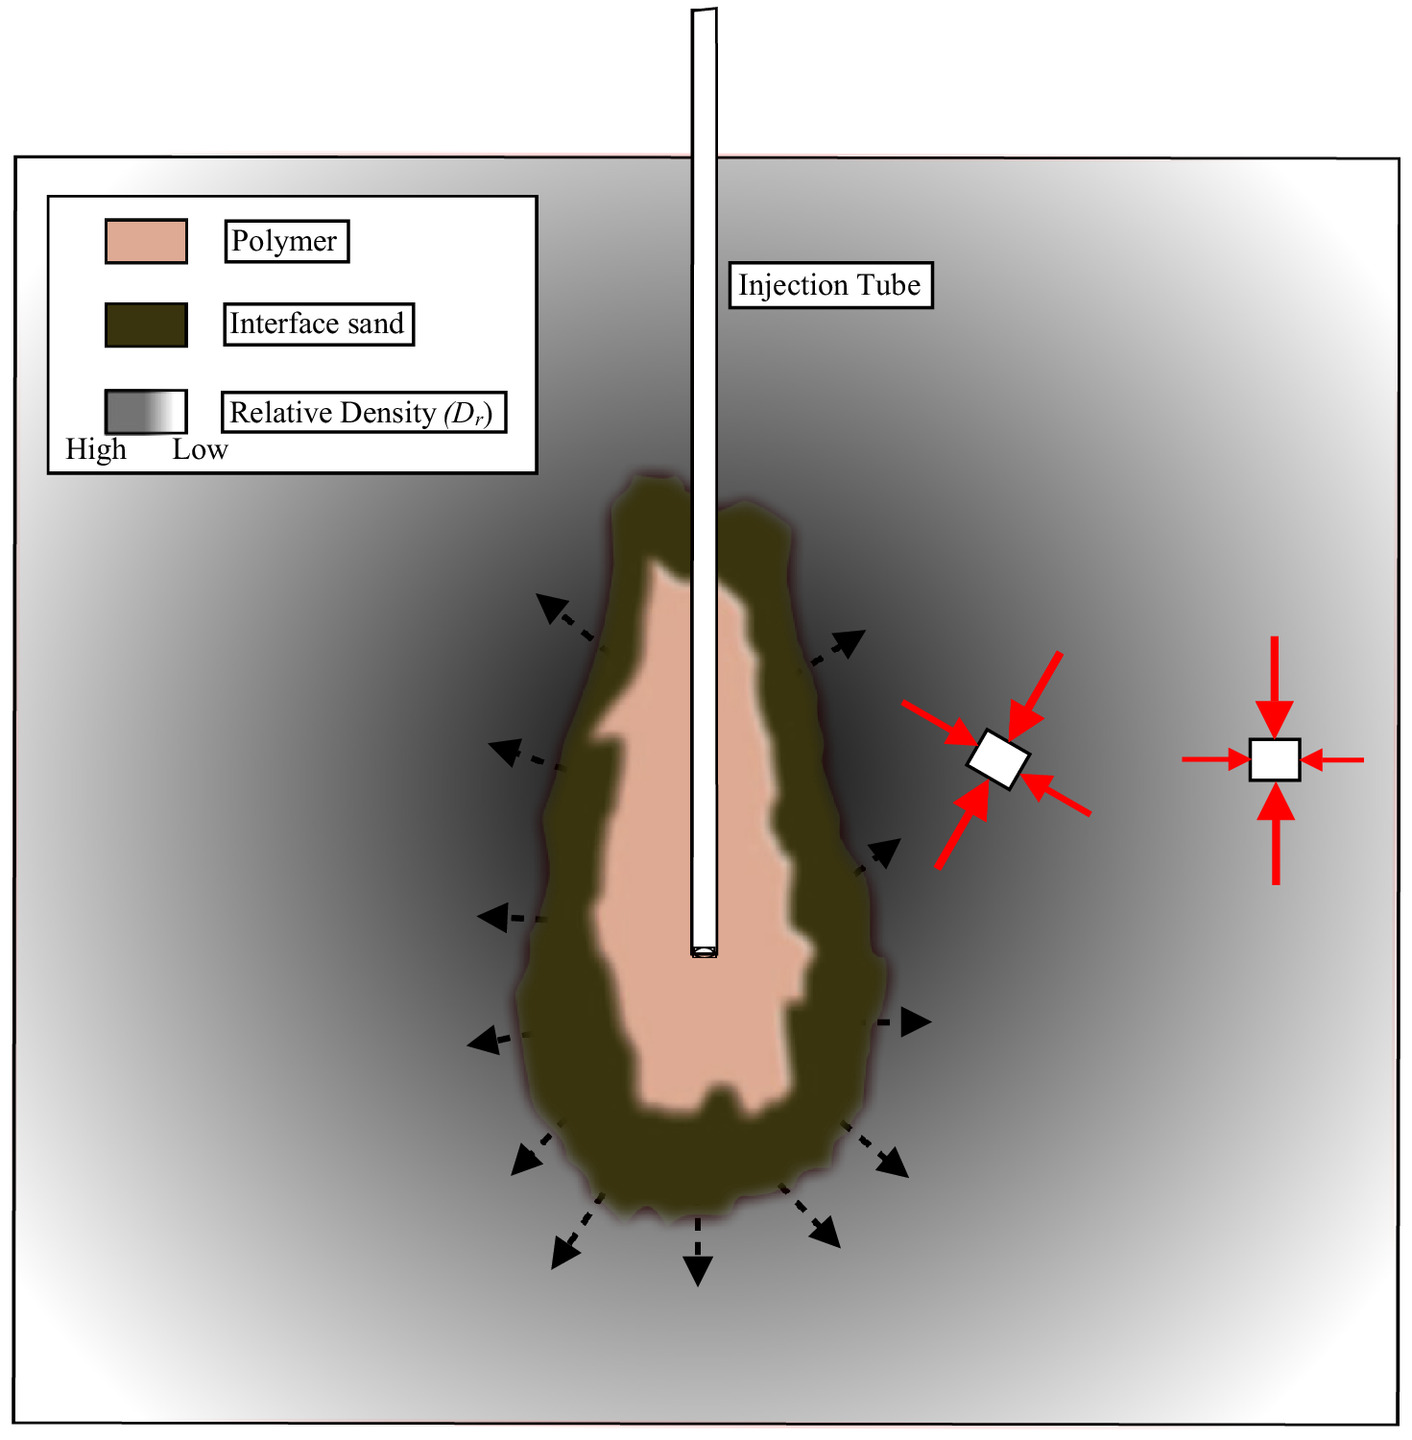
Polymer injection is a commonly used technique for releveling of roadways and foundations (Naudts 2003; Buzzi et al. 2010; Xiao et al. 2015, 2018; Saleh et al. 2019). The EL077 EagleLift polyurethane polymer employed in this study meets the NSF-61 (NSF 2017) standard of being safe to inject near potable water within the ground. It is a two-component chemically blown foam consisting of a curative phase (poly-isocyanate) and a resin phase (polyol). Upon mixing, rapid polymerization occurs forming polyurethane, which expands (due to released as a by-product), and cures into a hardened foam. Equal parts of both phases were mixed at a nominal temperature of 43°C and a controlled pressure of 5.5 MPa to produce the foam. It is noted that the resulting polymer is environmentally inert. Full details concerning kinetics of the polymerization process are reported in Rao et al. (2017). A schematic of the injection process and resulting polymer-sand composite (Fig. 1) depicts the following zones:
1.
Hardened polymer zone: During the process of curing, the injected polymer expands from its initial liquid volume (with the extent dependent on ambient level of confinement). As such, the core is composed of cured hardened polymer (Table 1) sandwiched within a solidified sand outer shell.
2.
Solidified interface sand zone: During injection, the polymer also permeates into the surrounding sand. On curing, cementation occurs along the surface as the sand mixes with the polymer into a solidified outer shell.
3.
Surrounding sand zone: Due to the polymer injection and expansion, the surrounding sand is displaced and thus experiences an increase in lateral confinement and relative density ().
a
Measured from extracted specimen.
b
Unconfined compression test on specimen.
c
Data from EagleLift.
d
Estimated based on linear variation of shear strength in this mass density range (Valentino et al. 2014).
For our experiment, the liquid polymer was formulated to have a relatively low viscosity of 500 cps for the curative phase (i.e., 500 times viscosity of water at 20°C), and 200 cps for the resin phase (at 22°C), to permit permeation into the surrounding sand. Further from the injection point, the polymer gradually becomes of higher viscosity (Hao et al. 2018) as the temperature decreases and the curing progresses (resulting in less permeation and more prominent polymer-rich inclusions).
In summary, the resulting improvement in mechanical properties of the remediated ground might be attributed to the combined effects of: (1) soil replacement and cementation by the created expanding composite inclusions, and (2) soil densification, and increase in confinement around these inclusions. Liquefaction resistance might be further promoted as well by a limited extent of partial saturation (Yegian et al. 2007; Okamura et al. 2011; Mousavi and Ghayoomi 2021), due to the released as a by-product of the polymeric reaction.
Experimental Setup and Model Preparation
Experimental Setup
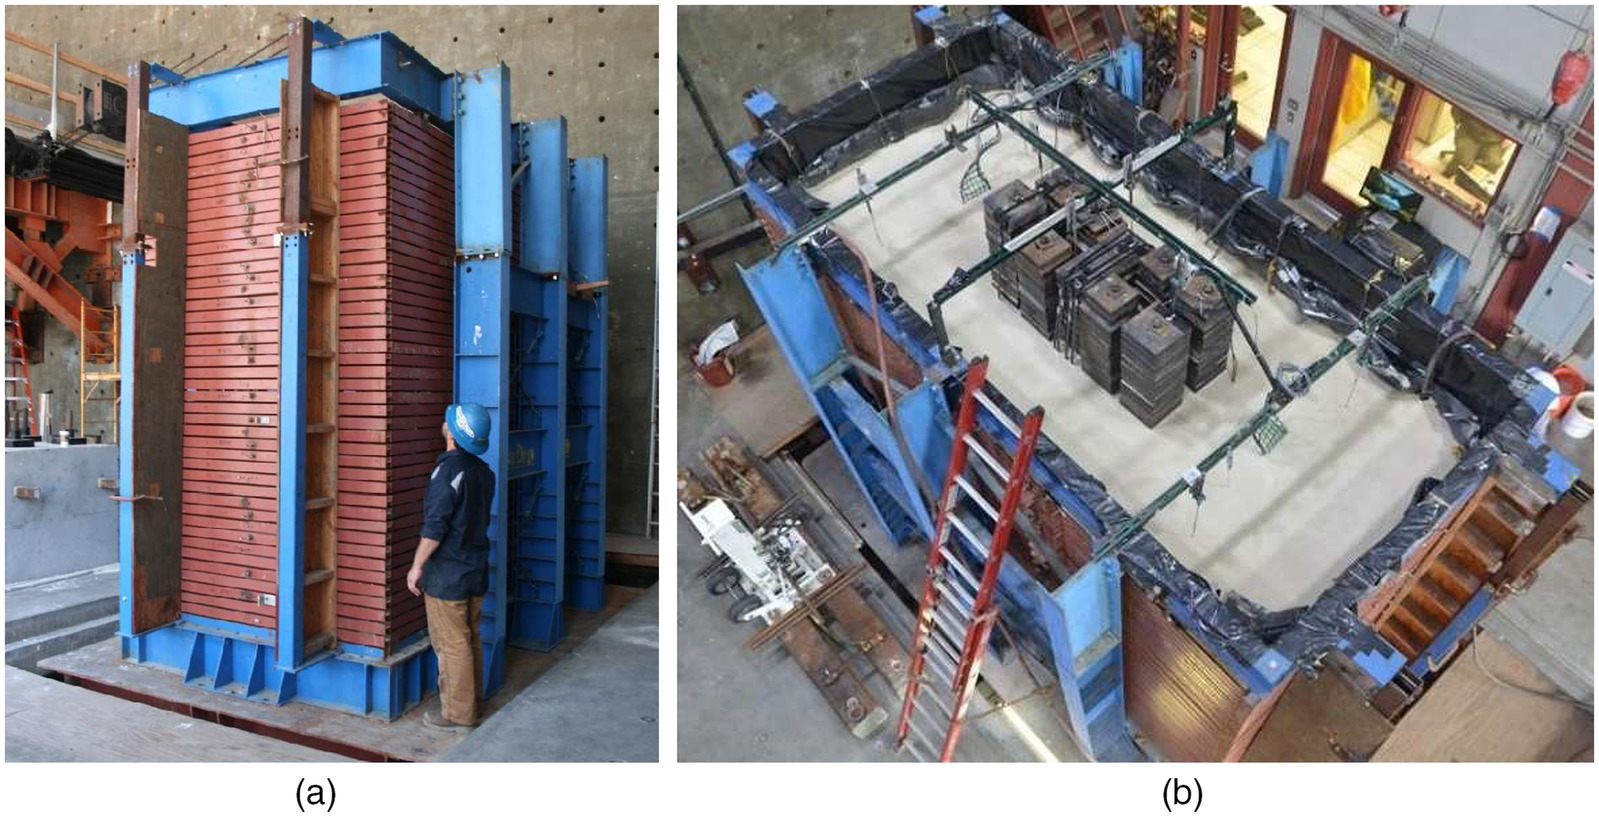
Two shake table experiments were performed using the laminar soil container of the University of California, San Diego Powell laboratory (Ashford and Jakrapiyanun 2001; Ebeido 2019). In this container, stacked steel laminates are separated by roller bearings to minimize lateral boundary effects, thus facilitating the propagation of one-dimensional (1D) horizontally polarized shear waves. The uniaxial shake table platform has dimensions of 4.9 by 3.1 m and is designed for models that weigh up to 350 kN, with an actuator capacity of 490 kN. Maximum table displacement is with a nominal operating frequency of up to 20 Hz (Magenes 1989; Trautner et al. 2018).
The soil deposit for each experiment was prepared in the laminar container (Fig. 2) with internal lateral dimensions of 3.9 m by 1.85 m and 2.9 m height. A 2 mm thick Ethylene Propylene Diene Monomer (EPDM) rubber liner was placed to hold the soil and water inside the laminar container. Two flexible perforated pipes were placed at the laminar container base, and water was used to saturate the model. Further details about the shake table and laminar container are reported in Motamed et al. (2020) and Zayed et al. (2021b).
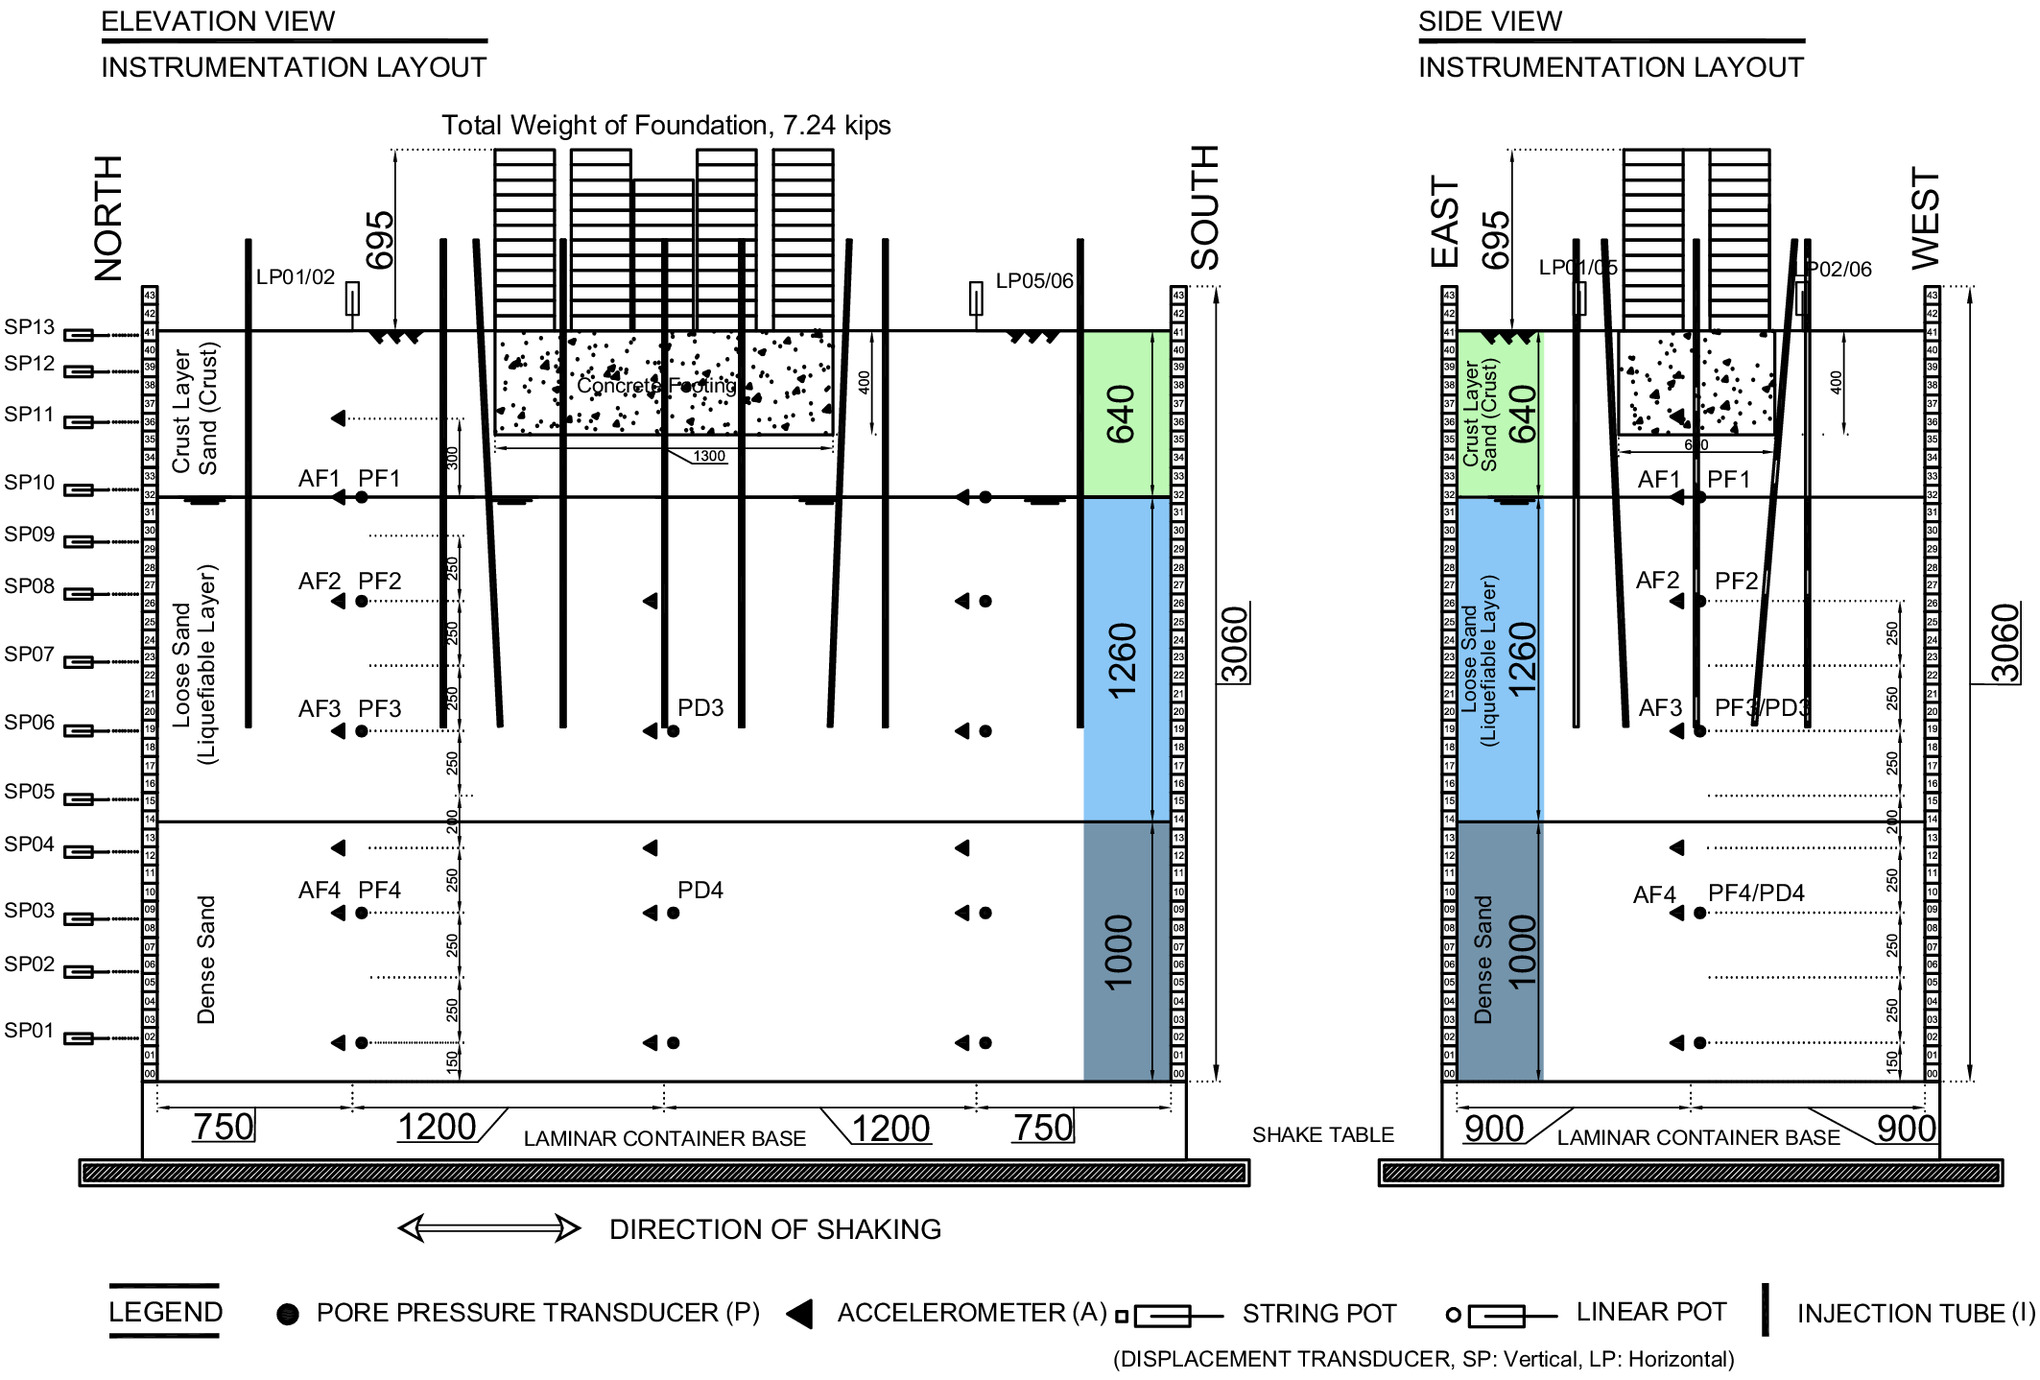
The ground 0.6 m away from the foundation edge (Fig. 2) will be referred to as “free-field” throughout this paper (Jahed Orang et al. 2021). Each model was instrumented with displacement transducers (string pots), pore pressure sensors, and accelerometers, including the north “free-field” (Sensors AF 1-4, PF 1-4) and “under foundation” (Sensors: PD 3-4) arrays (Figs. 3 and 4). In addition, the foundation and soil surface were instrumented with vertical displacement transducers. During both experiments, data were recorded at a rate of 256 Hz, and all recorded accelerations were processed using a zero-phase low-fourth-order Butterworth filter with a cutoff of 15 Hz.
Model Preparation
The preinjection soil model (Figs. 2 and 3) in both tests was constructed in three phases using Ottawa F-65 sand (Table 2), consisting of a saturated 1.00 m dense base layer underlying a 1.25 m thick, saturated loose liquefiable deposit, with an upper moist 0.64 m crust. Judging by weight/volume of the deposited soil, relative density () of the dense base layer was estimated at 80%–95%, the loose middle layer at 33%–44%, and the top crust at 50%–55% (Table 3).
| Property | Value |
|---|---|
| Specific gravity | 2.65 |
| Coefficient of uniformity () | 1.61 |
| Coefficient of curvature () | 0.96 |
| Maximum and minimum voids ratio | 0.853, 0.503 |
| Maximum and minimum dry mass density, , () | 1,759, 1,446 |
Source: Data from Parra Bastidas (2016).
| Property | Upper crust layer | Liquefiable layer | Dense base layer |
|---|---|---|---|
| Water/soil condition | Moist | Saturated | Saturated |
| Depth (m) | 0.00–0.64 | 0.64–1.90 | 1.90–2.90 |
| Thickness (m) | 0.64 | 1.26 | 1.00 |
| Void ratio | 0.68–0.66 | 0.73–0.70 | 0.57–0.52 |
| Relative density, (%) | 50–55 | 35–44 | 80–95 |
Source: Data from Jahed Orang et al. (2021).
The foundation (Fig. 2) consisted of a rigid concrete block of length 1.3 m, width 0.6 m, and height 0.4 m, overlain by steel plates designed to produce a uniform vertical surcharge pressure of 41.6 kPa (simulating bearing pressure of a 2-story building on a mat foundation). As shown in Fig. 3, the concrete block (height of 0.4 m) was fully embedded into the crust. Full details about construction of the deposit and foundation can be found in Jahed Orang et al. (2021).
Polymer Injection
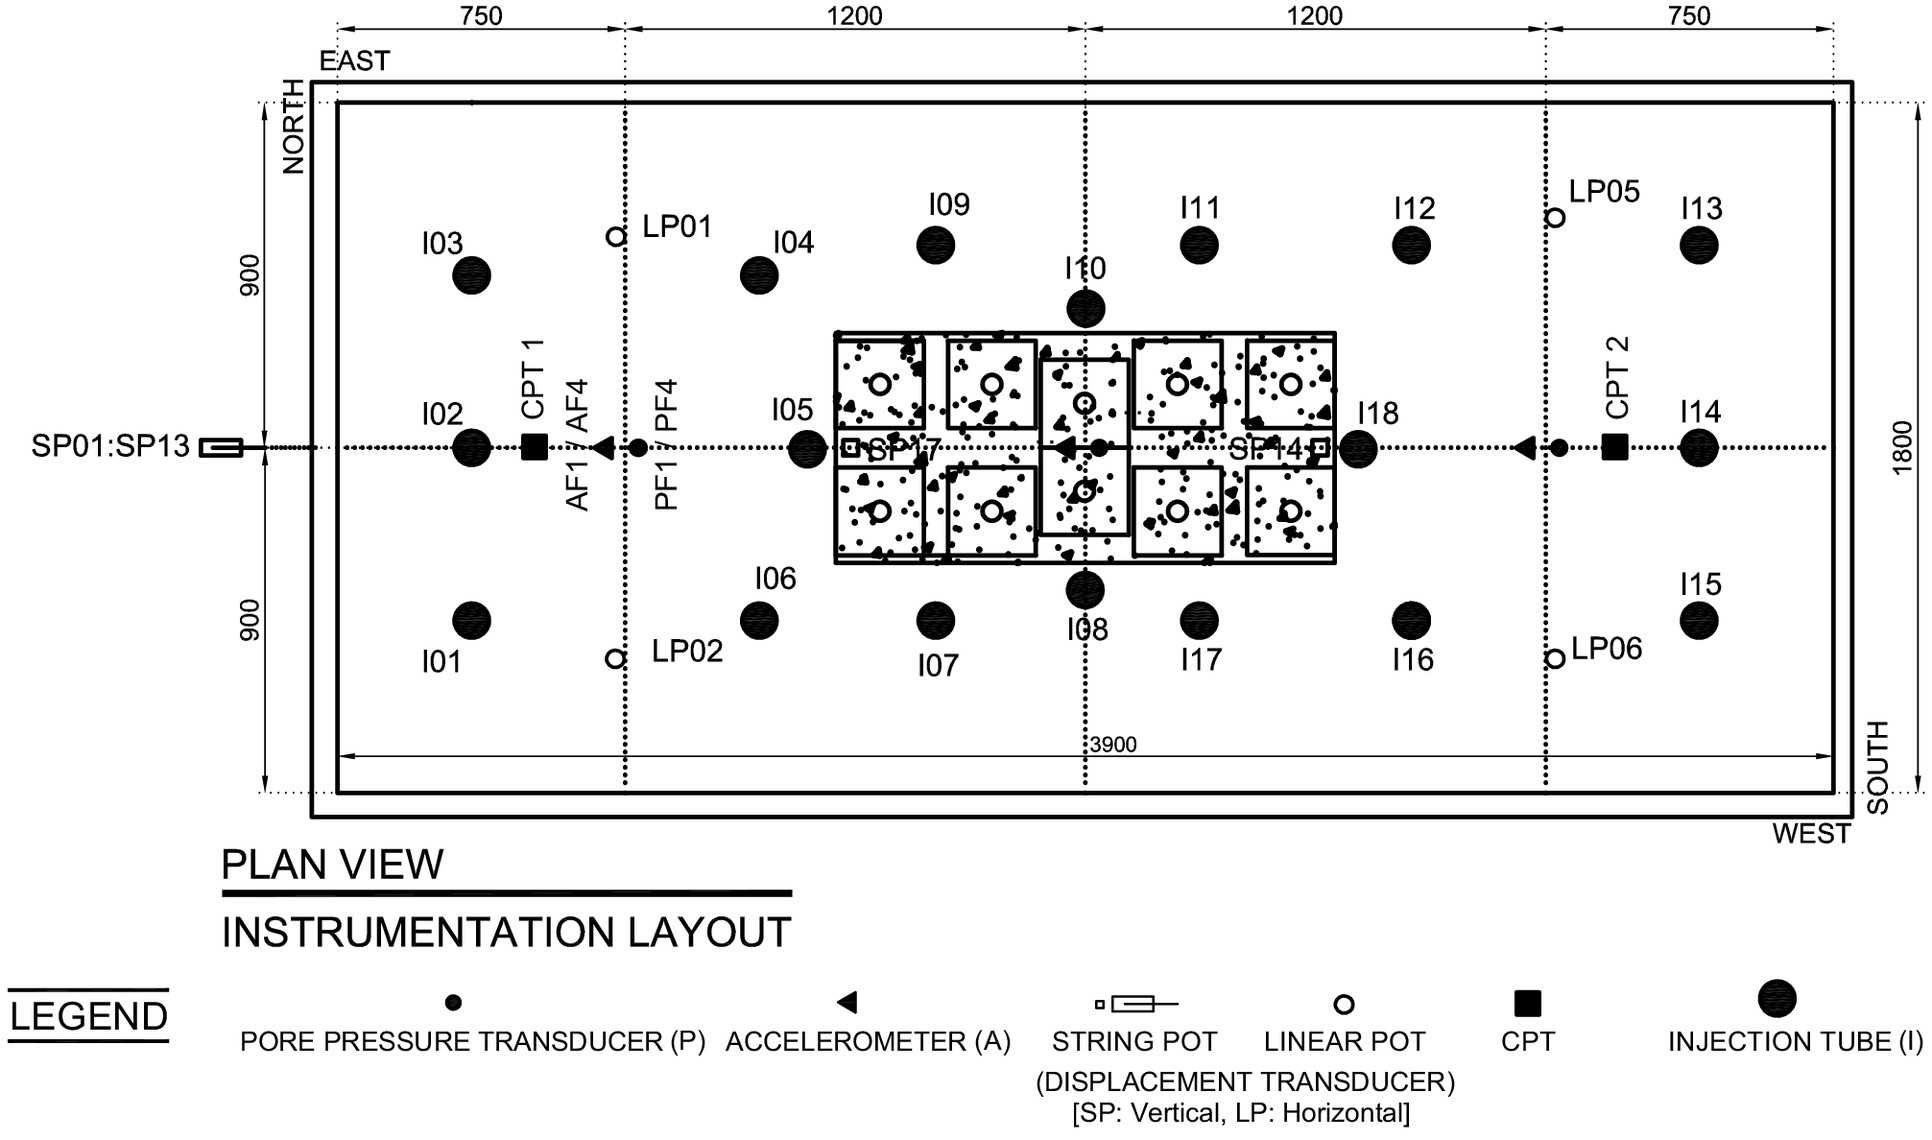
In the polymer test (Fig. 3), 17 injection thin-walled steel tubes (1.5 mm wall thickness) of diameter 16 mm were inserted into the soil with relative ease using a small impact wrench (in about 1 h). As shown in Fig. 3, four of these tubes were slightly inclined toward the foundation center. All tubes were inserted to a depth of 1.5 m into the model (0.9 m into the loose liquefiable layer). This depth was selected to result in a bottom-up injection close to the liquefiable layer base, allowing the polymer to spread throughout the loose layer as it permeates laterally and flows toward the soil surface. A handheld gun mixes the resin and curative phases and injects the resulting polymer into the tubes. Once injected, the polymer attains 90% of its compressive strength in under 15 min (100% strength is typically attained in about 6 h).
From an earlier preliminary testing phase (Prabhakaran et al. 2021), a ratio of about 8.0% (volume of injected liquid polymer to volume of treated soil) appeared to result in substantial improvement of the loose layer’s mechanical properties. With that in mind, the plan view configuration of injection tubes () is presented in Fig. 4. To start (), an average of 18 kg (15 liters in liquid form) was injected at each location, followed by () at about 22.5 kg (19 liters in liquid form), and () at about 24.5 kg (20.5 liters in liquid form). In this regard, the earlier injections strengthen the stratum and help reduce the extent of migration of the injected liquid polymer toward the ground surface. As such, an average of 21.5 kg (18 liters in liquid form) was injected at each point, with a total of 327 kg of polymer (273 liters in liquid form) that remained within the soil (i.e., an average ratio of about 7.9% of liquid polymer volume to volume of loose sand stratum). Post injection, an average heave of about 48 mm and 10 mm was observed at the soil surface and foundation, respectively. In view of the additional volume of injected material, the ground water table increased by 0.3 m and was releveled back to 0.6 m for compatibility with the baseline experiment (about 0.6 m).
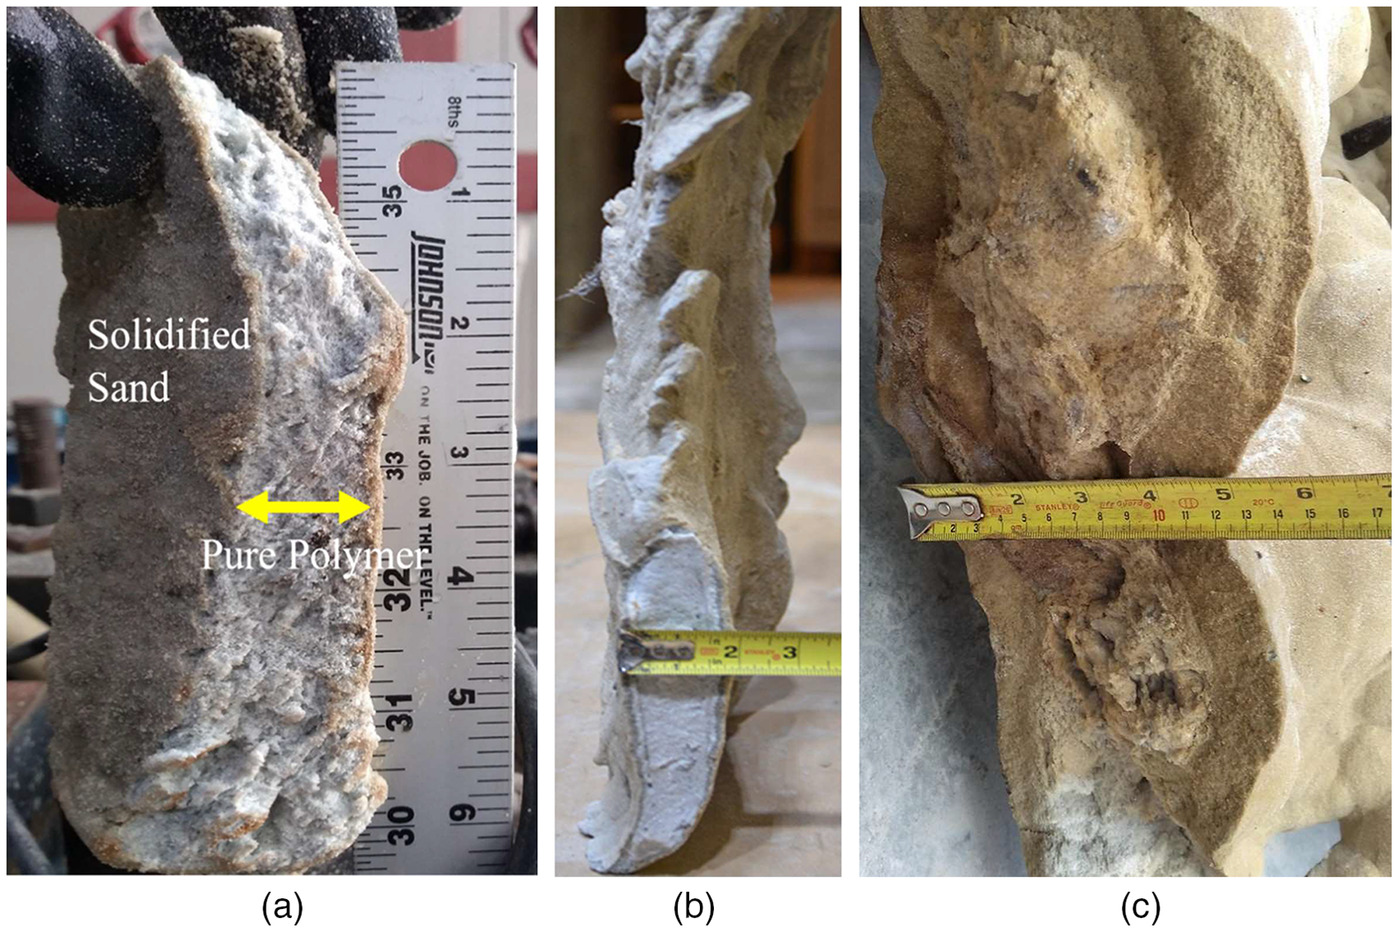
Configuration of the Resulting Polymer-Sand Composite
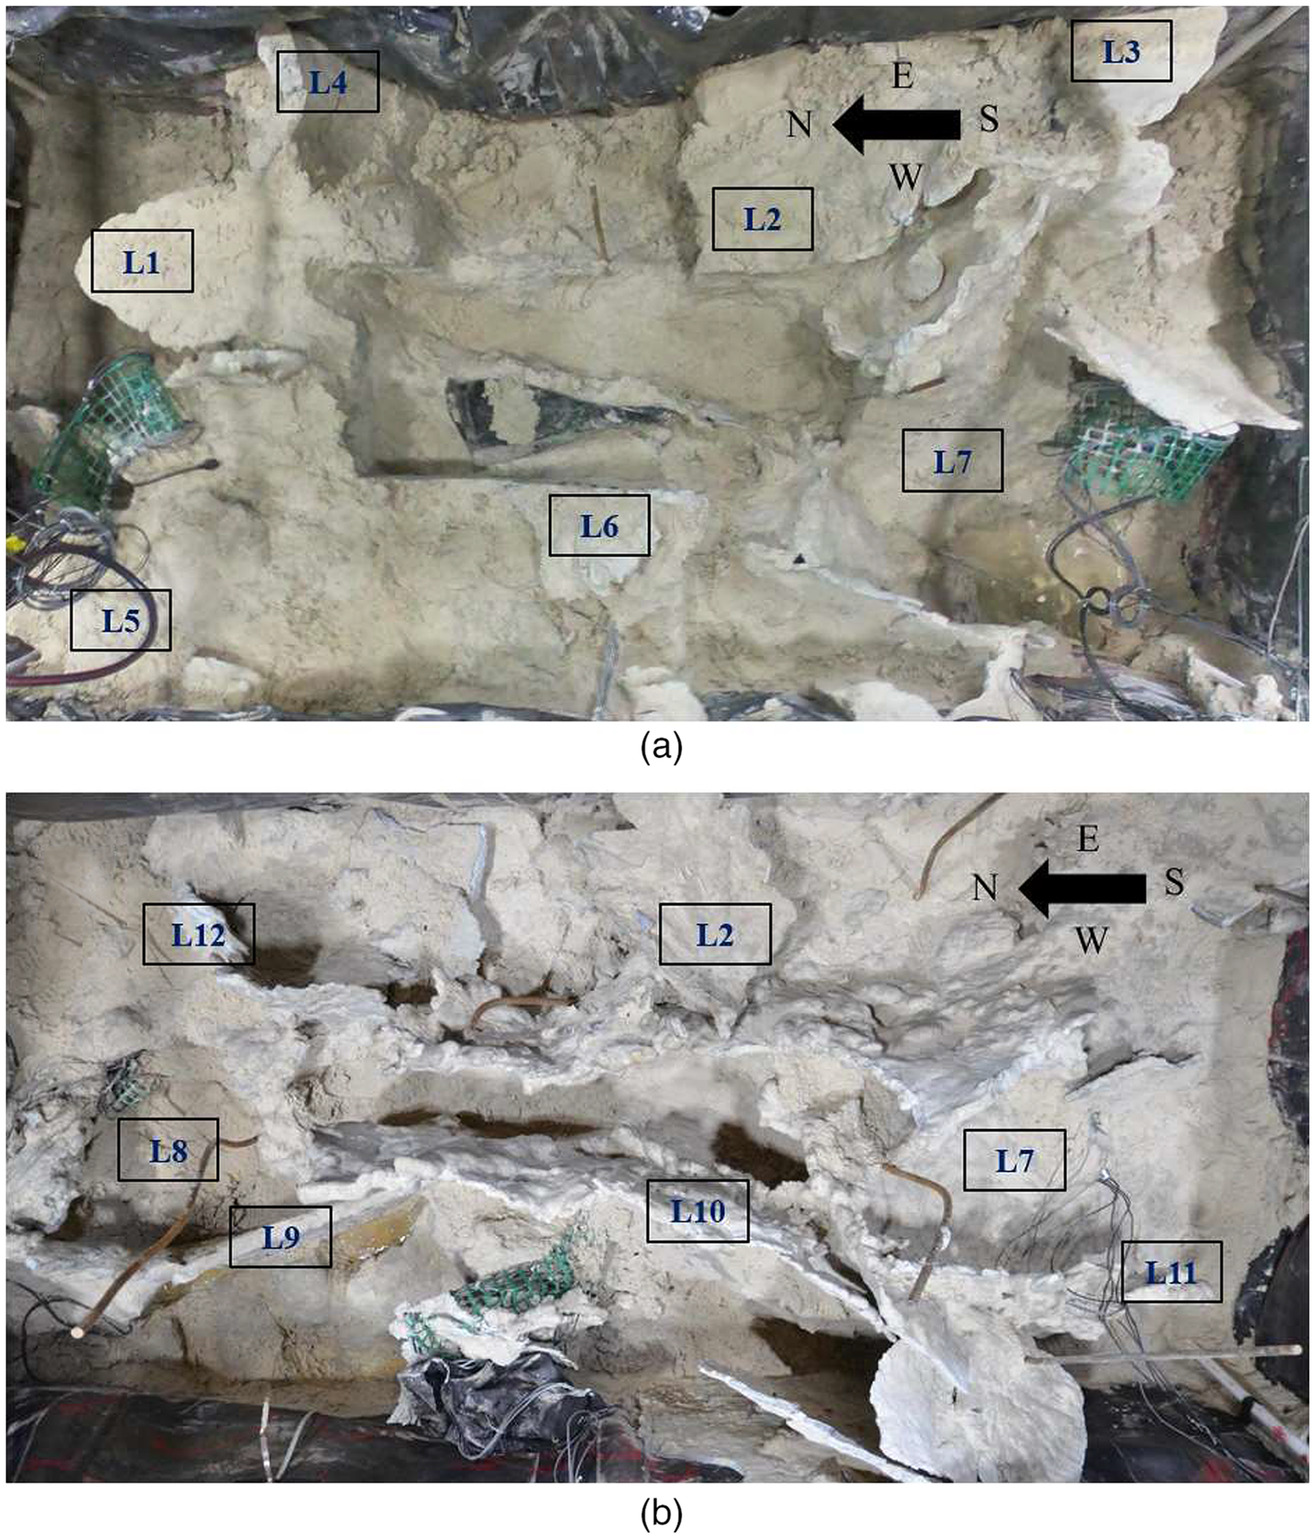
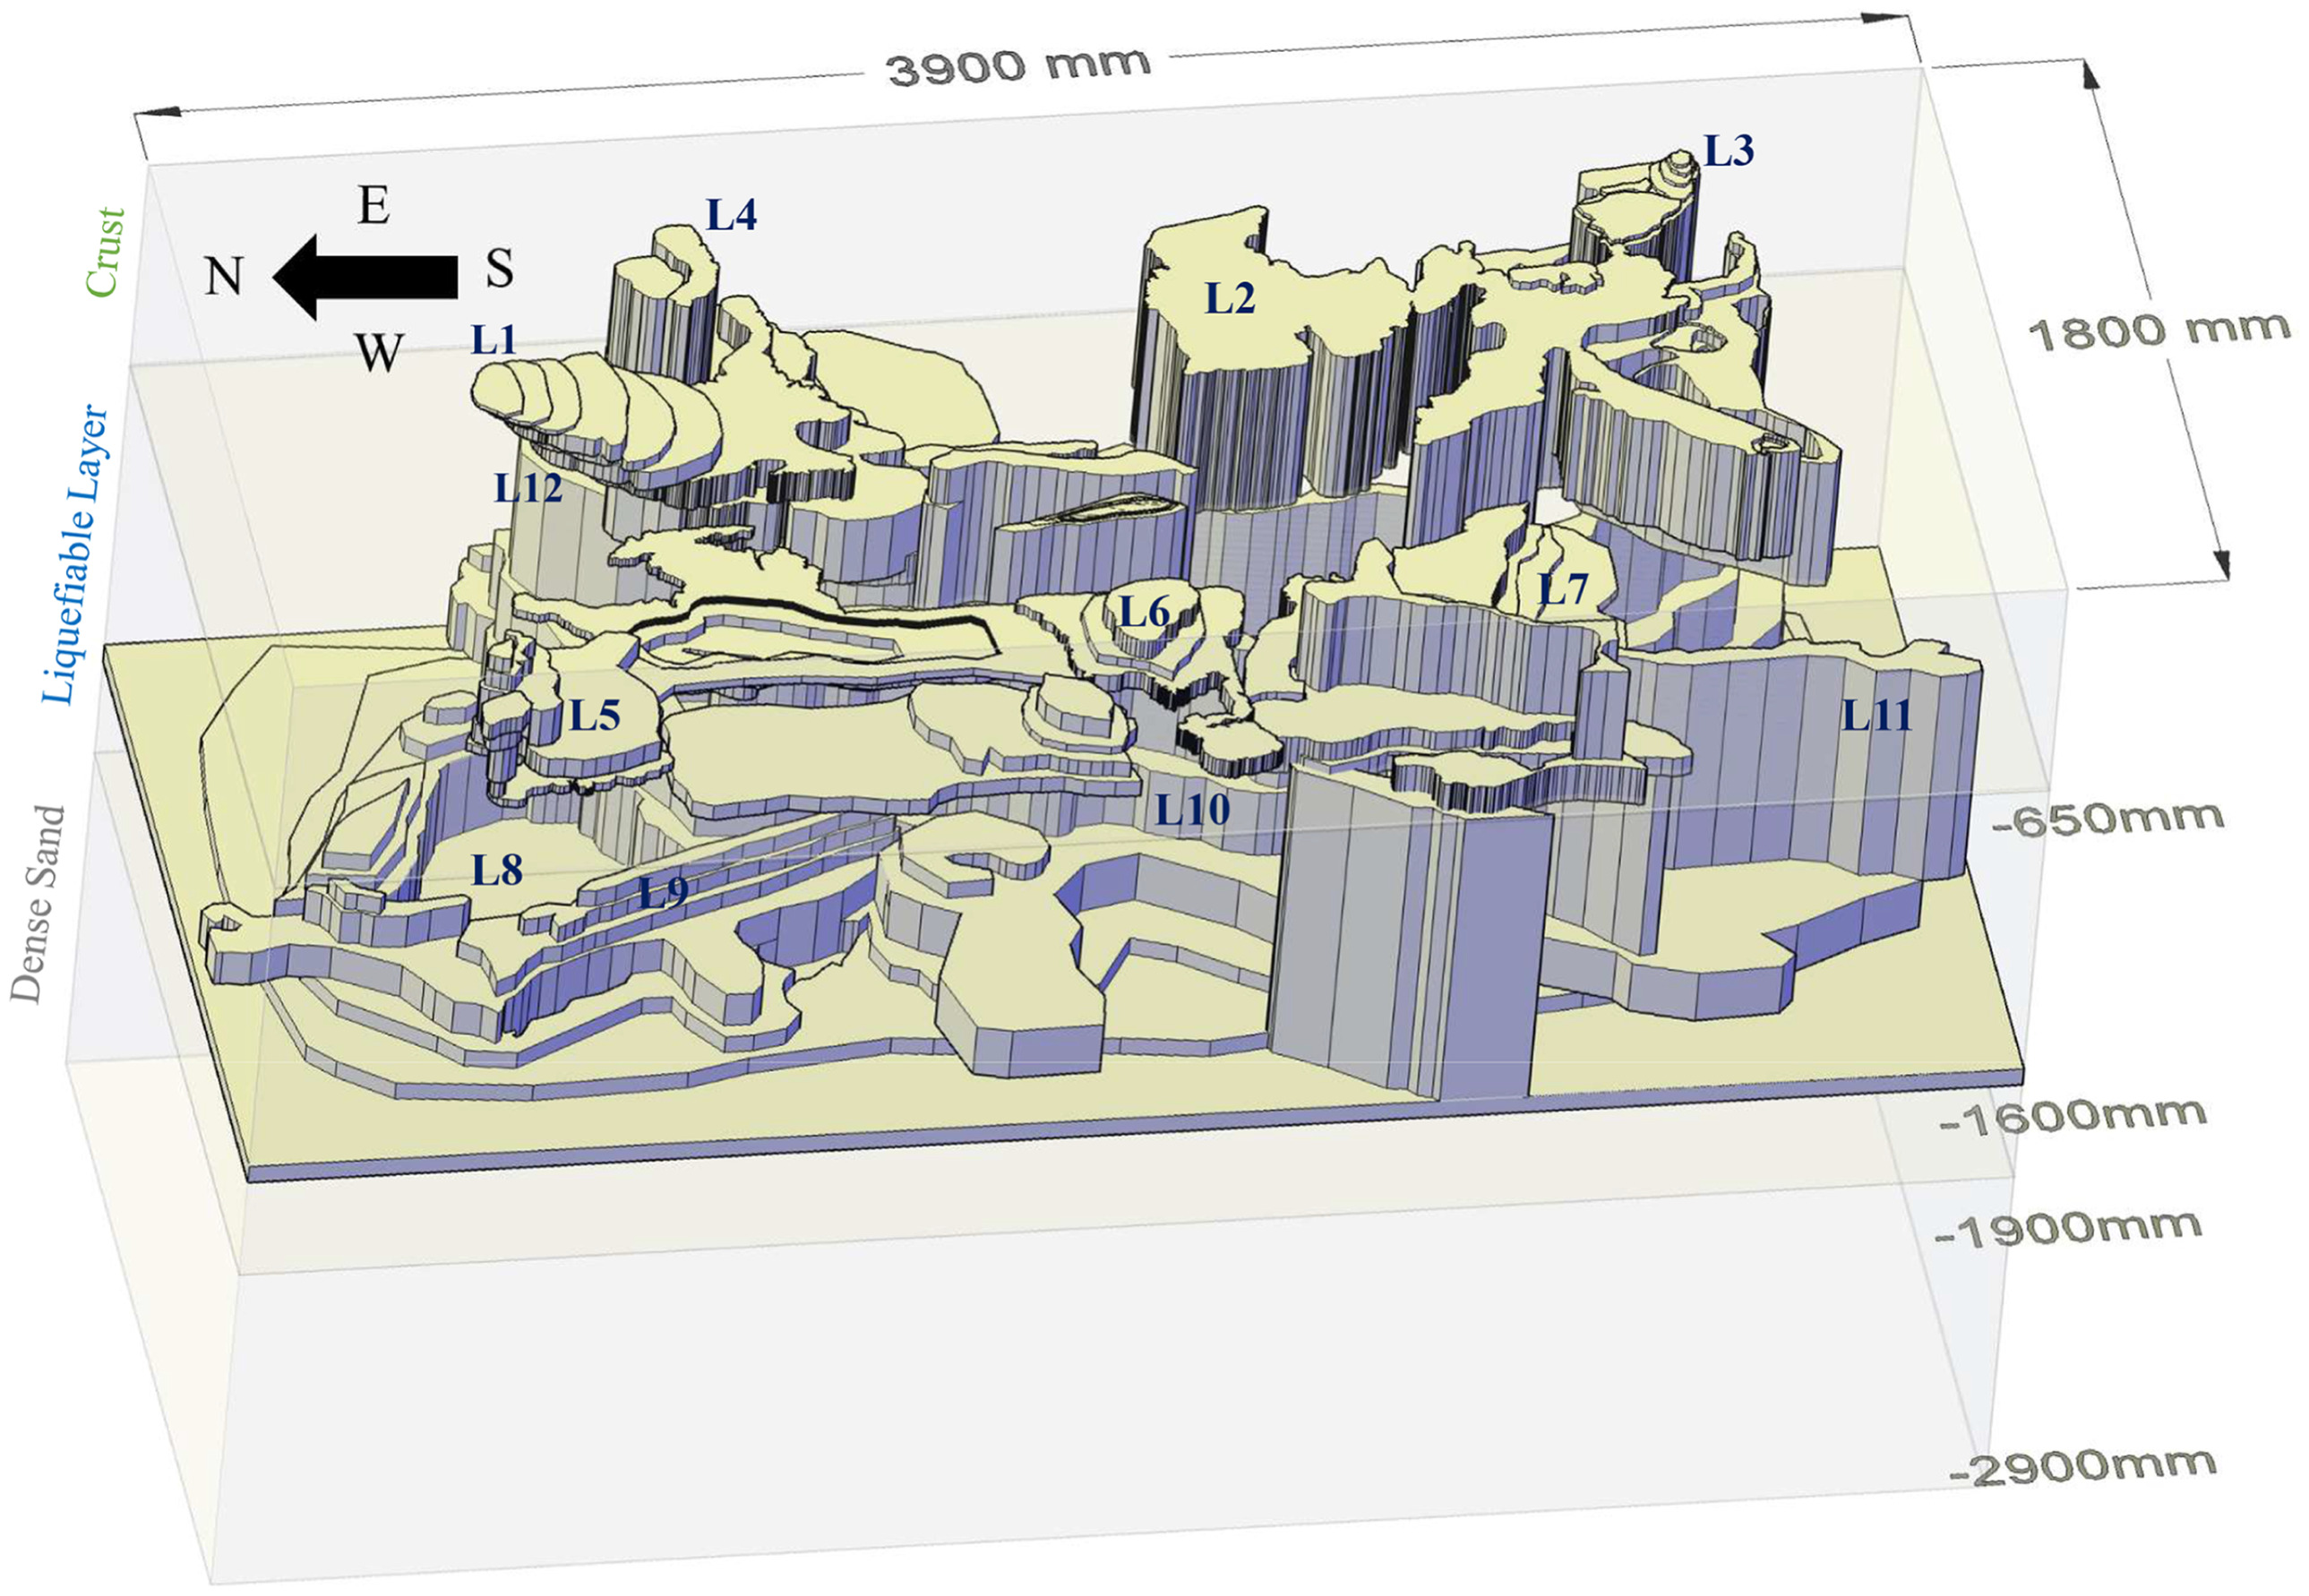
Post shaking, the foundation was removed, and the model was carefully excavated to observe the distribution of the hardened polymer-sand composite within the treated ground (Figs. 5 and 6). Based on averaging the visual observations over 100 mm thick slices along the depth, a three-dimensional rendering was constructed to map the composite (hardened polymer and solidified sand) configuration (Fig. 7). From this figure:
1.
The total composite volume was roughly estimated to be about 3.5 times that of the injected liquid polymer (due to the polymer expansion and permeation).
2.
The maximum depth of polymer permeation was in the range of .
3.
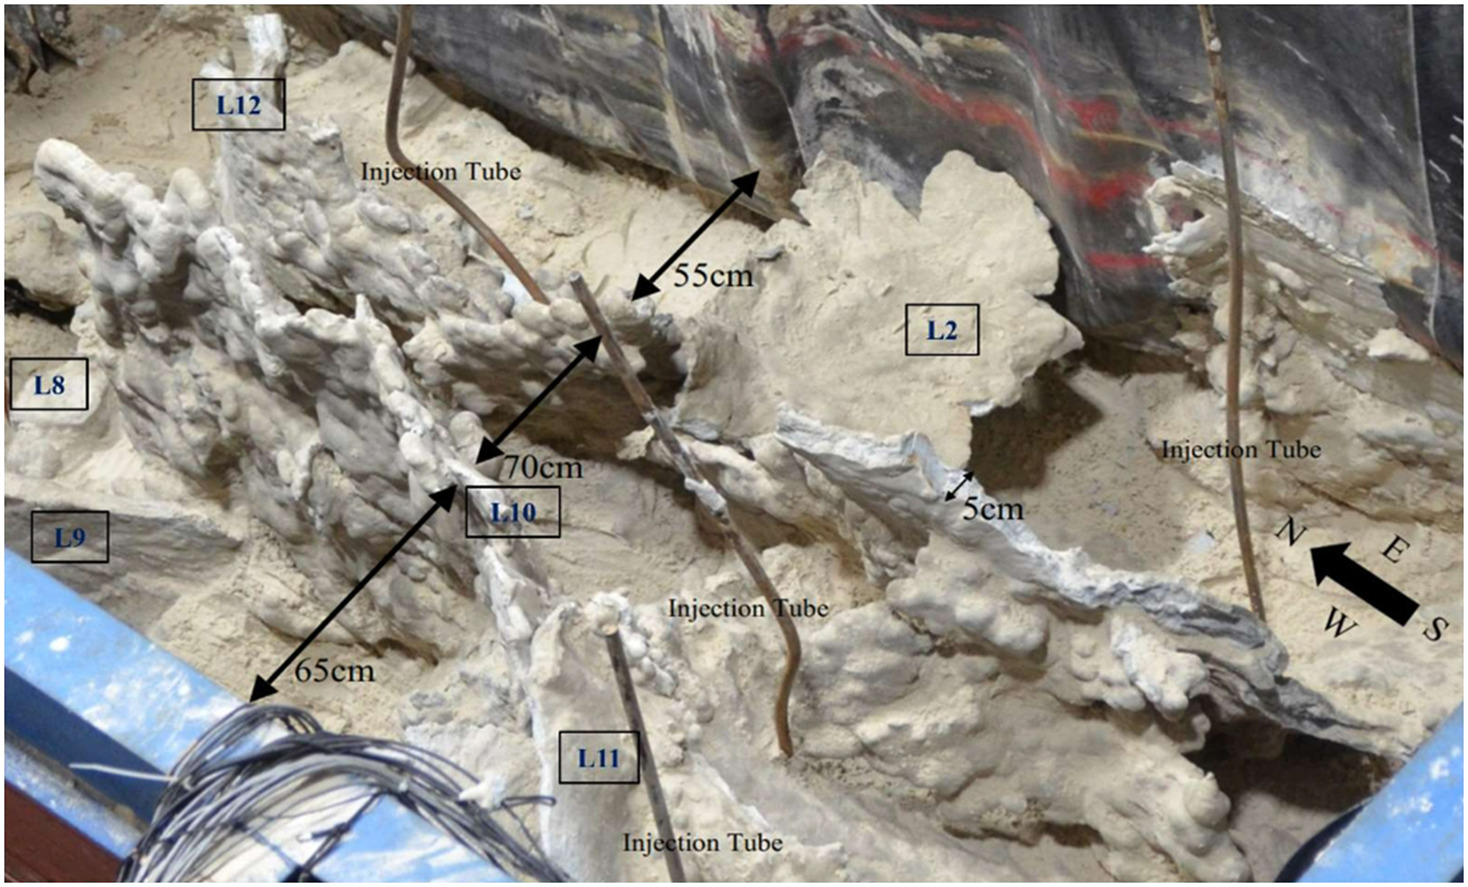
In the loose layer, near the injection depth (1.5 m), a relatively dense zone () of the composite was observed, around 100 mm in thickness. From this zone, veins of the composite were found to emanate into the upper strata (Fig. 6), generally oriented along the more compliant longer direction of the laminar container. As mentioned previously, such vein-like formations were also observed after polymer injection in the Avondale and Bexley red zone sites in New Zealand (Traylen et al. 2017).
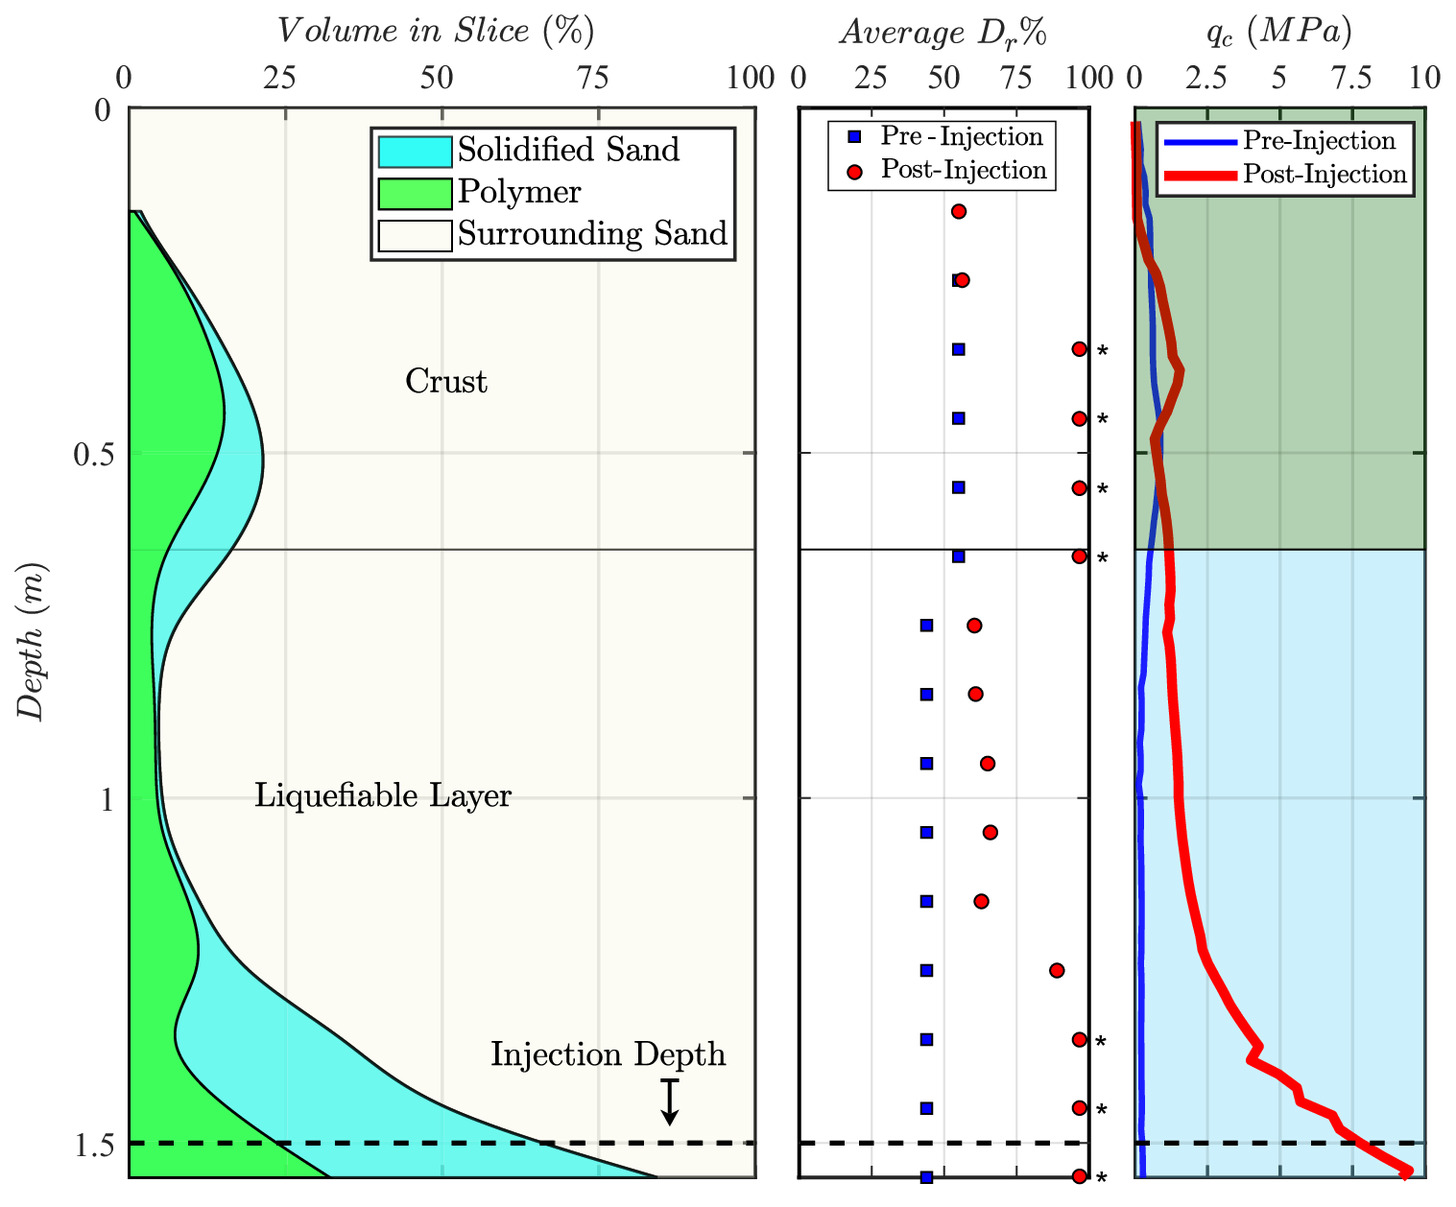
In terms of variation with depth, Fig. 8 displays a profile of relative volumes of sand and composite (Appendix). At locations close to the injection depth (), large volumes of the composite were observed (around 70% of the volume), 55%–65% of which comprised of solidified sand. At depths between 0.6 m and 1.3 m, a much smaller extent of the composite was seen (around 6% of the volume) with a solidified sand fraction of about 5%–10%. Toward the crust (), a larger volume of the composite was observed (around 20% of the volume) with a solidified sand fraction estimated at 10%–15%.
Remediation Outcome
1.
Relative density () increase due to the injection process: Along with the composite volume profile of Fig. 8, the change in relative density of the remaining sand is also displayed. The resulting is affected by the extent of polymer replacement and resulting densification of the surrounding sand (Appendix provides more details). In particular, it may be observed that: (1) at the depth, of the sand increased to 90%, (2) at the depth, increased to about 60%, and (3) at depth, increased to about 90% or more.
2.
CPT tip resistance changes: Preinjection CPTs were performed at two locations in the north and south parts of the laminar soil container (Fig. 4). Upon curing of the injected polymer (72 h postinjection), two additional CPTs were performed to infer the corresponding change in properties. Average tip resistance at these two locations, pre- and postinjection, are presented in Fig. 8. In the liquefiable layer (Fig. 8), tip resistance was before injection, and is seen to reach after injection, reflecting the overall strengthened state of the treated soil. For reference, this change in CPT readings suggests an increase of about fourfold in liquefaction triggering resistance (), from a of 0.07 to a of 0.27 (Robertson and Wride 1998).
Shake Table Testing and Observed Response
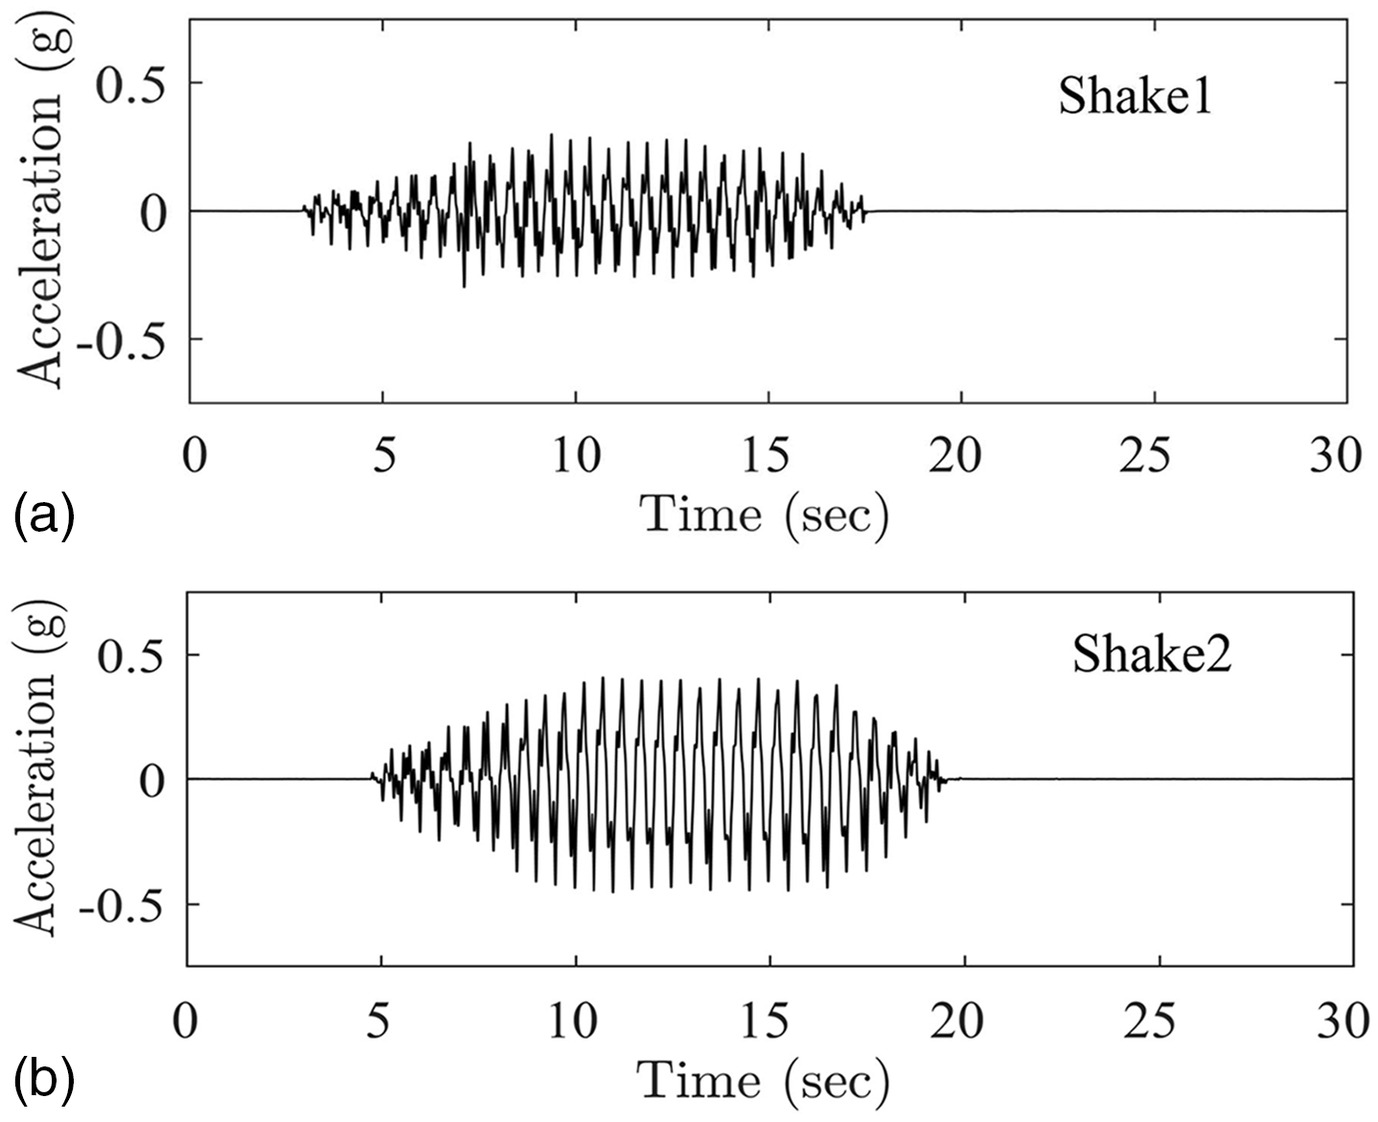
The baseline and polymer remediated models were subjected each to two consecutive cyclic shaking events (Fig. 9) of about 0.2 g and 0.4 g peak acceleration with a predominant frequency of 2 Hz (referred to herein as Shake1 and Shake2). The first shaking event was imparted 1.5 weeks after injection. After Shake1, with sufficient time allowed to assure complete excess pore pressure dissipation, the baseline and polymer models were then subjected to the stronger Shake2 excitation.
Foundation and Soil Settlement
Figs. 10–12 show the resulting foundation and ground surface response in both experiments. After the second shaking event, cumulative foundation settlement of about 660 mm was observed in the baseline model (Jahed Orang et al. 2021), compared to 27 mm of settlement in the polymer remediated model. The evolution of settlement and foundation rotation during Shake1 and Shake2 are shown in Fig. 12.
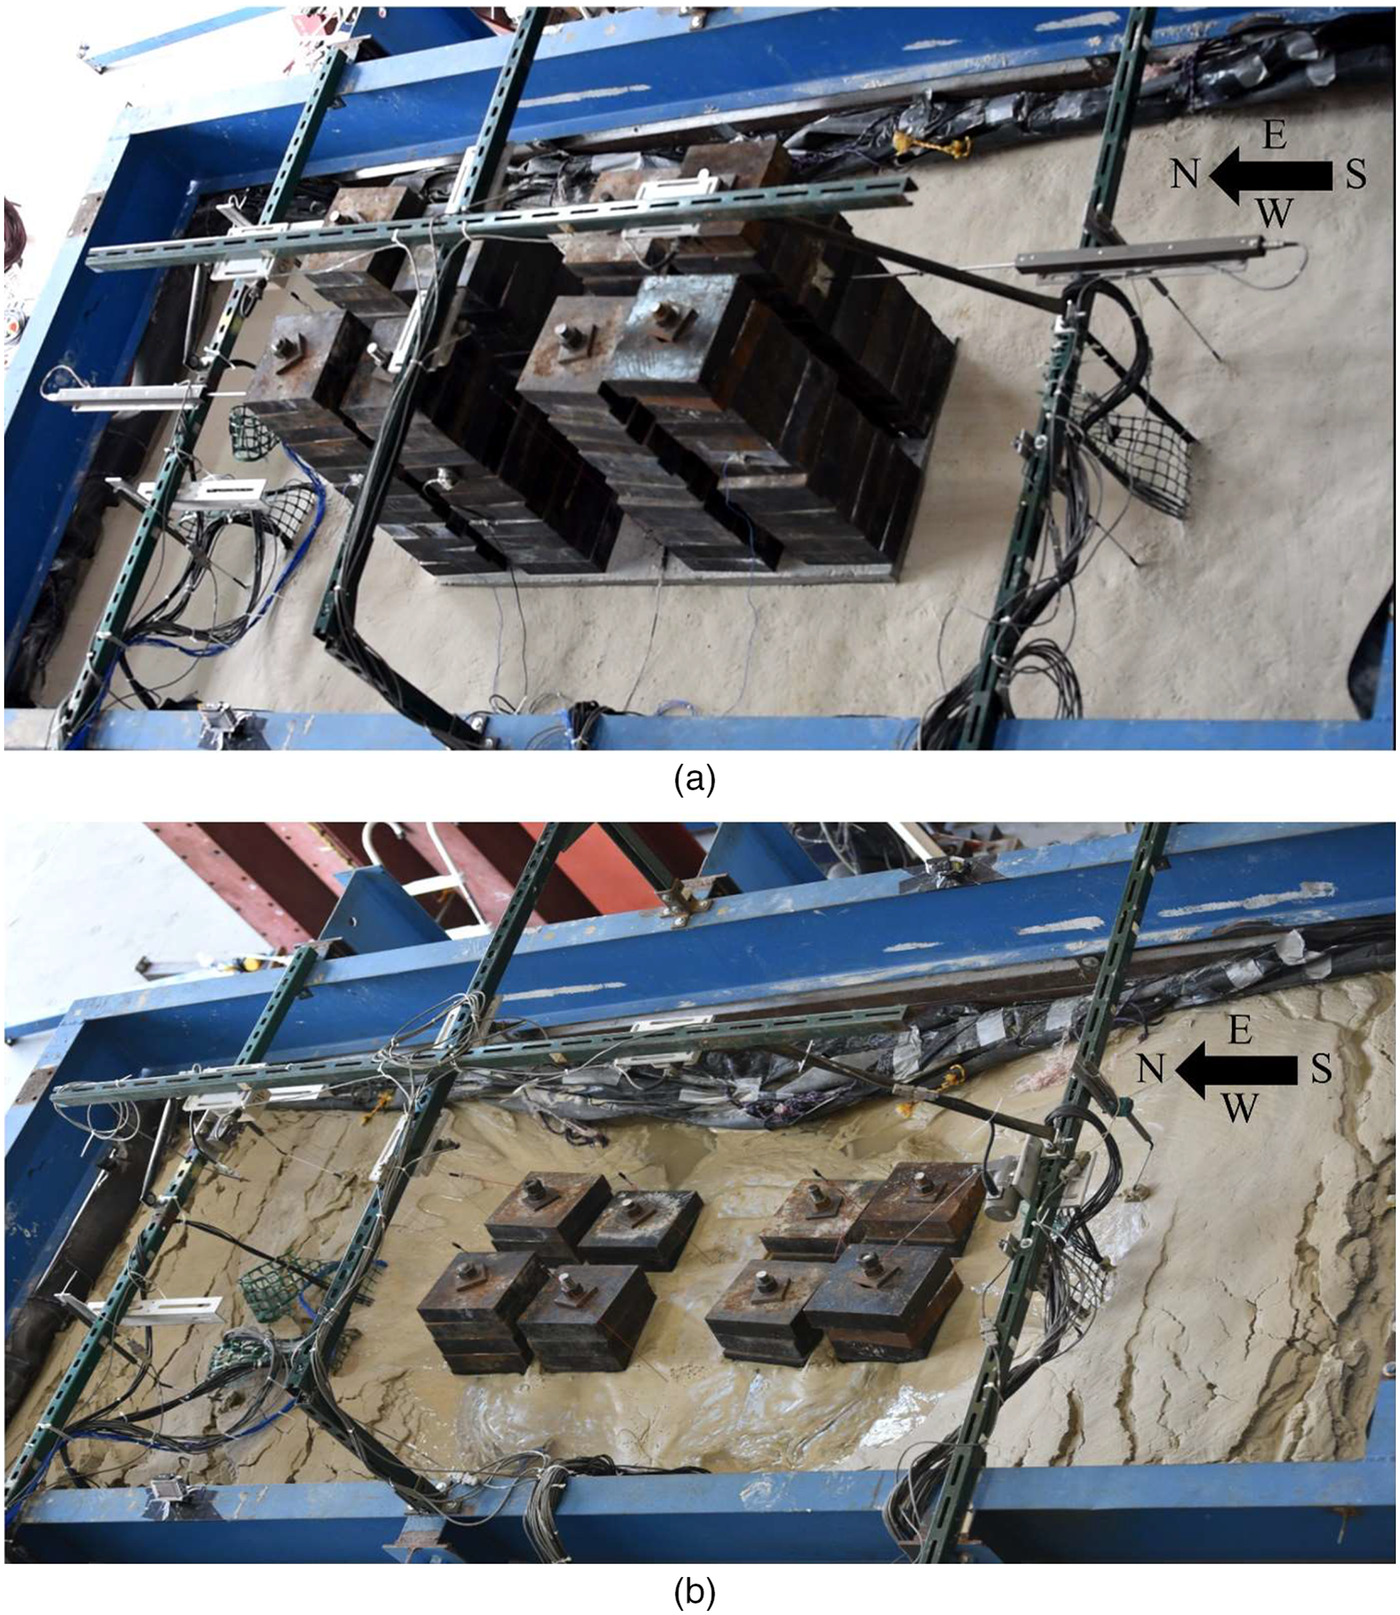
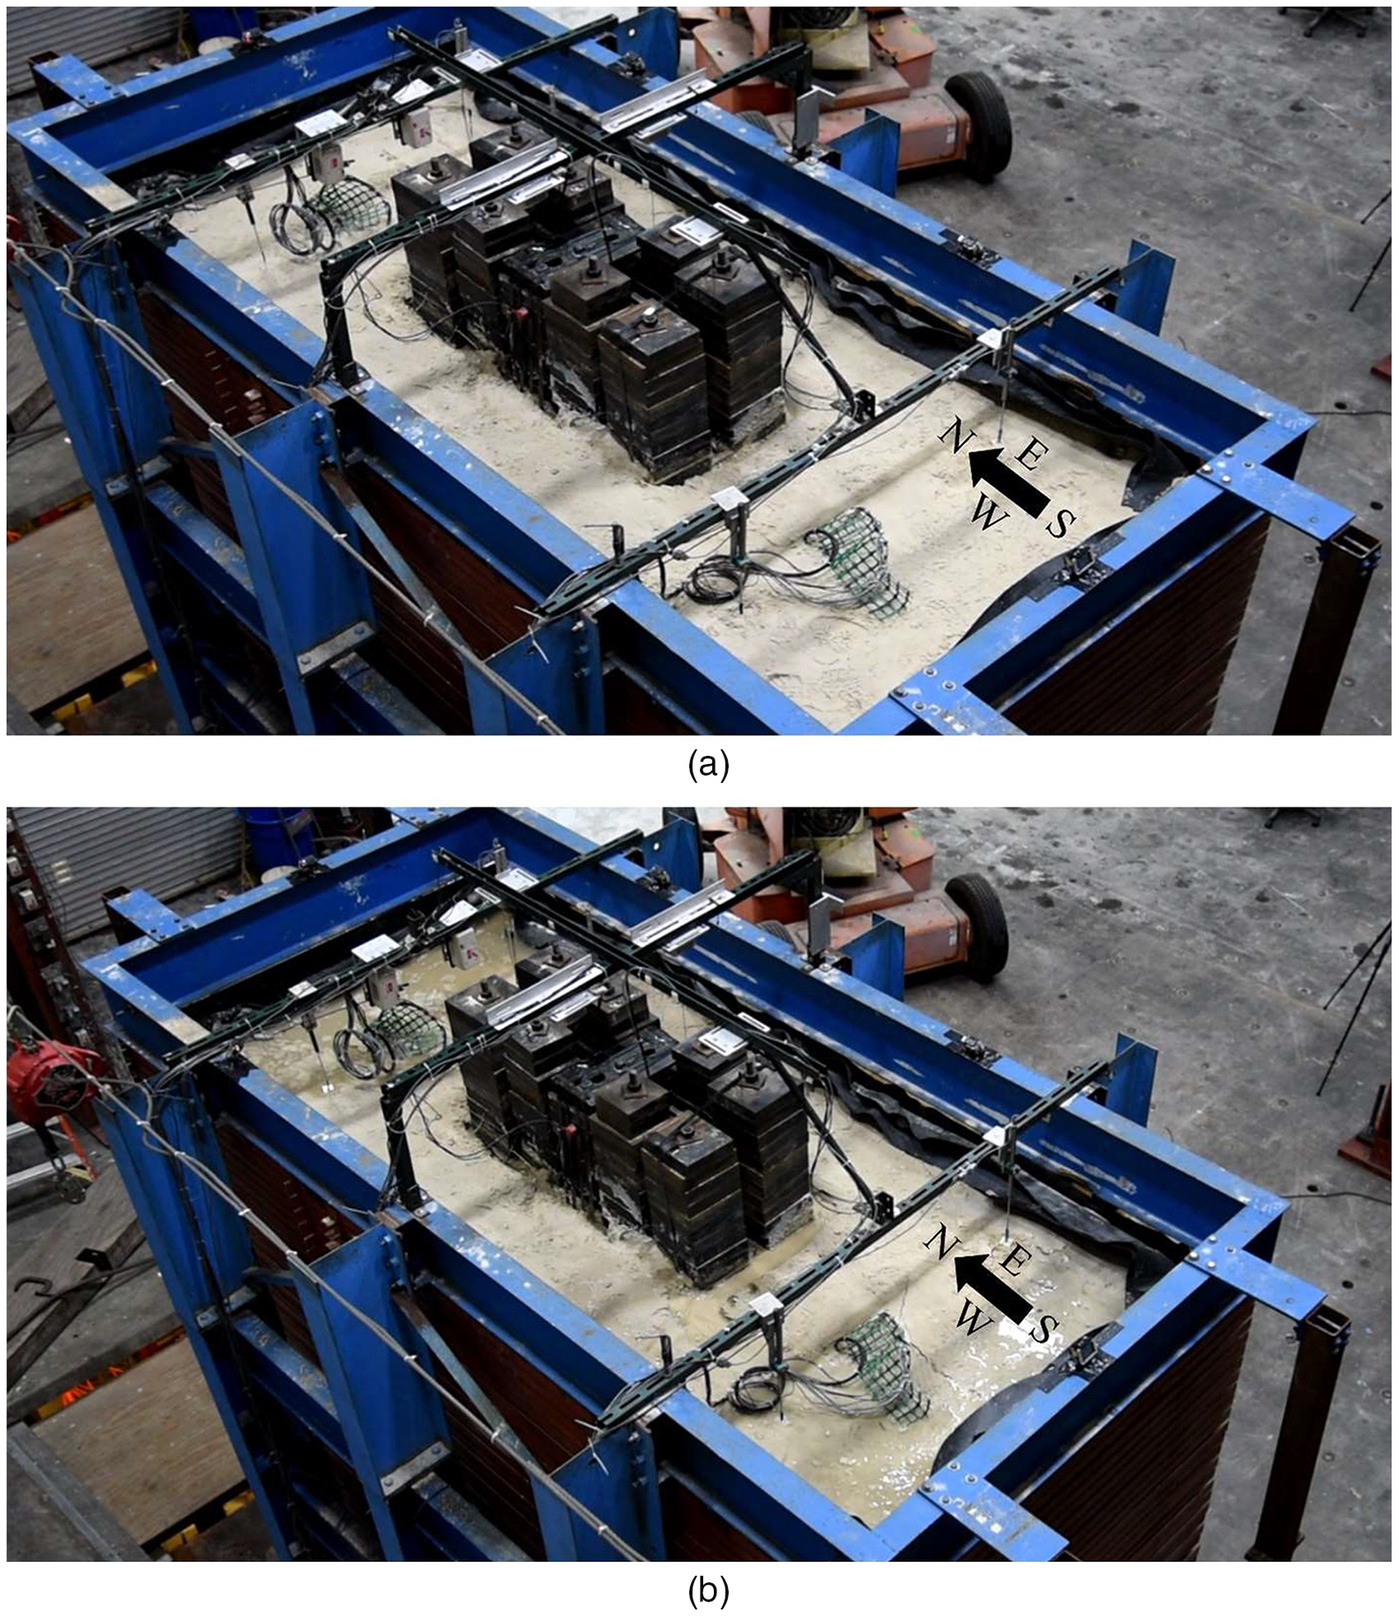
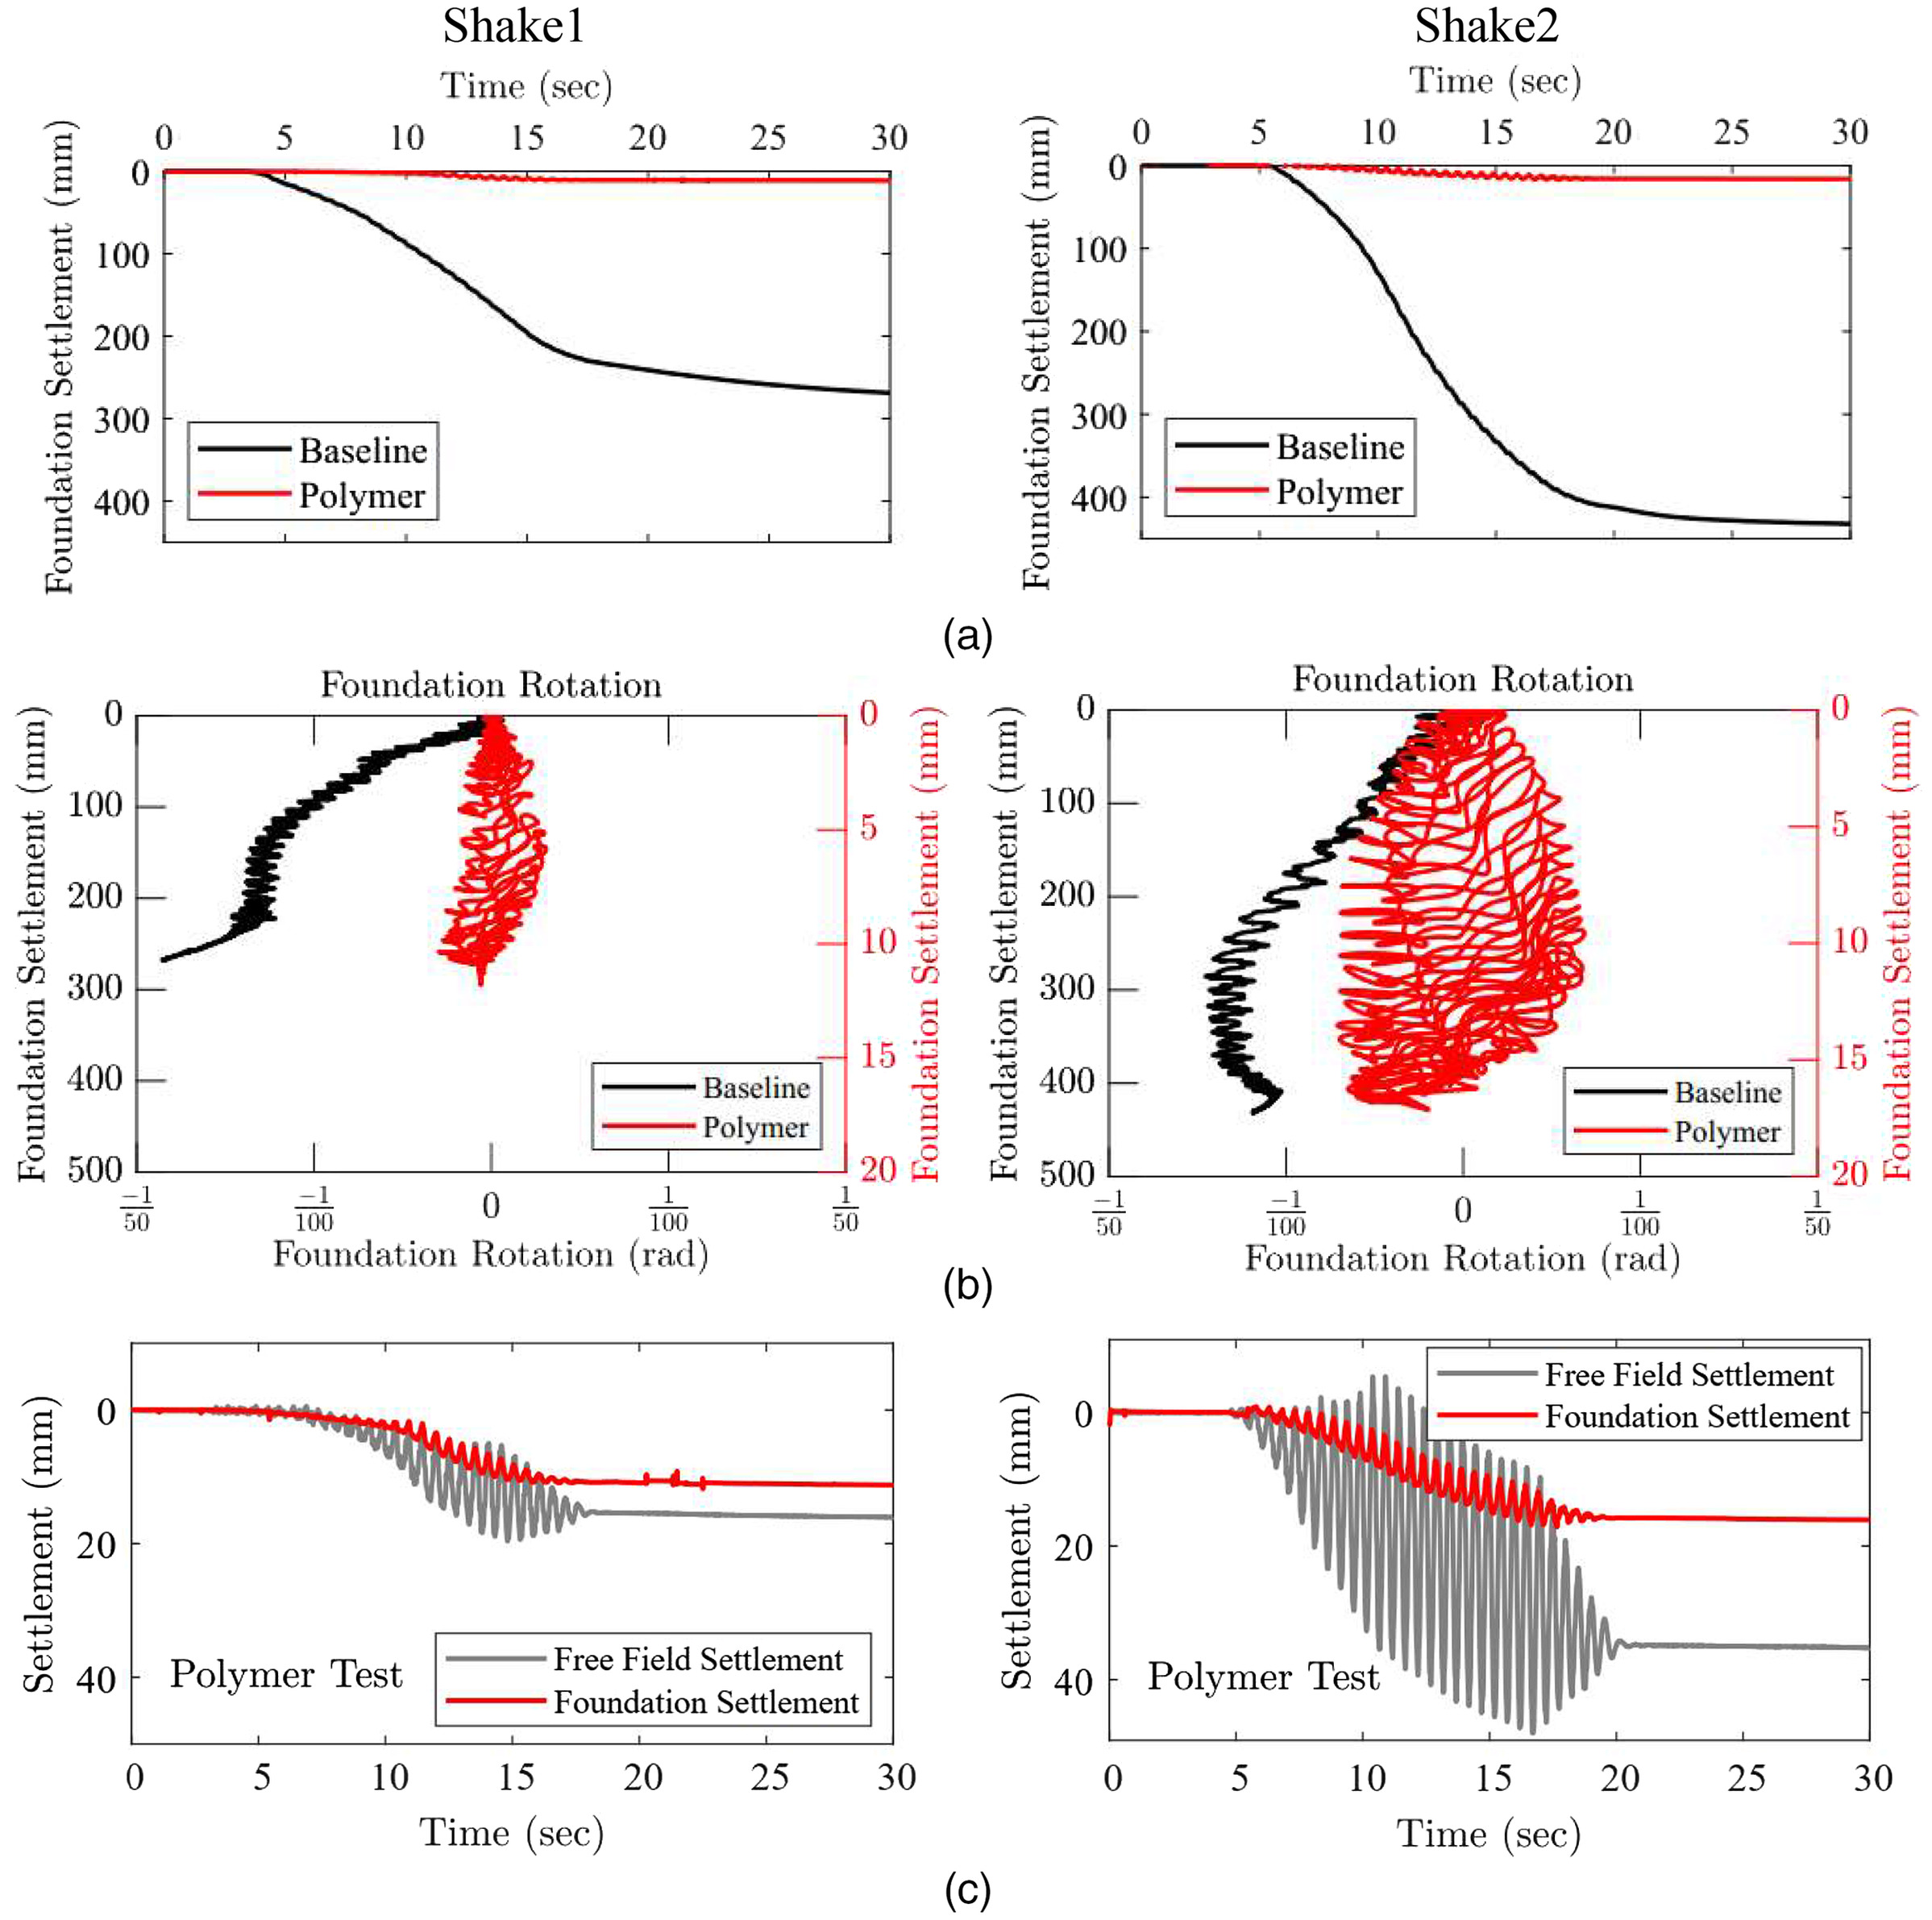
In the baseline experiment, as noted by Jahed Orang et al. (2021), a local shear failure resulted in the foundation punching through the underlying soil (Figs. 10 and 12). Post injection, a significant reduction in settlement and tilt were observed (Figs. 11 and 12), where in Shake1 permanent foundation settlement (11 mm) and residual tilt (total of ) remained well below the typically tolerable values of 25.4 mm () and respectively (DFI-GIC 2013; JGS 1996). During Shake2, the remediated model residual foundation settlement (18 mm) and tilt () were also below these tolerable values.
In the remediated model, it may also be noted that the foundation settlement was somewhat exceeded by that of the surrounding free-field ground, as shown in Fig. 12(c). This response indicates that the composite zones have resulted in an additional deep foundation mechanism that provided load transfer paths toward the deeper, more competent strata (Ashford et al. 2011).
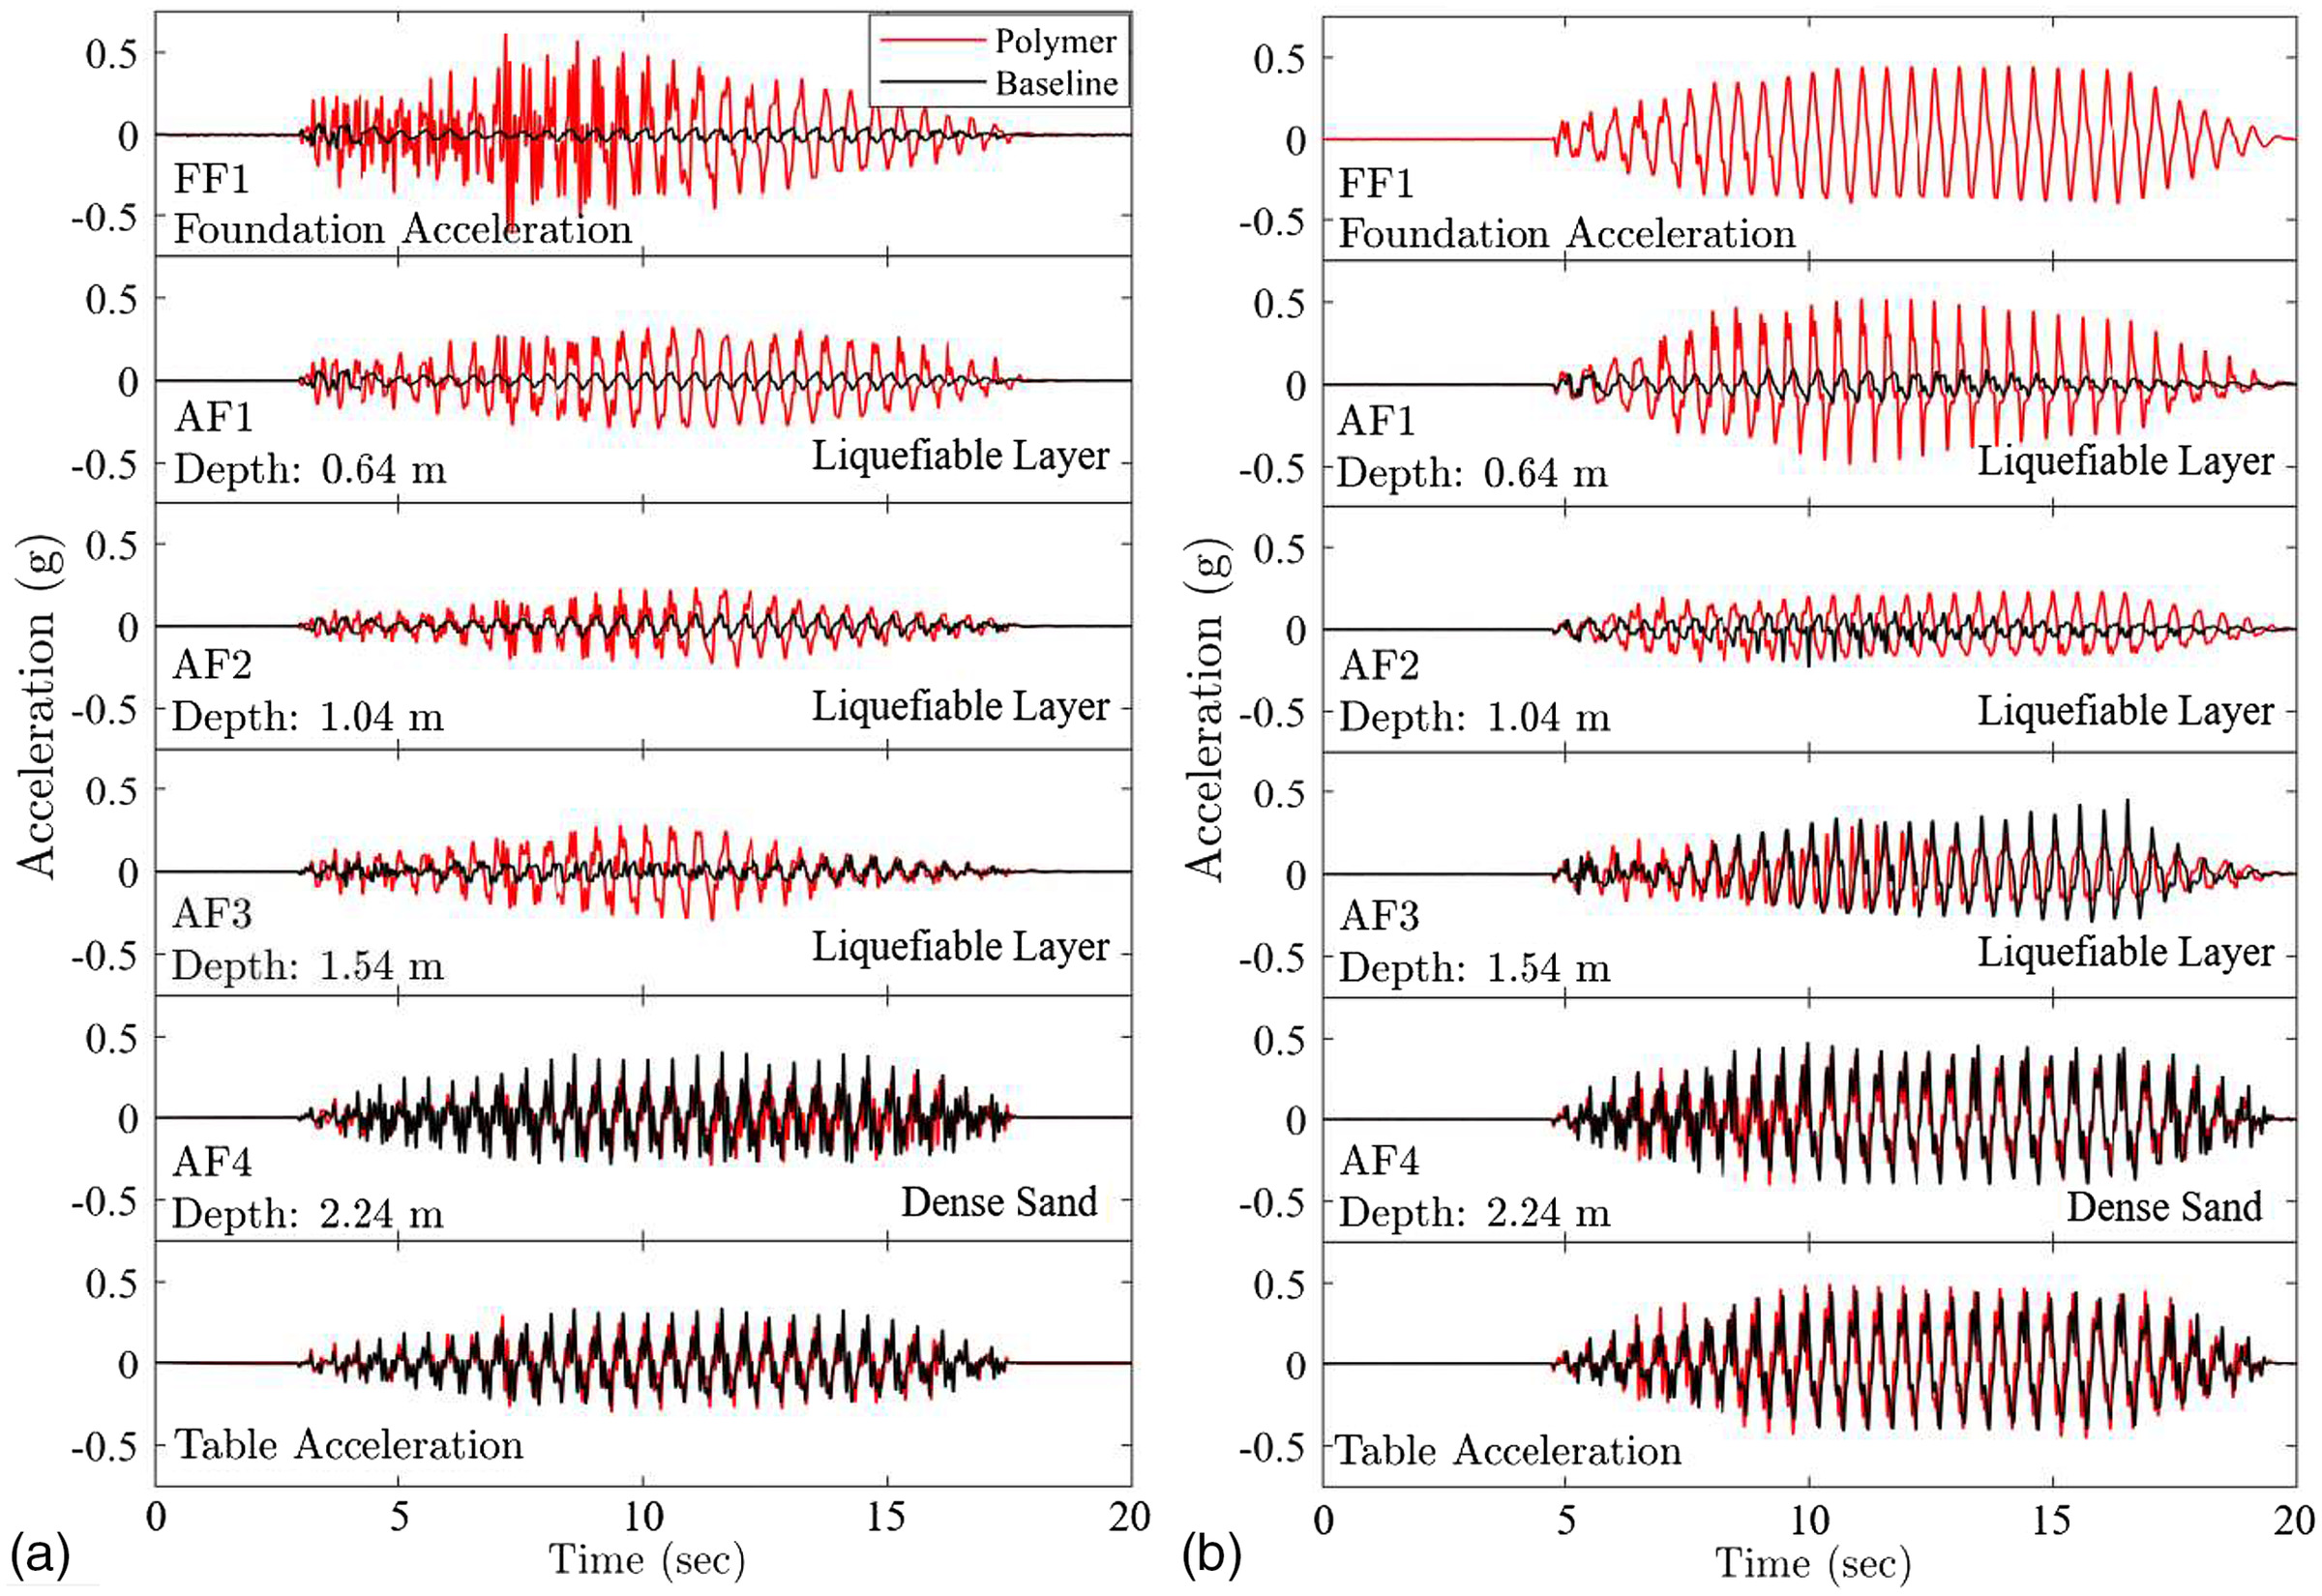
Foundation and Ground Acceleration
Fig. 13 displays the recorded acceleration for the north free-field and under foundation arrays. In the baseline test, the loss of soil stiffness and strength due to liquefaction resulted in the typical response of reduction in the foundation and ground accelerations (Kokusho 2014; Bouckovalas et al. 2016; Zayed et al. 2021a). In the polymer test, the imparted base acceleration was sustained or further amplified through the soil stratum and the foundation. This clearly shows that the ground did not lose much of its stiffness and strength.
Shear Stress-Strain Soil Response
Shear stress-strain response for both tests (Fig. 14) was computed using data from the displacement transducers (String Pots SP01- SP07) mounted on the laminates as shown in Fig. 3 (Zeghal and Elgamal 1994; Elgamal et al. 1996). In the baseline test, due to liquefaction, the loose layer rapidly loses much of its stiffness and strength, leading to low shear stress and relatively high shear strain. After remediation, much higher shear stresses prevail, and the secant shear modulus is only reduced by about 50% (due to the pore pressure buildup of Fig. 15).
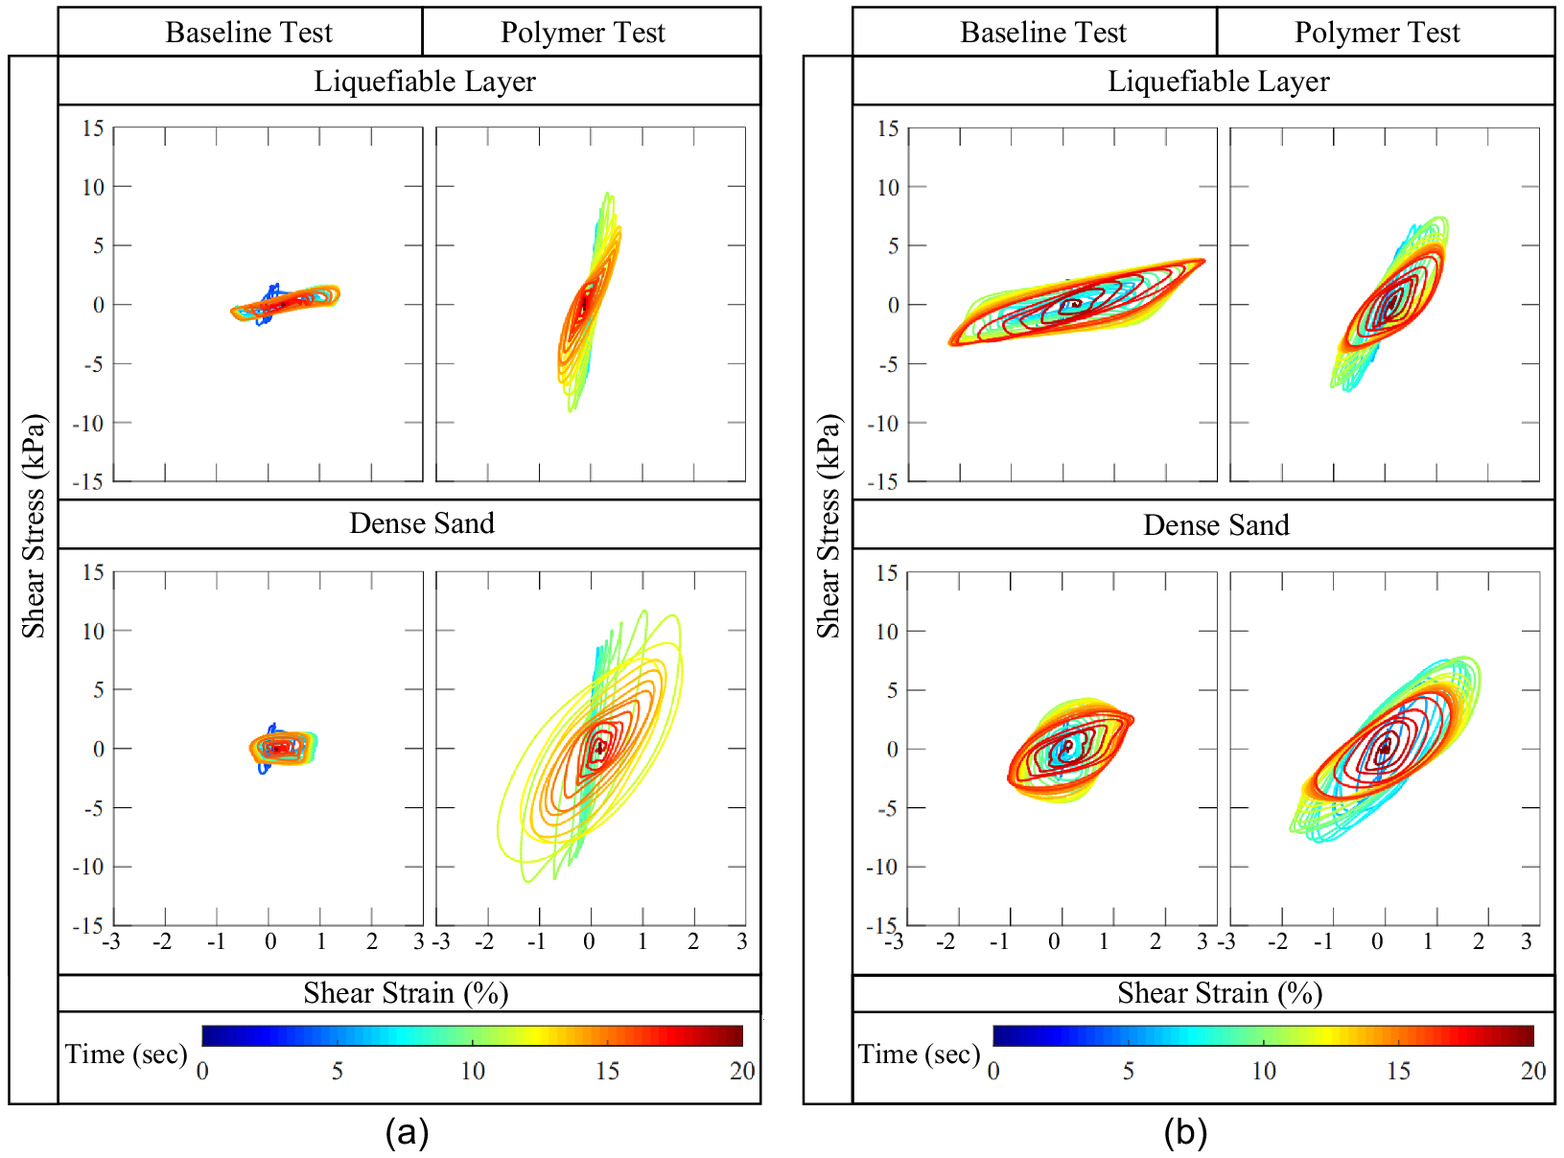
Of interest as well, is the response of the lower dense sand stratum. In the baseline model, low levels of shear stress are observed due to the liquefaction-induced low accelerations of the upper overburden loose soil. In addition, the reduced effective confinement and consequent loss of stiffness within the dense layer (due to liquefaction of the upper stratum) resulted in shear strains of about 1% during Shake1.
Once remediated and thus able to sustain higher accelerations (Fig. 13), it is seen that significantly higher shear stresses are exerted on the dense base layer (Fig. 14). These accelerations eventually reduce the base layer’s secant shear modulus by a substantial amount, indicating that the stiffened and strengthened upper stratum imposes a higher level of shear demand on this originally dense lower layer. As such, response is influenced by the overall configuration of the soil deposit as a system (Cubrinovski et al. 2019), and one must take that into account when designing a remediation strategy.
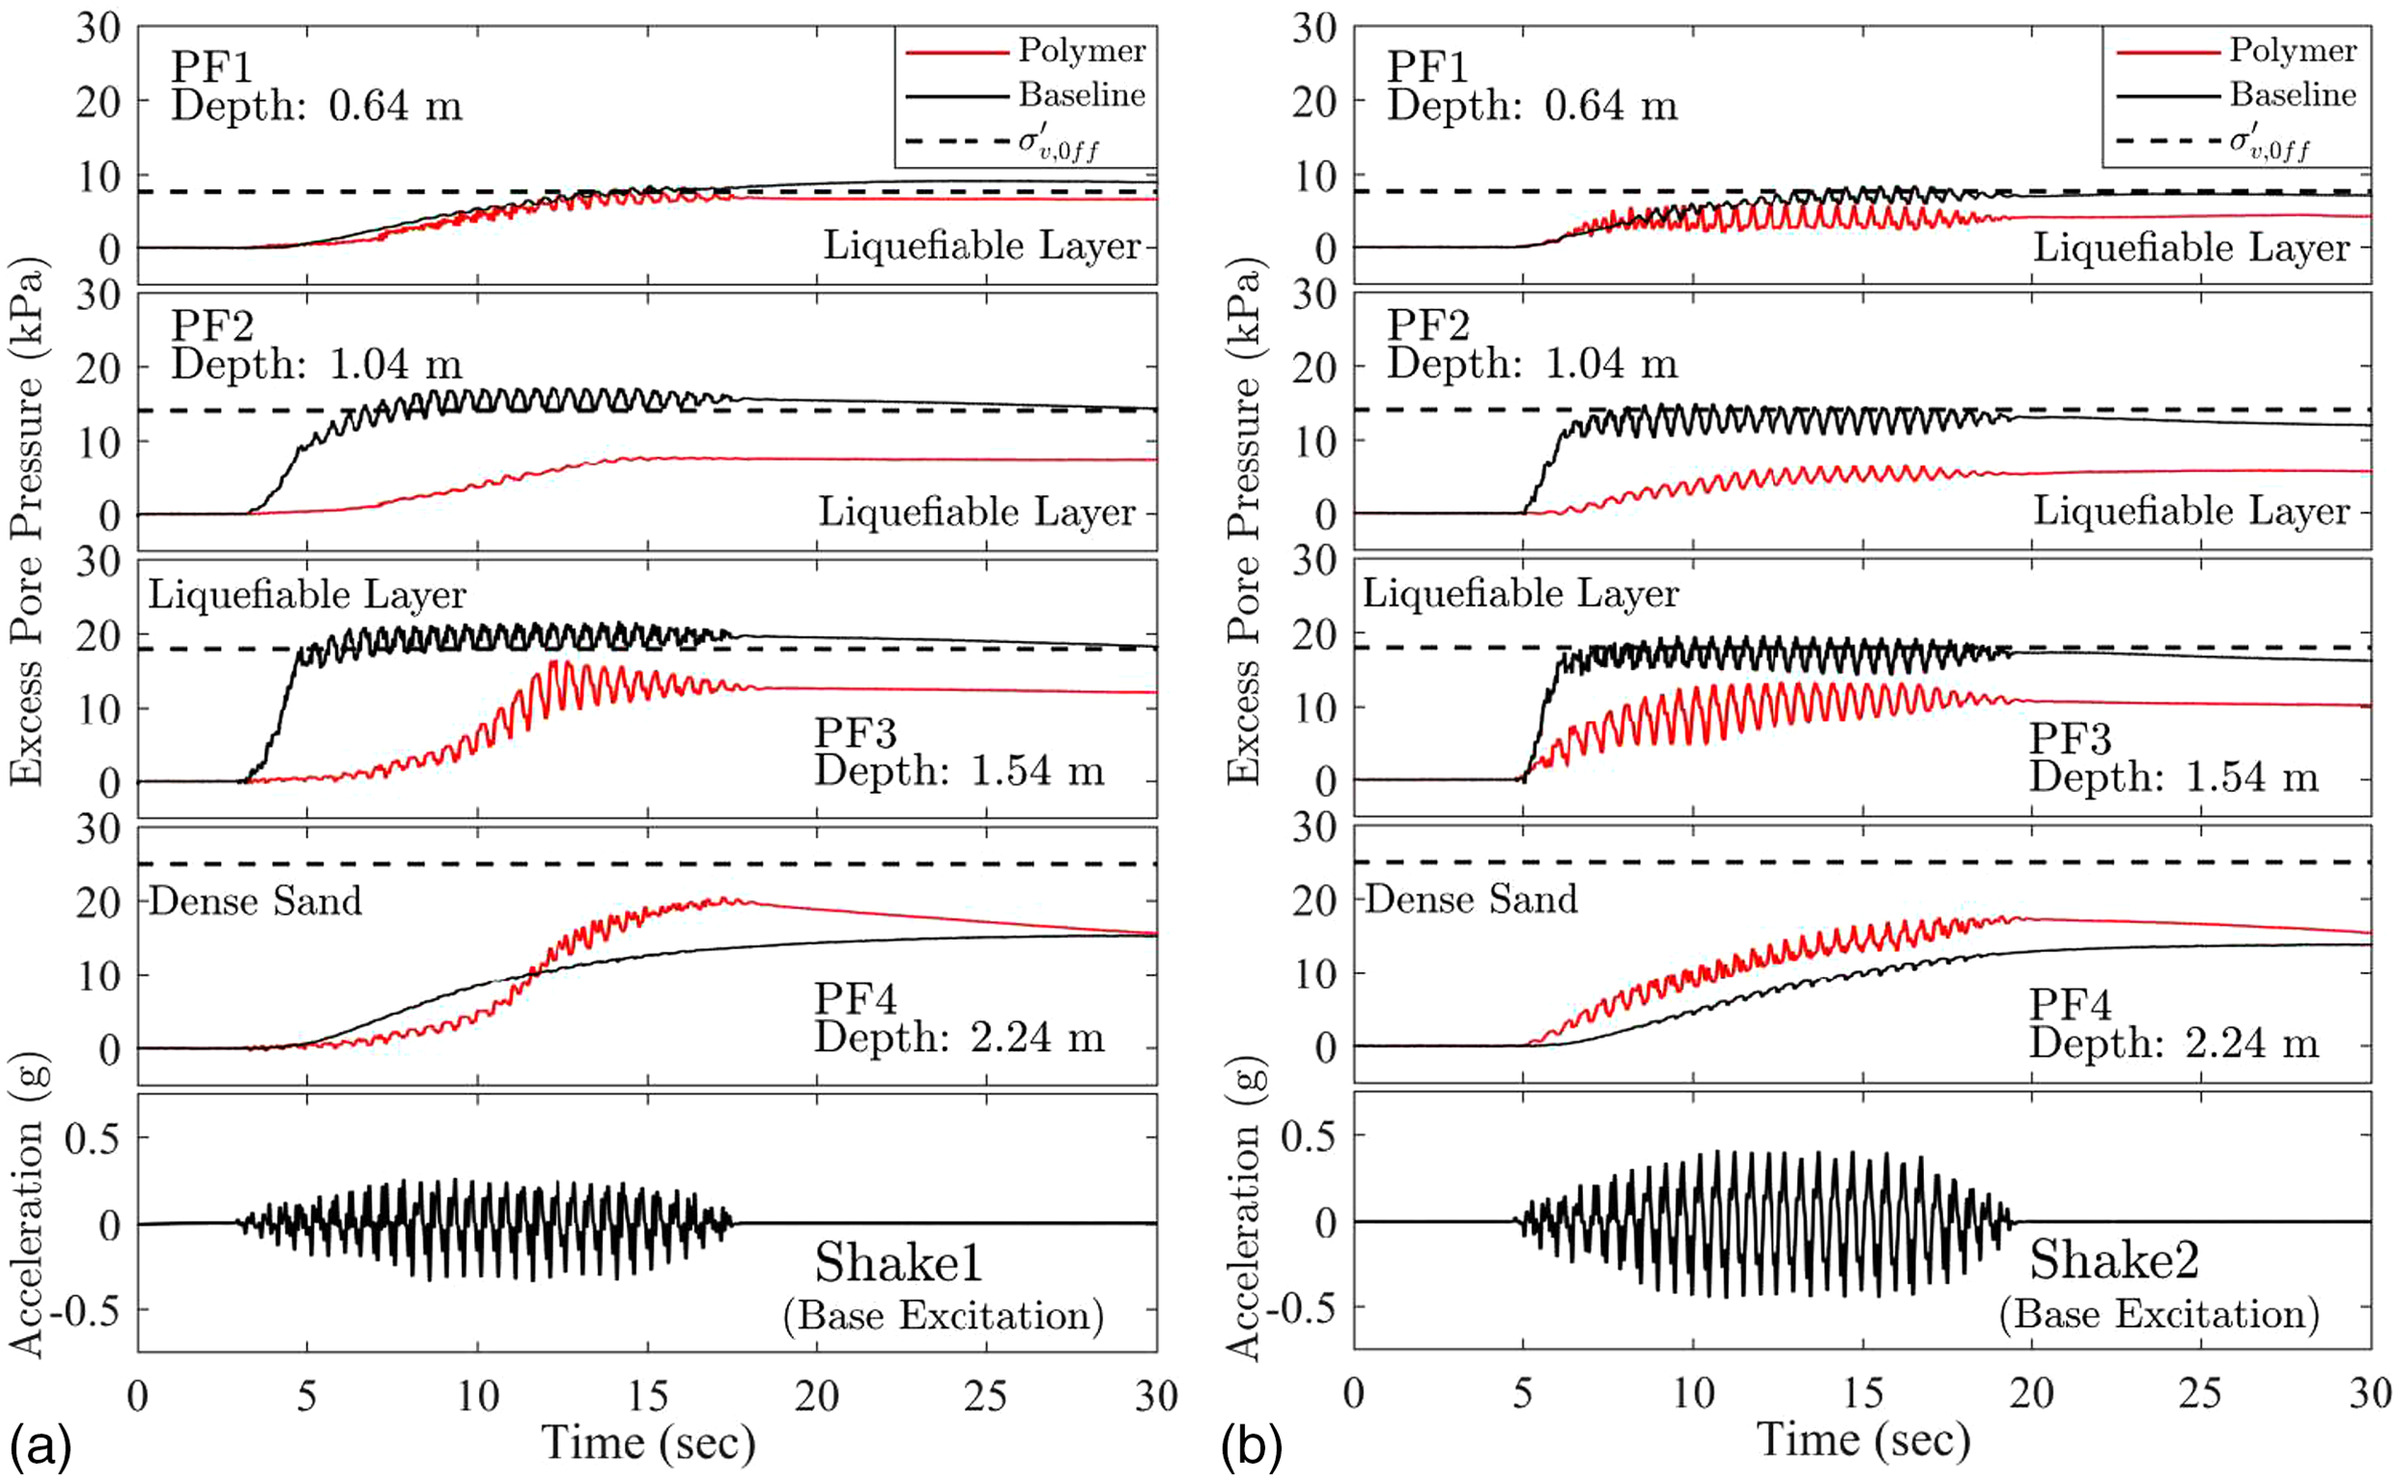
Excess Pore Pressure
Within the loose liquefiable layer (, ), initial liquefaction was reached (Fig. 15) within the first 1–2 cycles of shaking (Jahed Orang et al. 2021). Alternatively, in the remediated model, maximum attained excess pore pressure was below the value for initial liquefaction and was reached after about 12 s of shaking (15–17 cycles). Furthermore, the shear stress-strain dilative tendency (Fig. 14) was more pronounced as indicated by transient drops in pore pressure (Zeghal and Elgamal 1994), signifying the post-injection strengthening effect. Finally, it is observed that the increased shear demands on the underlying dense layer resulted in higher attained excess pore pressures ().
Discussion and Practical Implementation Concerns
1.
The employed laminar box provided lateral confinement during the polymer injection process, that being more representative of a central zone within a remediated area of large lateral extent. In practice, injection sequence protocols can be adopted, including remediation around perimeter of the area first (in order to provide further lateral confinement), followed by injection within the interior zones.
2.
The presented shake table testing scenario and its outcome should be considered in light of the laminar box providing a periodic boundary configuration (Law and Lam 2001). That is, the test setup is more representative of areal treatment under a building footprint, rather than an isolated spread footing.
3.
The extent of polymer expansion and permeation depends on its own properties, as well as on porosity of the soil and the ambient confinement (e.g., as dictated by depth of the stratum). To achieve a target increase in relative density (), higher confinement restricts the extent of polymer expansion, requiring additional volume to be injected (creating larger solidified polymer inclusions). In addition, fine grained soils will result in a reduced outer solidified shell (Fig. 1). As such, the interplay between the injected polymer properties (e.g., gel time, viscosity), injection tube spacing, amount of injected polymer, and the surrounding soil characteristics should be considered.
4.
In-situ, the injection tubes are typically deployed at () spacing to allow for some overlap and to achieve a uniform level of remediation. In the presented experiment, spacing was in the low 0.3 m range.
Conclusions
A two-stage shake table testing program to assess potential of the polymer injection technique as a countermeasure for liquefaction-induced foundation settlement is presented. The test models addressed a shallow foundation configuration. In this test series, system response was studied first without (baseline test), and subsequently with the expansive polymer injected into the liquefiable stratum under essentially identical base excitation conditions. Results of this experimental program indicated:
1.
After remediation of the loose sand stratum, a substantial increase in and CPT tip resistance was clearly observed.
2.
A significant reduction in the foundation settlement was observed due to combined effects of increased liquefaction resistance, increased ground stiffness and strength, and the composite (hardened polymer and solidified sand) below the foundation providing load paths for the foundation load toward the lower, more competent strata.
3.
Along with the reduction in settlement, an increase in the accelerations transmitted to the foundation and the ground surface was noted. In this regard, the achieved reduction in settlement objective comes with increased inertial loads on a supported superstructure.
4.
System performance was highlighted whereby improvement of the upper liquefiable layer increased shear demands on the underlying dense layer.
Overall, this testing program demonstrated the potential of the polymer injection technique as a countermeasure against liquefaction-induced settlement. Due to ease of deployment in dense urban environments, this remediation technique shows considerable promise. As such, further efforts to establish routine analysis and design guidelines are warranted.
Appendix. Characterization of the Polymer-Sand Composite Zones
Fig. 16 presents cross-sections of the composite excavated from the upper crust, middle, and base of the loose sand layer. Within this composite, two distinct phases of inner hardened polymer and outer solidified sand are observed (Fig. 1). In the upper crust, composite specimens of lower density () were observed with a thinner solidified sand interface zone, suggesting a reduced extent of permeation and more pronounced expansion under the prevailing relatively low levels of confinement. As mentioned earlier, the liquid polymer reaches the crust at a lower temperature, causing higher viscosity and resulting in this reduced permeation.
Within the liquefiable stratum, a large zone of the composite was noted between depths of (Figs. 7 and 8). Composite specimens of relatively high density () were obtained from this region, with a greater degree of permeation into the sand.
As such, composite specimens were obtained from each slice along the depth (Fig. 8), and the corresponding mass densities () were estimated. Furthermore, using density () of the hardened polymer (Table 1), and solidified sand ( herein), it is possible to back-calculate volume of hardened polymer () and solidified sand () within each slice using the relationship:where is the estimated volume of composite in each slice (Fig. 8).
The average calculations after shake table tests were performed on a slice-by slice basis. In each slice, the average relative density of the surrounding sand was obtained noting:
1.
Volume of composite in the slice (obtained from Fig. 7).
2.
Extent of cemented sand in the composite (obtained from specimens collected along depth).
The mass density at each slice () is obtained as:where = mass of dry soil in slice ; = mass of solidified sand within the polymer-sand composite in slice ; and = volume of slice based on the geometry after injection.
From the estimated mass density, is calculated using the maximum and minimum densities reported in Table 2.
Data Availability Statement
Some or all data, models, or code that support the findings of this study are available from the corresponding author upon reasonable request.
Acknowledgments
This study was partially funded by the Pacific Earthquake Engineering Research Center (PEER) and EagleLift™ (Mr. Donald Moody, Principal). The authors wish to express their gratitude to the UC San Diego Powell laboratory staff, including Dr. Christopher Latham, Darren McKay, Andrew Sander, Mike Sanders, Abdullah Hamid, and Noah Aldrich, for their continuous and tireless efforts throughout the testing phase. The authors also express their gratitude to the undergraduate aides involved in the project, including Kim-Chi Nguyen, Angel Gonzales, Marvin Machado, Gustavo Ramirez, Javi Puyat, and Jaysen Zapata.
References
Adalier, K., A.-W. Elgamal, and G. R. Martin. 1998. “Foundation liquefaction countermeasures for earth embankments.” J. Geotech. Geoenviron. Eng. 124 (6): 500–517. https://doi.org/10.1061/(ASCE)1090-0241(1998)124:6(500).
Ashford, S. A., R. W. Boulanger, J. L. Donahue, and J. P. Stewart. 2011. Geotechnical Quick Report on the Kanto Plain Region during the March 11, 2011, Off Pacific Coast of Tohoku Earthquake, Japan. Berkeley, CA: Geotechnical Extreme Events Reconnaissance.
Ashford, S. A., and W. Jakrapiyanun. 2001. Design and verification of the UCSD laminar container (SSRP282 2001/07). La Jolla, CA: Univ. of California San Diego.
Blake, D. H. 2022. “Performance of resin injection ground improvement in silty sand based on blast-induced liquefaction testing in Christchurch, New Zealand.” M.S. thesis, Dept. of Civil and Construction Engineering, Brigham Young Univ.
Bouckovalas, G. D., Y. Z. Tsiapas, A. I. Theocharis, and Y. K. Chaloulos. 2016. “Ground response at liquefied sites: Seismic isolation or amplification?” Soil Dyn. Earthquake Eng. 91 (Dec): 329–339. https://doi.org/10.1016/j.soildyn.2016.09.028.
Bray, J. D., et al. 2000. “Damage Patterns and foundation performance in Adapazari.” Earthquake Spectra 16 (Supplement A): 163–188. https://doi.org/10.1193/1.1586152.
Buzzi, O., S. Fityus, and S. W. Sloan. 2010. “Use of expanding polyurethane resin to remediate expansive soil foundations.” Can. Geotech. J. 47 (6): 623–634. https://doi.org/10.1139/T09-132.
Cubrinovski, M., et al. 2010. “Geotechnical reconnaissance of the 2010 Darfield (Canterbury) earthquake.” Bull. N. Z. Soc. Earthquake Eng. 43 (4): 243–320. https://doi.org/10.5459/bnzsee.43.4.243-320.
Cubrinovski, M. 2013. “Liquefaction-induced damage in the 2010-2011 Christchurch (New Zealand) earthquakes.” In Proc., Int. Conf. on Case Histories in Geotechnical Engineering. Chicago: Missouri Univ. of Science and Technology.
Cubrinovski, M., A. Rhodes, N. Ntritsos, and S. Van Ballegooy. 2019. “System response of liquefiable deposits.” Soil Dyn. Earthquake Eng. 124 (Sep): 212–229. https://doi.org/10.1016/j.soildyn.2018.05.013.
DFI-GIC. 2013. “Commentary on the selection, design and specification of ground improvement for mitigation of earthquake-induced liquefaction.” DFI J. Deep Found. Inst. 7 (1): 3–12. https://doi.org/10.1179/dfi.2013.001.
Ebeido, A. 2019. “Lateral-spreading effects on pile foundations: Large-scale testing and analysis.” Ph.D. thesis, Dept. of Structural Engineering, Univ. of California San Diego.
Elgamal, A., M. Zeghal, V. Taboada, and R. Dobry. 1996. “Analysis of site liquefaction and lateral spreading using centrifuge testing records.” Soils Found. 36 (2): 111–121. https://doi.org/10.3208/sandf.36.2_111.
EQC (Earthquake Commission). 2016. Residential ground improvement—Findings from trials to manage liquefaction vulnerability. Wellington, New Zealand: Earthquake Commission.
Erdemgil, M., S. Sağlam, and B. S. Bakır. 2007. “Utilization of highly expansive polymer injection to mitigate seismic foundation failure for existing structures.” In Proc., 8th Pacific Conf. on Earthquake Engineering. Christchurch, New Zealand: New Zealand Society for Earthquake Engineering.
Gatto, M. P. A., V. Lentini, F. Castelli, L. Montrasio, and D. Grassi. 2021. “The use of polyurethane injection as a geotechnical seismic isolation method in large-scale applications: A numerical study.” Geosciences 11 (5): 201. https://doi.org/10.3390/geosciences11050201.
Hamada, M., R. Isoyama, and K. Wakamatsu. 1996. “Liquefaction-induced ground displacement and its related damage to lifeline facilities.” Soils Found. 36 (Supplement): 81–97. https://doi.org/10.3208/sandf.36.Special_81.
Hao, M., X. Li, Y. Zhong, B. Zhang, D. Jin, and G. Chen. 2018. “Numerical simulation of polymer grout diffusion in a single fracture.” AIP Adv. 8 (10): 105329. https://doi.org/10.1063/1.5052372.
Iai, S. 2005. “Remediation of liquefiable soils for port structures in Japan—Analysis, design and performance.” J. Earthquake Eng. 9 (S1): 77–103. https://doi.org/10.1080/13632460509350580.
Ishihara, K., and Y. Koga. 1981. “Case studies of liquefaction in the 1964 Niigata earthquake.” Soils Found. 21 (3): 35–52. https://doi.org/10.3208/sandf1972.21.3_35.
Jahed Orang, M., R. Motamed, A. Prabhakaran, and A. Elgamal. 2021. “Large-scale shake table tests on a shallow foundation in liquefiable soils.” J. Geotech. Geoenviron. Eng. 147 (1): 04020152. https://doi.org/10.1061/(ASCE)GT.1943-5606.0002427.
Jain, S. K., W. R. Lettis, C. V. R. Murty, and J.-P. Bardet. 2002. “Bhuj, India Earthquake of January 26, 2001.” Earthquake Spectra 18 (1_suppl): 1–4. https://doi.org/10.1193/1.2803902.
JGS (Japanese Geotechnical Society). 1996. Remedial measures against soil liquefaction: From investigation and design to implementation. London: Taylor & Francis.
Kim, T. R., J. K. Shin, T. S. Goh, H. S. Kim, J. S. Lee, and C. S. Lee. 2017. “Modeling of elasto-viscoplastic behavior for polyurethane foam under various strain rates and temperatures.” Compos. Struct. 180 (Nov): 686–695. https://doi.org/10.1016/j.compstruct.2017.08.032.
Kokusho, T. 2014. “Seismic base-isolation mechanism in liquefied sand in terms of energy.” Soil Dyn. Earthquake Eng. 63 (Aug): 92–97. https://doi.org/10.1016/j.soildyn.2014.03.015.
Law, H. K., and I. P. Lam. 2001. “Application of periodic boundary for large pile group.” J. Geotech. Geoenviron. Eng. 127 (10): 889–892. https://doi.org/10.1061/(ASCE)1090-0241(2001)127:10(889).
Lee, K. S., J. I. Choi, S. K. Kim, B. K. Lee, J. S. Hwang, and B. Y. Lee. 2017a. “Damping and mechanical properties of composite composed of polyurethane matrix and preplaced aggregates.” Constr. Build. Mater. 145 (Aug): 68–75. https://doi.org/10.1016/j.conbuildmat.2017.03.233.
Lee, S. H., S. J. Lee, J. G. Park, and Y. T. Choi. 2017b. “An experimental study on the characteristics of polyurethane-mixed coarse aggregates by large-scale triaxial test.” Constr. Build. Mater. 145 (Aug): 117–125. https://doi.org/10.1016/j.conbuildmat.2017.03.107.
Liu, K., Y. Li, F. Wang, H. Xie, H. Pang, and H. Bai. 2019. “Analytical and model studies on behavior of rigid polyurethane composite aggregate under compression.” J. Mater. Civ. Eng. 31 (3): 04019007. https://doi.org/10.1061/(ASCE)MT.1943-5533.0002641.
Magenes, G. 1989. “Design, analysis and calibration of the UCSD shake table.” M.S. thesis, Dept. of Applied Mechanics/Engineering Sciences, Univ. of California San Diego.
Maher, M. H., K. S. Ro, and J. P. Welsh. 1994. “High strain dynamic modulus and damping of chemically grouted sand.” Soil Dyn. Earthquake Eng. 13 (2): 131–138. https://doi.org/10.1016/0267-7261(94)90005-1.
Mitchell, J. K. 1981. “Soil improvement—State-of-the-art report.” In Proc., 10th Int. Conf. on Soil Mechanics and Foundation Engineering. Rotterdam, Netherlands: A.A. Balkema.
Motamed, R., M. J. Orang, A. Parayancode, and A. Elgamal. 2020. “Results of a class C blind prediction competition on the numerical simulation of a large-scale liquefaction shaking table test.” In Proc., Geo-Congress 2020: Vision, Insight, Outlook, 334–342. Reston, VA: ASCE. https://doi.org/10.1061/9780784482780.032.
Mousavi, S., and M. Ghayoomi. 2021. “Liquefaction mitigation of sands with nonplastic fines via microbial-induced partial saturation.” J. Geotech. Geoenviron. Eng. 147 (2): 04020156. https://doi.org/10.1061/(ASCE)GT.1943-5606.0002444.
Naudts, A. 2003. “Irreversible changes in the grouting industry caused by polyurethane grouting: An overview of 30 years of polyurethane grouting.” In Proc., 3rd Int. Conf. on Grouting and Ground Treatment, 1266–1280. Reston, VA: ASCE. https://doi.org/10.1061/40663(2003)74.
NSF. 2017. Drinking water system components—Health effects. NSF/ANSI-61. Ann Arbor, MI: NSF International.
Okamura, M., M. Takebayashi, K. Nishida, N. Fujii, M. Jinguji, T. Imasato, H. Yasuhara, and E. Nakagawa. 2011. “In-situ desaturation test by air injection and its evaluation through field monitoring and multiphase flow simulation.” J. Geotech. Geoenviron. Eng. 137 (7): 643–652. https://doi.org/10.1061/(ASCE)GT.1943-5606.0000483.
Parra Bastidas, A. M. 2016. “Ottawa F-65 sand characterization.” Ph.D. thesis, Dept. of Civil and Environmental Engineering, Univ. of California Davis.
Prabhakaran, A., K. Kyungtae, A. Ebeido, M. Jahed Orang, R. Motamed, A. Elgamal, and C. Frazao. 2021. “Polymer injection and associated site liquefaction remediation mechanisms.” In Proc., 17th World Conf. on Earthquake Engineering. Tokyo: Japan Association of Earthquake Engineering.
Rao, R. R., L. A. Mondy, K. N. Long, M. C. Celina, N. Wyatt, C. C. Roberts, M. M. Soehnel, and V. E. Brunini. 2017. “The kinetics of polyurethane structural foam formation: Foaming and polymerization.” AIChE J. 63 (7): 2945–2957. https://doi.org/10.1002/aic.15680.
Robertson, P. K., and C. E. Wride. 1998. “Evaluating cyclic liquefaction potential using the cone penetration test.” Can. Geotech. J. 35 (3): 442–459. https://doi.org/10.1139/t98-017.
Saleh, S., N. Z. M. Yunus, K. Ahmad, and N. Ali. 2019. “Improving the strength of weak soil using polyurethane grouts: A review.” Constr. Build. Mater. 202 (Mar): 738–752. https://doi.org/10.1016/j.conbuildmat.2019.01.048.
Shigang, A., T. Liqun, M. Yiqi, P. Yongmao, L. Yiping, and F. Daining. 2013. “Effect of aggregate distribution and shape on failure behavior of polyurethane polymer concrete under tension.” Comput. Mater. Sci. 67 (Feb): 133–139. https://doi.org/10.1016/j.commatsci.2012.08.029.
Towhata, I. 2021. “Liquefaction mitigation measures: A historical review.” In Latest developments in geotechnical earthquake engineering and soil dynamics, 41–86. Singapore: Springer.
Trautner, C., Y. Zheng, J. S. McCartney, and T. Hutchinson. 2018. “An approach for shake table performance evaluation during repair and retrofit actions.” Earthquake Eng. Struct. Dyn. 47 (1): 131–146. https://doi.org/10.1002/eqe.2942.
Traylen, N. J., S. Van Ballegooy, and R. Wentz. 2016. “Research results from a study into resin injection for liquefaction mitigation.” In Proc., NZSEE Conf. Christchurch, New Zealand: New Zealand Society for Earthquake Engineering.
Traylen, N. J., R. Wentz, S. Van Ballegooy, T. Hnat, and L. M. Wotherspoon. 2017. “Research results from a study into resin injection for liquefaction mitigation 2017 NZSEE conference.” In Proc., NZSEE Conf. Christchurch, New Zealand: New Zealand Society for Earthquake Engineering.
Valentino, R., E. Romeo, and D. Stevanoni. 2014. “An experimental study on the mechanical behavior of two polyurethane resins used for geotechnical applications.” Mech. Mater. 71 (Apr): 101–113. https://doi.org/10.1016/j.mechmat.2014.01.007.
Xiao, Y., H. Liu, and C. S. Desai. 2015. “New method for improvement of rockfill material with polyurethane foam adhesive.” J. Geotech. Geoenviron. Eng. 141 (2): 02814003. https://doi.org/10.1061/(ASCE)GT.1943-5606.0001248.
Xiao, Y., A. W. Stuedlein, Q. Chen, H. Liu, and P. Liu. 2018. “Stress-strain-strength response and ductility of gravels improved by polyurethane foam adhesive.” J. Geotech. Geoenviron. Eng. 144 (2): 04017108. https://doi.org/10.1061/(ASCE)GT.1943-5606.0001812.
Yamazaki, H., K. Hayashi, and K. Zen. 2005. “New liquefaction countermeasure based on pore water replacement.” In Proc., 16th Int. Conf. on Soil Mechanics and Geotechnical Engineering: Geotechnology in Harmony with the Global Environment, 2741–2744. Bristol, UK: IOP Press.
Yasuda, S., and K. Harada. 2014. “Measures developed in Japan after the 1964 Niigata Earthquake to counter the liquefaction of soil.” In Proc., NCEE 2014—10th U.S. National Conf. on Earthquake Engineering: Frontiers of Earthquake Engineering. Anchorage, AL: Earthquake Engineering Research Institute.
Yegian, M. K., E. Eseller-Bayat, A. Alshawabkeh, and S. Ali. 2007. “Induced-partial saturation for liquefaction mitigation: Experimental investigation.” J. Geotech. Geoenviron. Eng. 133 (4): 372–380. https://doi.org/10.1061/(ASCE)1090-0241(2007)133:4(372).
Zayed, M., A. Ebeido, A. Prabhakaran, K. Kim, Z. Qiu, and A. Elgamal. 2021a. “Shake table testing: A high-resolution vertical accelerometer array for tracking shear wave velocity.” Geotech. Test. J. 44 (4): 20190066. https://doi.org/10.1520/GTJ20190066.
Zayed, M., A. Ebeido, A. Prabhakaran, Z. Qiu, and A. Elgamal. 2021b. “Asymmetric input motion for accumulation of lateral ground deformation in laminar container shake table testing.” Can. Geotech. J. 58 (2): 210–223. https://doi.org/10.1139/cgj-2018-0647.
Zeghal, M., and A. W. Elgamal. 1994. “Analysis of site liquefaction using earthquake records.” J. Geotech. Eng. 120 (6): 996–1017. https://doi.org/10.1061/(ASCE)0733-9410(1994)120:6(996).
Information & Authors
Information
Published In

Journal of Geotechnical and Geoenvironmental Engineering
Volume 149 • Issue 8 • August 2023
Copyright
This work is made available under the terms of the Creative Commons Attribution 4.0 International license, https://creativecommons.org/licenses/by/4.0/.
History
Received: Mar 3, 2022
Accepted: Feb 1, 2023
Published online: May 25, 2023
Published in print: Aug 1, 2023
Discussion open until: Oct 25, 2023
ASCE Technical Topics:
- Engineering fundamentals
- Engineering materials (by type)
- Foundation settlement
- Foundations
- Geomechanics
- Geotechnical engineering
- Geotechnical investigation
- Laboratory tests
- Materials engineering
- Penetration tests
- Polymer
- Shake table tests
- Shallow foundations
- Soil dynamics
- Soil liquefaction
- Soil mechanics
- Soil properties
- Soil settlement
- Synthetic materials
- Tests (by type)
Authors
Metrics & Citations
Metrics
Citations
Download citation
If you have the appropriate software installed, you can download article citation data to the citation manager of your choice. Simply select your manager software from the list below and click Download.
Cited by
- Ahmed Ebeido, Athul Prabhakaran, Ahmed Elgamal, Reinforced Concrete Pile Response during Liquefaction-Induced Lateral Spreading: Experimental Insights, Geo-Congress 2024, 10.1061/9780784485316.034, (321-329), (2024).