Unlocking Productivity: Revealing Waste and Hidden Disturbances Impacting MEP Workers
Publication: Journal of Construction Engineering and Management
Volume 150, Issue 9
Abstract
Wasted effort limits productivity. Successful construction project management entails identifying and mitigating causes of waste. A time-motion study was conducted to collect and classify mechanical, electrical, and plumbing (MEP) work to understand factors contributing to waste. The data were analyzed for disturbances to direct work and sources of waste within such disturbances. Installation work was disturbed very frequently. This led to low shares of direct work. Disturbances can be divided into three groups (short-, medium-, and long-term) based on duration. Short-term disturbances, involving adjusting installation areas and material handling, enabled continued direct work without waste. Medium-term disturbances included most nonvalue-adding activities within the wider work environment. They depended on installers’ understanding and required workplace adjustments. Long-term disturbances extended beyond the installation area, necessitating material searches and coordination, leading to significant waste. The study contributes to understanding MEP work and questions traditional management practices that do not provide sufficient preconditions for construction workers. Current methods are not on a sufficient level of granularity to effectively improve productivity. The study suggests integrating precise motion tracking and digital systems to reduce waste related to medium- and long-term disturbances. Providing real-time, task-specific information using digital tools can enhance situational awareness, minimizing nonvalue-adding tasks. Additionally, mobile workstations and logistical services could alleviate movement issues in such disturbances. Required granularity to accurately assess preconditions requires additional research into automating data collection and analysis.
Introduction
Construction projects suffer from low labor productivity (Gong et al. 2011; Horman and Kenley 2005; Neve et al. 2020a). Understanding factors related to wasted effort at individual and trade levels is critical to project success (Howell et al. 2004; Liu et al. 2010). Unready or insufficient task preconditions are major contributors to these inefficiencies (Koskela 2000), and the type and extent of missing preconditions influence how much waste occurs between direct work activities and thus how long disturbances last (Görsch et al. 2022). In these disturbances, workers devote time to nonvalue-adding self-guided activities such as revising plans, consulting colleagues, searching for equipment and materials, or checking spatial and task-related conditions (Görsch et al. 2024).
Disturbances can be limited by providing task preconditions to minimize nonvalue-adding tasks. For example, the last planner system focuses on making tasks ready by reducing constraints and giving workers assignments with sound preconditions (Hamzeh et al. 2008). In theory, no task is released with missing preconditions. However, scheduled tasks in projects utilizing the last planner system are often not completed (Alarcón et al. 2008; Bortolazza and Formoso 2006; Power and Taylor 2019) due to informal constraint analysis (Ballard 1999; Jang and Kim 2007) and failure to consider unexpected variability fluctuations (Ebbesen 2004). Task readiness at the installer level is influenced by rapidly changing trade- and crew-specific factors that challenge the accuracy of weekly planning (Gil et al. 2000; Grau et al. 2019). Thus, methods such as the last planner system do not fully address the problem of wasted time.
Qualitative studies predominantly capture manager and planner perspectives in interviews and surveys, emphasizing nonvalue-added portions primarily from a planning standpoint. The causes of wasted effort are generally linked to inefficient preconstruction activities (Khanh and Kim 2014; Naji et al. 2022). Quantitative approaches evaluating nonvalue-adding activities and wasted effort have revealed that approximately half of the total working time is wasted, subject to variations based on task, industry, project, and time (Demirkesen et al. 2022; Kalsaas et al. 2014; Neve et al. 2020a). Worker perspectives have been investigated in work-sampling studies observing workers’ work activities. Results show the proportions of value-adding versus nonvalue-adding categories, which vary greatly (Neve et al. 2020a), as do the categories used to classify work time (Kalsaas 2011; Liou and Borcherding 1986; Neve et al. 2020b). Josephson and Bjorkman (2013) suggested that work sampling can stimulate discussions within projects and highlight the symptoms of the problem without providing empirical evidence of root causes.
Detailed time-motion studies now provide empirical knowledge on root causes. Görsch et al. (2022) employed time-motion analysis to study frequent disturbances in workflows and causes of direct work stoppages. Seppänen and Görsch (2022) identified, based on qualitative evidence, communication and coordination problems, design quality, extent of prefabrication, site logistics, and production planning and control as generic causes of wasted effort. However, these studies did not statistically analyze correlations between missing preconditions and wasted effort and how they contribute to disturbances of direct work.
Mechanical, electrical, and plumbing (MEP) work has consistently shown elevated levels of wasted efforts (Josephson and Bjorkman 2013). MEP work represents a significant proportion of building construction. MEP is part of the indoor construction phase where many interrelated activities occur in the same space (Sacks and Goldin 2007); this makes providing all needed preconditions a challenging task. MEP contractors are not typically able to influence how projects are managed because they are, in most contract forms, managed by the general contractor. Due to the productivity challenges observed in MEP work, Finnish MEP employer associations have invested in a collaborative research effort to gain a deeper understanding of factors disturbing installation work and contributing to wasted effort. The following research questions outline this intention:
1.
What are the frequency and duration of direct work disturbances of MEP work?
2.
What factors impact waste and contribute to the frequency and duration of direct work disturbances?
Answering the research questions aims to understand, categorize, and explain disturbances of installation work. While most previous research has focused on wasted efforts and the reasons for them, the study shifts the focus to disturbances, which often involve several subsequent wasteful activities. This approach provides a deeper understanding of why and how installation work is disturbed and how the management of preconditions can support improved performance and resource efficiency in construction. MEP work is an appropriate context for the study because it contains numerous disturbances and task types, contributing to the generalizability of findings. To achieve the paper’s objective, a comprehensive time-motion study was designed and conducted to assess and comprehend factors influencing disturbances in MEP work. It included statistical analyses to evaluate how wasted efforts and missing preconditions disturb direct work.
This paper addresses the disturbances of direct work in construction, first establishing the link between the concept of waste and disturbances by examining how waste arises in production and is transferred to the construction industry. It then reviews previous studies on waste, which form the basis for analyzing the results of this study. The aim is to identify the factors influencing resource inefficiency and waste in the construction sector. The selected data collection and analysis methods are described, and the reasons for their choice and application in the study are outlined. Lastly, the results are presented and discussed before the conclusions are drawn.
Literature Review
Wasted Effort and Preconditions in Construction
Traditionally, waste in construction is seen as the physical byproduct of production resulting from the excessive use of resources (Bølviken et al. 2014). The Toyota production system added a lean, process-oriented perspective to the concept of waste by focusing on quantifying and eliminating time-related inefficiencies (Ohno 1988). Lean construction has adopted this process perspective of waste, examining the activities of individuals or teams on the shop floor (Koskela 1992; Ohno 1988; Womack and Jones 2003). In lean construction, wasted effort is an inefficient or unnecessary allocation of resources, time, and labor that does not add value to the overall progress or quality of a construction project (Koskela 1992). There are seven types of wasted effort in the lean literature: transportation, waiting, motion, extra processing, overproduction, defects, and inventory (Ohno 1988), to which making do (Koskela 2004) and unutilized talent (Ansah et al. 2016) can be added. These categories are commonly referred to in construction (Koskela 2000; Poreddy et al. 2015; Wandahl et al. 2021).
Waste arises from missing task preconditions (Koskela 2000). Preconditions include building design and specifications, directives, components and materials, workers, equipment and machinery, sufficient space, connecting work, external conditions, and working conditions (Bertelsen et al. 2006; Koskela 2000). These preconditions are subject to wide availability fluctuations in construction projects (Bertelsen et al. 2006), and thus, it is difficult to plan and control production such that preconditions are available to all workers at all times (Henrich et al. 2007). Starting work with missing preconditions causes waste and decreases the time spent on direct work (Dave et al. 2010).
Evaluating Wasted Effort and Disturbances in Construction
Approaches to studying wasted effort in construction include surveys (Bajjou and Chafi 2022; Issa and Alqurashi 2020), interviews (Formoso et al. 2017; Kalsaas et al. 2014), and activity analyses (Gouett et al. 2011). Work sampling is often used to measure waste (Kalsaas 2011; Josephson and Bjorkman 2013; Wandahl et al. 2021). In work sampling, observers track workers’ activities at random or specified time intervals to measure their shares of direct work and wasted effort. Although categories of wasted effort vary, the share of direct work is consistently used by scholars (Neve et al. 2020a). Studies have reported direct work shares between 30% and 60% (Thomas et al. 1984; Horman and Kenley 2005; Gong et al. 2011; Neve et al. 2020a, b), meaning that 40%–70% of effort is wasted in construction.
Previous studies have not categorized preconditions or waste categories, possibly because detecting waste and preconditions is difficult when observations are not continuous (Seppänen and Görsch 2022). These shortcomings could be addressed by continuous observations, such as in time-motion studies, which combine an efficiency measuring method (time study) by Taylor (1911) with work activity analysis (motion study) by Gilbreth and Gilbreth (1922). Various time-motion studies have shown that unnecessary movement and waiting are the main waste types in construction. Demirkesen et al. (2022) found that about three-quarters of work time is wasteful, mainly due to waiting. However, as the observability of waste varies by type, certain types may be disproportionately represented (Demirkesen et al. 2022; Kalsaas 2011). Given this possibility of bias in evaluation, other approaches, such as observing direct work disturbances, may generate additional insights.
Researchers have investigated interruptions in construction. Hassan and El-Rayes (2020) and Dai et al. (2023) investigated why work comes to a complete stop and causes cascading delays. Neve et al. (2020b) used work sampling to investigate shares of activities before and after direct work stops and revealed that higher performance is achieved when direct work starts earlier and stops later throughout a workday. Tetik et al. (2021) reported that value-added work is less interrupted when kitting logistics are used to enable just-in-time material deliveries to installation areas. In addition, Zhao et al. (2019) concluded that longer uninterrupted presence time at the workplace is associated with higher shares of direct work, which is in line with Wandahl et al.’s (2023) finding of a negative correlation between direct work and movement. Similarly, in applied ergonomics, the role of the organized workplace in uninterrupted workflows has been established (Neyens et al. 2019). Interruptions divert the worker’s attention from the main task, which is stressful and exhausting, decreasing the worker’s situational awareness (Weigl et al. 2020). Görsch et al. (2022) examined time intervals between direct work activities and found that preparatory work, such as working with materials, reviewing plans, or making spatial adjustments, most frequently stopped direct work.
However, none of these studies considered waste types and missing preconditions. This study analyzed how missing preconditions affect wasted effort and lead to prolonged direct work disturbances. Thus, it expands research by Görsch et al. (2022) on stoppages and continuation of direct work by analyzing how much time is spent on activities before and after direct work stops. The study departs from Neve et al.’s (2020b) work by using a time-motion rather than a work-sampling approach. The term “disturbances of direct work” is used to describe the studied phenomenon.
Factors Contributing to Resource Inefficiencies in Construction
Waste in the construction industry has been extensively studied (see Table 1). Various forms of physical and nonphysical waste in different countries and lifecycle phases of a building (design, construction, maintenance) have been explored, although most studies have focused on the construction phase. Literature reviews, surveys, and interviews are frequently used to investigate the causes of waste. Table 1 compares the methods and scopes of studies of the factors impacting waste and presents the most common causes of waste identified in each. The most frequently cited causes are preconstruction activities, such as improper planning and scheduling, poor coordination and supervision, and poor communication. However, previous research does not connect waste types and causes at the activity level on the construction site.
| Reference | Collection method | Participants | Scope and focus | Location | Causes of wasted effort |
|---|---|---|---|---|---|
| Alarcón and Serpell (1996) | Survey | Unspecified | Unspecified | Unspecified | Lack of control, poor planning, late information, misuse of resources, poor distribution |
| Zhao and Chua (2003) | Interview and survey | Project managers, site managers, and supervisor | Unspecified, formwork | Singapore | Waiting due to crew interference and inspections, waiting for equipment and instructions, rework due to design changes, waiting due to stock problems, waiting due to material vendor delays |
| Horman and Kenley (2005) | Literature review | Unspecified | 26 studies, cross-disciplinary | Cross-country | Poor site management, poor plans and schedules, poor communication and coordination, client’s special needs leading to delays, rework |
| Khanh and Kim (2014) | Survey | Project managers, site managers, and team leaders Site engineers | 128 responses, unspecified | Vietnam | Lack of control, poor planning and scheduling, bureaucracy,delayed supervision, poor worker/equipment distribution |
| Emuze et al. (2014) | Survey | Clients, consultants, and contractors | 88 responses, unspecified | South Africa | Lack of required competencies, inadequate supervision, waiting due to unfinished tasks, non-conformance of materials to specification, waiting for materials |
| Kalsaas et al. (2014) | Survey | Installers | 149 responses, cross-disciplinary | Norway | Equipment missing or inappropriate, worksite not available because of other work, information missing or unclear, inaccessible worksite |
| Singh et al. (2017) | Survey | Contractors, consultants, suppliers, and designers | 46 responses, unspecified | India | Unnecessary work, rework, poor planning and coordination of resources, lack of proper supervision, poor communication among team members |
| Issa and Ibrahim (2018) | Survey | Owners, consultants, and contractors | 109 responses, unspecified | Saudi Arabia | Material waste due to poor design and execution, unavailability of qualified trade partners, poor coordination and supervision, poor scheduling, poor material and cost planning |
| Issa and Alqurashi (2020) | Interview and surveys | Consultants and contractors | Unspecified | Egypt and Saudi Arabia | Problems in client’s organization and project financing, contractor selection before consultant, unskilled workers and poor labor productivity, delay due to administrative approvals, scheduling errors |
| Bajjou and Chafi (2022) | Interview and surveys | Managers | 330 responses, unspecified | Morocco | Inefficient site management, improper planning, poor communication, rework and poor quality, human-related factors |
| Naji et al. (2022) | Survey | Owners, consultants, designers, and contractors | 167 responses, unspecified | Qatar | Quantity take-off error by contractor, unforeseen incidents, design errors, extreme weather conditions, lack of design information |
| Igwe et al. (2022) | Survey | Contractors and consultants | 127 responses, unspecified | Cross-country | Planning, construction method and communication, rework and poor quality, poor procurement, design and documentation, external factors |
| Bajjou and Chafi (2022) | Interview and Surveys | Managers | 330 responses, unspecified | Morocco | Material-related factors, subcontractors and workers, planning, communication and coordination, people involvement and financial issues, people development strategies, external factors |
| Koskela (2000) | Document study, observation, and interview | Installers, designers, and contractors | Unspecified, interior construction | Finland | Poor client decision-making, poor design management, poor supply chain management, poor site production management, poor production control |
| Formoso et al. (2017) | Document analysis, observation, and interview | Managers and supervisors | 345 observations, unspecified | Brazil | Workspace infrastructure, space, information, equipment and tools, components and materials |
| Kalsaas (2013) | Work sampling and survey | Installers | 4 participants, plumbing | Norway | Waiting time, rework due to mistakes, searching for tools, materials and advice, clearing inaccessible spaces |
| Demirkesen et al. (2022) | Time-motion | Installers | 2 installers, concrete work | US | Connecting work, unclear instructions, poor design documents, material logistics, and quality |
| Seppänen and Görsch (2022) | Time-motion and interview | Installers | 15 participants, MEP | Finland | Poor communication, poor production planning and control, poor material logistics, poor designs, amount of preparatory work |
Studies using manual and automated onsite observations of individual workers’ activities to identify causes of waste have found preconstruction activities to be among the most common causes. Missing materials and equipment are most frequently identified and can be considered direct causes of work stoppages and disturbances. Observation approaches can be used to distinguish waste events by project type, trade specifics, and task specifics. Seppänen and Görsch (2022) examined differences in the proportions of work activities in a time-motion study and proposed explanations and root causes by reviewing the extent of missing preconditions and differences in project types. However, their analysis was not statistical and did not investigate the direct connection between waste types and their causes or the influence of trade factors.
Previous research has focused on wasted efforts and reasons for them through survey and interview approaches from a management perspective and in observational studies from a process and worker perspective. Here, activities were not considered subsequently and associated with waste events and missing preconditions simultaneously in the form of disturbances of direct work. This study shifted the focus to such disturbances and their causes. This approach enables a deeper understanding of why and how value-adding work is disturbed and how the management of preconditions can enable workers to perform tasks smoothly and resource efficiently in construction.
Methodology
Research Approach and Case Description
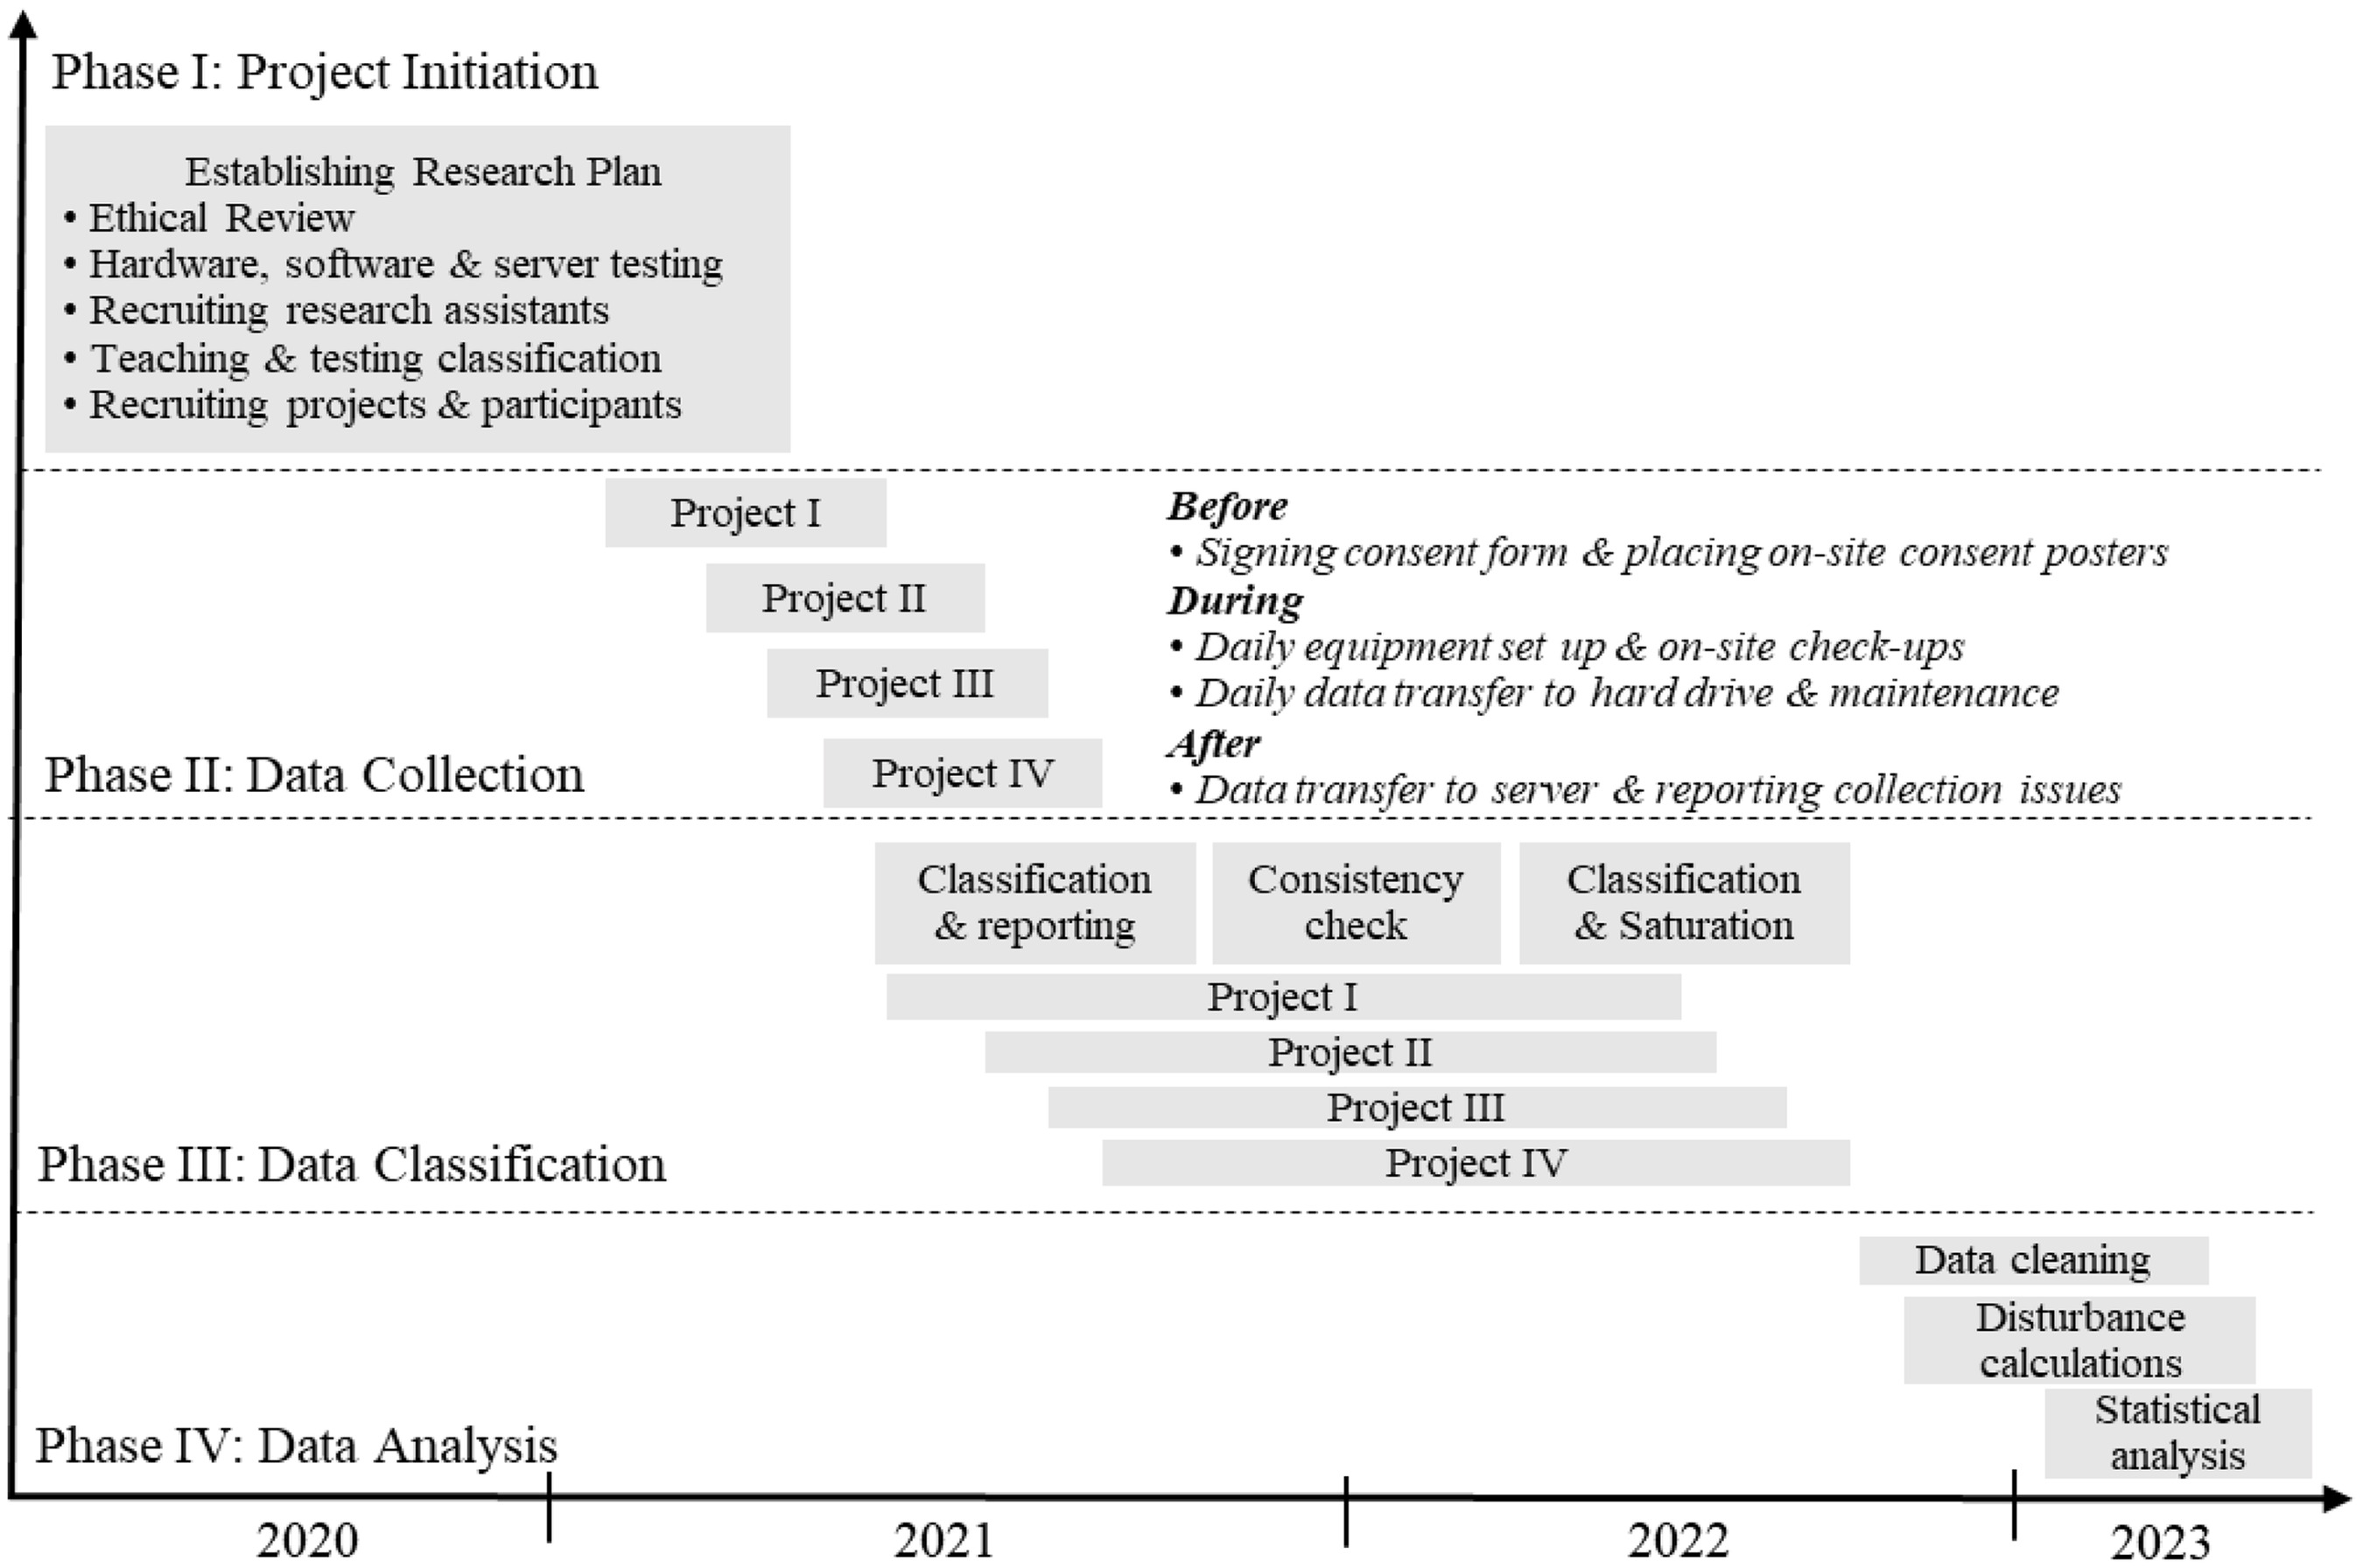
The study aims to improve the understanding of installation work disturbances to improve workers’ task performance and resource efficiency. The approach is to analyze a series of consecutive activities because reasons for disturbances are not apparent when observing individual tasks in isolation. Thus, installation work disturbances, related waste categories, and missing preconditions can be difficult to study with work-sampling approaches (Seppänen and Görsch 2022). Therefore, the study adopts an approach that makes it possible to uncover longer chains of events by conducting a time-motion study with cameras attached to worker safety helmets. Such a study can continuously track workers’ activities without direct onsite observation. The resulting video footage can be used to observe long chains of events (e.g., by stopping, reviewing, or adjusting the playback speed) to identify disturbances in direct work and to determine whether activities include wasted effort due to missing preconditions. Fig. 1 visualizes the research steps taken from initiating the project through data collection and classification to data analysis over more than three years.
Before the data were collected, the university’s ethics committee reviewed the research plan, and consultations were held with employee and employer organizations. Measures were taken to address the concerns of the unions and the ethics committee, including muting all audio tracks in the recordings and using anonymizing software to protect the personal data captured by the cameras, such as faces and license plates. It was agreed before data collection that only project- and trade-specific information of participants would be recorded and analyzed. No personal data (e.g., age, nationality, or company affiliation) were recorded. Neither raw video data nor any results traceable to individuals were given to the employers.
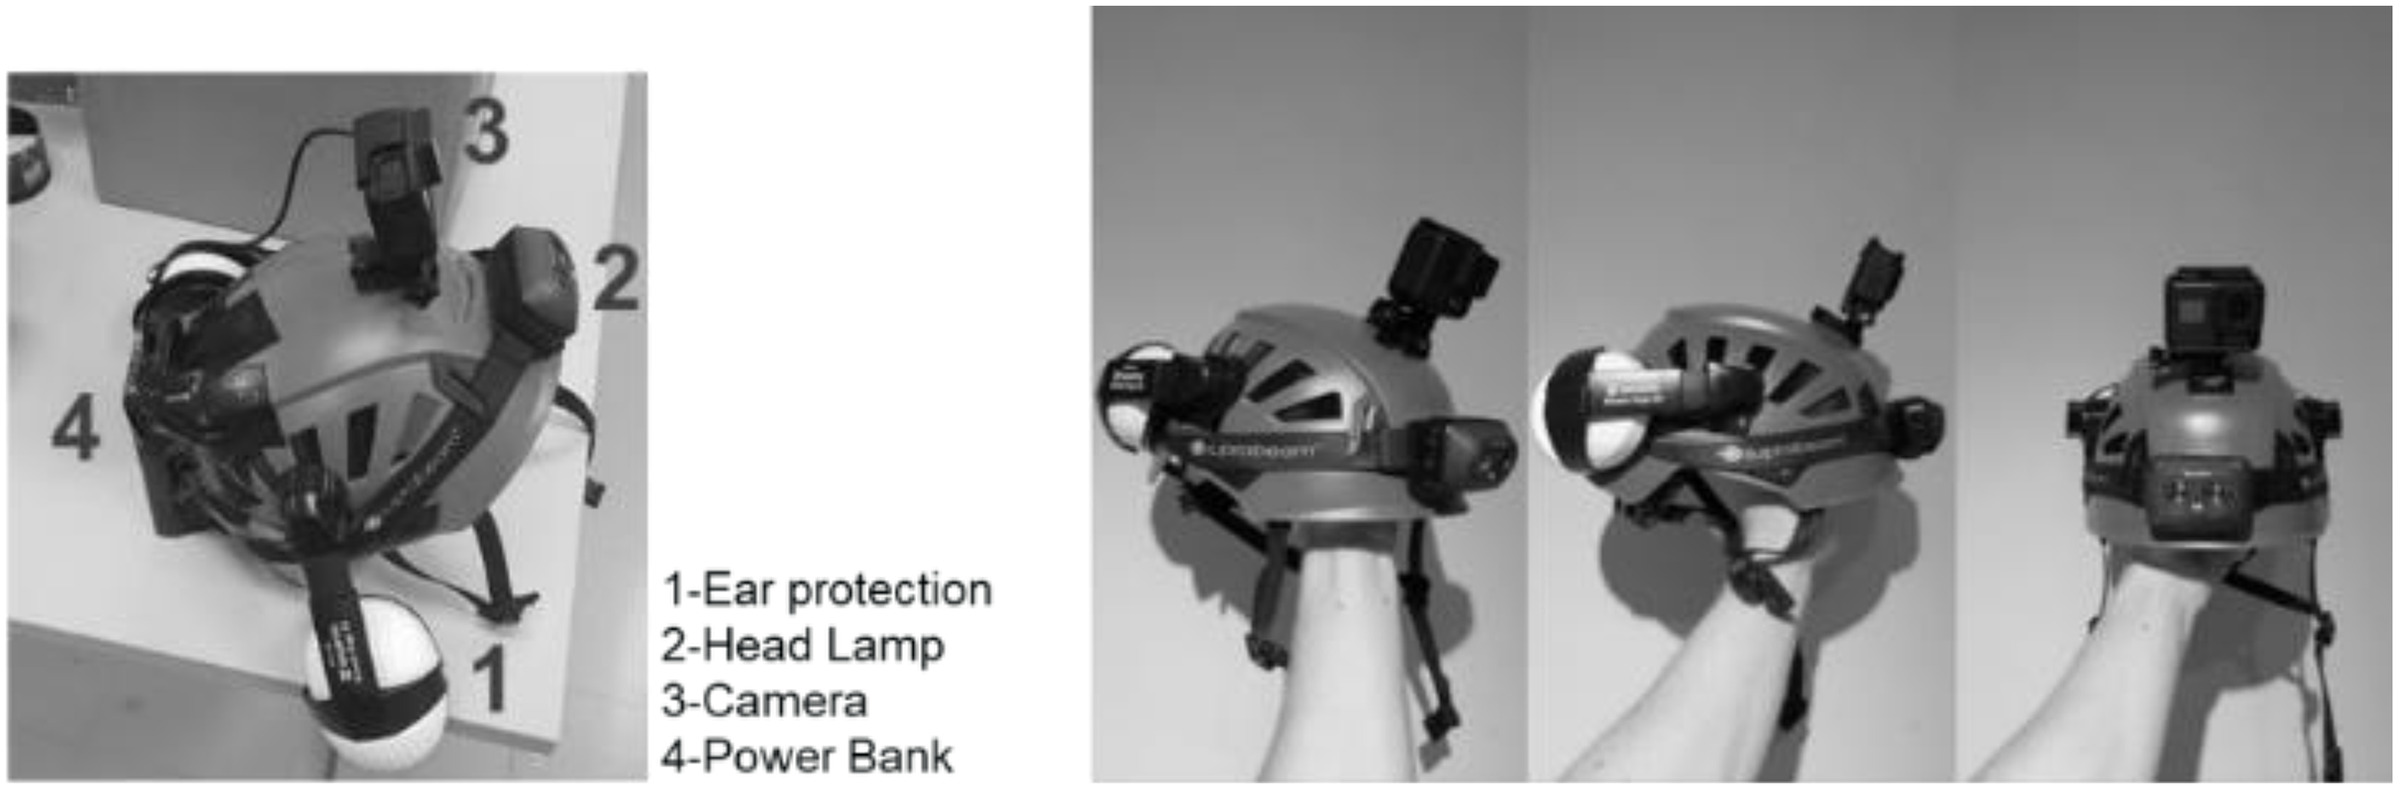
The video footage captures the participants’ work activities, covering an angle of approximately 180° in front of a worker’s face. Fig. 2 shows the setup of a helmet with a camera, power bank, and other safety equipment. Before data collection, five research assistants responsible for data collection and classification were recruited. They were taught the classification process that was then collaboratively tested and improved. A face-to-face introductory session was held with the assistants to explain the classification categories and process so they could reach a common understanding. Everyone had the opportunity to ask questions and discuss unclear distinctions between categories. All five assistants individually tested the classification approach with a dummy data set. They were asked to identify any unclear or confusing classification categories and process steps to ensure a better common understanding and eliminate overlaps between categories that had not been described and distinguished sufficiently.
The researchers intended to conduct time-motion studies on at least four construction projects, each with at least two MEP trades working on the jobsite at the same time. The COVID-19 pandemic limited the number of projects available for the study, and several originally selected projects could not be included due to COVID-19 exposure on the jobsite. Although unions supported the study and encouraged their members to participate, it was difficult to find consenting workers, primarily because of the additional COVID-19 exposure and the need to make up time delays. Many potential participants were skeptical of the research approach, collection of personal data, and potential additional burdens due to helmet cameras. Thus, an onsite presentation with the principal investigator was given to potentially interested parties per project. Participants were able to understand in detail the research approach and use of the data and to ask questions, leading to the recruitment of at least three participants from two trades per project. Initial skepticism turned to support through the onsite presentation and ongoing onsite discussion with the research assistants as the data collection progressed.
Data Collection, Classification, and Analysis
Data were collected from March to May 2021. In total, the activities of five workdays of 14 construction workers from four construction projects were filmed. Table 2 shows the main aspects of the studied projects.
| Parameter | Multifamily building 1 | Multifamily building 2 | Hotel and office | Shopping mall |
|---|---|---|---|---|
| Buildings | 2 | 1 | 2 | 1 |
| Floors | 6 | 6 | 10 | 7 |
| Location | Urban residential area | Urban residential area | Industrial area | Residential area |
| Size () | 7,023 | 4,023 | 22,000 | 135,000 |
| Site layout | • In/outside storage areas | • Outside storage areas | • In/outside storage areas | • In/outside storage areas |
| • Floor-level work zones | • Floor-level work zones | • Floor-level work zones | • Detailed work zones | |
| • No elevators | • Permanent elevators | • Temporary elevators | • Permanent elevators | |
| • Limited access points and roads | • Medium access points and roads | • Medium access points and roads | • Wide access points and roads | |
| • Small-scale floor layout | • Small-scale floor layout | • Medium, open floor layout | • Large-scale floor layout | |
| • Tight corridors and stairs | • Tight corridors and stairs | • Wide spaces and tight stairs | • Wide corridors and stairs | |
| Lean approach | No | No | No | Yes |
| Schedules | Gantt charts (management) + weekly assignments (trade partner) | Flowline schedules (management) + Gantt charts (trade partner) | Gantt charts (management) + weekly assignments (trade partner) | Takt schedules |
| Repeatability | High | High | High | Low |
| Complexity | Medium | Low | Medium | High |
| Special notes | — | Design changes, modular bathrooms | Major COVID-19 schedule delays | Minor COVID-19 schedule delays |
Video data were collected via helmet cameras, with research assistants setting up the cameras every morning and checking the setup twice during each workday. Due to technical problems (e.g., the power bank was unconnected, and the recording switched from movie to picture mode) and fluctuations in working hours, fewer data were collected than the theoretical maximum of eight hours of video material per working day per worker. Moreover, participants were told to turn off the camera during breaks to reduce the amount of personal data recorded. Overall, 408:07:03 h of video footage was collected (see Table 3).
| Parameter | Multifamily building 1 | Multifamily building 2 | Hotel and office | Shopping mall | Total |
|---|---|---|---|---|---|
| Collected data (h) | 93:18:47 | 105:37:16 | 98:04:51 | 111:06:09 | 408:07:03 |
| Classified data (h) | 40:37:58 | 43:24:50 | 40:25:29 | 51:09:15 | 175:37:42 |
| Excluded data (h) | 1:55:28 | 6:23:52 | 4:16:43 | 6:43:12 | 19:19:15 |
| Analyzed data (h) | 38:42:30 | 37:00:58 | 36:08:46 | 44:26:03 | 156:16:35 |
| Participants and analyzed tasks | 2 Electricians: | 1 Electrician: | 2 Electricians: | 2 Electricians: | 14 workers with varying tasks |
| • Socket and wire installation | • Horizontal and vertical cabling | • Cabling in stairwell | • Cable tray and socket installation | ||
| • Cable installation | • Drywall installation | • Wiring for floor heating | 2 Plumbers: | ||
| 1 Heating ventilation air conditioning (HVAC) specialist: | 2 Plumbers: | 2 Plumbers: | • Climate beam installation | ||
| • Horizontal ventilation duct installation | • Heating system installation | • Water supply and drainage installation | |||
| • Fresh water supply installation | • Arc welding | ||||
| • Vertical gravity pipe installation | |||||
| • Task and supply coordination | |||||
| Analyzed activities | 2,965 | 2,430 | 1,792 | 2,388 | 9,564 |
The recorded video footage was subjected to manual categorization in spreadsheets (Microsoft Excel). This involved a thorough categorization of worker activities, waste events, and missing preconditions based on predefined categories. Waste categories are Ohno’s (1988) original seven categories, augmented with unutilized talent (Ansah et al. 2016) and making do (Koskela 2004). Preconditions are those of Koskela (2000) and Bertelsen et al. (2006). Activity categories were developed based on prior literature and work-sampling studies utilizing direct observations (Kalsaas 2010; Neve et al. 2020b). In a master thesis project completed before this study, a smaller time-motion study was conducted (Pasila 2019), and the categories were employed, evaluated, and tested.
The ability to pause, rewind, and review video footage facilitated a more precise categorization of work than in previous studies, leading to category expansion (see Fig. 3). The extension of the categories included, for example, hauling activities being distinguished depending on the distance from the installation area (work ; short-distance hauling between 5 and 30 m; and long-distance ). This extended set underwent validation in the research project’s steering group meetings including Finnish MEP employer associations and companies, ensuring alignment with the study’s scope and interests.

As voices were not recorded, any verbal interaction was categorized as “Discussion.” Furthermore, as workers often performed more than one activity at a time (e.g., discussion and installation), the duration of these activities was divided into equal parts. Watching the footage allowed the researchers not only to classify activities but also to determine if any were impacted by a missing precondition and contained waste types (see Fig. 3). All types of activities, waste, and preconditions are described in detail in the Appendix.
Despite prior teaching and training, the research assistants classified some data differently. Rather than going through all the videos again, a spot-check analysis (consistency check) was conducted to check samples of activity categories, their description, and associated waste and precondition categories across the different classifiers, projects, and trades. Subsets of data were randomly selected, and categories were manually examined for inconsistencies, errors, or discrepancies between the data points. To ensure the reliability of the findings, the process was repeated with different random samples and then aligned with the description of each category (see Appendix) to ensure a consistent data sample. After the research assistants’ budgeted project hours for classification were used up and the consistency check was performed, the main researcher classified the remaining video material until data saturation was reached (see Fig. 4).
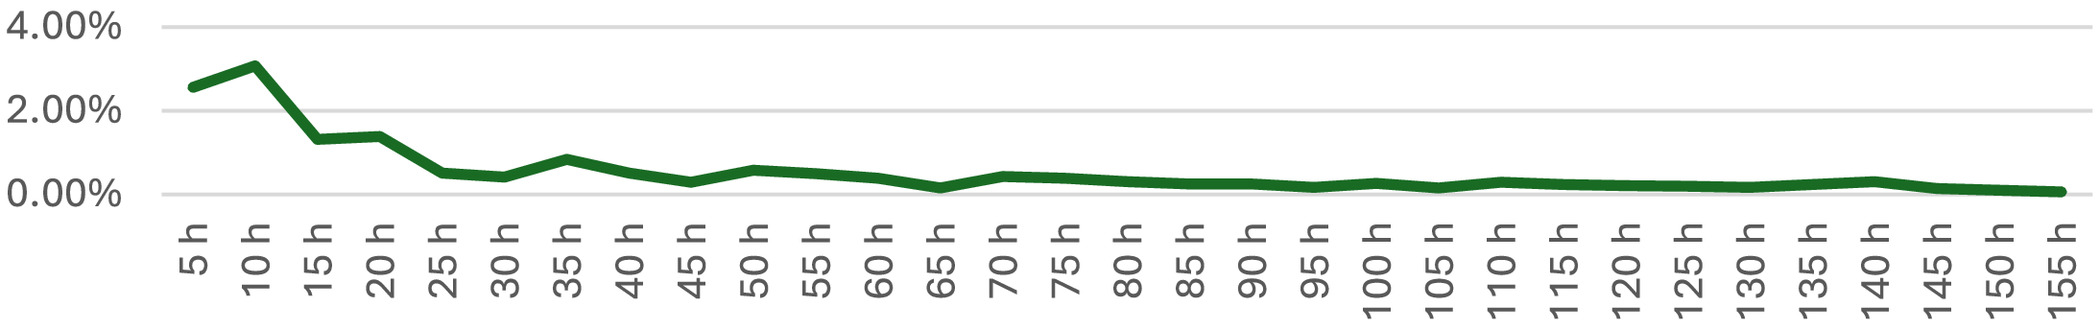
The process of data classification required more resources than originally planned. Therefore, due to budget constraints, not all collected data could be classified. After discussions within the project consortium and based on insights from previous research studies, two criteria were established to decide when data classification would be considered sufficient without compromising findings. First, it was decided that the study had to reach a 95% confidence interval, as recommended by Thompson (1987) for sampling studies. The classified data contain at least 1792 activities (data points) per project and at least 372 activities per participant. This is consistent with the number of data points necessary to achieve 95% confidence in a sampling study. Second, following Neve et al. (2020b), the validity of the data samples was tested using a stabilization curve that represents the standard deviation of the proportion of classified activities between accumulated data sets of 5 h. The more data collected, the smaller the deviation (the more stable the shares of categories become). Fig. 4 shows the standard deviation of activity shares between the samples.
With 150 h of video classified, a reduction in the standard deviation of more than 95% was observed compared to 5-h and 10-h samples. These results were considered to indicate sufficiently analyzed data such that additional sets of 5-h samples would not have a significant effect on the standard deviation and shares of activities, explaining the difference between the collected and classified data (see Table 3).
After the classification and before the analysis, the data were cleaned to exclude breaks and research-project-related activities (checking helmets, discussions with researchers) and scenes in which no clear activity was evident (e.g., overhead work when the footage shows only the ceiling). In the analysis phase, the activities were divided into electrical and plumbing/heating ventilation air conditioning (HVAC) work. Plumbers and HVAC installers have similar duties in terms of work patterns, size of components, and preparation needs, as both trades focus on preparing and installing conduit systems. Moreover, they require similar mechanical skills to understand how pipes, ducts, valves, and other components work. Because of the similarities between these two trades and the fact that the study collected data from one HVAC installer and six plumbers, it was decided to distinguish the two professions together from electrical work.
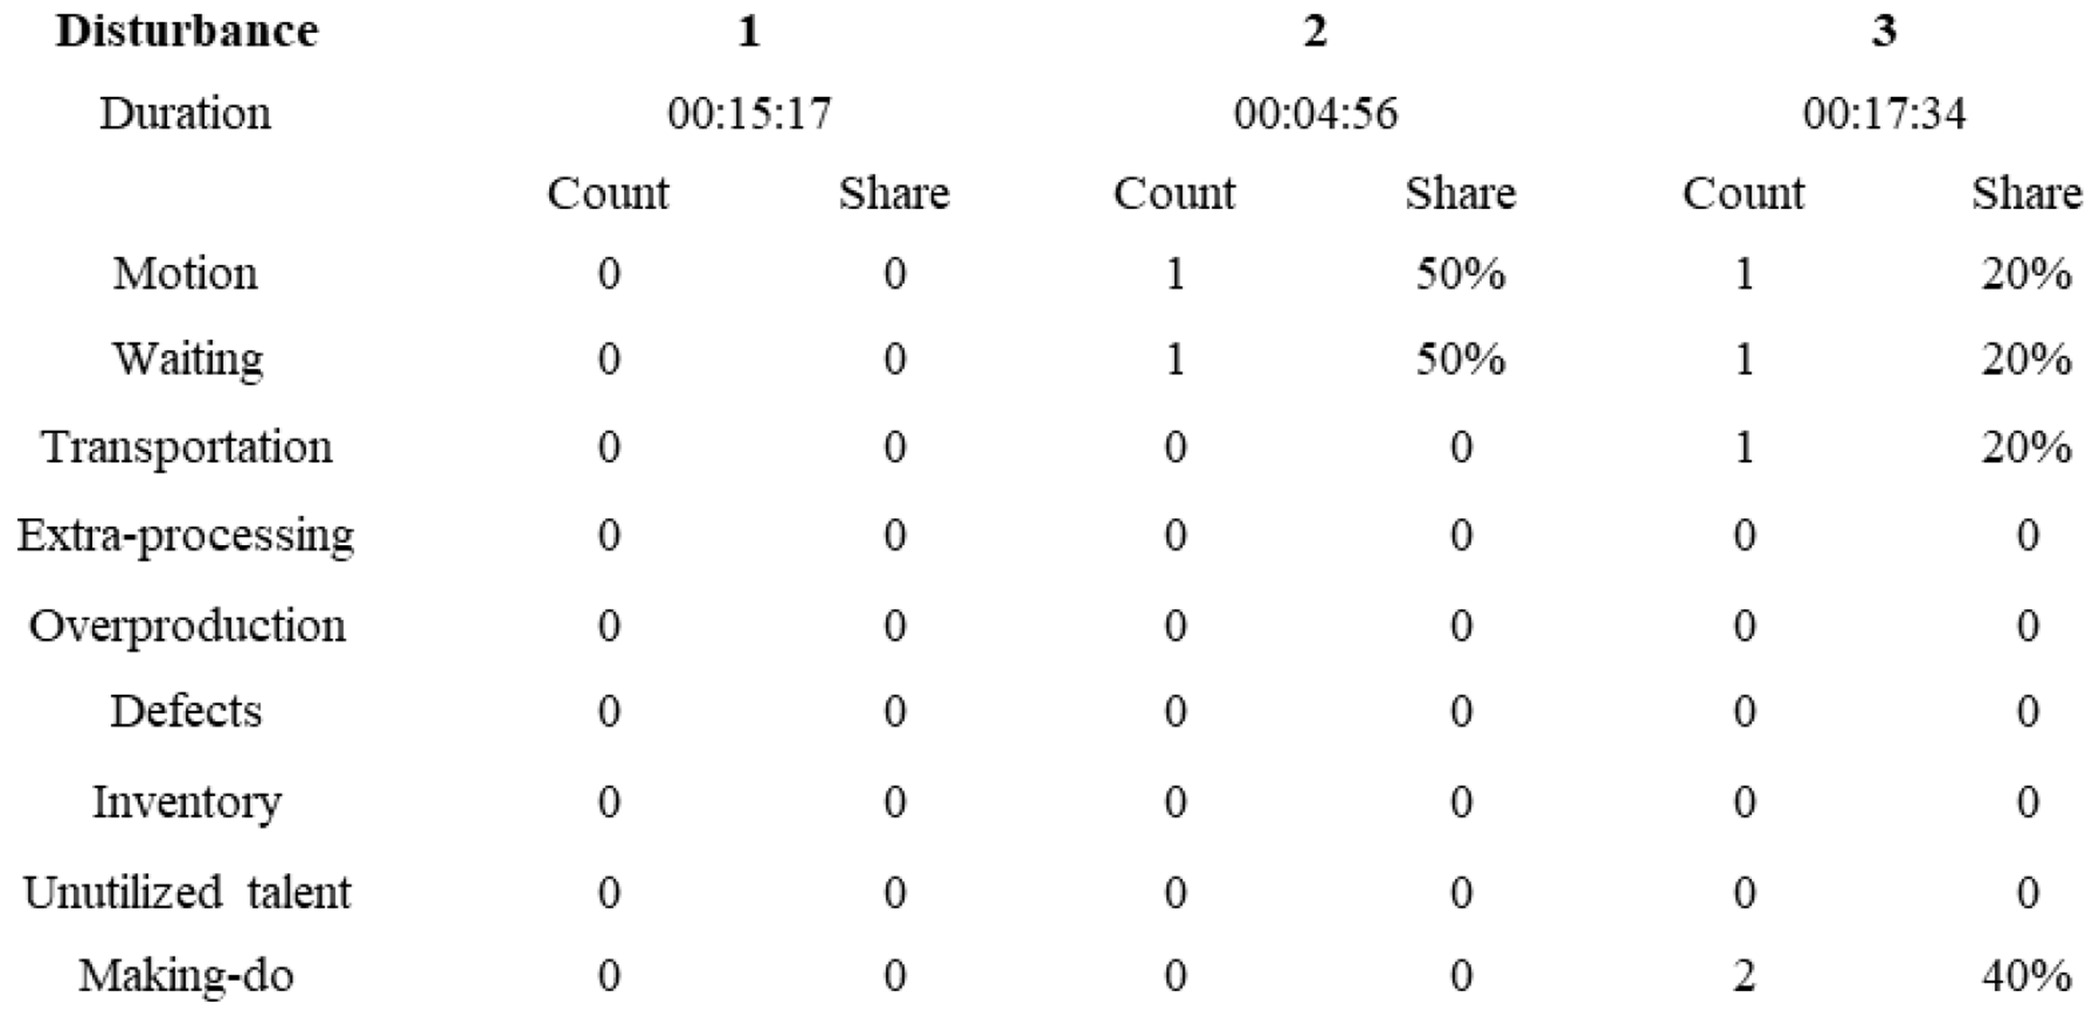
The data analysis included the calculation of direct work disturbances, the share of resource inefficiencies (waste types), and missing preconditions per disturbance. Fig. 5 shows a sample of the classified data: each row represents an activity with its duration and whether waste and missing preconditions occurred within it. The duration of a direct work disturbance (i.e., a set of activities between two direct work activities) is calculated by the sum of durations of individual activities within the disturbance (e.g., the sum of activity durations in rows 4, 5, 6, 7, and 8 to calculate the duration of the second disturbance, which is 4 min 56 s).
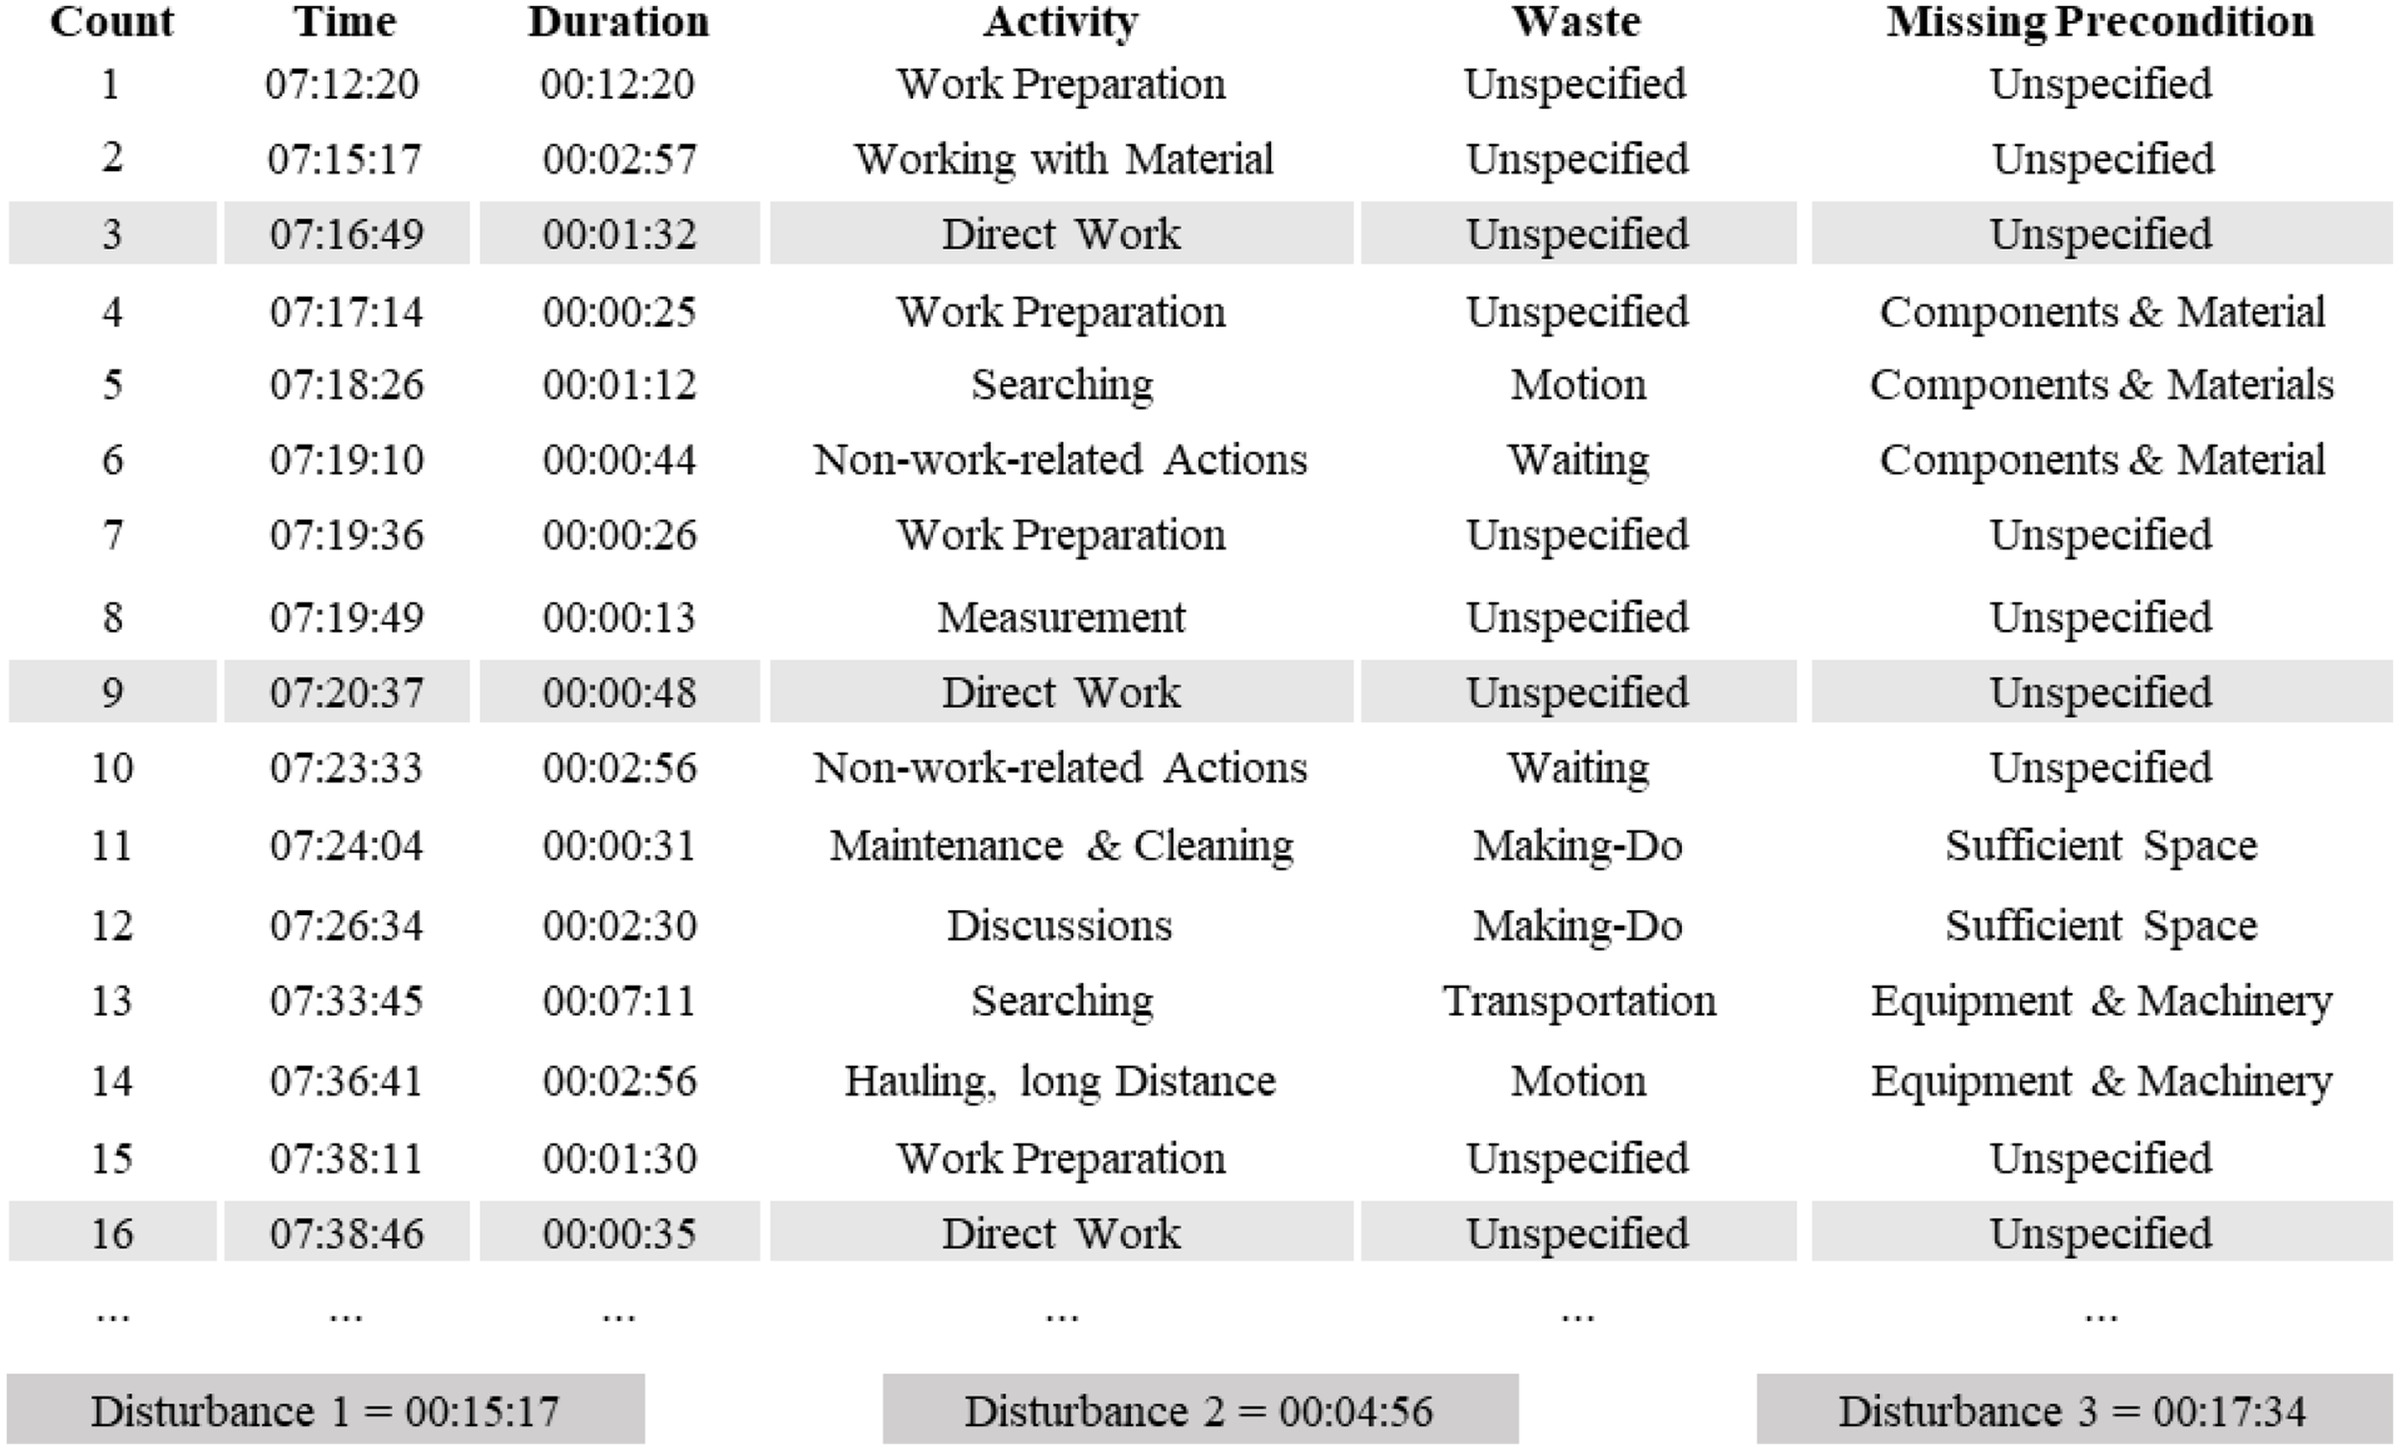
As well as tracking activities and their duration, it was determined whether nonvalue-adding work occurred together with waste or missing preconditions (“Waste” and “Missing Preconditions” columns in Fig. 5).
The duration of waste and any missing preconditions are difficult to measure accurately because only parts of an activity can be wasteful, and it is often impossible to determine through video observation alone which parts of the activity duration were affected. For example, in line 4 (Fig. 5), components and materials were missing while work preparation was in progress. However, only parts of the work preparation may have involved materials. In fact, the observer can only detect the wasteful impact of missing materials by looking at activities 5 (searching) and 6 (nonwork-related activities). To analyze waste and missing preconditions, it was decided to count activities affected by forms of waste and missing preconditions instead of attempting to calculate durations of waste. Disturbance durations and numbers of activities affected by wasted and missing preconditions were recorded numerically and as a percentage per disturbance (see Fig. 6).
To show the frequency and duration of direct disturbances of MEP work and reveal associations between resource inefficiencies and prolonged durations of direct work disturbances and the factors contributing to them, the data were analyzed statistically in three steps. Following a descriptive analysis of activities, wasteful instances, instances with missing preconditions, and disturbances, a two-step cluster analysis grouped disturbances based on their duration and the proportion of waste types within them. Cluster analysis is frequently employed to extract insights into associations in a sample (Jang et al. 2020), and various clustering methods were considered before two-stage cluster analysis was chosen for advantages over hierarchical (Balderjahn et al. 2018) and K-means (Sarti et al. 2018) clustering methods thanks to its use of a statistical goodness-of-fit measure. This measure determines the number of clusters based on algorithms, eliminating the need for subjective decisions (Jang et al. 2020). The two-step cluster analysis comprised 10 factors (duration and proportion of nine waste types per disturbance) to examine structural similarities within durations of disturbances. In the final step, the impact of missing preconditions on waste types was assessed using general linear model multivariate analysis. The nine waste categories were set as dependent variables, while the nine categories of missing preconditions acted as independent variables to determine how often waste occurred when the preconditions were missing. All tests were performed using IBM SPSS Statistics version 28.
Results
Descriptive Results–Activity, Waste, and Missing Preconditions
The classification of 28 workdays of 14 workers based on the 16 categories (see Table 3; for details, see Appendix) resulted in 9,575 analyzed activities. Table 4 shows the total time and the share of each activity type in the total time. The results are presented for the overall sample and separately for different trades. Counts and average durations of classified activities were also calculated. The most frequently occurring activities were direct work and activities that facilitate direct work, namely, work preparation and working with materials. Discussion and nonwork-related activities (such as waiting) had the highest frequency of all nonvalue-adding categories. These mentioned categories accounted for 70.4% of all time in the sample.
| Activities | Time (h) | Share of time (%) | Counts | Average durations (min) | ||||||||
|---|---|---|---|---|---|---|---|---|---|---|---|---|
| Overall | Electrician | Plumber/HVAC | Overall | Electrician | Plumber/HVAC | Overall | Electrician | Plumber/HVAC | Overall | Electrician | Plumber/HVAC | |
| Direct work | 29:35 | 19:17 | 10:17 | 18.9 | 24.0 | 13.6 | 1,735 | 1,179 | 556 | 01:01 | 00:59 | 01:07 |
| Inspection | 5:12 | 2:52 | 2:20 | 3.3 | 3.6 | 3.1 | 371 | 193 | 178 | 00:51 | 00:54 | 00:47 |
| Work preparation | 27:17 | 14:51 | 12:26 | 17.5 | 18.5 | 16.4 | 2,209 | 1,270 | 939 | 00:44 | 00:42 | 00:48 |
| Working with material | 21:15 | 12:37 | 8:37 | 13.6 | 15.7 | 11.4 | 1,267 | 843 | 424 | 01:00 | 00:54 | 01:13 |
| Long-distance hauling | 8:04 | 2:37 | 5:26 | 5.2 | 3.3 | 7.2 | 274 | 87 | 187 | 01:46 | 01:49 | 01:45 |
| Short-distance hauling | 6:40 | 3:48 | 2:52 | 4.3 | 4.7 | 3.8 | 503 | 303 | 200 | 00:48 | 00:45 | 00:52 |
| Measurement | 4:52 | 1:53 | 2:59 | 3.1 | 2.4 | 3.9 | 491 | 183 | 308 | 00:36 | 00:37 | 00:35 |
| Maintenance and cleaning | 5:21 | 3:24 | 1:56 | 3.4 | 4.2 | 2.6 | 344 | 230 | 114 | 00:56 | 00:53 | 01:02 |
| Non-work-related actions | 15:48 | 7:43 | 8:04 | 10.1 | 9.6 | 10.7 | 657 | 312 | 345 | 01:27 | 01:29 | 01:24 |
| Searching | 6:18 | 1:36 | 4:42 | 4.0 | 2.0 | 6.2 | 265 | 64 | 201 | 01:26 | 01:31 | 01:24 |
| Rework | 3:05 | 1:26 | 1:39 | 2.0 | 1.8 | 2.2 | 169 | 96 | 73 | 01:06 | 00:54 | 01:22 |
| Movement | 6:33 | 2:18 | 4:14 | 4.2 | 2.9 | 5.6 | 481 | 226 | 255 | 00:49 | 00:37 | 01:00 |
| Discussion | 16:09 | 6:01 | 10:07 | 10.3 | 7.5 | 13.4 | 798 | 324 | 474 | 01:13 | 01:07 | 01:17 |
| Total | 156:16 | 80:30 | 75:46 | 100 | 100 | 100 | 9,564 | 5,310 | 4,254 | 01:03 | 00:55 | 01:04 |
On average, direct work accounted for 18.9% of work time. Electricians had a remarkably higher share of direct work (24.0%) than plumbing/HVAC installers (13.6%). The same pattern in proportions of direct work between electricians and plumbing/HVAC installers was observed in all four projects (the project breakdown is not shown in the table due to space limitations). Electricians showed higher shares of direct work-facilitating activities: work preparation, working with material, and short-distance hauling. Plumbing/HVAC trades engaged more often in searching, discussing, hauling (long-distance), measurement, and movement activities than electrical trades. Qualitative observations of the video footage showed that electricians were more likely to be involved in arranging and preparing cables in the immediate vicinity of the installation area, while plumbers/HVAC workers were more likely to organize work within a wider radius, including hauling materials and equipment from further away and reviewing and discussing plans while on the move. The mean activity duration was 63 s, demonstrating a highly fragmented workflow. Electricians’ average duration per activity was lower than that of plumbing/HVAC installers, indicating a higher change rate of activities in electrical work.
Table 5 shows the total count and proportion of waste events and missing preconditions. The shares are calculated separately for waste events and missing preconditions. Waste events and preconditions were included in the analysis when an activity contained wasteful elements or was carried out despite or because of missing preconditions. The most common waste events were motion, waiting, defects, and transportation. Differences in motion differentiate the trades, with plumbing/HVAC workers suffering more than electricians. Waste due to waiting was also higher in plumbing/HVAC work. In contrast, electrical work showed higher shares of making do, transportation, and defect waste events. Other types (e.g., extra processing, unutilized talent, and, in particular, overproduction) were detected much less frequently, as they were difficult to observe in the footage. Interestingly, some direct work observed in the video was wasteful because an electrician performed an installation task that was not part of his duties.
| Waste | Counts | Shares (%) | ||||
|---|---|---|---|---|---|---|
| Overall | Electrician | Plumber/HVAC | Overall | Electrician | Plumber/HVAC | |
| Motion | 794 | 290 | 504 | 52.5 | 45.4 | 57.8 |
| Waiting | 232 | 84 | 148 | 15.4 | 13.1 | 17.0 |
| Defects | 158 | 85 | 73 | 10.5 | 13.3 | 8.4 |
| Transportation | 131 | 79 | 52 | 8.7 | 12.4 | 6.0 |
| Making do | 67 | 62 | 5 | 4.4 | 9.7 | 0.6 |
| Inventory | 58 | 22 | 36 | 3.8 | 3.4 | 4.1 |
| Extra processing | 40 | 8 | 32 | 2.6 | 1.3 | 3.7 |
| Unutilized talent | 27 | 7 | 20 | 1.8 | 1.1 | 2.3 |
| Overproduction | 4 | 2 | 2 | 0.3 | 0.3 | 0.2 |
| Total | 1,511 | 639 | 872 | 100.0 | 100.0 | 100.0 |
| Missing preconditions | ||||||
| Components and materials | 473 | 165 | 308 | 35.8 | 28.7 | 41.3 |
| Equipment and machinery | 264 | 98 | 166 | 20.0 | 17.1 | 22.3 |
| Connecting work | 257 | 151 | 106 | 19.5 | 26.3 | 14.2 |
| Sufficient space | 82 | 53 | 29 | 6.2 | 9.2 | 3.9 |
| Workers | 78 | 44 | 34 | 5.9 | 7.7 | 4.6 |
| Working conditions | 70 | 40 | 30 | 5.3 | 7.0 | 4.0 |
| Building design and specifications | 44 | 17 | 27 | 3.3 | 3.0 | 3.6 |
| Directives | 27 | 6 | 21 | 2.0 | 1.0 | 2.8 |
| External conditions | 25 | 0 | 25 | 1.9 | 0.0 | 3.4 |
| Total | 1,320 | 574 | 746 | 100.0 | 100.0 | 100.0 |
Components and materials, equipment and machinery, and connecting work were the preconditions most often missing. Plumbing/HVAC work suffered more from missing components and materials, equipment, and machinery. Electrical work more often lacked sufficient space and previous or connecting activities meeting requirements (connecting work). Building design and specifications, directives, and external conditions were identified much less frequently than other missing preconditions.
Disturbances–Descriptive Results and Cluster Analysis
In total, 1,771 disturbances were classified and analyzed. Table 6 shows the descriptive results. Of these events, 1,196 were related to electrical work, and 575 were related to plumbing and HVAC work. Electricians had, on average, 85 disturbances per day, roughly double that of the plumbers/HVAC (an average of 41 per day). The total time of all disturbances per trade was about the same, though disturbances of plumbing/HVAC work were, on average, twice as long as in electrical work.
| Disturbances | Electrician | Plumber/HVAC | Total |
|---|---|---|---|
| Total count | 1,196 | 575 | 1,771 |
| Total time disturbance | 63:16:54 | 63:25:05 | 126:41:59 |
| Average | 0:03:10 | 0:06:37 | 0:04:18 |
| Max | 2:36:46 | 2:48:44 | 2:48:44 |
| Min | 0:00:10 | 0:00:10 | 0:00:10 |
| Standard deviation | 0:08:06 | 0:15:59 | 0:11:23 |
To analyze associations between resource inefficiencies and durations of direct work disturbances, a two-stage cluster analysis with 10 factors (proportions of nine waste types and duration of disturbances) was performed. The two-step cluster analysis resulted in a three-cluster solution, where the factors of motion and transportation and the duration of disturbances most impacted the cluster segmentation. Medium-impact factors were making do, waiting, defects, and inventory, while extra processing, unutilized talent, and overproduction had low impacts. The overall quality of a cluster solution was evaluated using the silhouette measure, assessing how well individual data points can be distinguished between clusters. It ranges from to 1: means that individual data points are likely to be clustered incorrectly, and 1 means that the data points are well arranged within their cluster. A silhouette value greater than zero is considered an indicator that a cluster solution is valid; thus, the value of 0.8 for the two-step cluster analysis in SPSS is reasonable to a strong indication of validity (Van Den Berge et al. 2017; Norusis 2011).
Table 7 shows the counts and total time of the clusters of disturbances. In cluster 1, 72.8% of all disturbances accounted for 25.9% of the time, representing many short-term disturbances with a mean duration of 1:31 min. In cluster 2, 20.3% of the disturbances accounted for 41.6% of the time, resulting in a medium-length mean duration of 8:46 min. Cluster 3 included just 6.9% of disturbances but accounted for 32.5% of the time, resulting in the longest mean duration of 20:15 min.
| Parameter | Sub-parameter | Short-term cluster | Medium-term cluster | Long-term cluster |
|---|---|---|---|---|
| Counts (total) | — | 1,289 | 360 | 122 |
| Counts (in %) | — | 72.8% | 20.3% | 6.9% |
| Total time (total) | — | 32:50:16 | 52:40:01 | 41:11:42 |
| Total time (in %) | — | 25.9% | 41.6% | 32.5% |
| Mean duration | — | 00:01:31 | 00:08:46 | 00:20:15 |
| 95% confidence level for mean duration | Lower bound | 00:01:25 | 00:07:41 | 00:14:15 |
| Upper bound | 00:01:39 | 00:09:52 | 00:26:16 | |
| Waste type included (in %) | — | — | — | — |
| Motion | 0% | 62% | 19% | |
| Transportation | 0% | 1% | 31% | |
| Waiting | 0% | 18% | 6% | |
| Defects | 0% | 19% | 3% | |
| Making do | 0% | 0% | 17% | |
| Inventory | 0% | 0% | 10% | |
| Extra processing | 0% | 0% | 8% | |
| Unutilized talent | 0% | 0% | 5% | |
| Overproduction | 0% | 0% | 1% |
As the average duration for the distinction of the clusters is crucial, clusters are labeled short-term (1), medium-term (2), and long-term (3) disturbances. Short-term disturbances do not include any wasteful activities. Medium-term disturbances contain the highest proportion of motion among the clusters and an increased proportion of waiting and defect incidents. Long-term disturbances include the highest proportion of transportation waste and show an increased proportion of motion, making do, and inventory waste.
Qualitative observations from video footage indicate that plumbing/HVAC workers occupied different areas and rooms to carry out their tasks. Due to larger sizes and lengths of components in plumbing/HVAC work, installers were often constrained by limited space. They prepared components and carried out direct work in other locations and then hauled them to the installation area when needed. Hauling over long distances and from further away seems to be related to higher shares of searching, moving, nonwork-related activities, and discussions in plumbing/HVAC work (see Table 4). All clusters showed a low or nonexistent share of extra processing, unutilized talent, and overproduction, as very few instances of these types were observed in the data set (see Table 7).
Cluster differences per trade were compared using Pearson’s chi-squared tests by the time of their occurrence (morning, noon, afternoon), project, and the proportion of activities they included (see Table 8). Short-term disturbances occurred most throughout the working day in all projects. Their proportions were always higher in electrical work except in multifamily building 2, where more long-term disturbances occurred for electricians. In both trades, the proportions of short-term disturbances were highest in the noon hours and higher in supervisors’ work than in that of installers.
| Profession | Electrician | Total | Plumber/HVAC | Total | ||||
|---|---|---|---|---|---|---|---|---|
| Disturbances | Short-term | Medium-term | Long-term | Short-term | Medium-term | Long-term | ||
| Daytime | ||||||||
| Morning (7–10 a.m.)** | 74.4 | 18.5 | 7.1 | 100 | 61.4 | 30.4 | 8.2 | 100 |
| Noon (10 a.m.–1 p.m.) | 79.2 | 16.7 | 4.1 | 100 | 70.0 | 25.2 | 4.8 | 100 |
| Afternoon (1 p.m.–end of day)** | 75.5 | 14.9 | 9.6 | 100 | 65.2 | 28.3 | 6.5 | 100 |
| Project | ||||||||
| Multifamily building 1 | 78.8 | 18.5 | 2.7 | 100 | 76.5 | 22.3 | 1.2 | 100 |
| Multifamily building 2*** | 66.3 | 14.6 | 19.1 | 100 | 67.5 | 27.3 | 5.2 | 100 |
| Hotel and office** | 73.5 | 22.6 | 3.9 | 100 | 53.7 | 40.2 | 6.1 | 100 |
| Shopping mall*** | 79.6 | 12.1 | 8.3 | 100 | 49.4 | 28.9 | 21.7 | 100 |
| Role | ||||||||
| Supervisor | 77.7 | 19.6 | 2.7 | 100 | 70.4 | 27.2 | 2.4 | 100 |
| Installer*** | 75.7 | 15.8 | 8.5 | 100 | 60.8 | 28.4 | 10.8 | 100 |
Note: Two-sided statistically significant findings are marked with * if ; ** if , and *** if .
Plumbing/HVAC work saw more medium-term disturbances, indicating that more setup time was needed to perform direct work. Both trades showed a peak of medium disturbances in the morning, representing long starting times before performance increased. Plumbing/HVAC work in the hotel and office project saw the highest shares of medium-term disturbances and lowest of short-term disturbances, reflecting its lowest share of direct work across all projects. The trend for plumbing/HVAC work to have higher shares of medium-term disturbances than electrical work is also present when differentiating between roles.
Long-term disturbances reached their lowest value during noon hours while short-term disturbances without waste shares reached their highest level, which could indicate performance peaks. During afternoon hours, long-term disturbances peaked in electrical work, which could mean more wrap-up times (hauling, long-distance) at the end of the workday. The proportions of long-term disturbances of plumbing/HVAC work remained similar in the noon and afternoon hours.
Supervisors tended to experience more short-term disturbances, while installers encountered a greater number of long-term disturbances. The pattern is different for medium-term disturbances, where electrical supervisors displayed more instances compared to installers. However, plumber/HVAC supervisors exhibited slightly fewer medium-term disturbances than their installer counterparts. These differences may stem from variations in experience and task assignments. For instance, workers often handle tasks like searching and hauling, which are associated with high levels of transportation, motion, and inventory waste. These waste types are particularly high in long-term disturbances.
Table 8 also shows statistically significant differences between trades in morning and afternoon hours in the multifamily building 2, hotel and office, and shopping mall projects. Projects had special characteristics that can explain some of the differences. Multifamily building 2 had design issues related to modular bathrooms that can be seen as causing a higher share of long-term disturbances for electricians. The hotel and office project had schedule delays caused by COVID-19, increasing medium-term disturbances. The shopping mall was the largest project with the widest site layout causing considerable long-distance transportation for the plumber/HVAC trade. One trend seen across all factors was the distribution of short-, medium-, and long-term disturbances, following the pattern of trades. Electricians showed higher shares of short-term disturbances and lower shares of medium-term ones than plumbing/HVAC workers in almost all incidents. There were smaller differences among the trades in long-term disturbances.
Impact of Missing Preconditions on Waste
The number of missing preconditions was calculated within the three clusters detected (see Table 9). The largest differences between short-term and longer-term clusters were related to components and materials and connecting work. This shows the importance of logistics and production control for minimizing longer, wasteful disturbances. The same categories also sometimes occur in short-term disturbances, but most missing preconditions in short-term disturbances were related to working conditions.
| Missing precondition | Short-term | Medium-term | Long-term |
|---|---|---|---|
| Total count | 54 | 725 | 514 |
| Building design and specifications | 0% | 2% | 5% |
| Directives | 0% | 2% | 2% |
| Components and materials | 19% | 42% | 31% |
| Workers | 0% | 5% | 8% |
| Equipment and machinery | 15% | 20% | 21% |
| Sufficient space | 13% | 3% | 11% |
| Connecting work | 2% | 21% | 16% |
| External conditions | 0% | 2% | 2% |
| Working conditions | 52% | 2% | 5% |
To determine whether the number of missing preconditions (independent variables) and covariates affected the occurrences of waste types (dependent variables) within disturbances, a general linear model (GLM) multivariate analysis was conducted (Minooei et al. 2020; Naji et al. 2022). The categorical variables project type, role, profession, and daytime were set as covariates. Table 10 shows the significance of the impact of the independent variables and covariates on the types of waste. Cells marked with “x” indicate a significant correlation.
| Dependent variables | Motion | Waiting | Inventory | Defects | Transportation | Unutilized talent | Making do | Extra processing | Overproduction |
|---|---|---|---|---|---|---|---|---|---|
| Independent variables | |||||||||
| Building design and specifications | x*** | — | x*** | — | — | x* | — | x*** | — |
| Directives | x*** | — | x*** | — | — | x*** | — | — | — |
| Components and materials | x*** | — | x* | x*** | x*** | x*** | — | x*** | — |
| Workers | x*** | x*** | — | x*** | — | x*** | — | x*** | — |
| Equipment and machinery | x*** | x*** | — | — | x*** | x*** | — | — | — |
| Sufficient space | — | — | x*** | — | x*** | x*** | x*** | — | — |
| Connecting work | — | x*** | — | x*** | — | x** | x*** | x* | — |
| External conditions | — | x*** | — | — | — | x*** | — | x*** | — |
| Working conditions | — | x* | — | — | — | — | — | — | — |
| Covariates | |||||||||
| Project | — | — | — | — | — | — | — | — | — |
| Profession | — | x*** | — | x** | x*** | — | — | x** | — |
| Role | x*** | x*** | — | x*** | x*** | — | — | — | — |
| Daytime | — | — | x** | — | — | — | x*** | — | — |
| R squared | 0.482 | 0.288 | 0.282 | 0.281 | 0.218 | 0.184 | 0.182 | 0.164 | 0.008 |
Note: Two-sided statistically significant findings are marked with * if ; ** if , and *** if .
The GLM analysis, based on Wilk’s , reported a significant multivariate effect of eight out of nine missing preconditions and three out of four covariates on the nine types of waste. Thus, all variables are significant in explaining the differences between the independent variables, except for the covariate variable project [, ; Wilk’s ] and the independent variable working conditions [, ; Wilk’s ], although working conditions showed a statistically significant impact on waiting waste. Table 10 indicates that different waste types were significantly affected by various preconditions and other factors (covariates). The availability of components and materials impacted the most waste types: transportation, motion, defects, inventory, unutilized talent, and extra processing. The readiness of previous tasks (connecting work) and worker qualification and presence (workers) influenced the second-most types of waste. Building design and specifications, equipment and machinery, and sufficient space significantly influenced various waste categories. In addition to the readiness of preconditions, other characteristics (covariates) had a significant effect on waste occurrences. Workers’ roles (installers or supervisors) and their trade affected waste types significantly, especially transportation, waiting, and defects. Differences between electricians and plumbing/HVAC (covariate profession) are significant for waiting, defects, transportation, and extra processing. Interestingly, project type did not significantly impact occurrences of waste, indicating that the findings are generalizable to different contexts. The data and factors (independent and covariates) analyzed explain an average of 23.2% (average R squared, see Table 10) of waste occurrences. Motion was explained best (48.2%) by the analyzed factors, and overproduction was the least explained (0.8%). Low explanation results related to overproduction, unutilized talent, making do, and extra processing were due to the small number of instances in these categories in the sample.
Discussion
Frequency and Duration of Direct Work Disturbances in MEP Work
The findings of this study show that task performance at the operational level was fragmented and involved many activity changes in short periods. The results of previous exploration of this phenomenon (Görsch et al. 2022) using a small, 5-h time-motion data sample were confirmed here in a much larger sample.
According to Weigl et al. (2020), the fragmentation of direct work contributes to lower situation awareness and increased levels of stress and exhaustion, which can degrade performance. In contrast to the explanations of Weigl et al. (2020), the study’s results indicate that electricians were disturbed twice as often as plumbing/HVAC installers but still had a higher level of performance in terms of direct work. Based on the findings, it is not possible to establish an association between the number of disturbances and the share of direct work. However, medium-term disturbances impacted performance most in this study and were most occurring in the hotel and office projects, where both trades had the lowest performance values. The finding that medium-term disturbances have a high impact on the share of direct work in MEP is backed up by the fact that such disturbances accounted for most of the time spent not engaged in direct work activities.
Waste Types and Causes Driving Durations of Direct Work Disturbances
Disturbances can be categorized by their duration and the proportion of waste types they contain. Three clusters were found: short-, medium-, and long-term disturbances. The start and continuation of installation work require the organization and preparation of materials and equipment in the immediate vicinity of the installation area and lead to short-term disturbances. Lack of working conditions, materials, sufficient space, and equipment often forces workers to briefly pause direct work and adjust for the next steps before installation work continues. For example, activities such as material handling, work preparation, and measurements account for a high proportion of the short-term disturbances of plumbing and HVAC work required between direct work activities. These short-term disturbances do not include wasted effort; they support the continuation of direct work. This understanding is novel and explains why the frequency of disturbances alone does not explain low shares of direct work.
Most medium-term disturbances were associated with a lack of connecting tasks and components and materials. The importance of production control can be seen in the hotel and office projects, which suffered from schedule delays caused by COVID-19. In that project, medium-term disturbances were the most frequent. In contrast, the performance of electricians was highest in the shopping mall project where lean methods were used and production was controlled using takt principles. Schedule delays impacted performance by increasing the share of medium-term disturbances. This hypothesis should be further tested in future research. Medium-term disturbances occurred in the wider working area, including movement and transportation to/from nearby areas for storing, preparing, cleaning, and so forth. These disturbances were caused by changing from one installation point to another (readjusting materials and tools) or the current workplace being organized to continue direct work. Overall, they resulted in movement close to the installation area. The importance of workplace infrastructure has been highlighted by Koskela (2000, 2013), and Formoso et al. (2017) as a cause of waste. This study shows the impact on medium-term disturbances, which cover most of the time spent on nonvalue-adding work. It also confirms the qualitative observations of Seppänen and Görsch (2022), who identified movement and transportation as the most common types of waste in MEP work. They are caused by uncoordinated and unready materials and equipment and low maneuverability within the wider area surrounding the installation point. Thus, providing tools and materials where and when needed has the potential to reduce waste in construction (see Ballard 2000; Bertelsen et al. 2006; Koskela 2000).
Within long-term disturbances, installers are pulled further away from the installation point and working area as indicated by high shares of transportation, motion, and inventory, which are associated with areas outside the installation area. Thus, it is logical that their shares were highest in the largest project of the study, the shopping mall, where material storage was often distant. By contrast, the project with design issues had many long-term disturbances for electricians, showing the impact of design on performance. In long-term disturbances, installers face issues of not having the necessary materials, tools, space, or connecting work, resulting in significantly higher shares of searching and hauling materials and equipment or the need to discuss issues faced in the working area with coworkers and supervisors. Reaching for materials, equipment, and coworkers causes longer disturbances, aligning with the findings from Tetik et al. (2021) and Neyens et al. (2019). The impact of unmanaged onsite logistics as a cause of wasted effort has been reported (Koskela 2000; Zhao and Chua 2003; Khanh and Kim 2014; Kalsaas et al. 2014; Formoso et al. 2017; Bajjou and Chafi 2022). This study identifies these causes as the missing preconditions with the largest impact on wasted effort, showing that the organization of logistics could have a large impact on productivity, which is in line with earlier studies on kitting (Tetik et al. 2021; Zhao et al. 2021).
Factors that affect wasted effort in MEP work include the level and accuracy of task-level planning, the role of workers, spatial maneuverability, and trade specifics. The amount of discussion was high in both trades, indicating situations in which further work coordination and clarification about task level is required, as these are often not sufficiently addressed in production planning and control. Thus, workers carry out task planning and control activities (Görsch et al. 2024), which are among the most commonly identified factors driving waste, confirming the findings of Alarcón and Serpell (1996), Koskela (2000), Horman and Kenley (2005), Kalsaas (2013), Khanh and Kim (2014), and Bajjou and Chafi (2022).
Supervisors experience fewer and shorter disturbances (most short-term), supporting continuous direct work. In contrast, installers face more frequent and prolonged disturbances in their direct work. They spend more time clearing due to insufficient space and working conditions and clarifying (discussing) unclear preconditions as well as searching for and hauling materials and equipment elsewhere than in the installation area. The finding raises questions about whether supervisors choose easier work for themselves and prioritize the requirements of their own production tasks or whether their role-specific tasks and experience contribute to these differences.
Another factor affecting wasted effort and the duration of disturbances of MEP work is spatial maneuverability, which describes the effort needed to cope with spatial, material, and equipment limitations. When the materials and equipment used for installation are large compared to the installation area, the work is more challenging, and more effort is needed to plan and coordinate task performance. The understanding of spatial maneuverability in terms of efforts and details needed for operational task planning was qualitatively described by Gil et al. (2000) and Görsch et al. (2024). They defined it as a part of task planning and control in the operational construction process carried out by construction workers themselves in a decentralized manner. In contrast to previous reports, this understanding was identified for the first time as a factor impacting the amount of wasted effort and the duration of disturbances of MEP work. This study showed statistically significant differences in disturbances between trades in relation to specific times of day, roles, and projects, which can explain differences in the amount of waste. Interestingly, project differences affect the proportion of activities and the amount of waste (e.g., hotel and office: scheduling issues; multifamily: design issues; shopping mall: lean implementations) but not how preconditions affect waste types. The fact that the type of project had no significant impact is taken as an indication of the generalizability of these results.
This study is the first to determine that job-specific task requirements and processes significantly influence the frequency and duration of disturbances as well as the extent and type of waste. This pattern was present despite differences in projects, roles, and times of day. These findings parallel the trade-specific differences in decentralized planning behavior documented among electrical and plumbing/HVAC workers (Görsch et al. 2024). The findings of Demirkesen et al. (2022) show that waiting is the main source of wasted effort in concrete work, and the results of this study show that movement and transportation are predominant in MEP work, highlighting the influence of trade and work type on wasted effort and thus on direct work levels. This contrasts with earlier studies (Neve et al. 2020b; Strandberg and Josephson 2005) reporting that trade had no impact on the proportion of wasted effort or direct work. The study’s findings, derived from time-motion studies categorizing activities, wasted effort, and missing preconditions, question whether work sampling can identify both symptoms and root causes of problems empirically. This may explain why differences between trades were unexplained in earlier work-sampling studies.
Improvement Suggestions–Reducing Waste and Disturbances
To reduce wasted effort and shorten the duration of direct work disturbances, providing better preconditions and work processes is key. Short-term disturbances, such as incidents of missing preconditions, occur most frequently and thus hold potential for improvement. They mainly occur in the direct vicinity of the installation area and support the continuation of direct work. It can be argued that their duration depends on arranging and maneuvering individual skills within the installation area. Thus, an orderly and structured installation area and process can decrease the need to stop and rearrange, thus reducing short-term disturbances and supporting activities. Introducing workers to lean principles, such as the concept of waste or 5S (sort, set in order, shine, standardize, sustain), can increase workers’ process awareness in terms of organizing spaces and materials more efficiently by identifying and reducing waste. The concept of maneuverability during the installation process should also be considered when products and processes are prefabricated, with materials and equipment kitted to installation areas.
Medium-term disturbances were characterized by insufficient space and incomplete connecting work, resulting in additional planning and coordination activities. Accordingly, workers should be provided with space in the right condition for installation work so they can work without disturbances. Digital systems and visualization approaches can display available spaces with set preconditions to improve individuals’ situational awareness and reduce the number of site visits to gain an understanding of what is happening and find possible work areas to reduce and avoid disturbances. Future research and practice should explore how digital advancements such as digital twins (Sacks et al. 2020), digital visual management (Reinbold et al. 2022), and shorter cycle times (Riekki et al. 2023) can enhance data granularity. Such approaches will facilitate more efficient data collection, analysis, and distribution, continuously supporting workers’ information needs with task-relevant information based on faster-updated planning and control cycles.
Long-term disturbances to both direct work share and waste can be mitigated by implementing digital systems accessible to workers. These systems provide real-time information on the availability and location of materials and equipment, thereby minimizing search efforts. However, pointing out the current locations of materials and components does not directly reduce moving and hauling. Thus, this paper proposes the development of mobile workstations, which can be equipped with task-specific materials, components, equipment, and digital visual management devices in a structured manner (Tezel and Aziz 2017). When spatial and process limitations hinder the deployment of mobile workstations carrying materials and equipment, on-demand onsite logistics as a service can be an alternative solution.
Finally, a more detailed tracking of workers’ onsite movements seems logical, given its strong connection to the primary causes of waste—motion and transportation—and their high occurrence in medium-term disturbances. Earlier research (Zhao et al. 2019) suggested using uninterrupted presence time as an indicator for increased direct work. Wandahl et al. (2023) demonstrated a significant negative correlation between movement and share of direct work. While the study’s results align with these, there are potential improvements to consider. Depending on the precision of location tracking, short- and medium-term disturbances may go unnoticed, hindering direct work. Because several disturbance types take place in the immediate vicinity, the assumption that uninterrupted presence in assigned work locations automatically contributes to increased value-adding times is challenged. Trade-specific needs lead to various work areas spread across construction sites, which is not accounted for in current scheduling methods. Future research should detail how workers utilize spaces on construction sites and develop accurate, real-time tracking methods. Since movement is a symptom of missing preconditions, more focus should be placed on network and complex systems behavior in onsite movement. Doing so could identify both problems with preconditions and recognizing medium- and long-term disturbances.
Study Limitations
Certain types of waste, including extra processing, unutilized talent, and overproduction, were infrequently detected and had low explanatory power in the statistical analysis. The challenges in identifying and tracking these waste types can be attributed to the visual nature of time-motion and work-sampling studies, often conducted by nonexperts. A deeper understanding of trade-specific installation processes would enable better detection of these waste types, similar to detecting making do. In the study’s methodology, these waste types tended to remain hidden, aligning with the findings of Demirkesen et al. (2022) and the observations of Kalsaas (2011). Their hidden nature can have a significant impact on the outcomes of cluster and regression analyses. While these waste types are likely prevalent in reality, the current camera observation method was not effective in capturing them.
Another factor that affected activity classification was the muted audio of the videos, required by the ethics committee and workers’ associations, which limited the analysis of the causes of wasted effort. The content of conversations and ambient sounds could have provided further information about activities, waste, and missing preconditions if these were unclear in the footage. The content of conversations could also have indicated whether they were work-related and exactly what problems required discussions, thus preventing misinterpretations in the classification.
The filming and classification of construction work is not a new research method. However, the current manual classification is not an efficient option for commercial use. The observation and classification of activities by nonexperts are fundamentally prone to misinterpretation, as previous work-sampling studies have shown (Josephson and Bjorkman 2013; Neve et al. 2020b), although these and earlier time-motion studies yielded valuable insights. Consequently, additional efforts must be made to supervise data collection and classification to obtain valid data. Moreover, the current observation and classification approach was resource-intensive and did not allow for real-time analysis and intervention in the projects. Future research activities should focus on the development of monitoring and sensing concepts that support or reduce subjectivity and manual effort through automation. However, automation is likely to be complex because events cannot be understood as snapshots; the interpretation of waste requires lengthy sequences of data to be analyzed.
The geographical limitations and limited number of professionals in the study limit the generalizability of the results. Investigating 9,575 activities (including 1,771 disturbance, 1,511 waste, and 1,320 missing precondition incidents) over 28 workdays generated by 14 participants is in line with earlier work sampling and time-motion studies in terms of sample size and the conclusions derived (Josephson and Bjorkman 2013; Neve et al. 2020b; Strandberg and Josephson 2005; Wandahl et al. 2023). Furthermore, the study examined similar patterns of waste proportions and missing preconditions in projects with different layouts and approaches. Some factors were project-specific and depended on schedule delays, design issues, and site layouts. However, the relationship between preconditions and waste categories was generally applicable in the projects, and earlier studies have found similar patterns and causes of waste with different study methods and in different countries. Thus, the overall results can be considered generalizable but should be considered with caution when applied to individual projects. Further time-motion studies with the same trades in different projects and contexts are needed to deepen the paper’s results and test their reproducibility and generalizability.
Methodological Contribution
The study has provided empirical data and evidence on trade-specific practices, an under-researched area, although around 70% of construction projects are carried out by contracting companies (Josephson and Bjorkman 2013). The study’s data set is unique, being an extensive and detailed data set of operational task processes in construction, including work activities, waste categories, missing preconditions, and a statistical analysis of their interdependencies. Furthermore, the depth of analysis (16 activity, nine waste, and nine precondition categories) contributes to the unique character of the study and was not shown in previous time-motion (Demirkesen et al. 2022) or work-sampling studies.
Due to its second-to-second classification approach, the study’s method can examine work processes in greater detail than work sampling. This raises the question of how well work sampling can represent reality since it is based on isolated and irregular observations that can be independent of context. The study shows lower shares of direct work (13.6% for plumbing/HVAC and 24.0% for electrical work) than earlier studies (30%–60%) (Gong et al. 2011; Neve et al. 2020a, b; Thomas et al. 1984). This finding can be related to two factors. First, using more activity categories (16 in total) than earlier studies could have affected direct work share. The category measurements (working with material, work preparation, maintenance and cleaning, inspection, and direct work) were not similarly distinguished in earlier studies; thus, it can be assumed that differences in direct work proportions are related to the classification scheme used and its level of detail. This supports Josephson and Bjorkman’s (2013) claim that these methods are limited in measuring productivity and comparing performance over time, which calls into question comparisons of direct work proportions across decades, projects, and disciplines, such as in the work of Neve et al. (2020a) and Wandahl et al. (2021). Second, using continuous observation rather than work sampling with regular intervals (e.g., every 5 min) could lead to lower shares of direct work being detected. Continuous observation of activities can create a more comprehensive understanding of the effects and causes of activities. If observation is carried out every 5 min or at irregular intervals, many activity switches are missed. The transition from nonvalue-adding to value-adding work happens quickly, which may lead the observer to see direct work, this being easier to recognize. Short segments of nonvalue-adding work add up to a significant share of time, likely explaining the differences between work-sampling studies and this study. The differences between the two methods could be further evaluated by using both methods on the same data set.
The study revealed that some direct work is wasteful, although previous research tends to assume that direct work is inherently nonwasteful, given its direct contribution to project completion (Koskela 2000; Neve et al. 2020b). Previous research, primarily based on surveys and interviews, has often pinpointed the causes of waste in preconstruction phases. In contrast, observational methods have demonstrated that waste causes are predominantly observable in the construction process. In summary, the aforementioned points underscore a research gap in our understanding of the concept of waste and its underlying causes in the construction industry. Addressing this gap should be a priority for future research theoretically, methodologically, and empirically.
Conclusion
Construction projects suffer from low labor productivity, and a deeper understanding of the causes and impacts of this phenomenon from the operational and worker perspectives is critical to improvement. A time-motion study was conducted to observe the work activities, waste incidents, disturbances, and missing preconditions of 14 MEP workers over 28 workdays. The data, collected through video recording and organized into predefined categories, underwent numerical and statistical analysis. This approach provided a new understanding of how types of waste and their associated missing preconditions impact resource inefficiencies manifested as direct work disturbances.
The study shows that preconditions need to be carefully managed but that they vary greatly across trades and individual situations on construction sites. Production planning and control approaches and measures were insufficient to provide effective preconditions to MEP workers. Thus, construction work was fragmented, and direct work was regularly disturbed (40–90 times per day), resulting in low proportions of direct work (on average, 13.6% for plumbing/HVAC and 24.0% for electrical work). The study’s results indicate that MEP work is wasteful, even on projects where lean principles are implemented.
By exploring direct work disturbances, the study provides theoretical insights into operations management in construction. Currently, production requires subjective, ad hoc decisions to maintain the flow of installation work. The coordination and provision of individual preconditions remain insufficient for productive work, and there are no practices for monitoring them and no awareness of which information and preconditions are needed where and when. When logistics are organized by each trade separately without coordination by a central logistics operator, timely preconditions are not available to individuals. Therefore, employees manage the preparation and execution of tasks themselves. Each task requires a personal evaluation of the situation and requirements before logistics and installation can be organized. This leads to wasteful sequences of activities that do not involve direct work. Many small activities must be performed before installation work, and the work is often disturbed by long-term sequences consisting largely of movement and transportation. Once preconditions are in place, workers are able to carry out installation work efficiently with only short-term disturbances that are not wasteful. Trade contractors themselves can do little for productivity. This emphasizes the roles of the general contractor and the owner.
The study’s key practical contribution is the identification of three clusters of disturbances driven by different mechanisms that require different attention from managers: short-, medium-, and long-term disturbances. The first are characterized by the coordination activities required before and after direct work, such as material handling and work preparation in immediate work locations. While these activities could be improved with planning and prefabrication, they support the continuation of direct work without wasted effort and are necessary for onsite installations. The second includes activities in the wider environment that lead to movement near the installation area and comprise most of the nonvalue-adding activities. The duration of these disturbances depends on the clarity of workers’ task understanding, the organization of the workspace, and the organization of material logistics. These can all be improved by the general contractor. The long-term disturbances involve problems that spread outside the installation area and require installers to search for materials, coordinate with colleagues, and deal with uncontrolled logistics. These require attention in design management and scheduling (to decrease coordination requirements) and, again, logistics. Automated means could be used to detect these disturbances because they pull workers out of their work location, and “no direct work is being done when on the run.”
In summary, this study highlights an urgent need for transformative change in construction practices, focusing on minimizing direct work disturbances and improving installation performance. Technology could help achieve this: the study’s results demonstrate that analyzing the locations of workers and providing information, materials, and equipment at the right time and location could decrease wasted effort. More research should be done on the space utilization of workers and on automated analysis based on location and movement data. Similar studies should also be performed in other countries and contexts to increase the generalizability of the study’s results.
Appendix. Activity, Waste, and Missing Precondition Categories and Descriptions
| No. | Activity category | Description |
|---|---|---|
| 1 | Direct work | Consist of activities that increase the value of a building, component, or product. |
| 2 | Inspection | Quality control measures that reduce the risk of recurrence. |
| 3 | Work preparation | All the preparatory work steps required to begin the work phase. Includes arrangement of tools and material on site ( from installation area). Includes a review of plans (as well as technical plans, material lists, and schedules). |
| 4 | Working with material | Includes all work on material that prepares it for installation or holds it in place (e.g., cutting and joining with cable ties). |
| 5 | Measurement | In addition to measurements, it includes recording measurement data in notebooks or on walls, for example. Includes small movements needed to take longer dimensions. |
| 6 | Maintenance and cleaning | Includes activities needed to continue working. For example, replacing tool batteries, repairing broken tools, cleaning during work, or cleaning after work. |
| 7 | Hauling, short distance | Transfer of material, equipment, and tools a distance 5–30 m from the installation area. |
| 8 | Hauling, long distance | Transfer of material, equipment, and tools a distance from the installation area. |
| 9 | Searching | Any activity looking for materials, tools, or equipment. It is not considered work preparation. |
| 10 | Movement | Any activity involving movement without a clear purpose and not included in other categories. For example, aimless movement without material, equipment, or tools. |
| 11 | Rework | Activities that need to be done again. Usually related to an error in the installer’s work, previous work steps of others, or changed plans. |
| 12 | Nonwork-related actions | All activities not included in other categories. For example, time on phone using apps. |
| 13 | Discussion | All verbal conversations with other people (including phone conversations). The content of the conversations cannot usually be deduced due to muted recordings. |
| 14 | Unclear | Activities that cannot be identified due to low footage quality. |
| 15 | Break time | Activities where a worker takes a rest from work tasks. |
| 16 | Research project-related time | Activities where a worker engages with research staff. |
| No. | Waste category | Description |
| 1 | Transportation | Unnecessary movement of products, tools, equipment, or materials. |
| 2 | Waiting | Time spent waiting for the next process steps. |
| 3 | Motion | Unnecessary movements. Can be caused by a lack of equipment and poor work area coordination. |
| 4 | Extra processing | Inappropriate work steps (in number or quality). Not required by the customer. |
| 5 | Overproduction | Production that is more than needed or before it is needed. |
| 6 | Defects | Effort due to rework, scrap, and incorrect information about customer requirements. |
| 7 | Inventory | Surplus of products and materials that are processed or stored causing interference. |
| 8 | Unutilized talent | Underutilizing peoples’ talents, skills, and knowledge. |
| 9 | Making do | Starting a task before all preconditions are in place. |
| No. | Missing precondition | Description |
| 1 | Building design and specifications | Sufficient and correct plans, drafts, and specifications are missing. |
| 2 | Directives | Missing guidance in the form of agreements, clear assignments, instructions, or decisions. |
| 3 | Components and materials | The amount or type of material and components is incorrect, or unavailable. |
| 4 | Workers | Workers are not present or qualified for the assigned task. |
| 5 | Equipment and machinery | Machinery and equipment are not available, in insufficient condition, or incorrect. |
| 6 | Sufficient space | No access to the assigned workspace (e.g., space occupied by other trades or material). |
| 7 | Connecting work | Previous or connecting activities have not been completed or do not meet requirements. |
| 8 | External conditions | Climate conditions like temperature, snow, and so forth prevent executing an assigned task. |
| 9 | Working conditions | Safe working conditions are not present, or unexpected conditions (e.g., work accidents, asbestos, and soil conditions) are explored. |
Data Availability Statement
Some or all data, models, or code generated or used during the study are proprietary or confidential in nature and may only be provided with restrictions.
Acknowledgments
The authors would like to thank Juha Kerttula, Markus Nevalainen, Daniela Schenk, Axel Lindberg, and Atte Koljonen for their assistance in data collection and classification. They also acknowledge the editor and anonymous reviewers for their contribution to the paper’s peer review, which allowed us to significantly improve the paper. The study was funded by the Finnish associations of electrical and telecommunication companies STUL, HVAC and plumbing/HVAC technical companies LVI-TU, and electrical employers STTA.
References
Alarcón, L. F., S. Diethelm, O. Rojo, and R. Calderón. 2008. “Assessing the impacts of implementing lean construction.” Rev. Ing. Constr. 23 (1): 26–33. https://doi.org/10.4067/s0718-50732008000100003.
Alarcón, L. F., and A. Serpell. 1996. “Performance measuring benchmarking, and modelling of construction projects.” In Proc., 5th Int. Workshop on Lean Construction. Santiago, Chile: Pontificia Universidad Católica de Chile.
Ansah, R. H., S. Sorooshian, and S. Bin Mustafa. 2016. “Lean construction: An effective approach for project management.” ARPN J. Eng. Appl. Sci. 11 (3): 1607–1612.
Bajjou, M. S., and A. Chafi. 2022. “Exploring the critical waste factors affecting construction projects.” Eng. Constr. Archit. Manage. 29 (6): 2268–2299. https://doi.org/10.1108/ECAM-12-2020-1097.
Balderjahn, I., M. Peyer, B. Seegebarth, K. Wiedmann, and A. Weber. 2018. “The many faces of sustainability-conscious consumers: A category-independent typology.” J. Bus. Res. 91 (Oct): 83–93. https://doi.org/10.1016/j.jbusres.2018.05.022.
Ballard, G. 1999. “Improving work flow reliability.” In Proc., 7th Annual Conf. of the Int. Group for Lean Construction, 275–286. Berkeley, CA: Univ. of California.
Ballard, H. G. 2000. “The last planner system of production control.” Doctoral dissertation, Dept. of Civil Engineering, Univ. of Birmingham.
Bertelsen, S., L. Koskela, G. Henrich, and J. Rooke. 2006. “Critical flow–towards a construction flow theory.” In Proc., 14th Annual Conf. Int. Group for Lean Construction, 31–40. Santiago: The International Group for Lean Construction.
Bølviken, T., J. Rooke, and L. Koskela. 2014. “The wastes of production in construction—A TFV based taxonomy.” In Proc., 22nd Annual Conf. of the Int. Group for Lean Construction, IGLC 2014, 811–822. Oslo, Norway: The International Group for Lean Construction.
Bortolazza, R. C., and C. T. Formoso. 2006. “A quantitative analysis of data collected from the last planner system in Brazil.” In Proc., Annual Conf. of the Int. Group for Lean Construction, 625–635. Santiago: The International Group for Lean Construction.
Dai, G., M. Liao, and R. Zhang. 2023. “Resource levelling in repetitive construction projects with interruptions: An integrated approach.” J. Civ. Eng. Manage. 29 (2): 93–106. https://doi.org/10.3846/jcem.2023.17568.
Dave, B., S. Boddy, and L. Koskela. 2010. “Improving information flow within the production management system with web services.” In Proc., 18th Annual Conf. of the Int. Group for Lean Construction, 445–455. Technion, Haifa, Israel: The International Group for Lean Construction.
Demirkesen, S., E. Sadikoglu, and E. Jayamanne. 2022. “Investigating effectiveness of time studies in lean construction projects: Case of Transbay Block 8.” Prod. Plann. Control 33 (13): 1283–1303. https://doi.org/10.1080/09537287.2020.1859151.
Ebbesen, R. M. 2004. A system for evaluating the ongoing building process—Theory and practice, 1–16. Helsingør, Denmark: Aalborg Univ.
Emuze, F., J. Smallwood, and S. Han. 2014. “Factors contributing to non-value adding activities in South African construction.” J. Eng. Des. Technol. 12 (2): 223–243. https://doi.org/10.1108/JEDT-07-2011-0048.
Formoso, C. T., L. Sommer, L. Koskela, and I. Eduardo Luis. 2017. “The identification and analysis of making-do waste: Insights from two Brazilian construction sites.” Ambiente Construído 17 (3): 55–68.
Gil, N., I. D. Tommelein, R. L. Kirkendall, and G. Ballard. 2000. “Contribution of specialty contractor knowledge to early design.” In Proc., 8th Annual Conf. of the Int. Group for Lean Construction. Brighton, UK: The International Group for Lean Construction.
Gilbreth, F. B., and L. M. Gilbreth. 1922. “Process charts and their place in management.” Mech. Eng. 70 (1): 38–41.
Gong, J., J. D. Borcherding, and C. H. Caldas. 2011. “Effectiveness of craft time utilization in construction.” Construct. Manage. Econ. 29 (7): 737–751. https://doi.org/10.1080/01446193.2011.595013.
Görsch, C., A. Al Barazi, O. Seppänen, and H. A. Ibrahim. 2022. “Uncovering and visualizing work process interruptions through quantitative workflow analysis.” Lean Constr. J. 183 (2022): 171–183. https://doi.org/10.60164/c5e1b7g1a.
Görsch, C., O. Seppänen, A. Peltokorpi, and R. Lavikka. 2024. “Task planning and control in construction: Revealing workers as early and late planners.” Construct. Manage. Econ. 42 (5): 431–450. https://doi.org/10.1080/01446193.2023.2270080.
Gouett, M. C., C. T. Haas, P. M. Goodrum, and C. H. Caldas. 2011. “Activity analysis for direct-work rate improvement in construction.” J. Constr. Eng. Manage. 137 (12): 1117–1124. https://doi.org/10.1061/(ASCE)CO.1943-7862.0000375.
Grau, D., A. Abbaszadegan, and R. Assanair. 2019. “Process versus operations workflow—Making the case for continuous monitoring of construction operations.” In Proc., 27th Annual Conf. of the Int. Group for Lean Construction, IGLC 2019, 563–572. Dublin, Ireland: The International Group for Lean Construction.
Hamzeh, F. R., G. Ballard, and I. D. Tommelein. 2008. “Improving construction work flow—The connective role of lookahead planning.” In Proc., IGLC16 16th Annual Conf. of the Int. Group for Lean Construction, 635–646. Manchester, UK: The International Group for Lean Construction.
Hassan, A., and K. El-Rayes. 2020. “Quantifying the interruption impact of activity delays in non-serial repetitive construction projects.” Construct. Manage. Econ. 38 (6): 515–533. https://doi.org/10.1080/01446193.2019.1657922.
Henrich, G., S. Bertelsen, L. Koskela, K. Kraemer, J. Rooke, and R. Owen. 2007. “Construction physics–understanding the flows in a construction process.” In Proc., Annual Conf. of the Int. Group for Lean Construction, 1–14. Lansing, MI: The International Group for Lean Construction.
Horman, M. J., and R. Kenley. 2005. “Quantifying levels of wasted time in construction with meta-analysis.” J. Constr. Eng. Manage. 131 (1): 52–61. https://doi.org/10.1061/(ASCE)0733-9364(2005)131:1(52).
Howell, G. A., H. G. Ballard, I. D. Tommelein, and L. J. Koskela. 2004. “Discussion of ‘Reducing variability to improve performance as a lean construction principle’ by H. Randolph Thomas, Michael J. Horman, Ubiraci Espinelli Lemes de Souza, and Ivica Zavrˇski.” J. Constr. Eng. Manage. 130 (2): 299–300. https://doi.org/10.1061/(ASCE)0733-9364(2004)130:2(299).
Igwe, C., F. Nasiri, and A. Hammad. 2022. “An empirical study on non-physical waste factors in the construction industry.” Eng. Constr. Archit. Manage. 29 (10): 4088–4106. https://doi.org/10.1108/ECAM-02-2021-0145.
Issa, U. H., and M. Alqurashi. 2020. “A model for evaluating causes of wastes and lean implementation in construction projects.” J. Civ. Eng. Manage. 26 (4): 331–342. https://doi.org/10.3846/jcem.2020.12323.
Issa, U. H., and S. M. Ibrahim. 2018. “Improving productivity in Saudi Arabian construction projects: An analysis based on lean techniques improving productivity in Saudi Arabian construction projects: An analysis based on lean techniques.” Int. J. Appl. Eng. Res. 13 (10): 8669–8678.
Jang, J. W., and Y.-W. Kim. 2007. “Use of percent of constraint removal to measure the make ready process.” In Proc., Annual Conf. of the Int. Group for Lean Construction, 529–538. Lansing, MI: The International Group for Lean Construction.
Jang, Y., K. Song, M. Park, and Y. Ahn. 2020. “Classifying the business model types of international construction contractors.” J. Constr. Eng. Manage. 146 (6): 04020056. https://doi.org/10.1061/(ASCE)CO.1943-7862.0001836.
Josephson, P. E., and L. Bjorkman. 2013. “Why do work sampling studies in construction? The case of plumbing work in Scandinavia.” Eng. Constr. Archit. Manage. 20 (6): 589–603. https://doi.org/10.1108/ECAM-12-2011-0108.
Kalsaas, B. T. 2010. “Work-time waste in construction.” In Proc., 18th Annual Conf. of the Int. Group for Lean Construction, 507–517. Arlington, VA: Lean Construction Institute.
Kalsaas, B. T. 2011. “On the discourse of measuring work flow efficiency in construction. A detailed work sampling method.” In Proc., 19th Annual Conf. of the Int. Group for Lean Construction, 104–114. Lima, Peru: The International Group for Lean Construction.
Kalsaas, B. T. 2013. “Measuring waste and workflow in construction.” In Proc., 21th Annual Conf. of the Int. Group for Lean Construction, 33–42. Arlington, VA: Lean Construction Institute.
Kalsaas, B. T., M. Gundersen, and T. O. Berge. 2014. “To measure workflow and waste. A concept for continuous improvement.” In Proc., 22nd Annual Conf. of the Int. Group for Lean Construction, 835–846. Oslo, Norway: The International Group for Lean Construction.
Khanh, H. D., and S. Y. Kim. 2014. “Identifying causes for waste factors in high-rise building projects: A survey in Vietnam.” KSCE J. Civ. Eng. 18 (4): 865–874. https://doi.org/10.1007/s12205-014-1327-z.
Koskela, L. 1992. Application of the New Production Philosophy to Construction. Stanford, CA: Stanford Univ.
Koskela, L. 2000. An exploration towards a production theory and its application to construction. Espoo, Finland: Valtion teknillinen tutkimuskeskus Technical Research Centre of Finland.
Koskela, L. 2004. “Making do—The eighth category of waste.” In Proc., 12th Annual Conf. of the Int. Group for Lean Construction. Helsingør, Denmark: The International Group for Lean Construction.
Liou, F.-S., and J. D. Borcherding. 1986. “Work Sampling can predict unit rate productivity.” J. Constr. Eng. Manage. 112 (1): 90–103. https://doi.org/10.1061/(ASCE)0733-9364(1986)112:1(90).
Liu, M., G. Ballard, and W. Ibbs. 2010. “Work flow variation and labor productivity: Case study.” J. Manage. Eng. 27 (4): 236–242. https://doi.org/10.1061/(ASCE)ME.1943-5479.0000056.
Minooei, F., P. M. Goodrum, and T. R. B. Taylor. 2020. “Young talent motivations to pursue craft careers in construction: The theory of planned behavior.” J. Constr. Eng. Manage. 146 (7): 04020082. https://doi.org/10.1061/(ASCE)CO.1943-7862.0001867.
Naji, K. K., M. Gunduz, and M. F. Hamaidi. 2022. “Major factors affecting construction waste management in infrastructure projects using structural equation model.” J. Constr. Eng. Manage. 148 (10): 04022101. https://doi.org/10.1061/(ASCE)CO.1943-7862.0002358.
Neve, H., S. Wandahl, S. Lindhard, J. Teizer, and J. Lerche. 2020a. “Determining the relationship between direct work and construction labor productivity in North America: Four decades of insights.” J. Constr. Eng. Manage. 146 (9): 04020110. https://doi.org/10.1061/(ASCE)CO.1943-7862.0001887.
Neve, H., S. Wandahl, S. Lindhard, J. Teizer, and J. Lerche. 2020b. “Learning to see value-adding and non-value-adding work time in renovation production systems.” Prod. Plann. Control 33 (8): 790–802. https://doi.org/10.1080/09537287.2020.1843730.
Neyens, D. M., S. Bayramzadeh, K. Catchpole, A. Joseph, K. Taaffe, K. Jurewicz, A. Khoshkenar, and D. San. 2019. “Using a systems approach to evaluate a circulating nurse’s work patterns and workflow disruptions.” Appl. Ergon. 78 (Jul): 293–300. https://doi.org/10.1016/j.apergo.2018.03.017.
Norusis, M. 2011. IBM SPSS statistics 19 advanced statistical procedures. New York: Pearson.
Ohno, T. 1988. Toyota production system: Beyond large-scale production. New York: Productivity Press.
Pasila, H.-J. 2019. Impact of lean-intervention on productivity. Espoo, Finland: Aalto Univ.
Poreddy, A., V. Rathinakumar, and Y. Kumar. 2015. “Assessment of waste in MEP process through work sampling and simulation.” Indian J. Sci. Technol. 8 (14): 1–11. https://doi.org/10.17485/ijst/2015/v8i14/63646.
Power, W., and D. Taylor. 2019. “Last planner system and percent plan complete: An examination of trade contractor performance.” Lean Constr. J. 2019: 131–146.
Reinbold, A., E. Lappalainen, O. Seppänen, and A. Peltokorpi. 2022. “Current challenges in the adoption of digital visual management at construction sites: Exploratory case studies.” Sustainability 14 (21): 14395. https://doi.org/10.3390/su142114395.
Riekki, J., J. Rannisto, and J. Lehtovaara. 2023. “Achieving a 4-hour takt time- and driving change with it.” In Proc., Annual Conf. of the Int. Group for Lean Construction, 1184–1195. Lille, France: The International Group for Lean Construction.
Sacks, R., I. Brilakis, E. Pikas, H. S. Xie, and M. Girolami. 2020. “Construction with digital twin information systems.” Data Centric Eng. 1 (Jan): e14. https://doi.org/10.1017/dce.2020.16.
Sacks, R., and M. Goldin. 2007. “Lean management model for construction of high-rise apartment buildings.” J. Constr. Eng. Manage. 133 (5): 374–384. https://doi.org/10.1061/(ASCE)0733-9364(2007)133:5(374).
Sarti, S., N. Darnall, and F. Testa. 2018. “Market segmentation of consumers based on their actual sustainability and health-related purchases.” J. Cleaner Prod. 192 (Aug): 270–280. https://doi.org/10.1016/j.jclepro.2018.04.188.
Seppänen, O., and C. Görsch. 2022. “Decreasing waste in mechanical, electrical and plumbing work.” In Proc., Annual Conf. of the Int. Group for Lean Construction, 84–94. Alberta, Canada: The International Group for Lean Construction.
Singh J., M. Mangal, and J. C. P. Cheng. 2017. “IT for lean construction-A survey in India.” In Proc., 25th Annual Conf. of the Int. Group for Lean Construction (IGLC), LC3 2017 Volume II, edited by K. Walsh, R. Sacks, and I. Brilakis, 119–126. Heraklion, Greece. https://doi.org/10.24928/2017/0321.
Strandberg, J., and P.-E. Josephson. 2005. “What do construction workers do? Direct observations in housing projects.” In Proc., 11th Joint CIB Int. Symp. Combining Forces, Advancing Facilities Management and Construction through Innovation, 184–193. Helsinki, Finland: Finnish Association of Civil Engineers.
Taylor, F. W. 1911. The principles of scientific management. New York: Harper and Brothers.
Tetik, M., A. Peltokorpi, O. Seppänen, M. Leväniemi, and J. Holmström. 2021. “Kitting logistics solution for improving on-site work performance in construction projects.” J. Constr. Eng. Manage. 147 (1): 05020020. https://doi.org/10.1061/(ASCE)CO.1943-7862.0001921.
Tezel, A., and Z. Aziz. 2017. “From conventional to IT based visual management: A conceptual discussion for lean construction.” J. Inf. Technol. Constr. 22 (Oct): 220–246.
Thomas, H. R., J. M. Guevara, and C. T. Gustenhoven. 1984. “Improving productivity estimates by work sampling.” J. Constr. Eng. Manage. 110 (2): 178–188. https://doi.org/10.1061/(ASCE)0733-9364(1984)110:2(178).
Thompson, S. K. 1987. “Sample size for estimating multinomial proportions.” Am. Stat. 41 (1): 42–46. https://doi.org/10.1080/00031305.1987.10475440.
Van Den Berge, M. J. C., R. H. Free, R. Arnold, E. de Kleine, R. Horman, J. M. C. van Dijk, and D. van Pim. 2017. “Cluster analysis to identify possible subgroups in tinnitus patients.” Front. Neurol. 8 (Apr): 245152. https://doi.org/10.3389/fneur.2017.00115.
Wandahl, S., H. H. Neve, and J. Lerche. 2021. “What a waste of time.” In Proc., Annual Conf. of the Int. Group for Lean Construction, 157–166. Lima, Peru: The International Group for Lean Construction.
Wandahl, S., C. T. Pérez, S. Salling, and H. H. Neve. 2023. “Correlation of construction workers’ movement and direct work rates.” J. Eng. Project Prod. Manage. 13 (2): 125–137. https://doi.org/10.32738/JEPPM-2023-0013.
Weigl, M., K. Catchpole, M. Wehler, and A. Schneider. 2020. “Workflow disruptions and provider situation awareness in acute care: An observational study with emergency department physicians and nurses.” Appl. Ergon. 88 (Oct): 103155. https://doi.org/10.1016/j.apergo.2020.103155.
Womack, J. P., and D. T. Jones. 2003. Lean thinking: Banish waste and create wealth in your corporation. New York: Simon and Schuster.
Zhao, J., O. Seppänen, A. Peltokorpi, B. Badihi, and H. Olivieri. 2019. “Real-time resource tracking for analyzing value-adding time in construction.” Autom. Constr. 104 (Aug): 52–65. https://doi.org/10.1016/j.autcon.2019.04.003.
Zhao, J., Y. Zheng, O. Seppänen, M. Tetik, and A. Peltokorpi. 2021. “Using real-time tracking of materials and labor for kit-based logistics management in construction.” Front. Built Environ. 7 (Sep): 713976. https://doi.org/10.3389/fbuil.2021.713976.
Zhao, Y., and D. K. Chua. 2003. “Relationship between productivity and non value-adding activities.” In Proc., 11th Annual Conf. of the Int. Group for Lean Construction.
Information & Authors
Information
Published In

Journal of Construction Engineering and Management
Volume 150 • Issue 9 • September 2024
Copyright
This work is made available under the terms of the Creative Commons Attribution 4.0 International license, https://creativecommons.org/licenses/by/4.0/.
History
Received: Jun 30, 2023
Accepted: Apr 10, 2024
Published online: Jun 27, 2024
Published in print: Sep 1, 2024
Discussion open until: Nov 27, 2024
ASCE Technical Topics:
- Business management
- Construction engineering
- Construction industry
- Construction management
- Construction wastes
- Data analysis
- Employment
- Engineering fundamentals
- Engineering materials (by type)
- Environmental engineering
- Granular materials
- Labor
- Lean construction
- Materials engineering
- Methodology (by type)
- Personnel management
- Pollutants
- Practice and Profession
- Research methods (by type)
- Solid wastes
- Waste management
- Wastes
Authors
Metrics & Citations
Metrics
Citations
Download citation
If you have the appropriate software installed, you can download article citation data to the citation manager of your choice. Simply select your manager software from the list below and click Download.