Measurement for Risk Perception Ability
Publication: Journal of Construction Engineering and Management
Volume 150, Issue 5
Abstract
Unsafe behaviors may be aroused by inaccurate risk perception. Rather little is known about the measurement of risk perception ability in the construction industry. Based on the conception of risk perception ability, we proposed a measurement of risk perception ability, which conducted a questionnaire and a behavioral experiment. The specific measurement included an indicators system proposed to measure risk perception ability, which contained hazard identification degree, hazard identification accuracy, accuracy of the risk evaluation, deviation degree of the expected damage, deviation degree of the probability, and deviation degree of the risk evaluation. Based on the six indicators, the weighing values for each indicator were calculated, and a formula calculating risk perception ability (RPA) was proposed. Then, we applied the measurement to 327 construction professionals, which showed RPA differed from different construction professionals, and managers’ RPA was significantly superior to workers (). The method can measure construction professionals’ RPA conveniently and easily, which filled the lack of research regarding RPA in construction. Measurement results can help to provide targeted safety training recommendations, which is beneficial to reducing workers’ unsafe behavior and accident rates.
Introduction
Most accidents occur due to individuals’ unsafe behaviors (Seo 2005). The human factors analysis and classification system (HFACS) offered a systematic review of individual factors causing accidents, in which perceptual errors are recognized as crucial errors in unsafe acts (Shappell and Wiegmann 2000). Previous research has also indicated that failure to adequately evaluate risk may be a fundamental factor contributing to unsafe behaviors (Na et al. 2019). In daily life, individuals can vary significantly in their capacity to identify hazards and evaluate risks. These differences can influence their behaviors, and incorrect behaviors may potentially result in accidents. So, research on risk perception is crucial for ensuring safe construction practices.
The concept of risk perception ability (RPA) and its impact on safety have gained significant attention through increased research—particularly concerning drivers. Using dynamic traffic scenarios, Spicer (1964) was the first to measure drivers’RPAthrough situational tests (Farrand and Mckenna 2001). Further, RPA was first defined as the ability to identify potential risks in traffic scenes (Crick and McKenna 1992). Using a questionnaire survey (Vanlaar and Yannis 2006), behavior experiments (Rosenbloom et al. 2015), simulation technology (Casutt et al. 2014), and eye movement technology (Pradhan et al. 2003), subsequent studies explored factors that affect drivers’ RPA and figured out how to measure RPA. Through questionnaires and behavior experiments, Salmon et al. (2013) compared drivers’ RPA and prejudgment ability with hazard identification tasks via videos featuring actual working processes. However, there has been a lack of research exploring the RPA in fields such as public safety, mine safety, and construction safety. Li (2005) assessed students’ RPA and explored how individual differences impact their RPA. Perlman et al. (2014) tested superintendents’ ability to identify risks, perceive risks, and assess risks with behavioral experiments.
Various methods have resulted in two types of measurement indicators: behavioral indicators and physiological indicators. McKenna and his colleagues (McKenna and Crick 1992) have used reaction time data as an indicator of drivers’ RPA. Similarly, Yang has used hazard identification time and reaction time to measure driver’s RPA (Yang et al. 2014). By utilizing questionnaires (Wang 2018) and dangerous scenario videos (Borowsky et al. 2010; Salmon et al. 2013), participants were required to evaluate or describe the risk of hazards within a scenario, and the results were used to assess individuals’ RPA. Prior research by Chen et al. (2016b) has attempted to measure RPA in construction workers by utilizing indicators such as hit rates and false alarm rates. Meanwhile, some scholars have combined eye movement and neuroscience techniques to explore individuals’ risk perception abilities. The indicators included driving speed, risk identification rate, gaze time, gaze frequency, and brainwave indicators (Liang and Lin 2018; Qiao et al. 2022; Tang et al. 2013). Based on a picture-based risk perception experiment of road hazards, Liang and Lin (2018) recorded 42 drivers’ electroencephalography (EEG), electrodermal activity (EDA), and behavioral responses to hazards. The results showed that physiological features were significantly different between risky and safe drivers, indicating that physiological indicators can also be applied to study individuals’ risk perception.
Thus, there are three main characteristics in current research on RPA. First, the research on RPA mainly focused on the field of traffic safety, with a majority focusing on drivers’ risk perception abilities. The construction field still lacked related studies. Second, the main research methods used are questionnaire surveys and behavioral experiments, with some studies utilizing technologies such as eye tracking and event-related potential (ERP). The two main types of measurement indicators were behavioral and physiological indicators. Finally, most related studies concentrate more on hazard identification, which ignores the evaluation of risks, and the related indicators were not comprehensive or systematic.
The construction industry has long been viewed as highly risky due to its complex work environment, overlapping tasks, and long life cycles. According to statistics from 2004 to 2021, national construction had 12,801 accidents and 15,193 deaths. As such, many experts have explored ways to effectively reduce accident rates. Deviations in individual risk perception induce unsafe behaviors (Liang 2022) and wrong decision making (Xiao 2014). Construction workers’ risk perception also plays an important role in improving emergency response and committing to safety regulations (Siegrist and Arvai 2020; Wang et al. 2016). Risk perception was mainly defined as a subjective feeling toward risks, without right or wrong, just low or high. Different from risk perception, RPA was a kind of capacity (Crick and McKenna 1992). We defined RPA as an ability to quickly and correctly identify hazards in the target scenario, to objectively analyze the probability and the damage of potential accidents caused by hazards, and to evaluate the risk level of the hazards relatively accurately. As said before, the construction field lacked studies relating to RPA. So, we reviewed the literature on risk perception in construction. As a stage of risk perception, the failure to identify hazards would result in unsafe behavior (Tixier et al. 2014). Hazard identification is one of the fundamental units of risk management. Currently, scholars have conducted extensive research on the hazard identification stage in construction. Dzeng et al. (2016) compared the hazard search patterns of experienced and novice workers by creating a construction site model. Chen et al. (2016a) utilized a helmet system integrated with electroencephalography to identify individuals who demonstrated weaker abilities in hazard identification. By experimental research, Atefeh et al. (2018) discovered that the time to the peak value of hemoglobin concentration varied with the degree of hazard and the source of energy. Previous studies concentrated more on the hazard identification stage and ignored the importance of the risk evaluation stage. An accurate evaluation of risks is also crucial in shaping safety behavior among construction workers. Underestimating risks can foster a sense of recklessness, which in turn can induce unsafe behaviors. Conversely, overestimating risks can induce feelings of fear and anxiety among workers, ultimately resulting in errors and mistakes in their work. Hence, we studied RPA from two stages: hazard identification and risk evaluation.
Accordingly, this study primarily focused on RPA from two perspectives: hazard identification and risk evaluation. We aimed to design a measurement for RPA. Based on existing indicators measuring RPA, we designed an indicator system and proposed a formula to calculate RPA. Through questionnaires and behavioral experiments, we measured construction professionals’ RPA, and we further studied whether ability discrepancy between managers and workers exists. This study addresses the research gap in RPA within the construction industry. In addition to hazard identification, this study refocuses on the risk evaluation stage of risk perception, and it holds practical significance for construction safety work.
Methodology
Research Framework
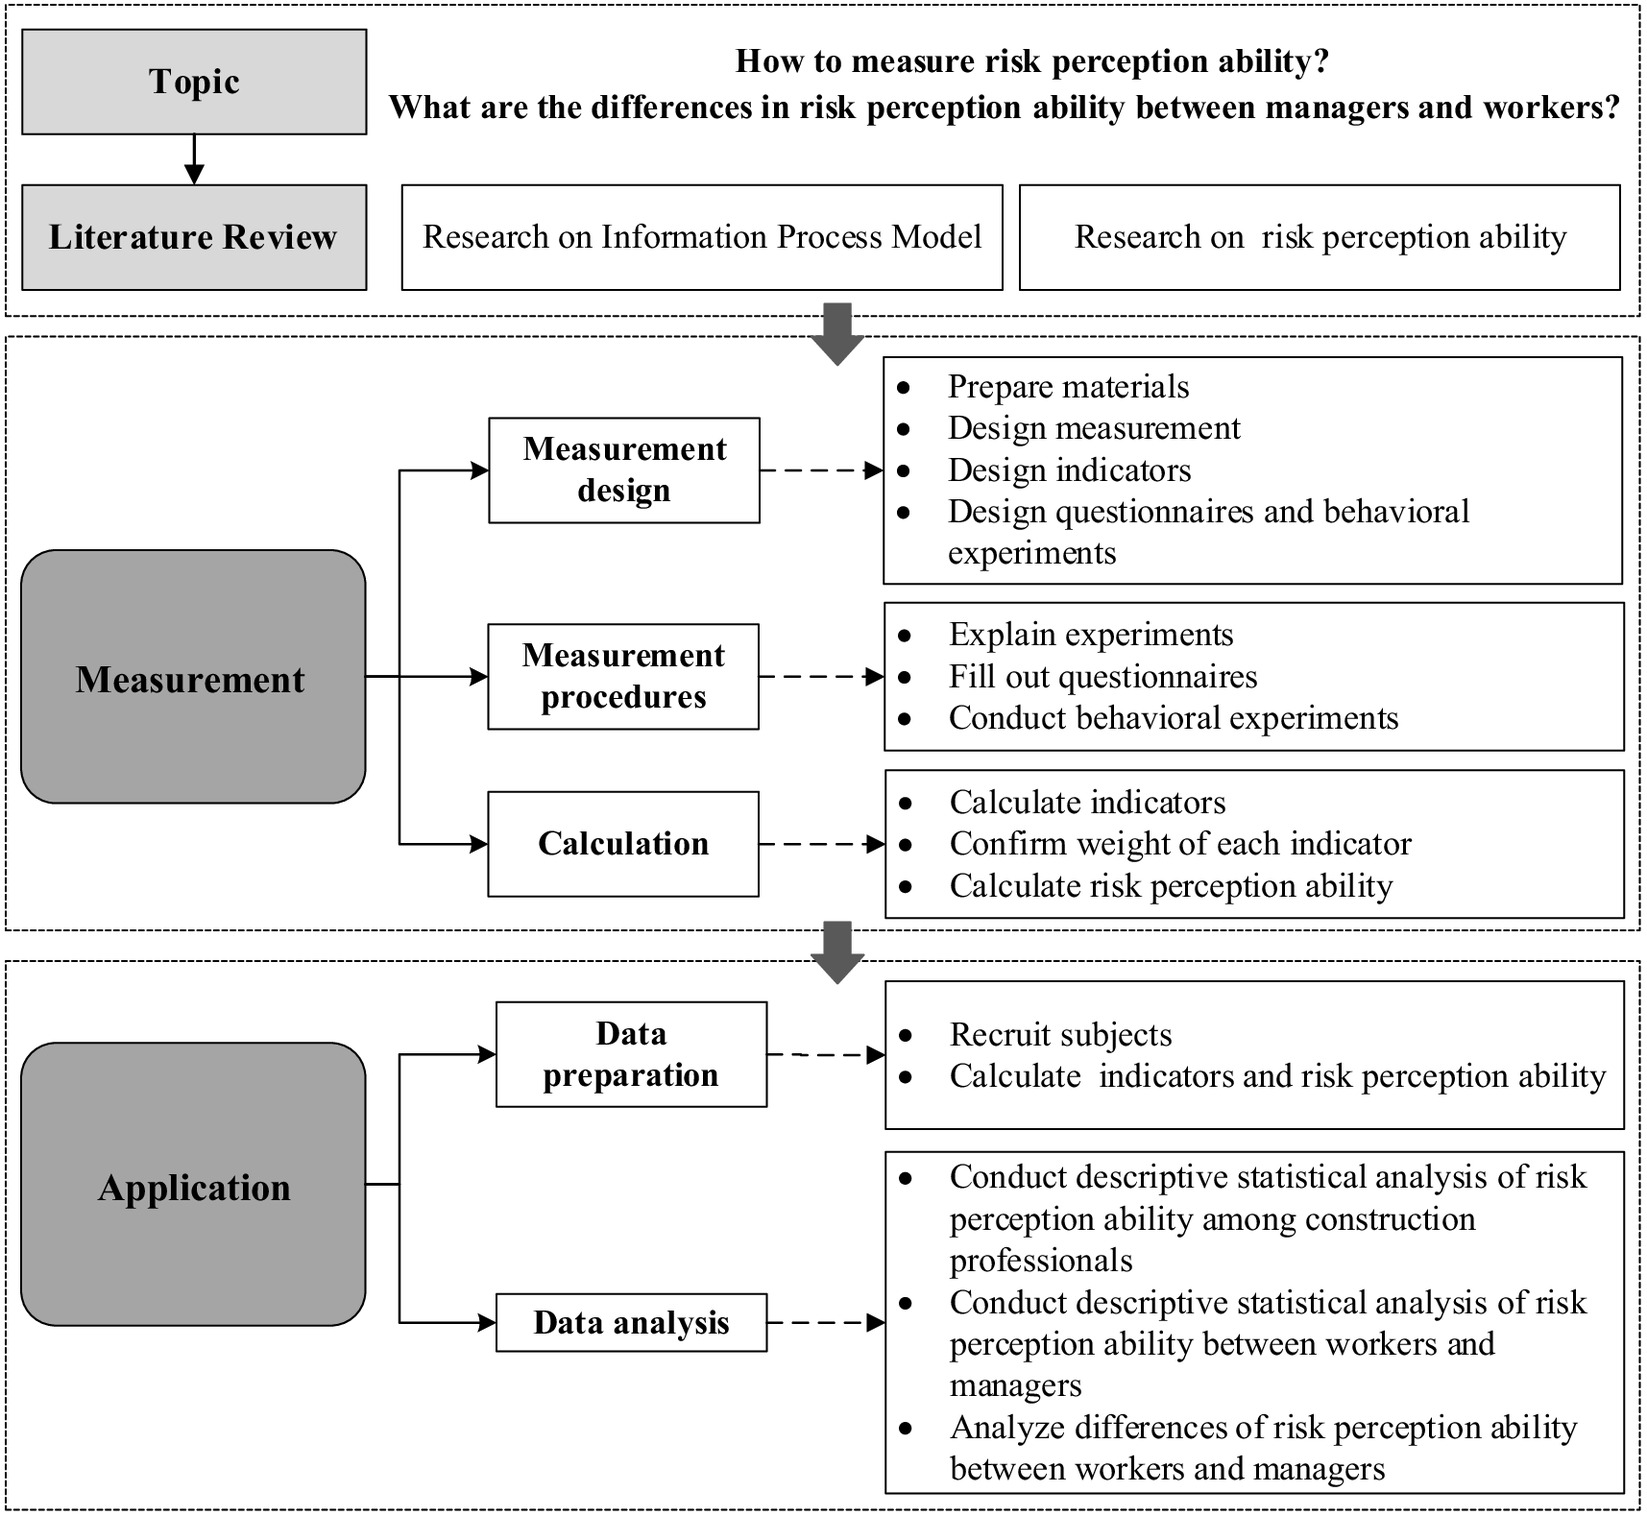
According to the content presented, we proposed a method to measure construction professionals’ RPA and then applied the method to a construction project in Guangxi, China. We want to explore two main questions: (1) How can we measure RPA? and (2) What are the differences in RPA between managers and workers? The main content of this paper is as follows.
Propose a method to calculate and measure RPA. Previous studies mainly applied the psychometric paradigm to assess risk perception, which is a subjective approach emphasizing individuals’ sense of risk. The measurement of risk perception reflects the subjective sense of the risks and cannot be definitively labeled as correct or wrong. Besides, the indicators measuring RPA were not systematic, and studies utilized separate indicators from experiments to represent RPA. Hence, the measurement of RPA focuses on the accuracy of hazard identification and the objectivity of risk evaluation in our study. We designed an indicator system to measure RPA comprehensively. Then, we proposed a formula to calculate RPA. Combining a questionnaire and a behavioral experiment, we suggested an all-encompassing approach to assess individuals’ RPA.
Investigating the disparities in RPA between managers and workers. Previous studies have shown that individuals with different identities, such as workers, experts, and managers, have different risk perceptions (Li et al. 2018; Zhao et al. 2016; Song and Zhang 2022). The groups were also classified into architects, experts, engineers, and workers in the previous study. Some groups’ jobs directly relate to construction, such as architects; however, they work at the construction site irregularly. Thus, we have narrowed our focus to construction professionals divided into two main groups: workers (including, but not limited to, cementers, scaffolders, electricians, and plumbers) and managers (including quality control and safety officers) on construction sites.
The research framework is shown in Fig. 1.
Measures
Materials of Measurement
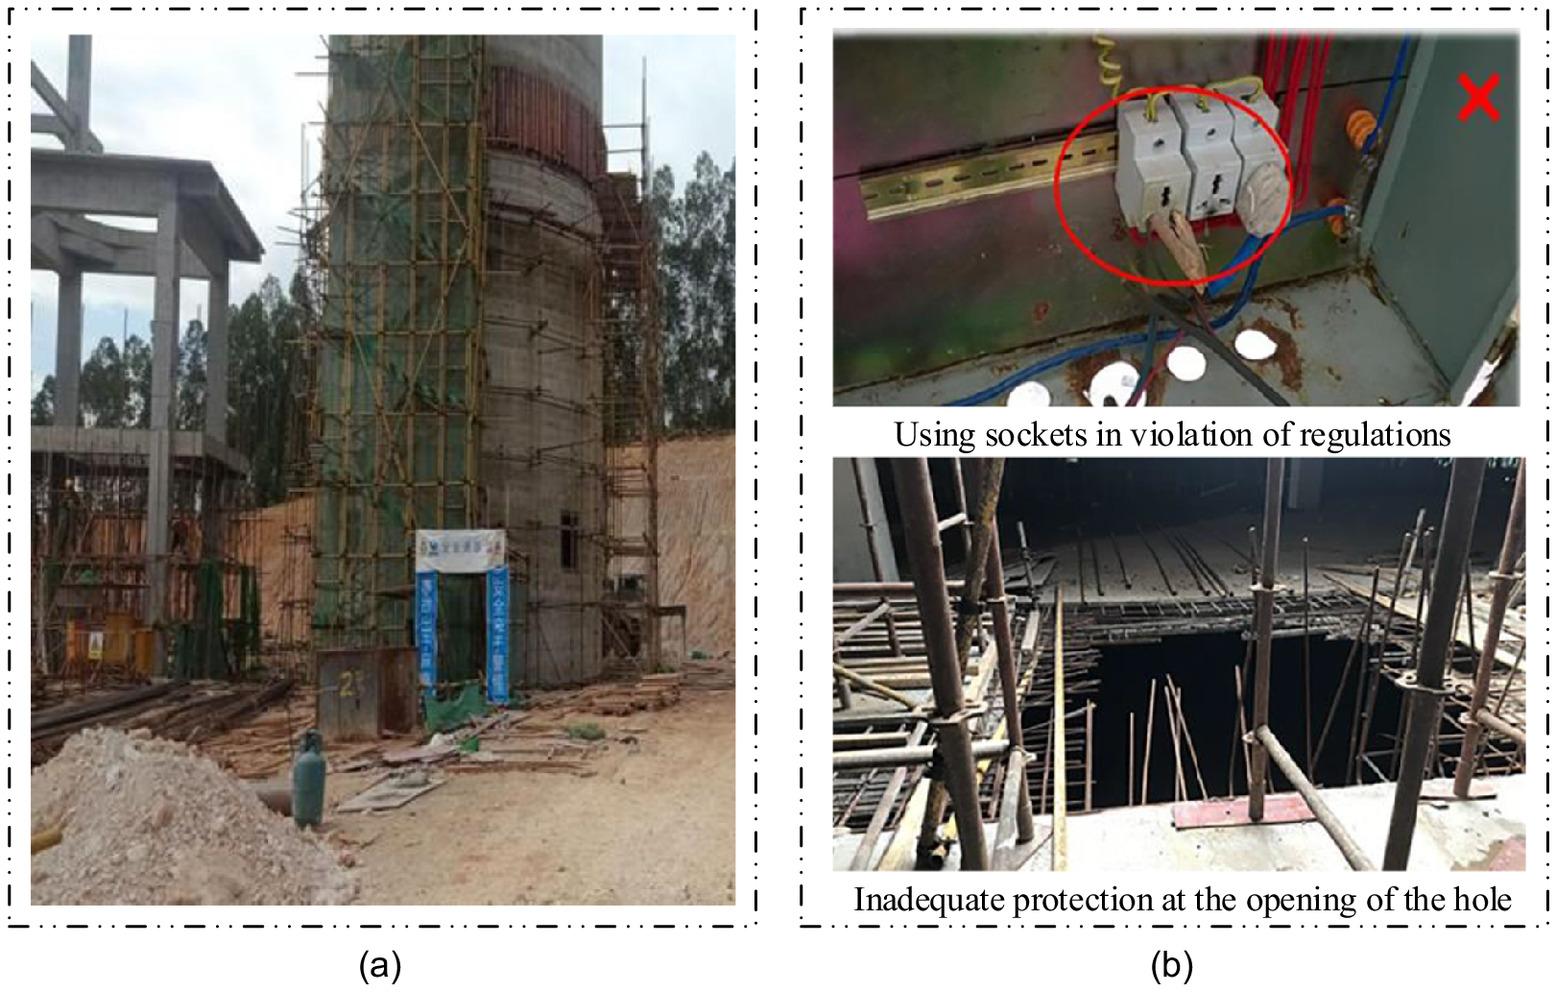
Ten pictures of simple risk scenarios and five pictures of complex risk scenarios were used in the questionnaire and behavior experiment. The simple risk scenarios include one risk, and the complex risk scenarios include three to five risks (Fig. 2). The risks contain kinds of common hazards in construction sites, such as falling risk, risk of being hit by an object, risk of mechanical injury, and risk of collapsing. All pictures were captured at construction sites and were evaluated by 10 experts in company management, 10 safety patrols, 10 experienced builders, and 10 university teachers engaging in risk perception.
Design of Measurement
In previous studies, the measurement of risk perception mainly focused on the personal subjective feeling of risks. Based on Wickens’ information process model (Wickens et al. 2021), Rasmussen’s eight-stage cognitive model (Rasmussen 1986), the communication-human information processing model (C-HIP) (Wogalter 2018), and other cognitive theories (Wogalter et al. 1993, 1999), generally, risk perception includes two processes, perceiving and recognizing information. Taken with the studies presented, we concluded that in the early stages, individuals were able to intuitively perceive external risk information, exhibiting the ability to subconsciously, rapidly, and sensitively detect the presence of risks through visual and auditory senses; and in the later stages, individuals can further comprehend risk information by analyzing it using their memory, knowledge, and other resources. Accordingly, we divided the RPA into two parts for measurement: hazard identification ability and risk evaluation ability. Hazard identification ability is measured by the number and accuracy of hazard identification. Risk evaluation ability is determined by the accuracy and deviation of risk evaluation.
Design of Indicators
The hazard identification ability was measured by five images displaying complex risk scenarios via behavioral experiments. Each complex risk scenario contained one to five hazards. Participants were asked to mark the hazards they identified and describe the hazards.
The measurement of risk evaluation ability mentioned in this paper refers to previous studies. The evaluation of risks mostly depended on the dimensions of risk (Wilson et al. 2019). The one-dimension approach mostly measured risk by “How risky is ,” with intuitional judgment (Safi et al. 2012). The two-dimension measurement mostly defined risk from probability and consequence of risk (Rosen and Kostjukovsky 2015), and other multidimensional measurements focused on probability, exposure, vulnerability, affect, and controllability (Mann and Wolfe 2016; Martin et al. 2007; Wilson et al. 2019). In production safety, probability and consequence were viewed as reliable factors to evaluate risk. Peter and Ryan (1976) indicated the risk degree can be calculated by multiplying probability and consequence. Referring to the presented research, we used two approaches to evaluate risks, one is two dimensions: (1) probability of accident and damage of accident’s consequence, which is derived from the classic risk formula: , with being the probability of accidents and the expected damage of accidents, for quantitative risk evaluation; and (2) “what is the risky level of .” From this, risk evaluation ability was measured by 10 pictures of simple risk scenarios and five pictures of complex risk scenarios. In the task measuring risk evaluation ability, participants were asked three questions about hazards, respectively “How risky is ” (assessed by the Likert 5-point scale where 1 = little risk and 5 = great risk.), “What is the probability of the risk event occurring?” (assessed by the Likert 5-point scale where 1 = unlikely and 5 = utterly predictable), and “How serious is the consequence of accident?” (assessed by the Likert 5-point scale where 1 = attractive and 5 = extremely serious).
Based on the measurement presented, the indicators measuring the RPA included two groups, indicators of hazard identification ability and risk evaluation ability. Indicators measuring hazard identification ability included hazard identification degree (HID) and hazard identification accuracy (HIA). Indicators showing risk evaluation ability contained: risk evaluation (ARE), deviation degree of the expected damage (DD), deviation degree of the probability (DP), and deviation degree of risk evaluation (DRE). The specific meanings of each indicator are shown in Appendix.
Procedure of Measurement
The measuring procedure was divided into two parts based on pictures of simple risk scenarios and complex risk scenarios.
First, participants were asked to fill out a questionnaire to judge the damage, probability, and risk level of the hazards in simple risk scenarios, see Fig. 3. ARE, DD, and DP were calculated by the results of the questionnaire.

Then, a behavioral experiment including two parts was conducted. Part 1 included five pictures with complex risk scenarios, and each picture contained one to five hazards. In Part 1, we asked participants to find out hazards in complex risk scenarios one by one and illustrate what the hazards are. HID, and HIA were calculated by the data from this part. In Part 2, we required participants to judge the risk level of hazards they identified from two angles: damage and probability, in which the deviation DRE was calculated.
Calculation of RPA
Weight Calculation
The weighing values for the indicators were computed. Methods confirming weight had two kinds: subjective and objective (Fan et al. 1998). The subjective weighting method mainly depended on policymakers’ subjective preference and direct experience, such as the expert investigation method (Li et al. 2014), the Delphi method (Cheshmidari et al. 2017), the analytic hierarchy process (AHP) (Joukar et al. 2016). The objective weighting method created a decision matrix and enlisted mathematical models to compute weighing values, such as principal component analysis (PCA), multiobjective optimization (MOP), and criteria importance through intercriteria correlation (CRITIC). In this paper, a synthesized method is proposed according to the advantages and disadvantages of subjective and objective ways of giving weight. Based on game theory (Chen 2018), we used Nash equilibrium as the goal coordination method and combined the AHP and CRITIC to lessen errors.
As an objective method to compute weighing values, CRITIC measures a criterion by considering both the importance itself and the conflict caused by intercriteria (Li et al. 2012). The calculation process is as follows.
1.
Data preprocessing: eliminate dimensionality effect, each indicator was normalized.
2.
Evaluate indicators’ volatility and coefficient of friction.
3.
Compute weighing values.
We used a computer algorithm to implement its computation, and the results are as follows:
The AHP is a subjective weighting method that prioritizes the relative importance of each factor via pairwise comparisons among the factors by relevant experts using a nine-point scale (Zhu et al. 2015). The specific steps and calculation process are as follows:
1.
Structure the judgment matrix.
2.
Examine the consistency of the comparison matrix.
3.
Compute the values of weight.
The 32 nine-point scales were distributed to related professors, safety experts, and safety managers, and 30 were valid. The calculated process was conducted by a computer algorithm, and the results are as follows:
Based on the Nash equilibrium of game theory, Su et al. (2014) combined the subjective weighting method and objective weighting method to obtain more scientific results. The basic idea was to seek balance among weights obtained from different methods, aiming to minimize the deviation between basic weights and final weights. The decision model is shown as follows:
(1a)
The condition of optimal first-order derivative iswhere = coefficient which meets weight vector
(1b)
(1c)
According to the results of the subjective weighting method and objective weighting method, = [0.1679, 0.1614, 0.2148, 0.1446, 0.1513, 0.16], = [0.1689, 0.1485, 0.1476, 0.1946, 0.1871, 0.1533], the weight-vectors were put into the formula, and the integrative model was shown
After calculation, , and .
Consequently, it is clear that the final weight vector was: . The weights of HID, HIA, ARE, DD, DP, and DRE separately are 0.168, 0.168, 0.17, 0.187, 0.157, and 0.15.
As shown, for the hazard identification stage, HID, and HIA had the same weights, yielding that both indicators should be taken seriously. For the risk evaluation stage, the deviation degree of the expected damage had the largest weight, showing that the deviation degree of the expected damage may be more important in risk evaluation.
Calculation of RPA
Based on the content above, weight of the indicators were determined. The formula of RPA was obtained as follows:
(2)
Because the range of each indicator varies. Hence, all indicators were classified into five degrees, and every degree was assigned a value. Finally, the formula can be used to calculate RPA by the assigned value of each indicator. Specific assignment criteria can be found in the following calculation examples.
Applications
Participants
The study conducted a questionnaire survey and a behavior experiment on 380 construction professionals working at two construction sites in the same construction company in Guangxi, China. To represent the group of construction workers, the type of construction professionals covers carpenters, bricklayers, concrete reinforcements, scaffolders, and electricians. All participants had good psychological and physiological health, and none reported a history of an injury related to the study.
The purpose and aims of the study were detailed to them, and informed consent was obtained before their participation. Ultimately, 327 valid data were collected, with a valid recovery rate of 86.05%.
Our research mainly intended to investigate the risk perception discrepancy between two groups: workers and managers. Workers included cementers, scaffolders, electricians, and plumbers, whereas managers comprised quality control and safety officers. The basic information of the 327 participants is shown in Table 1.
| Item | Condition | Participants | |
|---|---|---|---|
| Number | Proportion (%) | ||
| Position | Workers | 255 | 78 |
| Managers | 72 | 22 | |
| Gender | Woman | 5 | 98.5 |
| Man | 322 | 1.5 | |
| Age | 25 or younger | 22 | 6.7 |
| 26–35 | 83 | 25.4 | |
| 36–45 | 127 | 41.6 | |
| 46 or older | 86 | 26.3 | |
| Education | Elementary school or below | 5 | 1.5 |
| Junior high school | 187 | 57.2 | |
| Senior high school | 92 | 28.1 | |
| Bachelor’s degree or above | 43 | 13.1 | |
| Period of employment | 2 years or below | 55 | 16.8 |
| 3–5 years | 89 | 27.2 | |
| 6–10 years | 89 | 27.2 | |
| 11 years or above | 94 | 28.7 | |
Measurements of RPA
The 327 valid data were obtained, 255 from workers and 72 from managers. The results of indicators included HID, HIA, the ARE, DD, DP, DRE, and RPA. According to the indicators’ meaning and the descriptive statistics, we used five risk ratings to assess all six indicators and risk perception ability. The results of the measurement are shown in two parts: hazard identification ability and risk evaluation ability.
Calculation of Hazard Identification Ability
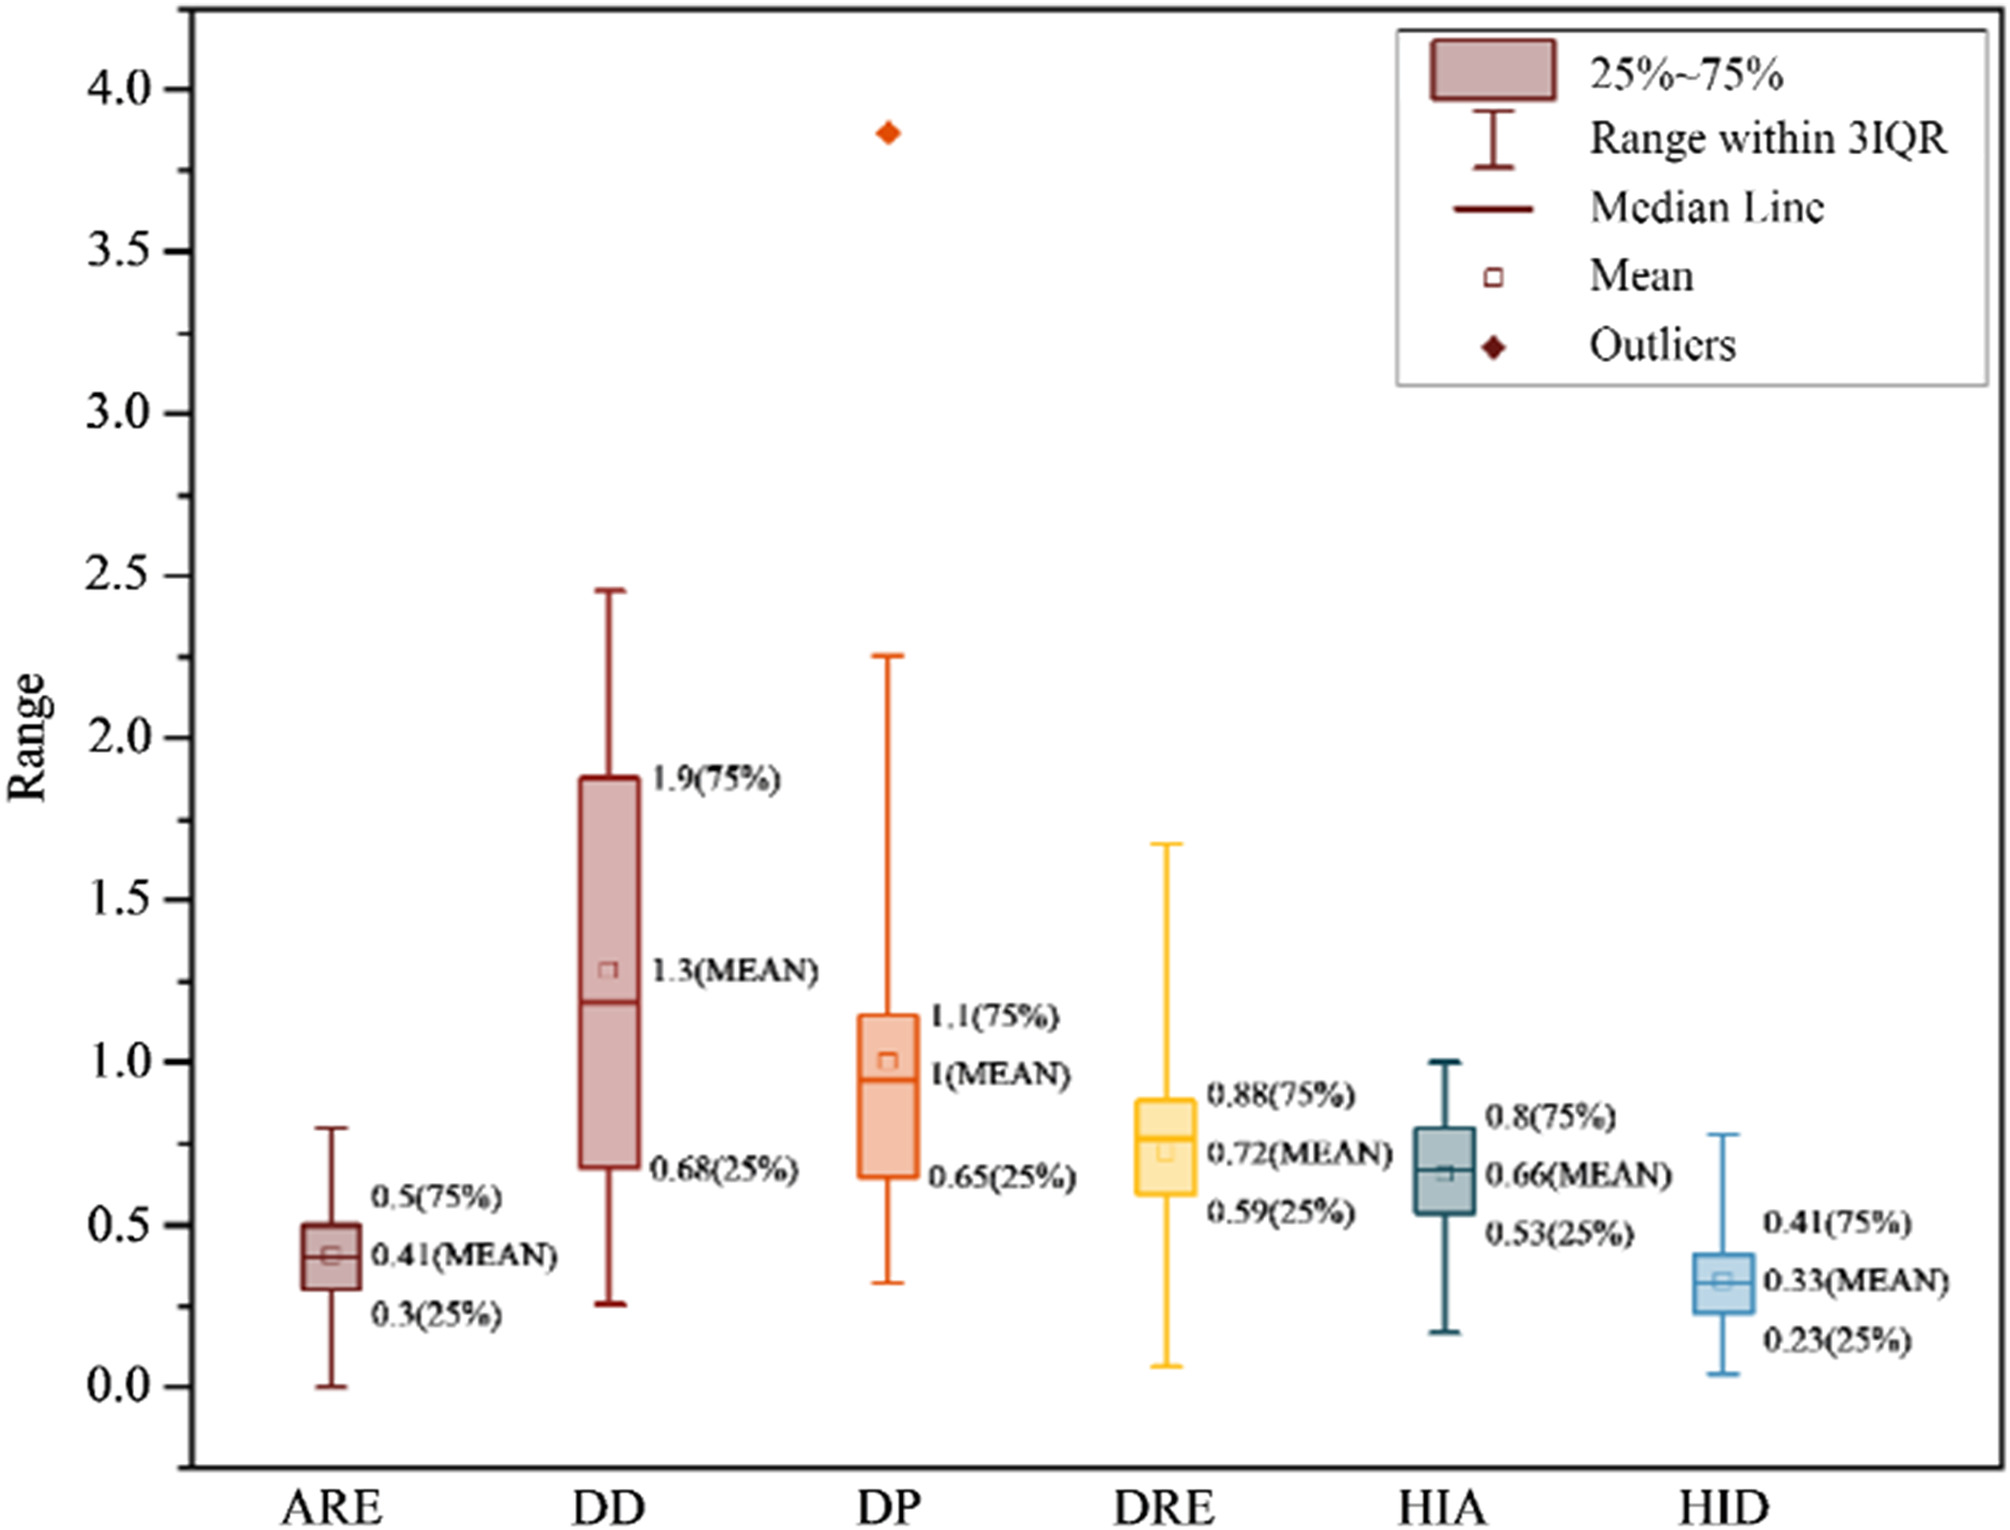
The indicators of hazard identification ability are HID and HIA. The descriptive statistics are listed in Table 2, and Fig. 4.
| Indicators | Average | Standard error | Median | Minimum | Maximum | Skewness |
|---|---|---|---|---|---|---|
| HID | 0.3294 | 0.0071 | 0.3200 | 0.04 | 0.78 | 0.464 |
| HIA | 0.6571 | 0.0099 | 0.6667 | 0.1667 | 1.0000 |
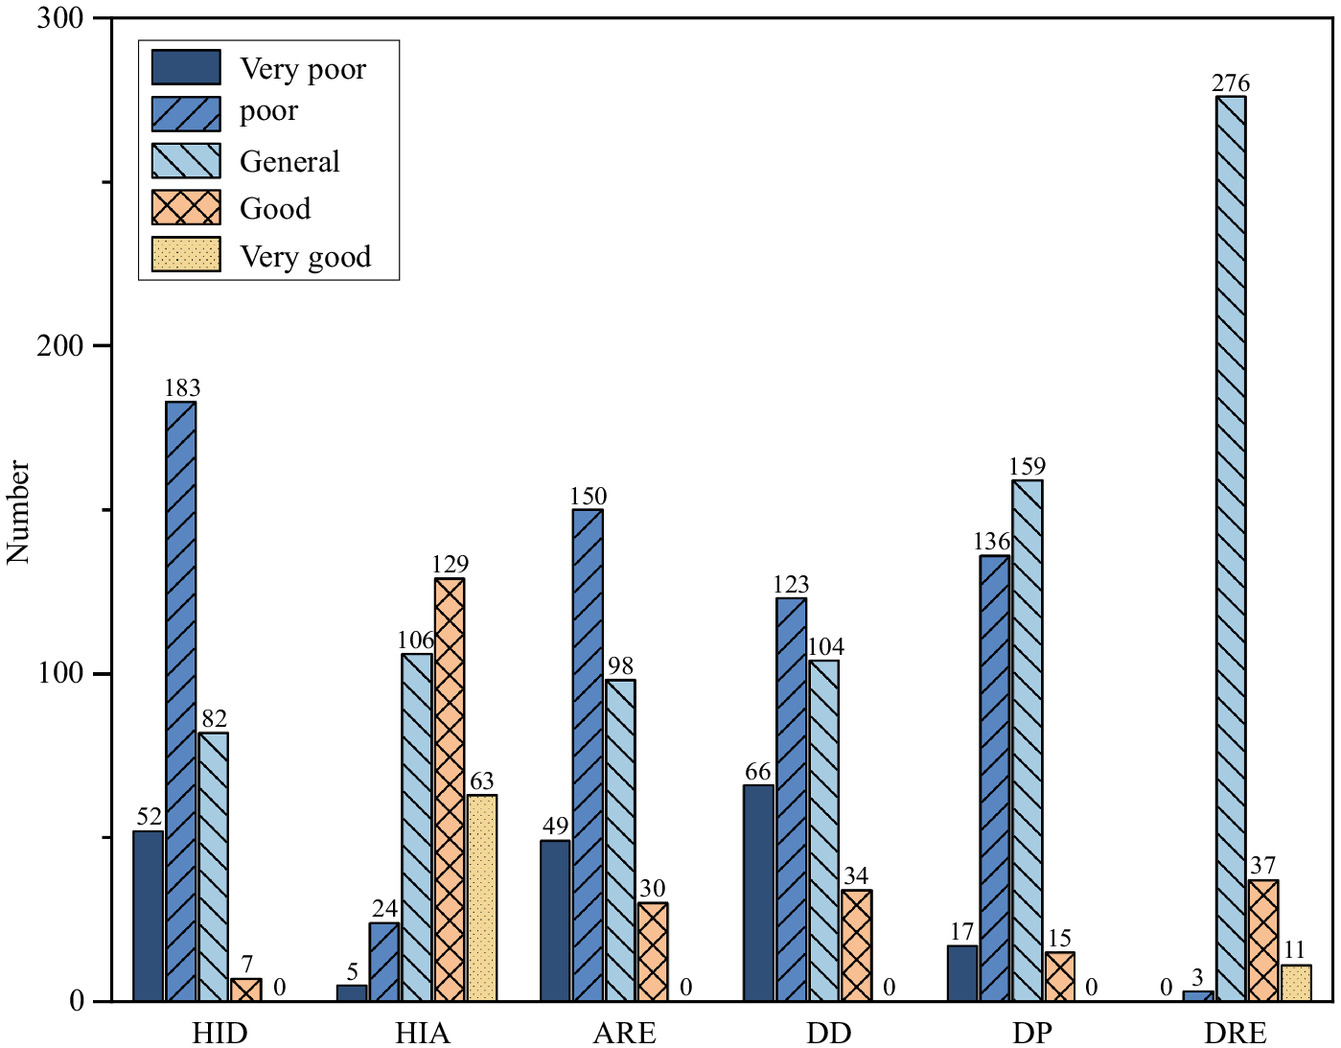
For HID and HIA, data distribution and rating criteria are shown in Table 3 and Fig. 5. The results showed that 57% of participants had poor HID, ranging from 0.2 to 0.4, and 25% of that were general, ranging from 0.4 to 0.6, meaning the ability for participants to identify hazards need to be improved. For HIA, 40% of participants had good HIA, and 32% of them had general HIA, meaning in identified hazards, the accuracy was at a good level.
| HID | HIA | Rate | Value |
|---|---|---|---|
| Very poor | 1 | ||
| Poor | 2 | ||
| General | 3 | ||
| Good | 4 | ||
| Very good | 5 |
Calculation of Risk Evaluation Ability
The indicators of risk evaluation ability are ARE, DD, DP, and DRE. The descriptive statistics are shown in Table 4, and Fig. 4.
| Indicators | Average | Standard error | Median | Minimum | Maximum | Skewness |
|---|---|---|---|---|---|---|
| ARE | 0.401 | 0.0096 | 0.400 | 0 | 0.8 | 0.133 |
| DD | 1.2863 | 0.0362 | 1.1861 | 0.2533 | 2.4558 | 0.343 |
| DP | 1.0028 | 0.0252 | 0.9478 | 0.3233 | 3.8669 | 1.618 |
| DRE | 0.7237 | 0.0117 | 0.7674 | 0.0639 | 1.6753 |
Data distribution and rating criteria are shown in Tables 5 and 6 and Fig. 5. The results showed that 46% of participants’ ARE was poor, and 30% of that was general, indicating that the ability of participants to judge risk correctly needed improvement. For the deviation degree of the expected damage, 38% of participants had poor DD, 32% of them had general DD, and 20% had very poor DD, indicating that when judging damage of the hazards, participants had a large bias. During the judgment of the probability, the results showed 49% of participants had a general rate of DP, 42% of participants had a poor rate of DP, and 5% of participants had a very poor rate of DP, yielding participants had a bias in the judgment of probability. For the deviation DRE, 85% of participants’ DRE rates were general, and 11% were good, indicating participants could judge risk level more correctly than damage and probability. As mentioned in 2.4.3, every indicator was classified into five degrees, and every degree was assigned a value (shown in Tables 5 and 6). The value would be used to calculate the RPA.
| ARE | Rate | Value |
|---|---|---|
| Very poor | 1 | |
| Poor | 2 | |
| General | 3 | |
| Good | 4 | |
| Very good | 5 |
| DD | DP | DRE | Rate | Value |
|---|---|---|---|---|
| Very poor | ||||
| Poor | ||||
| General | ||||
| Good | ||||
| Very good |
Calculation of RPA
As mentioned earlier, the assigned value was utilized to compute the RPA. Here is an example to illustrate how it functions. For instance, if ARE equals 0.25, the corresponding value would be 2 (shown in Table 5). Subsequently, the value of 2 was inserted into Eq. (2) at the position ARE.
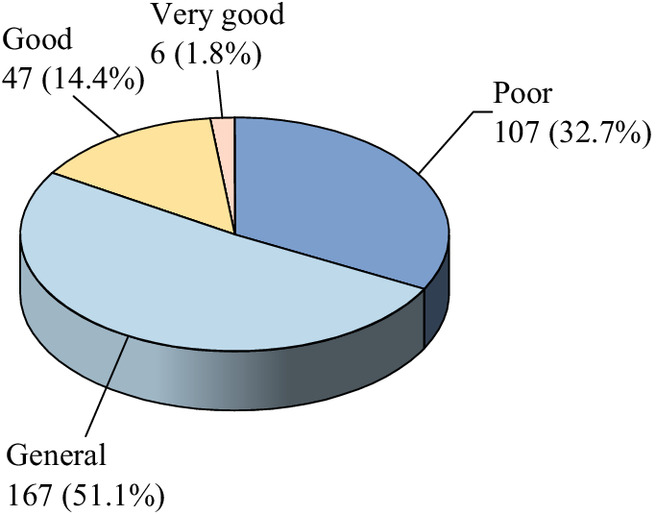
Descriptive statistics of RPA are shown: , standard , , , . According to the results, we used five risk ratings to assess construction professionals’ perception condition of risks (shown in Table 7). The results indicated that 329 construction professionals’ RPA ranged from 1.638 to 3.682, and the average grade was 2.6843. For 327 construction professionals, 32.72% of them had a poor RPA, 50.76% of them had a general RPA, and 15.60% of them had a superior RPA (shown in Fig. 6).
| Risk perception ability | Grade |
|---|---|
| Very poor | |
| Poor | |
| General | |
| Good | |
| Very good |
RPA between Workers and Managers
The Results of Workers’ RPA
The results of workers’ RPA are shown in Table 8. To statistics, 38.43% of workers’ risk perception ability ranged from 1.5 to 2.5, meaning they had poor ability to identify and evaluate hazards; 54.90% of workers’ RPA ranged from 2.5 to 3.0, indicating that their risk perception ability in the medium level; 7.45% of workers’ RPA between 3.0 and 3.5, showing they had the superior risk perception ability.
| Mean | Standard error | Median | Minimum | Maximum | Skewness |
|---|---|---|---|---|---|
| 2.5981 | 0.0189 | 2.6430 | 1.638 | 3.187 |
The Results of Managers’ RPA
The results of managers’ RPA are shown in Table 9. The results revealed that 12.5% of managers’ risk perception ability was poor, ranging from 1.5 to 2.5; 36.11% of managers’ RPA was at the medium level, ranging from 2.5–3.0; 44.44% of managers had superior RPA, whose RPA were between 3.0 and 3.5.
| Mean | Standard error | Median | Minimum | Maximum | Skewness |
|---|---|---|---|---|---|
| 2.982 | 0.042 | 3.017 | 1.961 | 3.682 |
Differences of Indicators between Workers and Managers
Using SPSS software, we conducted a Mann-Whitney U test to analyze risk perception differences between workers and managers. The results indicated that the significant of HIA, HID, DD, DP, and RPA less than 0.5 yields that the differences in these indicators between workers and managers were significant (Table 10). Workers’ DD () and DP () were significantly larger than those of managers. Meanwhile, the HIA (), HID (), and RPA () of workers were significantly smaller than those of managers. Accordingly, the condition of hazard identification and evaluation differed in different positions, and managers’ RPA was significantly superior to workers’.
| Items | Indicators | Mann–Whitney U | Wilcoxon | Mean rank | Significance | ||
|---|---|---|---|---|---|---|---|
| Worker | Manager | ||||||
| 1 | HID | 5,068.000 | 37,708.000 | 147.87 | 221.11 | 0.000*** | |
| 2 | HIA | 6,885.000 | 39,525.000 | 155.00 | 195.88 | 0.001** | |
| 3 | ARE | 8,864.000 | 41,504.000 | 162.76 | 168.39 | 0.650 | |
| 4 | DD | 5,175.000 | 7,803.000 | 179.71 | 108.38 | 0.000*** | |
| 5 | DP | 6,250.500 | 8,878.500 | 175.49 | 123.31 | 0.000*** | |
| 6 | DRE | 8,747.000 | 41,387.000 | 162.30 | 170.01 | 0.541 | |
| 7 | RPA | 3,816.500 | 36,456.500 | 142.97 | 238.49 | 0.000*** | |
Note: Asymptotic significances are displayed. The significance level is 0.050. *, **, and ***.
Discussion
Design of Indicators
Previous studies explored risk perception mainly from two stages: perceptual and cognitive processes. While exploring differences in risk perception between new drivers and experienced drivers, Tang et al. (2014) divided the processing of risk perception into perceptual and cognitive processes. Applying neuroscience, Ma et al. (2010) explored the identification mechanism of safety signs and established a two-stage model of risk perception, the early automatic attention stage, and the evaluation stage. However, in the field of construction, scholars have primarily focused on hazard identification, with some scholars measuring risk perception abilities solely from this perspective (Crick and McKenna 1992). The critical component of risk evaluation in risk perception should not be overlooked. Extensive research has been conducted to study risk evaluation in risk perception (Li 2005; Perlman et al. 2014), but not in RPA. Building upon this, our study encompasses both hazard identification and risk evaluation in measuring risk perception abilities. We have developed six indicators to measure individuals’ risk perception abilities from two parts: hazard identification ability and risk evaluation ability. To assess the abilities, we have used both questionnaires and behavioral experiments, measuring 327 construction professionals’ risk perception abilities. In our study, a person with higher RPA is characterized as identifying hazards correctly, judging the probability and damage of potential accidents, and the risk level of hazards objectively and rightly. In contrast, those with lower RPA tend to identify hazards wrongly or partially and may overestimate or underestimate the probability, damage, and risk level, leading to a larger deviation in risk perception.
The distributions of indicators and RPA we measured are shown in Table 11. Regarding indicators of the hazard identification stage, 57% of participants’ HID was poor, with 25% being categorized as general; 40% of participants had good HIA; and 32% of them had general hazard identification accuracy. So combined, construction professionals have difficulty in identifying all hazards depicted in pictures; however, they have high accuracy in their identified hazards, reflecting they rarely recognize normal scenes as hazards but could not identify hazards comprehensively.
| Indicators | Measurement (sample size = 327) | ||||
|---|---|---|---|---|---|
| Very poor | Poor | General | Good | Very good | |
| HID | 16% | 57% | 25% | 2% | 0% |
| HIA | 2% | 7% | 32 | 40 | 19 |
| ARE | 15 | 46 | 30 | 9 | 0 |
| DD | 20 | 38 | 32 | 10 | 0 |
| DP | 5 | 42 | 49 | 4 | 0 |
| DRE | 0 | 1 | 85 | 11 | 3 |
| RPA | 0 | 33 | 51 | 14 | 2 |
In terms of indicators in the risk evaluation stage, 46% of participants had poor ARE (S-ARE), while 30% had general ARE; 38% of participants’ deviation degree of the expected damage (S-DD) was poor, and 32% of that were general; 49% participants had a poor rate of deviation DP (S-DP), and 49% participants had general rate; and 85% participants’ deviation DRE (C-DRE) was general. Except for the deviation DRE rate, other indicators were mainly in general or poor level. Construction professionals struggle to evaluate the risk level accurately, the deviation exists when they evaluate risk level. Subsequently, the deviation of expected damage and probability was large, suggesting that construction professionals fail to correctly comprehend the expected harm and probability of hazards.
The results presented show that the measurement indicators for construction professionals can vary. Focused on differences in risk perception, previous studies indicated that managers’ risk perception was significantly different from that of the general public (Li et al. 2018), different groups judged risks differently in the construction industry (Zhao et al. 2016), different genders also had different risk perception (Alsharawy et al. 2021), and risk perception varies from ages (Rosi et al. 2021). From data analysis in our study, the HIA (), HID (), DD (), and DP () of workers were significantly different from managers. The results revealed that the discrepancy in RPA between workers and managers existed in our study. To some extent, the measurement results of indicators can indicate the rationality of indicator design.
The Calculation of RPA
In the calculation process, the determination of indicator weights considers not only expert recommendations but also objective data, thereby enhancing the persuasiveness of the obtained results in measuring RPA. After that, Eq. (2) was obtained.
The indicators, such as HID, HIA, and ARE, showed the right rate and identification number of participants. So, they are positively correlated with RPA. Indicators, such as deviation degree of the DD, DP, and DRE, which indicated the deviation of risk evaluation, were negatively correlated with RPA. As to the results of RPA, for 327 construction professionals, 32.72% of them had a poor risk perception ability, 50.76% of them had a general risk perception ability, and 15.60% of them had a superior risk perception ability, revealing the differences in risk perception abilities among construction professionals.
Managers’ RPA was larger than workers’ (), meaning managers’ risk perception ability was superior to workers. The results proved the risk perception discrepancy between workers and managers exists, which was the same as Song and Zhang (2022).
In conclusion, the ways of calculating risk perception we proposed can used to measure construction professionals’ RPA. This calculation method effectively demonstrated differences in abilities among construction professionals and between workers and managers. It is scientifically valid to a certain extent.
Implication
The method proposed in this article expands upon previous research on risk perception abilities, specifically focusing on risk perception abilities in construction safety. Our measurement offered a comprehensive and systematic examination of individuals’ risk perception abilities by considering two parts of RPA: hazard identification ability, and risk evaluation ability which was neglected by previous study.
From a practical perspective, the proposed method for measuring risk perception abilities is straightforward and easily implementable. It has broad applicability not limited to the field of construction safety but extends to other industries as well. This method effectively evaluates workers’ ability to identify hazards and evaluate risks, enabling management to assess the effectiveness of safety training. Moreover, by utilizing various types of hazard pictures, workers can undergo testing to identify any misconceptions in hazard identification and pinpoint shortcomings in their understanding of risks. This, in turn, facilitates the development of tailored and targeted safety training programs, which are aimed at enhancing workers’ risk perception abilities and expanding their knowledge of risks.
To achieve this, additional training and resources should be provided to expand their knowledge and understanding of hazards. Safety training should be conducted to increase personnel’s sensitivity to hazards. By watching videos or pictures, hazards ought to be introduced thoroughly to increase construction professionals’ familiarity with hazards. Moreover, construction professionals should strengthen their ability to recognize hazards’ risk levels, expected damage, and probability. Combined with accident cases, a detailed and comprehensive explanation of these factors can help them to understand hazards more deeply. An accurate and objective judgment not only helps workers avoid unsafe behaviors but also assists managers in making the proper decision for safety management.
Limitations and Future Research
We formulated a novel evaluation method to measure construction practitioners’ RPA. The results revealed that managers’ risk perception abilities were superior to workers’. Nevertheless, there were certain shortcomings in the research, which should be addressed in future studies.
Primarily, the RPA covers two parts: a questionnaire survey and a behavioral experiment. The samples selected for this research were representative of front-line construction practitioners, whereas the hazard stimulus materials included various risks associated with construction sites. However, some studies showed that flat stimuli can potentially distort information, consequently biasing subjects’ understanding of risk information. Subsequent studies should consider the use of real-scene videos or VR scene simulations as hazardous stimulus materials. Second, this paper mainly measures subjects’ RPA through subjective judgments, and no objective physiological data were considered or analyzed. Some scholars combined neuroscience techniques such as electroencephalography (EEG) and functional magnetic resonance imaging (fMRI) to study the risk perception process (Ma et al. 2010; Qin and Han 2009). Scholars such as Zhang et al. (2021) also proposed the necessity of using neuroscience techniques to study risk perception. In future studies, research methods should be broadened, such as using event-related potentials to study brain activity during hazard identification and risk evaluation. Finally, to effectively apply the measurement of RPA, we should consider how to conduct the measurement through automatic processes, such as developing a software program.
Conclusion
A measurement method of RPA was proposed with six indicators. Then, 327 construction professionals’ RPA was measured. The results indicated that RPA varied among construction professionals, and the risk perception discrepancy between workers and managers existed. The main content of the research is presented as follows.
An indicators system used to measure RPA was designed. Indicators concluded HID, HIA, risk ARE, DD, DP, and DRE. Then, we proposed a formula to calculate RPA as shown in Eq. (2).
The measurement proposed can evaluate construction professionals’ risk perception ability scientifically and comprehensively. Also, this measurement expands previous research on risk perception abilities, specifically focusing on risk perception abilities in construction safety.
Appendix. Meanings of Indicators
| Items | Indicators | Calculation formula | Explanation |
|---|---|---|---|
| Hazard identification ability | Hazard identification degree | The correct ratio identifying hazards in the total in complex scenarios | |
| Hazard identification accuracy | The correct ratio of identified hazards in complex scenarios | ||
| Risk evaluation ability | Accuracy of risk evaluation | The correct ratio evaluating risk level in simple scenarios | |
| Deviation degree of the expected damage | The deviation when evaluating expected damage of hazards in simple scenarios | ||
| Deviation degree of the probability | The deviation when evaluating the probability of accidents that hazards caused in simple scenarios | ||
| Deviation degree of risk evaluation | The deviation when evaluating the risk level of hazards in complex scenarios |
Note: = answer of damage level; = damage level judged subjectively; = number of risk pictures; = number of risk pictures judged risk correctly; = number of hazards in the picture; = number of hazards identified correctly; = answer of probability; = probability judged subjectively; = answer of risk level; = risk level judged subjectively; and = number of hazards identified.
Data Availability Statement
Some or all data, models, or codes generated or used during the study are available from the corresponding author by request.
Acknowledgments
This work was supported by the Natural Science Foundation of Hunan Province (No. 2021JJ00).
References
Alsharawy, A., R. Spoon, A. Smith, and S. Ball. 2021. “Gender differences in fear and risk perception during the COVID-19 pandemic.” Front. Psychol. 12 (Aug): 689467. https://doi.org/10.3389/fpsyg.2021.689467.
Atefeh, M., K. Mehdi, K. Ebrahim, B. Michael, and M. Ann. 2018. “Measures of mental alertness of construction workers to enhance job site safety.” In Proc., Construction Research Congress, 262–271. Reston, VA: ASCE. https://doi.org/10.1061/9780784481288.026.
Borowsky, A., D. Shinar, and T. Oron-Gilad. 2010. “Age, skill, and hazard perception in driving.” Accid. Anal. Prev. 42 (4): 1240–1249. https://doi.org/10.1016/j.aap.2010.02.001.
Casutt, G., N. Theill, M. Martin, M. Keller, and L. Jaencke. 2014. “The drive-wise project: Driving simulator training increases real driving performance in healthy older drivers.” Front. Aging Neurosci. 6 (May): 85. https://doi.org/10.3389/fnagi.2014.00085.
Chen, J., X. Song, and Z. Lin. 2016a. “Revealing the ‘Invisible Gorilla’ in construction: Estimating construction safety through mental workload assessment.” Autom. Constr. 63 (Mar): 173–183. https://doi.org/10.1016/j.autcon.2015.12.018.
Chen, J. X. 2018. “Study on the theoretical framework of game theory: The construction of the theoretical system.” J. Chongqing Univ. Technol. 32 (1): 88–95. https://doi.org/10.3969/j.issn.1674-8425(s).2018.01.01.
Chen, S., Y. Chen, J. P. Wang, and Z. Li. 2016b. “Risk perception ability of crane driver in hoisting Bailey truss of Three Gorges ship lift.” China Saf. Sci. J. 26 (1): 22–27. https://doi.org/10.16265/j.cnki.issn1003-3033.2016.01.004.
Cheshmidari, M. N., A. H. H. Ardakani, H. Alipor, and S. Shojaei. 2017. “Applying Delphi method in prioritizing intensity of flooding in Ivar watershed in Iran.” Spatial Inf. Res. 25 (2): 173–179. https://doi.org/10.1007/s41324-017-0086-6.
Crick, J., and F. McKenna. 1992. “Hazard perception: Can it be trained?” Accessed July 1, 1992. https://www.semanticscholar.org/paper/HAZARD-PERCEPTION%3A-CAN-IT-BE-TRAINED-Crick-McKenna/d18319e4253b26c5a5f6633333dfc03becc62b9a.
Dzeng, R.-J., C.-T. Lin, and Y.-C. Fang. 2016. “Using eye-tracker to compare search patterns between experienced and novice workers for site hazard identification.” Saf. Sci. 82 (Feb): 56–67. https://doi.org/10.1016/j.ssci.2015.08.008.
Fan, Z. P., Q. Zhang, and J. Ma. 1998. “An integrated approach to weight determination in multi-attribute decisions.” J. Manage. Sci. China 1 (3): 52–55.
Farrand, P., and F. Mckenna. 2001. “Risk perception in novice drivers: The relationship between questionnaire measures and response latency.” Transp. Res. 4 (3): 201–212. https://doi.org/10.1016/S1369-8478(01)00024-9.
Joukar, A., I. Nahmens, and C. Harvey. 2016. “An AHP-Based selection model for ranking potential strategies for managing construction’s cost volatilities.” In Proc., Construction Research Congress 2016: Old and New Construction Technologies Converge in Historic San Juan, edited by J. L. Perdomo-Rivera, A. Gonzalez-Quevedo, C. Lopez DelPuerto, F. Maldonado-Fortunet, and O. I. Molina-Bas, 616–626. Reston, VA: ASCE.
Li, J., S. Zhang, D. D. Li, and X. Z. Shi. 2018. “Research progress and analysis of occupational health and safety risk perception based on risk perception theory.” J. Saf. Sci. Technol. 14 (11): 166–173. https://doi.org/10.11731/j.issn.1673-193x.2018.11.027.
Li, J. Y. 2005. “Evaluation on public risk perception: A case study on college students.” J. Nat. Disasters 14 (6): 153–156.
Li, L., Z. X. Xv, W. D. Yu, and S. C. Tian. 2012. “Fuzzy optimization and CRITIC method based initial water right allocation of river basin a case of Zhangweinan Canal Sub-basin.” Water Resour. Hydropower Eng. 43 (7): 32–35. https://doi.org/10.13928/j.cnki.wrahe.2012.07.017.
Li, R., Y. Li, H. Xu, H. Liu, S. Miao, J. Chen, and J. Cai. 2014. “Assessment on typical power supply mode for important power consumers based on analytical hierarchy process and expert experience.” Dianwang Jishu/Power Syst. Technol. 38 (9): 2336–2341. https://doi.org/10.13335/j.1000-3673.pst.2014.09.004.
Liang, B., and Y. Lin. 2018. “Using physiological and behavioral measurements in a picture-based road hazard perception experiment to classify risky and safe drivers.” Transp. Res. Part F Traffic Psychol. Behav. 58 (Oct): 93–105. https://doi.org/10.1016/j.trf.2018.05.024.
Liang, Z. D. 2022. “A study of the influential factors and intervention of the coal miners’ unsafe behaviors retrieved.” Doctor’s thesis, Management Science and Engineering, China Univ. of Mining and Technology.
Ma, Q., J. Jin, and L. Wang. 2010. “The neural process of hazard perception and evaluation for warning signal words: Evidence from event-related potentials.” Neurosci. Lett. 483 (3): 206–210. https://doi.org/10.1016/j.neulet.2010.08.009.
Mann, C., and S. E. Wolfe. 2016. “Risk perceptions and terror management theory: Assessing public responses to urban flooding in Toronto, Canada.” Water Resour. Manage. 30 (8): 2651–2670. https://doi.org/10.1007/s11269-016-1308-8.
Martin, I. M., H. Bender, and C. Raish. 2007. “What motivates individuals to protect themselves from risks: The case of wildland fires.” Risk Anal. 27 (4): 887–900. https://doi.org/10.1111/j.1539-6924.2007.00930.x.
McKenna, F. P., and J. L. Crick. 1992. “Experience and expertise in hazard perception.” In Behavioural research in road safety, edited by G. B. Grayson and J. F. Lester. Crowthorne, UK: Transport and Road Research Laboratory.
Na, Y., J. Z. Li, and G. R. Feng. 2019. “A cross-level influence of group cognition on individual unsafe behavior intention.” China Saf. Sci. J. 29 (2): 13–19. https://doi.org/10.16265/j.cnki.issn1003-3033.2019.02.003.
Perlman, A., R. Sacks, and R. Barak. 2014. “Hazard recognition and risk perception in construction.” Saf. Sci. 64 (Apr): 22–31. https://doi.org/10.1016/j.ssci.2013.11.019.
Peter, J. P., and M. J. Ryan. 1976. “An investigation of perceived risk at the brand level.” J. Mark. Res. 13 (2): 184–188. https://doi.org/10.1177/002224377601300210.
Pradhan, A. K., K. R. Hammel, and R. DeRamus. 2003. “The use of eye movements to evaluate the effects of driver age on risk perception in an advanced driving simulator.” In Proc., 82nd Annual Meeting of the Transportation Research Board. Washington, DC: Transportation Research Board.
Qiao, J., X. Xv, C. P. Liu, J. W. Zhao, and Y. T. Liu. 2022. “Review on affecting factors and intervention methods of drivers’ hazard perception ability.” China Saf. Sci. J. 32 (2): 34–41. https://doi.org/10.16265/j.cnki.issn1003-3033.2022.02.006.
Qin, J., and S. Han. 2009. “Neurocognitive mechanisms underlying identification of environmental risks.” Neuropsychologia 47 (2): 397–405. https://doi.org/10.1016/j.neuropsychologia.2008.09.010.
Rasmussen, J. 1986. “Information processing and human-machine interaction: An approach to cognitive.” In Engineering. Amsterdam, Netherlands: Elsevier.
Rosen, L., and I. Kostjukovsky. 2015. “Parental risk perceptions of child exposure to tobacco smoke.” BMC Public Health 15 (Aug): 90. https://doi.org/10.1186/s12889-015-1434-x.
Rosenbloom, T., R. Mandel, Y. Rosner, and E. Eldror. 2015. “Hazard perception test for pedestrians.” Accid. Anal. Prev. 79 (Jun): 160–169. https://doi.org/10.1016/j.aap.2015.03.019.
Rosi, A., F. T. van Vugt, S. Lecce, I. Ceccato, M. Vallarino, F. Rapisarda, T. Vecchi, and E. Cavallini. 2021. “Risk perception in a real-world situation (COVID-19): How it changes from 18 to 87 years old.” Front. Psychol. 12 (Apr): 646558. https://doi.org/10.3389/fpsyg.2021.646558.
Safi, A. S., W. J. Smith, and Z. Liu. 2012. “Rural Nevada and climate change: Vulnerability, beliefs, and risk perception.” Risk Anal. 32 (6): 1041–1059. https://doi.org/10.1111/j.1539-6924.2012.01836.x.
Salmon, P. M., K. L. Young, and M. Cornelissen. 2013. “Compatible cognition amongst road users: The compatibility of driver, motorcyclist, and cyclist situation awareness.” Saf. Sci. 56 (Jul): 6–17. https://doi.org/10.1016/j.ssci.2012.02.008.
Seo, D. C. 2005. “An explicative model of unsafe work behavior.” Saf. Sci. 43 (3): 187–211. https://doi.org/10.1016/j.ssci.2005.05.001.
Shappell, S., and D. Wiegmann. 2000. “The human factors analysis and classification system—HFACS.” Office of Aviation Medicine 72: 1006–1016.
Siegrist, M., and J. Arvai. 2020. “Risk perception: Reflections on 40 years of research.” Risk Anal. 40 (Jun): 2191–2206. https://doi.org/10.1111/risa.13599.
Song, Y., and S. Zhang. 2022. “The differences in risk perception between practitioners in the non-coal-mining industry: Miners, managers and experts.” Toxics 10 (10): 623. https://doi.org/10.3390/toxics10100623.
Spicer, R. A. 1964. Human factors in traffic accidents. Final report USPHS Research Grant No.AC-O0055. May 1964. Honolulu: Dept. of Health.
Su, G. N., X. Q. Fu, and T. X. Liu. 2014. “Application of improved game theory comprehensive weights in comprehensive evaluation of dam safety.” China Rural Water Hydropower 2014 (11): 82–85.
Tang, Z. H., J. Chen, and Z. N. Fang. 2013. “Causal mechanism of difference between experienced and novice drivers in hazard perception based on fuzzy signal detection theory.” J. Southwest Jiaotong Univ. 48 (3): 532–538. https://doi.org/10.3969/j.issn.0258-2724.2013.03.022.
Tang, Z. H., Z. N. Fang, and J. Cheng. 2014. “Research on the difference in hazard perception of new and old drivers.” Chin. J. Ergon. 20 (1): 59–62. https://doi.org/10.13837/j.issn.1006-8309.2014.01.005.
Tixier, A. J.-P., M. R. Hallowell, A. Albert, L. van Boven, and B. M. Kleiner. 2014. “Psychological antecedents of risk-taking behavior in construction.” J. Constr. Eng. Manage. 140 (11): 04014052. https://doi.org/10.1061/(ASCE)CO.1943-7862.0000894.
Vanlaar, W., and G. Yannis. 2006. “Perception of road accident causes.” Accid. Anal. Prev. 38 (1): 155–161. https://doi.org/10.1016/j.aap.2005.08.007.
Wang, J., P. X. W. Zou, and P. P. Li. 2016. “Critical factors and paths influencing construction workers’ safety risk tolerances.” Accid. Anal. Prev. 93 (Aug): 267–279. https://doi.org/10.1016/j.aap.2015.11.027.
Wang, Z. H. 2018. “Study on the influence of construction workers’ safety cognitive ability on their behavior results Hubei University of Technology.” Master Bachelor’s thesis, School of Civil Engineering Architecture and Environment, Hubei Univ. of Technology.
Wickens, C. D., W. S. Helton, J. G. Hollands, and S. Banbury. 2021. Engineering psychology and human performance. 5th ed. England, UK: Routledge. https://doi.org/10.4324/9781003177616.
Wilson, R. S., A. Zwickle, and H. Walpole. 2019. “Developing a broadly applicable measure of risk perception.” Risk Anal. 39 (4): 777–791. https://doi.org/10.1111/risa.13207.
Wogalter, M., D. DeJoy, and K. Laughery. 1993. “Warnings and risk communication.” In Safety science, 16. London: CRC Press. https://doi.org/10.1016/0925-7535(93)90023-7.
Wogalter, M. S. 2018. “Communication-human information processing (C-HIP) model.” In Forensic human factors and ergonomics, 33–49. London: CRC Press. https://doi.org/10.1201/9780429462269-3.
Wogalter, M. S., M. J. Kalsher, and R. Rashid. 1999. “Effect of signal word and source attribution on judgments of warning credibility and compliance likelihood.” Int. J. Ind. Ergon. 24 (2): 185–192. https://doi.org/10.1016/S0169-8141(98)00025-0.
Xiao, Z. Y. 2014. “Research on the relationship between miners’ risk perception and unsafe behavior.” Master Bachelor’s thesis, College of Safety Science and Engineering, Xi’an Univ. of Science and Technology.
Yang, J. S., W. L. Wang, W. Su, D. T. Yang, and Z. Y. Song. 2014. “Drivers’ hazard perception modeling and experimental analysis.” J. Southeast Univ. 44 (6): 1304–1308.
Zhang, S., Y. F. Huang, and X. Z. Shi. 2021. “Background and foundation analysis of construction of neuro-safety science.” China Saf. Sci. J. 31 (5): 98–105. https://doi.org/10.16265/j.cnki.issn1003-3033.2021.05.015.
Zhao, D., A. P. McCoy, B. M. Kleiner, T. H. Mills, and H. Lingard. 2016. “Stakeholder perceptions of risk in construction.” Saf. Sci. 82 (Jun): 111–119. https://doi.org/10.1016/j.ssci.2015.09.002.
Zhu, G.-N., J. Hu, J. Qi, C.-C. Gu, and Y.-H. Peng. 2015. “An integrated AHP and VIKOR for design concept evaluation based on rough number.” Adv. Eng. Inf. 29 (3): 408–418. https://doi.org/10.1016/j.aei.2015.01.010.
Information & Authors
Information
Published In

Journal of Construction Engineering and Management
Volume 150 • Issue 5 • May 2024
Copyright
This work is made available under the terms of the Creative Commons Attribution 4.0 International license, https://creativecommons.org/licenses/by/4.0/.
History
Received: Mar 22, 2023
Accepted: Dec 5, 2023
Published online: Mar 14, 2024
Published in print: May 1, 2024
Discussion open until: Aug 14, 2024
Authors
Metrics & Citations
Metrics
Citations
Download citation
If you have the appropriate software installed, you can download article citation data to the citation manager of your choice. Simply select your manager software from the list below and click Download.