An Investigation of an Affordable Ventilation Retrofit to Improve the Indoor Air Quality in Australian Aged Care Homes
Publication: Journal of Architectural Engineering
Volume 30, Issue 3
Abstract
Residents in aged care homes constitute a significant proportion of Australia’s population. The elderly population is vulnerable to poor indoor air quality (IAQ). Because mobility declines with age, they tend to spend longer indoors compared with the general population. This study evaluated the effectiveness of an affordable ventilation retrofit to improve the IAQ in aged care homes in Victoria, Australia. The fresh filtered air ventilation system was installed independently of the existing heating, ventilation, and air conditioning (HVAC) system in each facility. The monitoring characterized the ventilation of aged care homes to establish the baseline performance. The results showed that air change rates (ACH) in the common rooms were from 0.84 ACH to 3.81 ACH. This was generally sufficient for low or average occupancy but insufficient when the rooms were fully occupied. Up to a 1,000 ppm reduction in the carbon dioxide (CO2) concentration was achieved with the addition of a supplementary ventilation system. However, there was no reduction in the levels of particulate matter (PM). Local activities and the movement of people inside the room influenced the PM concentration. A systematic approach for the regular monitoring of IAQ, analyzing data, and adopting appropriate interventions is required to better prepare the community and the health systems against the consequences of climate change.
Introduction
The adverse effects of indoor air pollution on the health of the elderly, which potentially leads to various respiratory diseases such as asthma and chronic obstructive pulmonary disease, are well documented. As highlighted during the COVID-19 pandemic, considerable public attention has been drawn to the detrimental impact of poor air quality in aged care homes. The pandemic presented a major global health challenge, particularly for the vulnerable and aged populations and frontline healthcare workers. There are 4.2 million people (16% of Australia’s total population) aged 65 and above in Australia as of June 2020 (AIHW 2021). The number of people in Australia who are in residential aged, home, or transition care is approximately 371,000 (AIHW 2021). This population will increase by 22% by 2061 and 25% by 2101, as projected by ABS (2013). Aged care centers provide accommodation and assistance with day-to-day living for the elderly who can no longer live at home and need continuing help with daily tasks or health care. Aged care centers are known as aged homes, aged care facilities, nursing homes, residential aged care facilities, and elderly care centers.
Due to the decline in mobility in old age, the elderly tend to stay indoors longer than the general population; therefore, they could be significantly affected by the indoor air quality (IAQ). Studies have shown that those above the age of 80 years who stay in poorly ventilated buildings have an increased probability of developing various respiratory diseases even at moderate air pollution concentrations (Maio et al. 2015). In addition, aged people have accumulated lifetime exposure to pollution and natural aging (Simoni et al. 2015). In addition, the impact of climate change is disrupting environmental and human systems, which affects people’s lives. It is important to ensure that the health systems that encompass aged care are resilient and prepared for the stresses and shocks from climate change.
The Australian Government has committed to reducing national emissions to 43% below the 2005 levels by 2030 and to achieve net zero national emissions by 2050. Australia’s first National Health and Climate Strategy Consultation paper (DoHAC 2023) was drafted in recognition of the urgent need to mitigate emissions from the health system and support the community to be better prepared for the health impacts of climate change. Retrofitting buildings was recognized as an enabler for decarbonization in this context. Reusing existing buildings by upgrading them to optimize energy and indoor environmental quality has been identified as a priority for climate resilience by organizations that include the International Energy Agency (IEA 2022) and the State Government of Victoria (DELWP 2022).
The recently published American Society of Heating Refrigerating and Air-Conditioning Engineers (ASHRAE) Standard 241 (ASHRAE 2023) introduces the concept of resilience into IAQ standards. Standard 241 (ASHRAE 2023) established minimum requirements for the control of infectious aerosols to reduce the risk of disease transmission in the occupiable space of buildings by defining “the amount of equivalent clean airflow necessary to substantially reduce the risk of disease transmission during infection risk management mode.” It introduced targets for equivalent clean airflow rates, which buildings were not originally designed to achieve, that indicated that the existing standards were insufficient for airborne disease mitigation. Although Standard 241 (ASHRAE 2023) does not have a separate occupant category for aged care homes, it could be assumed to be similar to healthcare resident rooms where the equivalent clean air flow per person in the breathing zone is 25 L/s, which is more than double the 10–12 L/s per person recommendation by ASHRAE Standard 62.1 (ASHRAE 2022).
The heating, ventilation, and air conditioning (HVAC) systems are often incapable of handling the excessive peak occupancy in individual rooms; however, any modification to the existing system to improve airflow will involve significant costs. Therefore, an appropriate retrofitting strategy is required to ensure sufficient ventilation in rooms with anticipated high occupancy rates. This study aims to characterize the ventilation of Australian aged care homes to establish the baseline performance and assess the effectiveness of an affordable ventilation retrofit to improve the IAQ. Bedrooms in aged care homes are normally occupied individually or by pairs, and common areas, such as activity rooms, gymnasia, dining, and living rooms, are occupied by groups of residents, with occupancy rates varying according to the type of activities (Forcada et al. 2020). These areas are frequently used for recreation, formal and informal gatherings, meetings, or dining and are centrally controlled. This study focused on 10 common rooms in five aged care homes. Bedrooms are not included in this study to avoid privacy concerns that were raised by the aged care providers. In addition, installing the system in the common rooms could benefit a larger number of residents.
IAQ Parameters
The types of pollutants that affect the IAQ in any indoor space are biological, chemical, particle, and aerosol. Aged care homes are similar except for the increased use of disinfectants, medicines, and specific detergents that could introduce polluting and allergenic substances that could create strong odors. Sensitive residents who are susceptible to indoor pollutants at low concentrations (Aguiar et al. 2014; Bentayeb et al. 2015) are the unique difference between regular and care homes. The thermal environment measurements include temperature and humidity, because these parameters increase the concentrations of air pollutants due to the dense air that holds the pollutants (Bentayeb et al. 2015). In addition, the temperature and humidity of a space influence the perception of air quality. The acceptability of the air was reduced with increasing air temperature and humidity levels (Fang et al. 2004; Simonson et al. 2002). This meant that an increased ventilation rate was counteracted by high temperatures and humidity, therefore, further degrading the perceived IAQ.
The common indoor air pollutions elderly people are exposed to include particulate matter (PM) (e.g., PM2.5 and PM10), sulfur dioxide (SO2), nitrogen dioxide (NO2), carbon monoxide (CO), ozone (O3), volatile organic compounds, allergens, and microorganisms (Bentayeb et al. 2013; Maio et al. 2015). Previous research has continuously reported the link between high concentrations of PM2.5 and human health, particularly lung function and respiratory diseases (Lee et al. 2007; Mendes et al. 2016).
Carbon Dioxide Concentration
The carbon dioxide (CO2) concentration is extensively used as a metric of indoor ventilation and, by extension, the IAQ, mainly because it is easy to measure (Allen et al. 2020; Fisk 2017). An indoor CO2 concentration that is higher than the outdoor level is used to estimate ventilation rates using techniques such as the tracer gas method (ASTM 2017, 2018). People’s exhaled breath consists of CO2, which increases with the increased occupancy rate of an enclosed space if ventilation, specifically the outdoor air brought into the space, is insufficient. The build-up of CO2 is considered an indicator of ventilation rate but not a causal factor for human health (Apte et al. 2000). As an informal threshold between adequate and inadequate ventilation, a CO2 concentration of 1,000 ppm has been used. Studies have found a correlation between indoor CO2 concentrations and the frequency of health symptoms and absence in office workers (Milton et al. 2000). In addition, Seppänen et al. (1999) found that the risk of building-related health symptoms continued to decrease significantly when the CO2 concentrations decreased below 800 ppm.
Particulate Matter
The PM is broadly used as a proxy indicator of air pollution and is recognized as one of the pollutants of public health concern by the World Health Organization (WHO). Numerous worldwide studies have assessed that the PM levels indoors are greater than outdoor levels. The USEPA (EPA 2018) suggests that indoor pollutant levels could be higher than outdoor levels and sometimes are up to 100 times higher than outdoor levels. The indoor PM concentration depends on the outdoor weather conditions, the concentration of outdoor particles, the air exchange rate, and particle penetration efficiency from indoor to outdoor environments. The PM2.5 consists of particles of any substances that are <2.5 μm in diameter, the common sources of which are smoke from fires, cooking, and vehicle exhausts. The PM10 consists of particles of any substances that are <10 μm. People are a major source of PM10 indoors. Smaller particles that could penetrate deep into the lungs are more harmful to vulnerable people, because they affect the respiratory health of vulnerable people such as the elderly (Lee et al. 2007). In addition, many studies have shown that a significant number of particles could pass through the cracks around the windows in building facades (Chen et al. 2016).
Pathogens
Microorganisms are abundant in indoor and outdoor environments. Microbes, such as bacteria and molds, propagate rapidly in water and nutrients, such as dust and dirt, which are present in most spaces. The prevention of dampness is one of the most critical factors when controlling microbial growth in indoor environments. Of note, no regulatory or health-based standards or guidelines exist for surface and airborne microbial pollutants. The concentration of contaminants has large temporal and spatial variances. It depends on a number of factors that include outdoor air quality, weather, type of HVAC system and its operation, occupant activities, and the off-gassing of materials. Although most sampling methods do not distinguish between fungal species and comparisons between indoor and outdoor levels are problematic, the relationship between indoors and outdoors could be used as the indicator of a difference between the two environments. For mechanically ventilated buildings, when the indoor fungal count is more than half (>0.5) of the outdoor count, there could be potentially elevated health risks (Kemp and Neumeister 2010, p. 9), and health symptoms should be noted.
IAQ Studies on Aged Care Homes
The IAQ studies on aged care homes ranged from: (1) the measurement of ventilation rates, CO2 levels, and PM; (2) intervention studies that use devices, such as air purifiers and filtration systems; (3) surveying residents on their thermal perception (Forcada et al. 2020; Tartarini et al. 2018); and (4) the correlation of pollutant concentrations with respiratory health (Bentayeb et al. 2013; Lee et al. 2007; Mendes et al. 2016). The following section discusses studies that fall into the first two categories (i.e., the measurement of ventilation rates, CO2 concentration, and PM and intervention studies).
Measurement of Ventilation Rates
Bentayeb et al. (2013), in a review that involved 50 nursing homes in Europe, found that only 19% of the common rooms were well-ventilated. However, the concentrations of indoor air pollutants did not exceed the existing international and national standards. A few studies were reported from Portugal. One of them was a pilot study that involved six aged care homes, where pollutant concentrations above the international reference concentrations were reported in winter (Mendes et al. 2013). A geriatric study on the health effects of air quality in elderly care centers in Portugal found higher levels of PM2.5 in all elderly care centers during summer and winter and reported that the PM concentration was a critical parameter of the IAQ for its sensitivity and its possible influence on human health (Mendes et al. 2015). In addition, in another recent study in Portugal that involved three buildings in two cities, Pinto et al. (2019) reported CO2 concentrations in living rooms that exceeded 1,625 ppm for a mean of 8 h, which was attributed to high occupant density and low air change rates (ACHs). In London care homes, Gupta et al. (2021) reported mean CO2 concentrations of 1,027 ppm during occupied hours with approximately 12 occupants. Overnight, levels were lower but still averaged above 900 ppm. A more recent study that was conducted in two elderly care facilities in France (Baudet et al. 2022) reported CO2 concentrations of 624 ± 198 ppm. Guerra Santin et al. (2021) investigated a range of spaces in a Passivhaus care home for people with dementia in England. They found that in common areas the percentage of time that the CO2 concentration exceeded 900 ppm was highest in winter compared with other seasons.
Ventilation Intervention Studies
Guo et al. (2021) conducted a randomized, double-blind crossover experiment that used portable air purifiers in an aged care center in China and found that the PM concentration significantly reduced within the first 2 h of turning on the purifier. The mean removal effectiveness was 73%, which was significantly affected by the window states. The installation of supplementary ventilation and increasing the efficiency of the filtration are the most common interventions that are used to improve the airflow and reduce the infection risks. These decentralized systems depend on the supply to directly deliver outdoor air to a specific space or extractor fans to remove pollutants from the indoor air. Filtration interventions were mainly trialed on residential buildings (Batterman et al. 2012; Hart et al. 2011; Padró-Martínez et al. 2015; Shao et al. 2017; Xu et al. 2010), which established that pollution concentrations were reduced by indoor air filtration.
Supplementary ventilation systems use natural or mechanical supply or extraction, mechanically balanced, and demand-controlled ventilation (DCV) systems. Zhao et al. (2022) studied eight public buildings in Finland to evaluate the performance of DCV systems and found that malfunctioning systems negatively impacted the potential benefits of DCVs. They found that multiple faults in DCV systems might be undiscovered if a field measurement campaign was not implemented to test the system thoroughly. Heat recovery ventilation (HRV) systems are becoming popular in residential buildings that are designed to be airtight. The HRV system directly delivers outdoor air and replaces indoor air when simultaneously recovering sensible or latent heat (Berquist et al. 2022). In addition, they supply fresh, highly filtered air to improve the IAQ. Cuce and Cuce (2017) investigated the thermal comfort and ventilation of a new HRV system that was integrated into a residential building in the UK and found that desirable conditions were met after retrofitting. Studies on the application of ventilation intervention are limited to aged care homes. The study by Guerra Santin et al. (2021) in a Passivhaus care home for people with dementia found that although an HRV was provided, natural ventilation was used throughout the year, which suggested the need to develop systematic natural ventilation strategies during summer.
Methodology
This study involved five aged care homes (AC1–AC5) and 10 common rooms (Rooms A and B) in these homes. The rooms were selected based on the frequency of use and the ease of installation. The IAQ parameters were measured for over 1 year, from February 2019 to February 2020. The common rooms were used for various functions, such as informal and formal get-togethers, group activities and socials, physical exercises, and dancing. After 6 months of monitoring, a supplementary ventilation system was installed in Room B (intervention room) when maintaining the other rooms (Room A) in each facility for comparison as a base case.
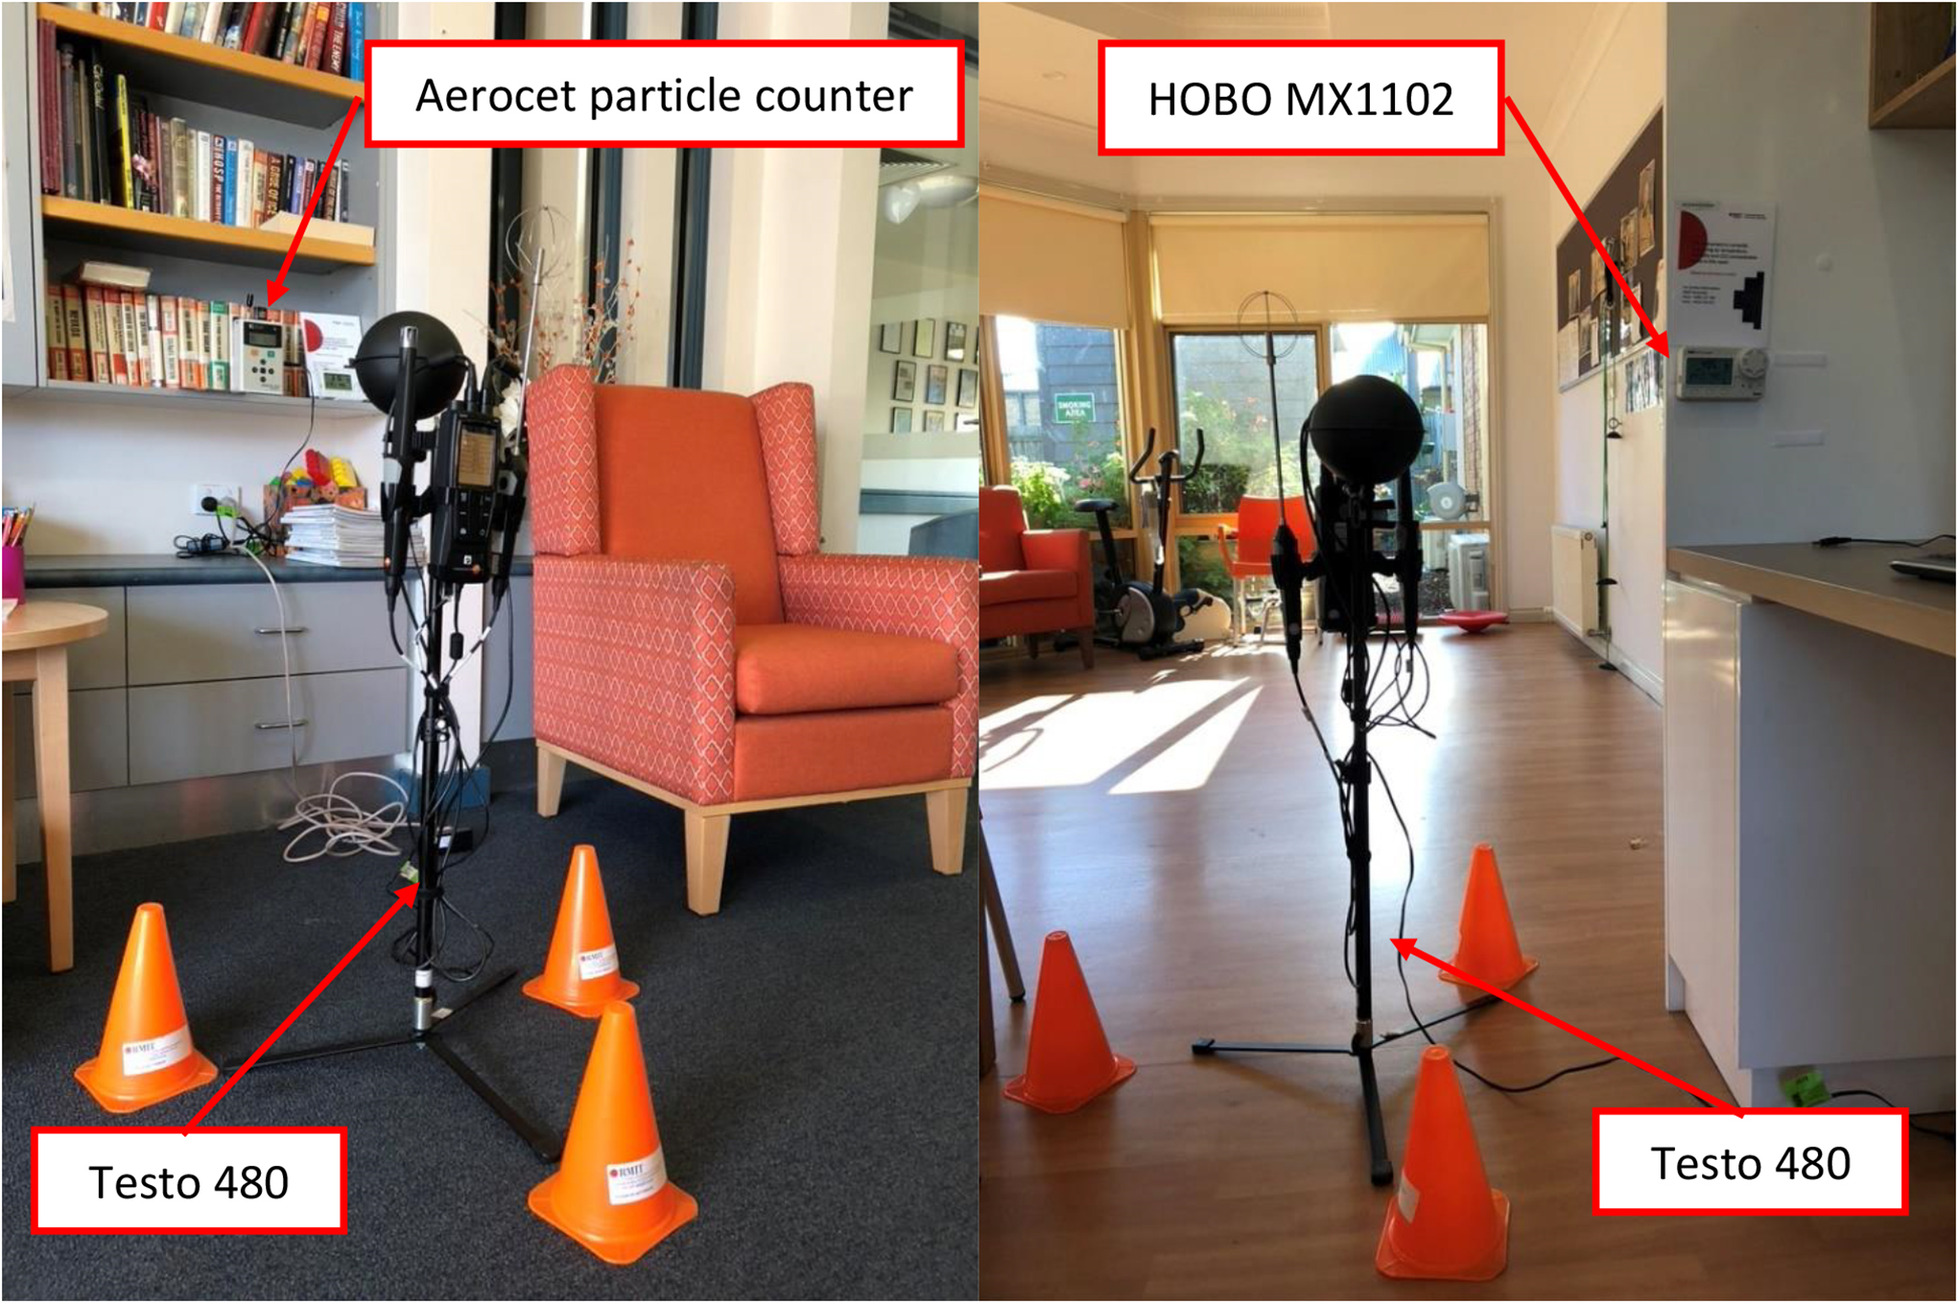
This study involved the collection of short (weekly) and long-term (12-month) data. The HOBO MX1102 (OneTemp, Notting Hill, Victoria, Australia) data loggers were used for long-term monitoring, and the loggers were set to a sampling interval of 15 min according to the ASHRAE (2009) guidelines. The HOBO sensors measured air temperature, relative humidity (RH), and CO2 concentrations and were installed 1.2–1.5 m high near the occupants’ breathing zone. The sensors were placed on a wall at least 2 m from the closest seat (DIN 2007), away from doors, windows, and supply air diffusers. In addition, a Testo 480 unit was installed in the middle of the room, and recordings were monitored for 1 day during the four seasons. The PM levels were recorded for 1 week during the four seasons with the help of an Aerocet particle counter Model 531S. In addition, a TSI DustTrak 8533 was located at 0.85 m adjacent to the Aerocet to acquire data for comparisons and set the k factor that was required for the Aerocet. The instrumentation setup in the room is shown in Fig. 1, and the equipment specification is given in Table S1 . All rooms were mechanically conditioned and ventilated. The external door and windows were closed most of the time, except for during certain periods. Occupant behavior, such as the closing and opening of windows, was noted. After data collection, graphical analyses were conducted to establish patterns, followed by statistical analyses to understand the significance of the observed phenomena.
Characteristics of Aged Care Homes
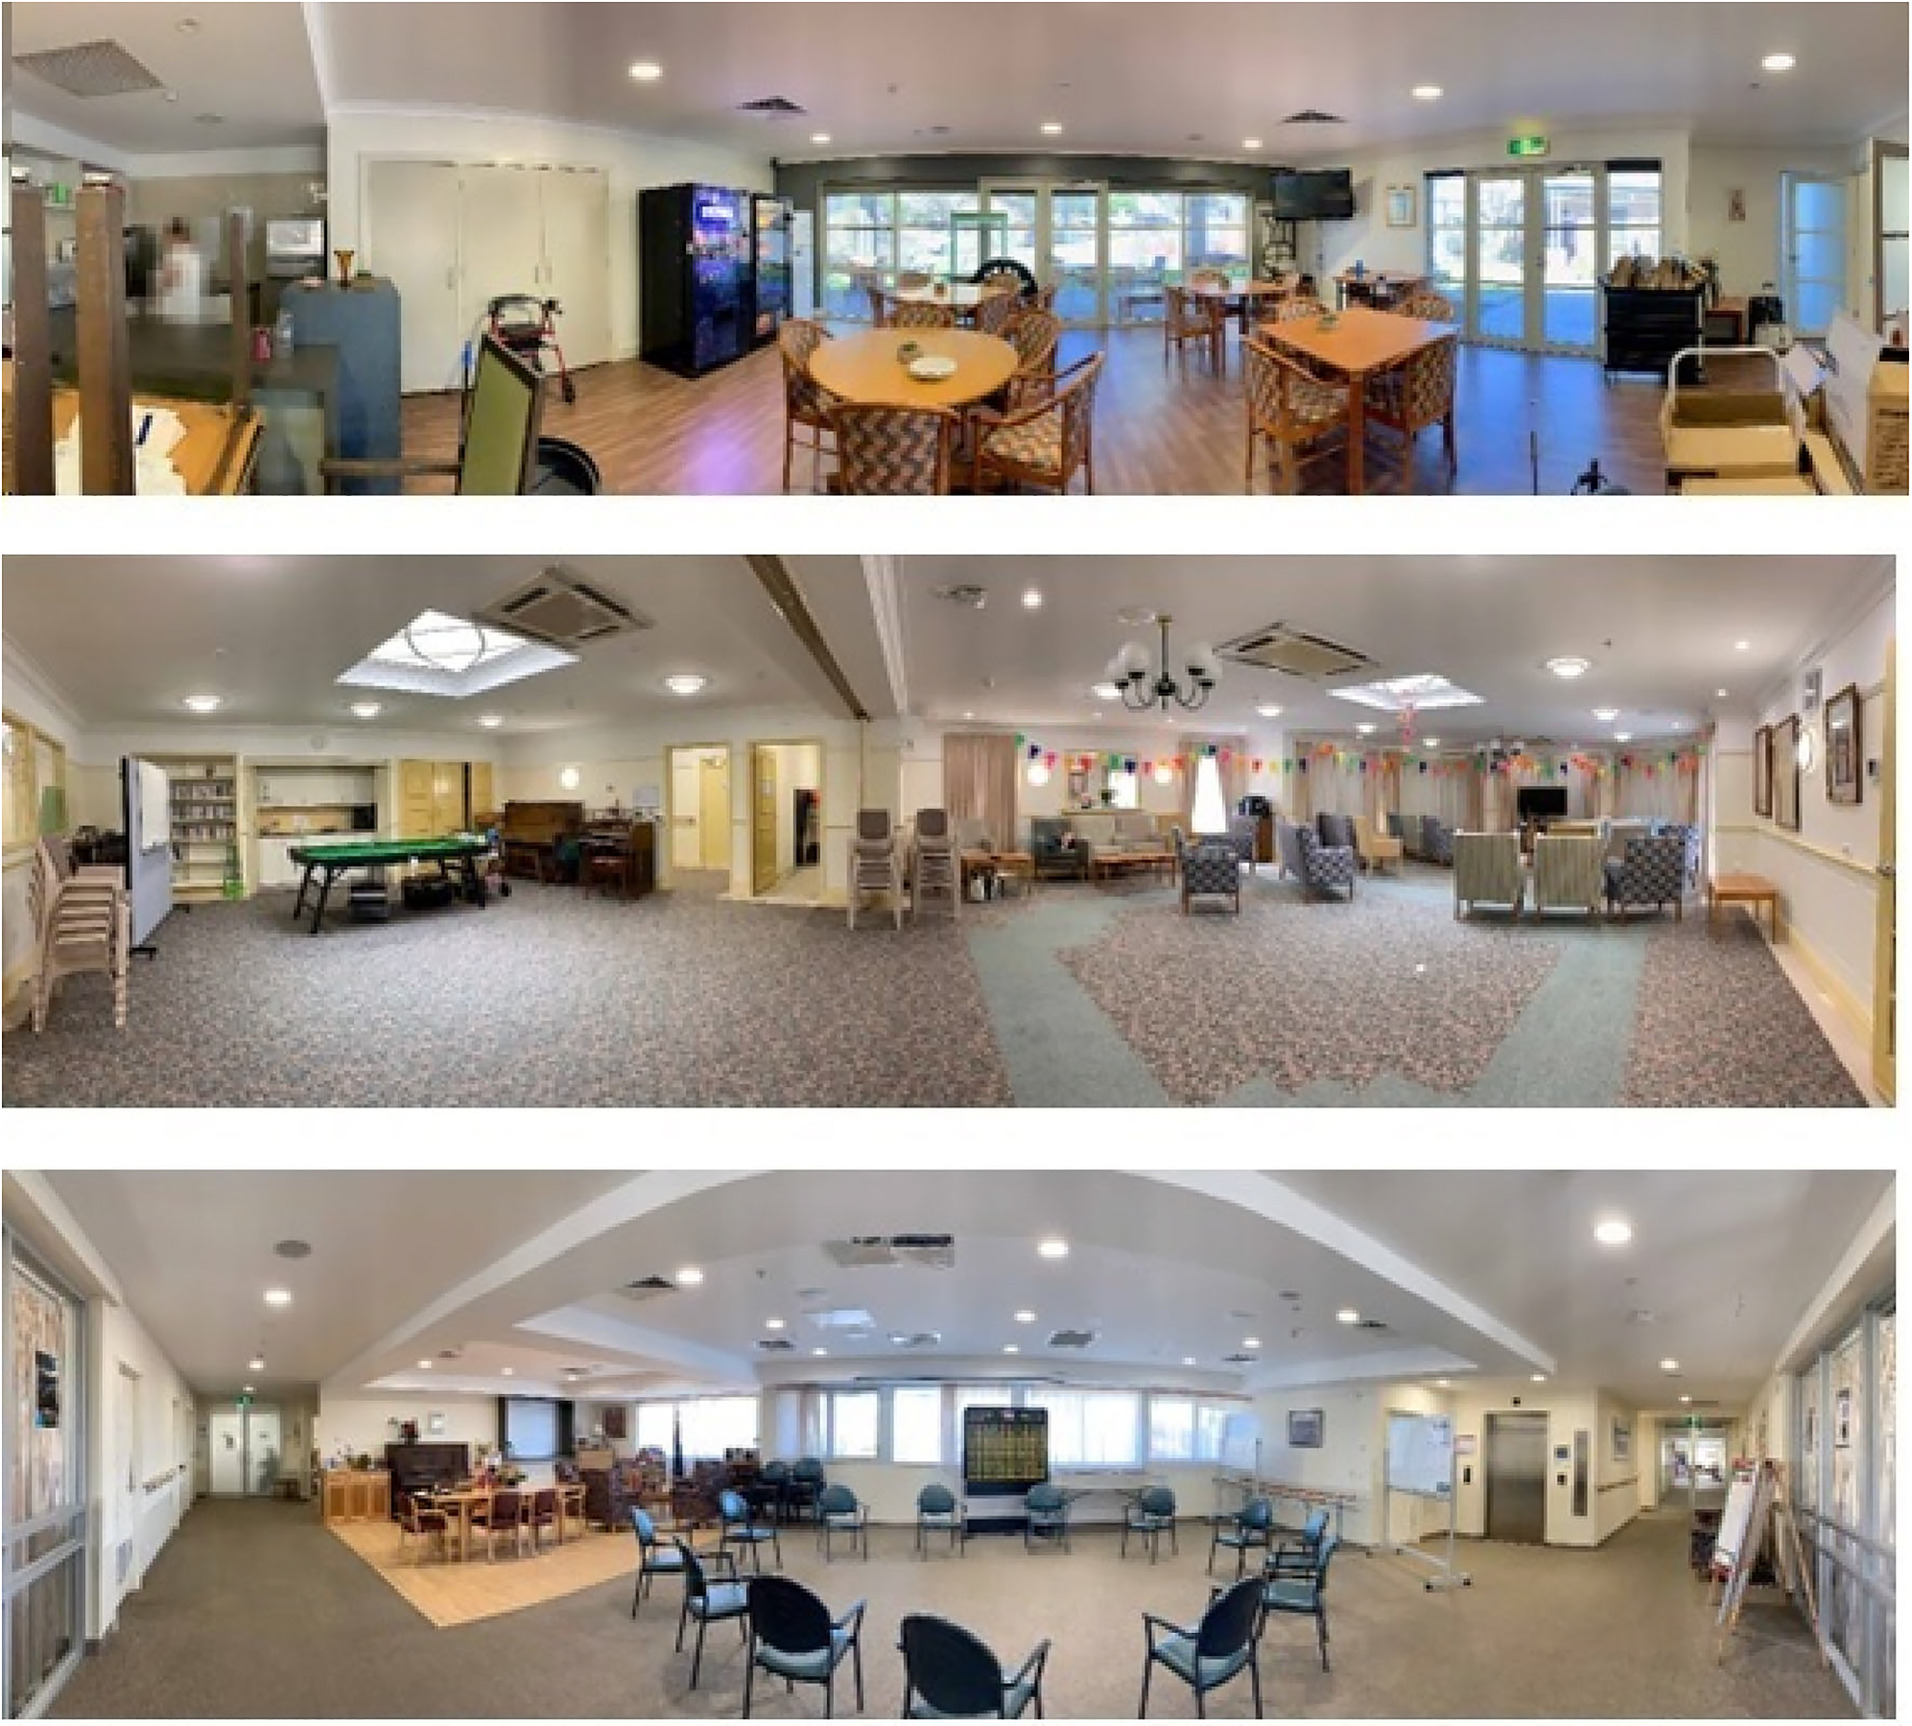
Of the five aged care homes studied, two (AC3 and AC4) were closer to the central business district (CBD) at 16 and 12 km, respectively. The AC1 and AC2 were 43 and 23 km from the CBD. The AC5 was 85 km from Melbourne, in regional Victoria. The AC1–AC4 were in residential suburban areas, and AC5 was just outside the residential area in the north of Geelong. The AC1 was 43 km southeast of Melbourne CBD. In addition, AC2 and AC3 were 23 and 16 km east of Melbourne CBD, respectively. The AC4 was 12 km southeast of Melbourne CBD. All buildings except for AC4 were single-storied and AC4 was double-storied. The exterior facades of the buildings were brick walls, and the interior walls were plaster or gypsum board-lined stud walls. The internal layout of the common rooms in the aged care homes is shown in Fig. 2.
The physical properties of the rooms that include the construction details, area, volume, and ventilation systems, are given in Table 1. The floor area was from 57.8 to 165.0 m2 per room, with an average of 121.1 m2, and the ceiling heights were between 2.4 and 5.3 m. Carpet was the main internal floor finish, and in kitchenettes and dining areas where waterproof or water-resistant flooring was needed, wood or vinyl flooring was used. Most rooms had sufficient daylighting and had roller screens or fabric curtains as internal shading. Six out of 10 rooms were installed with central air conditioning (AC), two with reverse cycle AC, and the other two with ceiling cassette units. In addition, electric heaters were used during winter in some rooms. When there were no activities, none of the occupants were in the room. However, during timetabled events and activities, up to 33 people occupied the rooms.
| Aged care home | Room | Area (m2) | Ceiling height (m) | V (m3) | Level | Construction | Ventilation |
|---|---|---|---|---|---|---|---|
| AC1 | AC1A | 48.4 | 3.19 | 154 | Ground level | Brick walls, tinted glazed windows with internal blinds, and vinyl flooring | Reverse cycle AC, ceiling fans, and panel heaters |
| AC1B | 66.4 | 2.5 | 169 | Ground level | Brick walls, tinted glazed windows with awning, and vinyl flooring | Central AC | |
| AC2 | AC2A | 165.0 | 2.5–5.3 | 616 | Ground level | Timber walls, tinted glazed windows with internal blinds and external louvers, and vinyl flooring | Central AC and electric heater |
| AC2B | 99.5 | 2.7 | 269 | Ground level | Fiber cement-clad walls, windows tinted and with internal blinds and external louvers, and laminated timber flooring | Cassette units and electric heater | |
| AC3 | AC3A | 121 | 3.0 | 363 | Ground level | Brick walls, glazed windows with curtains, and vinyl flooring | Central AC and panel heater |
| AC3B | 141 | 2.5 | 355 | Ground level | Brick walls, tinted glazed windows with curtains, and carpet flooring | Reverse cycle AC and cassette units | |
| AC4 | AC4A | 181 | 3 | 543 | Ground level | Brick/weatherboard walls, tinted windows with curtains, and carpet/wood flooring | Central AC and heating fan |
| AC4B | 192 | 3 | 576 | First level | Brick/weatherboard walls, clear glazed windows with internal shading, and carpet/wood flooring | Central AC and heating fan | |
| AC5 | AC5A windows open | 158.7 | 2.7 | 428.5 | Ground level | Brick walls, clear glazed windows, and carpet flooring | Central AC |
| AC5B | 96.3 | 2.7 | 260 | Ground level | Brick walls, tinted windows, and carpet flooring | Central AC |
Supplementary Ventilation System
The supplementary ventilation system that was installed is simple, lightweight, and easy to open and close for service in narrow-constricted roof or ceiling cavity spaces. The system specification follows.
1.
Dimensions: 800 × 556 × 187 mm (L × W × D).
2.
Duct connections: 150 mm barbed suitable for 150 mm grille vents fitted in the ceiling to supply and return air.
3.
240 V, 50 Hz, and air flow 80 L/s at external static pressure of 90 Pa.
4.
Heat recovery efficiency 86%, noise 30 dB, and weight 20 kg.
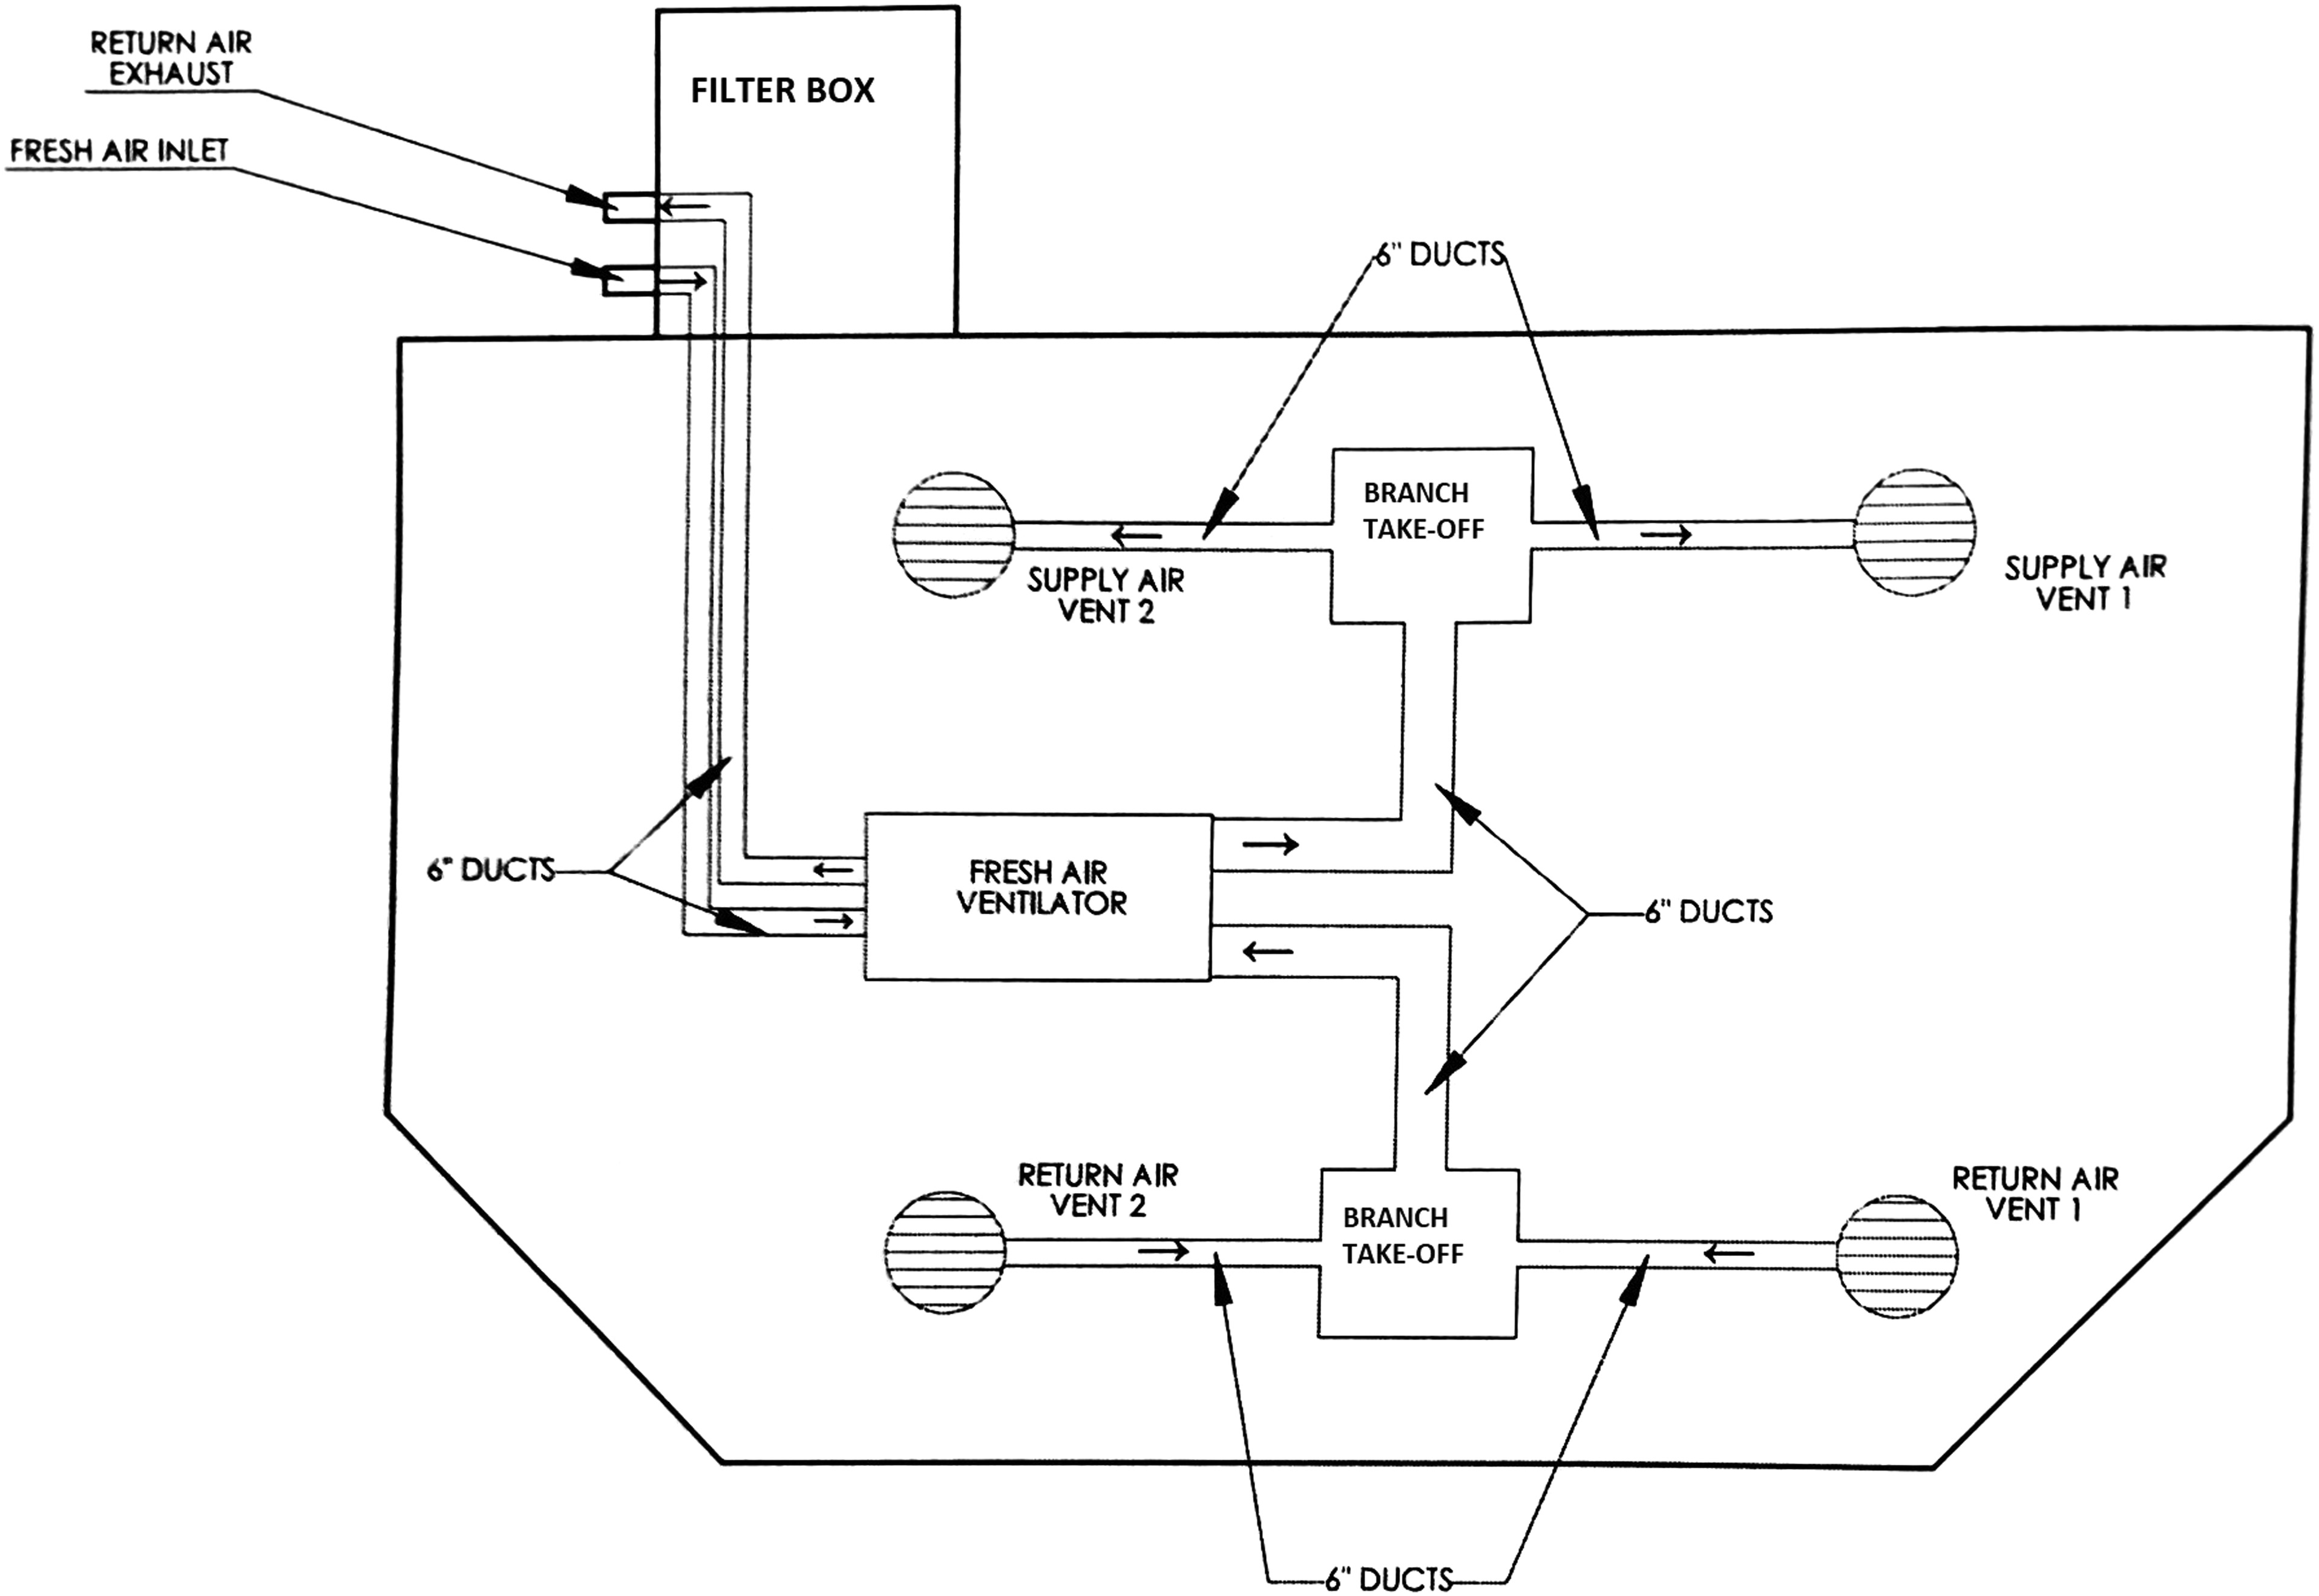
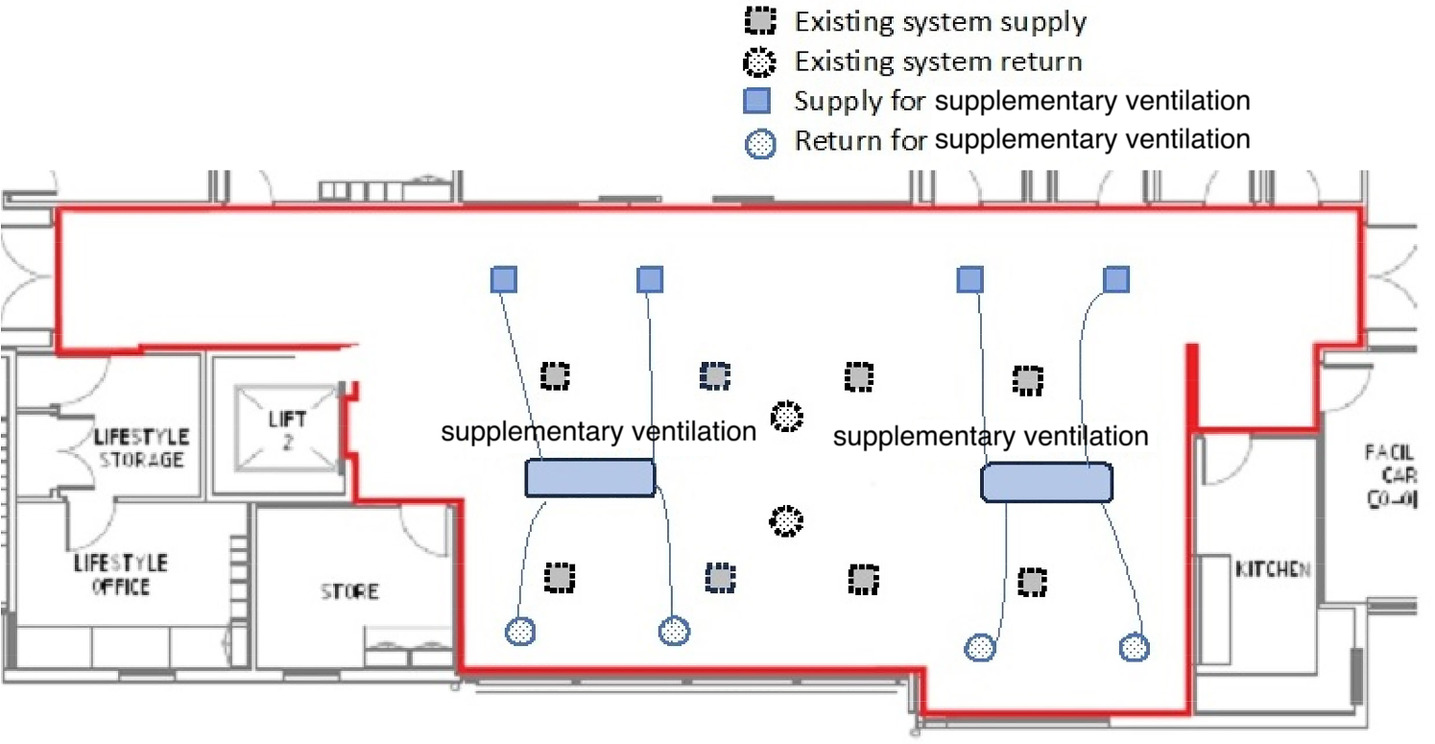
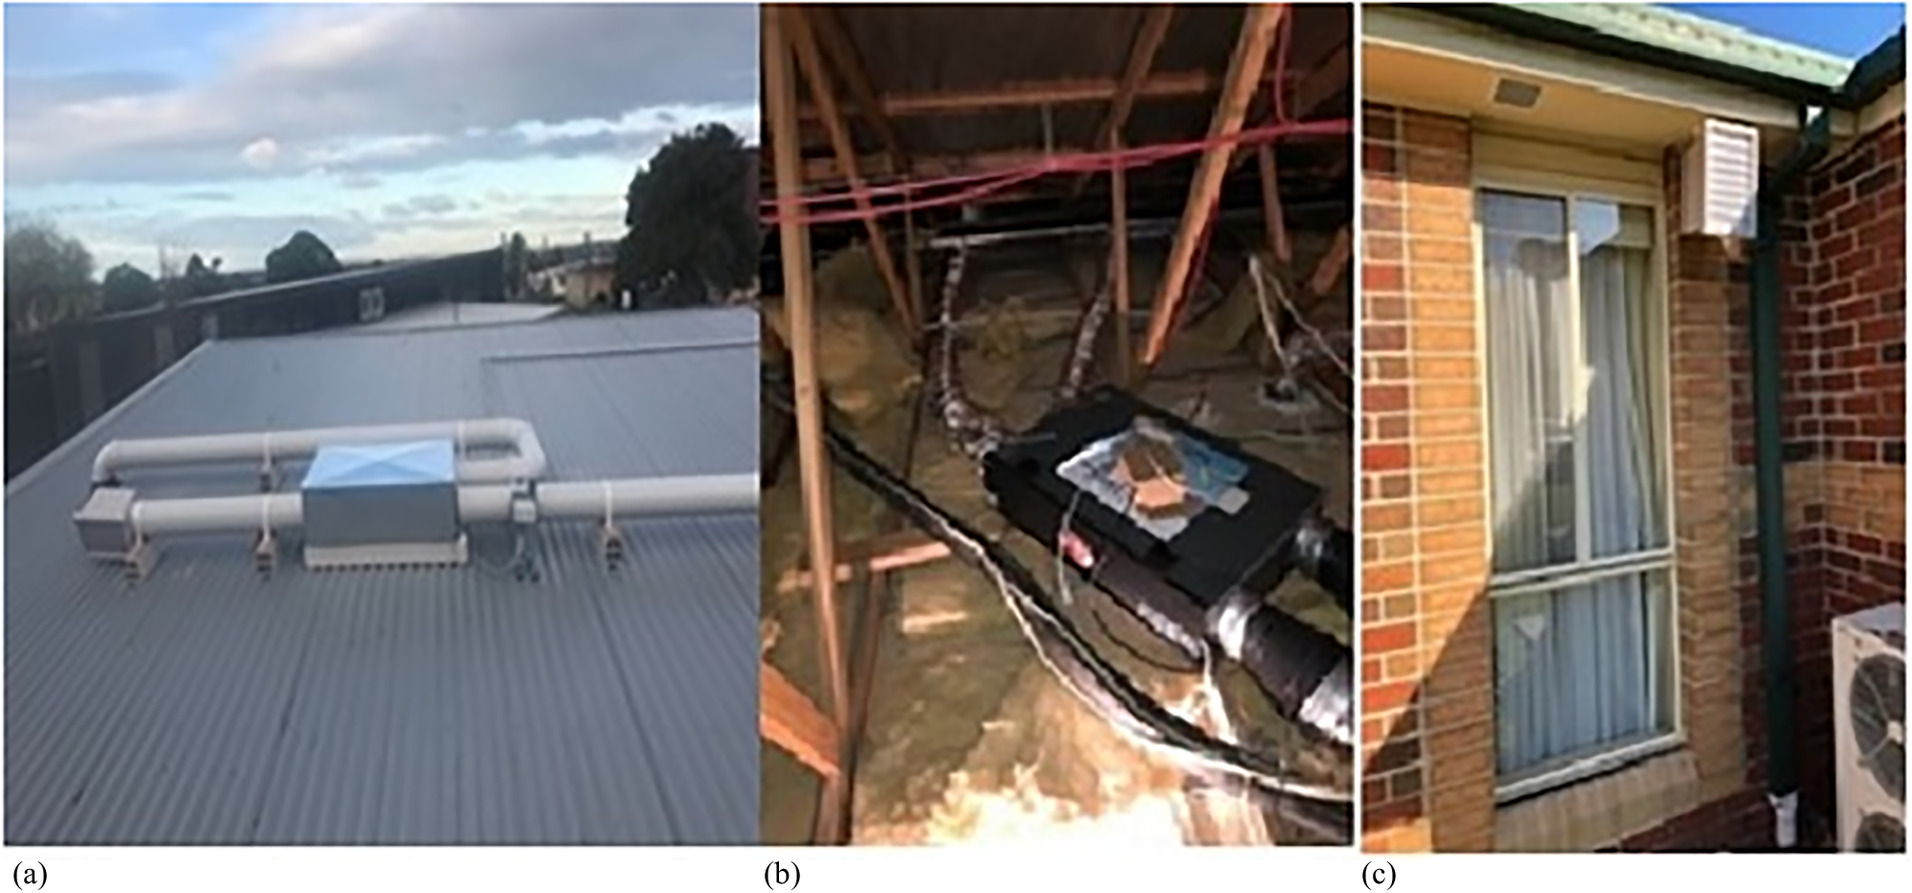
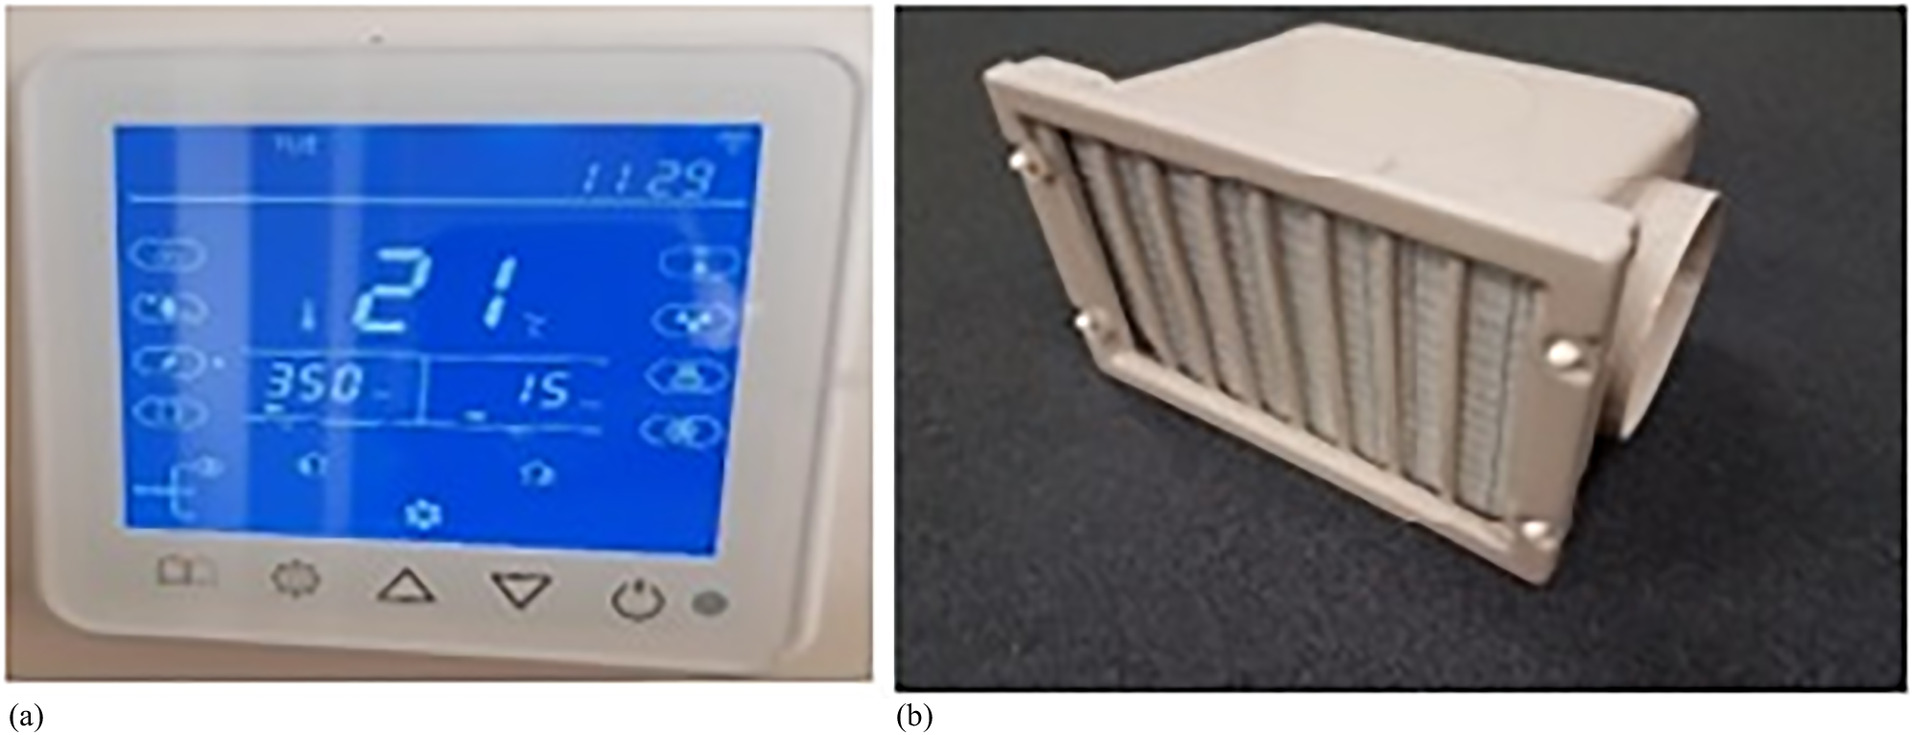
A typical installation layout of the supplementary ventilation system is shown in Fig. 3, with two points each for return and supply air vents in the ceiling cavity. The system was installed independently of the existing ventilation system in the room. Fig. 4 shows the ventilation equipment and the typical layout of the air supply and return (square and circle shapes in bold line) relative to the existing air distribution system in the room (dotted line). The ventilation system was mounted in the roof or ceiling cavity if an adequate crawl space was available [Fig. 5(b)], or on top of the roof [Fig. 5(a)] if accessible. The wall controller was installed indoors on an accessible drywall partition, and the fresh air filter box was placed on top of the roof, under the roof eaves, or mounted on the external wall to capture and filter fresh air. The system, once installed, recovers heat/coolth from the indoor stale exhaust air at the heat exchanger and transfers it into the incoming (outdoor) fresh air. The main components of the installation are shown in Fig. 3. The system uses motors to adjust the ventilation, which could be controlled using a wall controller with a digital display [Fig. 6(a)] with CO2 and PM2.5 sensors. The ventilation system provides smart features and could be set in manual or automatic mode. In automatic mode, the controller will adjust the fan speed according to the concentration of CO2, PM2.5, or both. The fan will run at low, medium, or high speeds when the concentrations are within a specific range and will stop running if the concentrations are below the minimum threshold. For experimental monitoring, the controller was set in manual mode with a high fan speed. The filter box [Fig. 6(b)] holds a G4 prefilter with the provision of adding filters (e.g., F7) in the same filter box for further filtration as required.
After monitoring the conditions for 12 months, an additional F7 filter and booster fans were added to the system to increase the filtration and airflow rates to compensate for the associated pressure drop. The addition of booster fans was not approved for AC4 and AC5. Table 2 gives the supply and return air velocities and airflow rates that were measured at the supply and return grilles for each aged care home. The supply air velocity that was measured at the inlet in the common rooms was from 1.6 to 2.1 m/s with the original G4 prefilter. With the addition of booster fans, the supply air velocity increased from 2.8 to 3.1 m/s.
| Facility | Original (G4 prefilter) | Upgrade (plus F7 filter) | ||||||
|---|---|---|---|---|---|---|---|---|
| Supply air velocity (m/s) | Supply air flow rate (m3/h) | Return air flow velocity (m/s) | Return air flow rate (m3/h) | Supply air velocity (m/s) | Supply air flow rate (m3/h) | Return airflow velocity (m/s) | Return air flow rate (m3/h) | |
| AC1B | 1.8 | 213.84 | 0.9 | 106.92 | 2.8 | 332.64 | 3.9 | 106.92 |
| AC2B | 1.6 | 190.08 | 1.9 | 225.72 | 3.3 | 392.04 | 3.7 | 225.72 |
| AC3B | 2.1 | 249.48 | 1.3 | 154.44 | 3.1 | 368.28 | 3.3 | 154.44 |
| AC4B | 1.5 | 178.20 | 1.2 | 142.56 | NA | NA | NA | NA |
| AC5B | 1.9 | 225.72 | 1.6 | 190.08 | NA | NA | NA | NA |
ACH Calculation
The CO2 generation from the residents (Persily and de Jonge 2017) was used as a tracer gas. Three methods that utilize CO2 as a tracer gas are commonly available for estimating air exchange rates. They are the steady state, build-up, and decay methods (Hänninen 2013). The ACH in each common room was calculated using the steady state method, as shown in the following equation. A limitation of this method is that steady state conditions might not be achieved in some rooms due to low ACHs, poorly mixed conditions, and room leakageswhere a = air change rate; N = occupant numbers in the room; g = indoor CO2 generation rate per person, which was assumed as 0.0052 L/s according to ASTM D6245 (ASTM 2018); V = space volume (m3); Co = CO2 concentration in outdoor air, which was assumed as 407 ppm according to BoM and CSIRO (2018); and Cs = final (steady state) CO2 concentration in the room.
(1)
Results
External Weather Conditions
Melbourne has a temperate oceanic climate (Koppen–Geiger classification Cfb). Table 3 lists the external weather conditions during the measurement period, which indicates monthly average, minimum, and maximum air temperatures, and RH in four seasons for the morning (9:00 a.m.) and afternoon (3:00 p.m.). The minimum temperature during the winter months (June–August) was 4.5°C, and the maximum temperature recorded in the summer months (December to February) was 41.3°C.
| Term period | Month | Outdoor air temperature [Ta (°C)] | Outdoor RH% | ||||
|---|---|---|---|---|---|---|---|
| Average 9:00 a.m./3:00 p.m. | Minimum 9:00 a.m./3:00 p.m. | Maximum 9:00 a.m./3:00 p.m. | Average 9:00 a.m./3:00 p.m. | Minimum 9:00 a.m./3:00 p.m. | Maximum 9:00 a.m./3:00 p.m. | ||
| Season 1 April 1–May 3 (Autumn) | April | 15.9/21 | 9.4/14 | 26.5/30 | 64/47 | 32/22 | 87/76 |
| May | 13.3/17 | 8.5/8 | 20.2/23 | 72/57 | 46/38 | 100/80 | |
| Season 2 June 14–July 12 (Winter) | June | 10.3/14.5 | 4.5/9 | 15.6/19.1 | 80/63 | 61/45 | 100/91 |
| July | 10.2/14.1 | 6/11.4 | 12.4/18.6 | 77/60 | 60/45 | 98/85 | |
| Season 3 August 23–September 20 (Winter–Spring) | August | 10/13.3 | 6.4/7.9 | 16.4/17.6 | 71/58 | 42/43 | 90/94 |
| September | 12.4/15.9 | 8.7/10.5 | 21.6/25.5 | 66/54 | 41/36 | 87/88 | |
| Season 4 November 1– November 29 (Spring–Summer) | November | 15.7/19.8 | 10.5/12.9 | 32.3/33.4 | 63/49 | 17/21 | 94/98 |
| December | 17.5/22.8 | 11.5/13.7 | 33.1/41.3 | 49/63 | 13/27 | 75/87 | |
Source: BoM and CSIRO (2018).
Thermal Environments
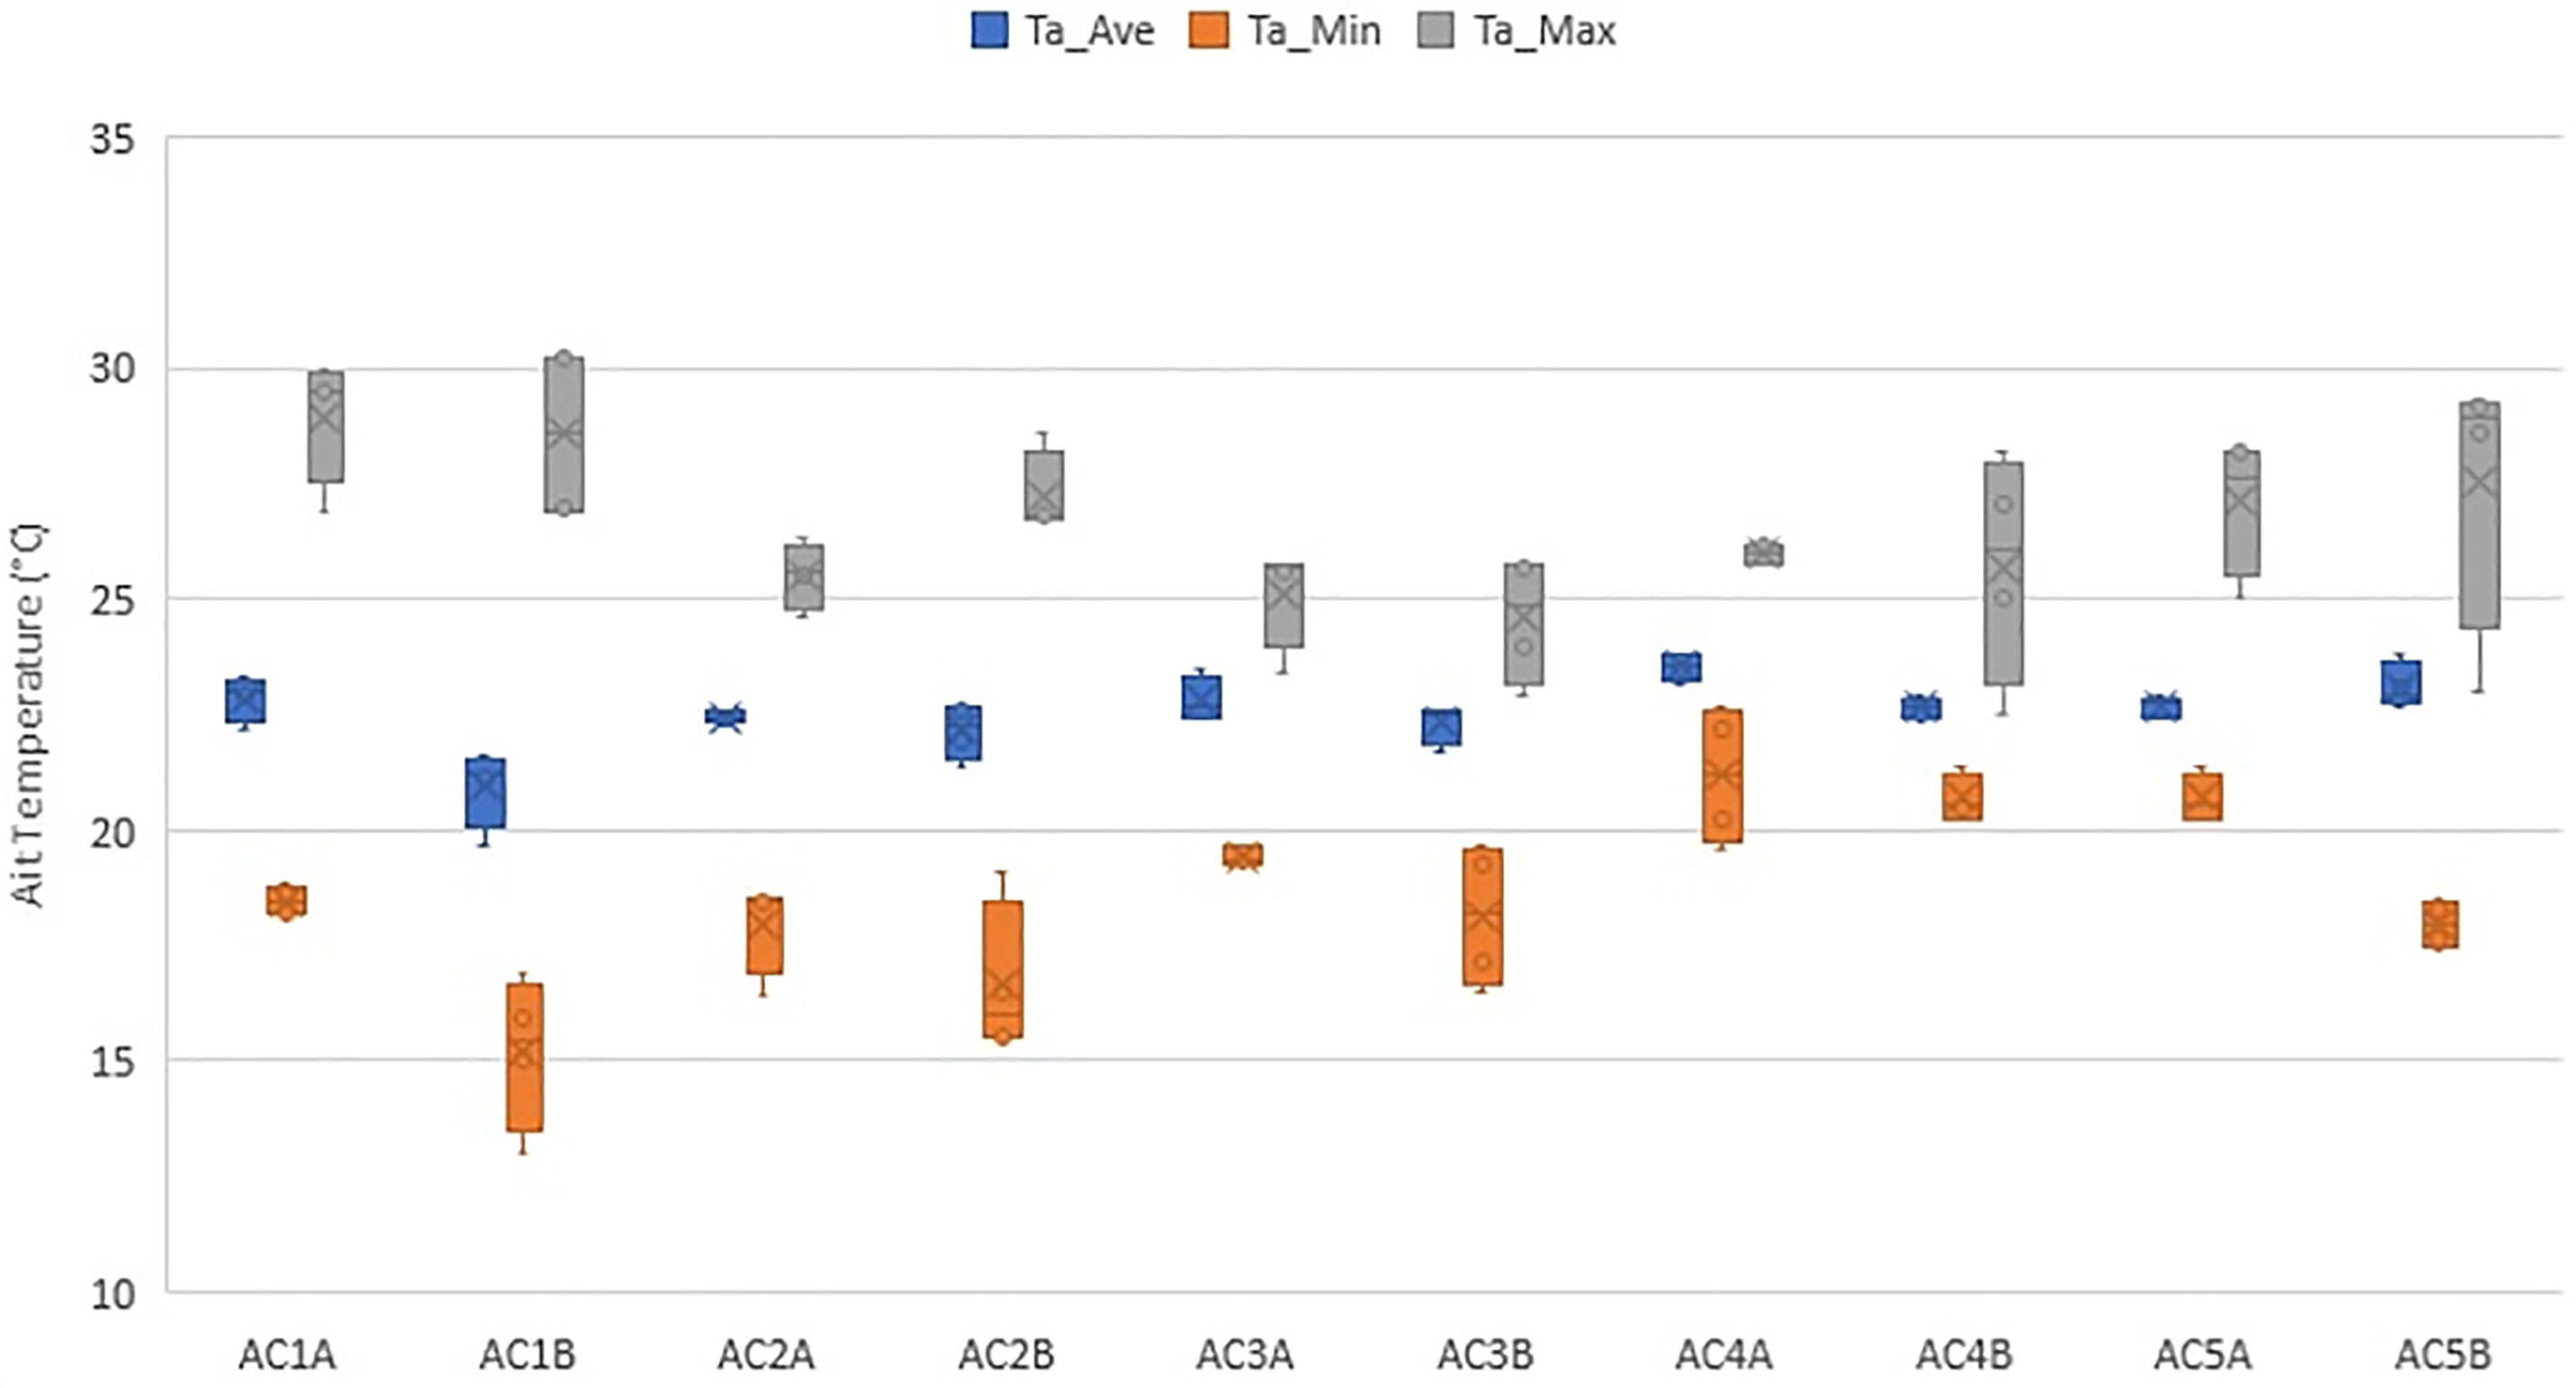
Tables 4 and 5 list the descriptive statistics of the monitored temperature variations in the aged care home common rooms during the four seasons (S1, S2, S3, S4). Fig. 7 shows the average (Ta_Ave), minimum (Ta_Min) and maximum (Ta_Max) temperatures across the fours seasons (year-long monitoring). The average temperatures were between 19.7°C and 23.8°C. The largest seasonal variation was observed in AC1B with minimum and maximum temperatures of 15°C and 30.2°C, respectively, during Season 2 and 19.7°C and 26.9°C, for Season 3. The observational data confirmed that heating and cooling systems in this room were off most of the time, because the room was not as occupied as the other rooms during the day.
| Room | Ta (°C) Season 1 | Ta (°C) Season 2 | ||||||||
|---|---|---|---|---|---|---|---|---|---|---|
| Median | Mean | Minimum | Maximum | Standard deviation | Median | Mean | Minimum | Maximum | Standard deviation | |
| AC1A | 22.9 | 23.1 | 18.6 | 29.5 | 1.8 | 22.8 | 22.9 | 18 | 29.5 | 2.1 |
| AC1B | 21.1 | 21.3 | 15.9 | 27 | 2 | 21.7 | 21.1 | 15 | 30.2 | 2.8 |
| AC2A | 22.4 | 22.3 | 18.5 | 26.3 | 1.3 | 22.9 | 22.6 | 18.4 | 24.6 | 1.2 |
| AC2B | 22.9 | 22.6 | 16.5 | 28.6 | 2 | 21.8 | 21.9 | 15.5 | 26.7 | 1.7 |
| AC3A | 23.4 | 23.5 | 19.4 | 23.4 | 1.3 | 22.5 | 22.4 | 19.7 | 25.7 | 0.9 |
| AC3B | 22.9 | 22.6 | 16.5 | 22.9 | 2 | 21.2 | 21.1 | 17.2 | 23.7 | 1 |
| AC4A | 23.3 | 23.2 | 19.6 | 23.3 | 1 | 23.7 | 23.8 | 22.7 | 25.8 | 0.6 |
| AC4B | 22.5 | 22.5 | 20.2 | 22.5 | 0.9 | 22.3 | 22.4 | 21.4 | 25 | 0.7 |
| AC5A | 22.4 | 22.5 | 19.2 | 22.4 | 0.9 | 22.2 | 22.3 | 19.8 | 25.16 | 1 |
| AC5B | 22.9 | 22.8 | 18.5 | 23 | 0.8 | 24.2 | 23.8 | 18.3 | 29.31 | 2.2 |
In a study of Australian nursing homes, Tartarini et al. (2018) examined the thermal perceptions of nursing home occupants in southeastern New South Wales (NSW) with questionnaires and field monitoring. They found that the indoor air temperatures were between 17.2°C and 31.6°C. This study showed that due to the lack of thermally comfortable environments in some facilities, participants used a range of adaptive behaviors, such as clothing adjustments and ceiling and portable fans in summer, to improve their thermal comfort. The authors suggested that a temperature between 20°C and 26.2°C would be a desirable comfort band for nursing home residents. The authors note that winter temperature could be 21.5°C ± 1.5°C, and the summer temperature could depend on the type of activity and presence of cooling fans in the rooms. The indoor temperature should be 24.5°C ± 1.5°C in the residents’ rooms that have fans, and lower temperatures (e.g., 23°C ± 1.5°C) could be maintained in staff rooms where high activity levels prevail. A study in a Mediterranean climate during summer found that 24.4°C was a comfortable temperature for elderly people (Forcada et al. 2020).
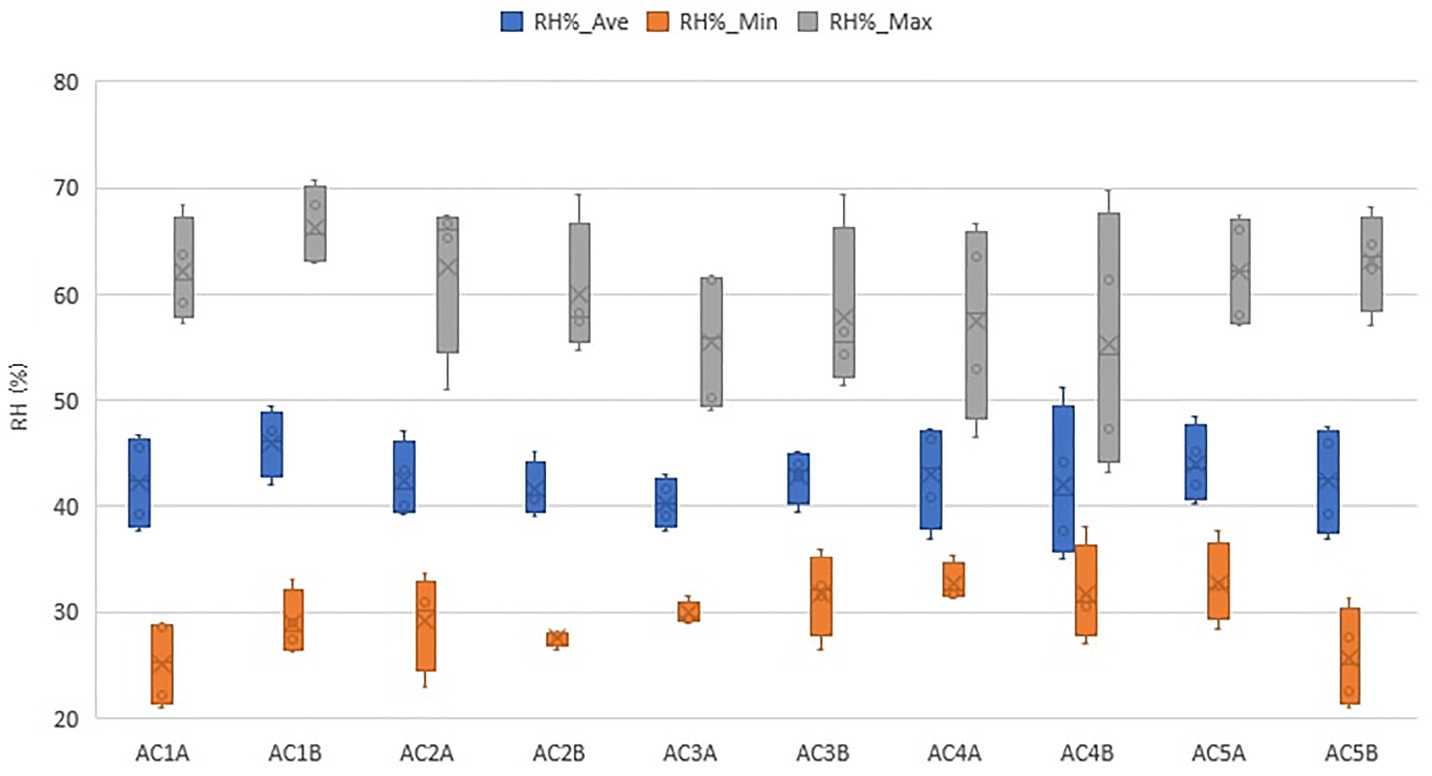
Tables 6 and 7 list the descriptive statistics of the RH variations. Fig. 8 shows the average, minimum, and maximum values of the RH in 10 aged care homes. Seasons 1 and 4 had higher RH levels compared with Seasons 2 and 3. The RH was from 26% to 71% and 23% to 68% during Seasons 1 and 4, respectively. The RH was between 21% and 65% during Season 2 and 21% and 63% during Season 3.
| Room | Ta (°C) Season 3 | Ta (°C) Season 4 | ||||||||
|---|---|---|---|---|---|---|---|---|---|---|
| Median | Mean | Minimum | Maximum | Standard deviation | Median | Mean | Minimum | Maximum | Standard deviation | |
| AC1A | 22.9 | 23 | 18 | 30 | 3 | 21.9 | 22.2 | 18.87 | 26.9 | 1.4 |
| AC1B | 19.2 | 19.7 | 13 | 26.9 | 2.9 | 21.4 | 21.6 | 16.89 | 30.3 | 2.2 |
| AC2A | 22.6 | 22.4 | 16.4 | 25.5 | 1.1 | 22.6 | 22.4 | 18.53 | 25.7 | 1.3 |
| AC2B | 21.4 | 21.4 | 15.5 | 26.9 | 2 | 22.6 | 22.7 | 19.06 | 26.8 | 1.8 |
| AC3A | 22.8 | 22.7 | 19.3 | 25.6 | 1 | 22.6 | 22.6 | 19.27 | 25.8 | 1.1 |
| AC3B | 21.8 | 21.7 | 17.1 | 24 | 1 | 22.2 | 22.1 | 19.2 | 25.2 | 1.1 |
| AC4A | 23.6 | 23.7 | 22.2 | 25.8 | 0.6 | 23.2 | 23.2 | 20.27 | 26.2 | 0.8 |
| AC4B | 22.8 | 22.9 | 20.7 | 27.1 | 1 | 22.7 | 22.8 | 20.46 | 28.2 | 1.4 |
| AC5A | 22.7 | 22.6 | 18.7 | 25.2 | 1 | 22.6 | 22.7 | 19.89 | 25.8 | 0.9 |
| AC5B | 23.3 | 23.1 | 17.4 | 28.6 | 1.9 | 22.8 | 22.7 | 17.63 | 29.2 | 1.7 |
CO2 Concentration Levels
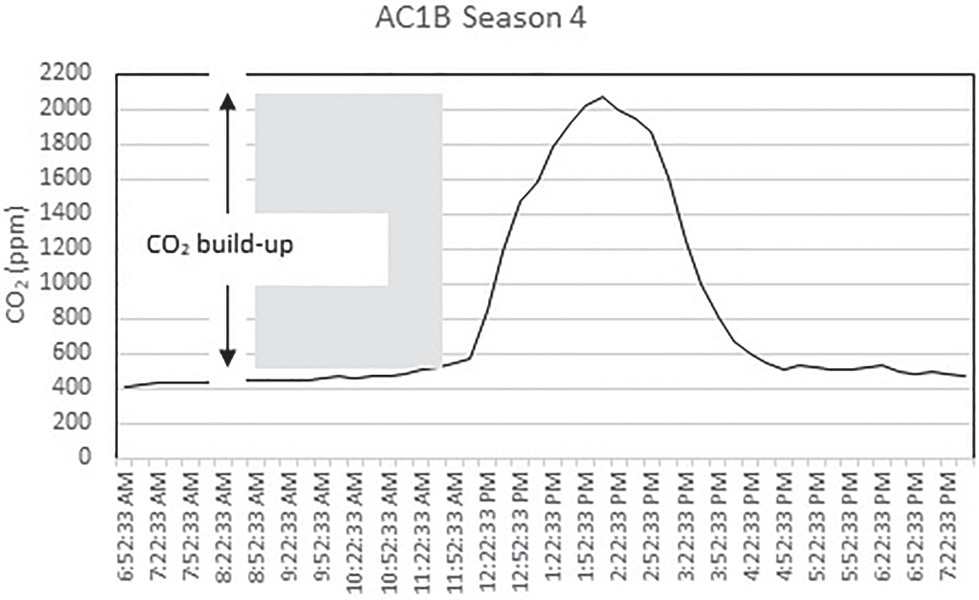
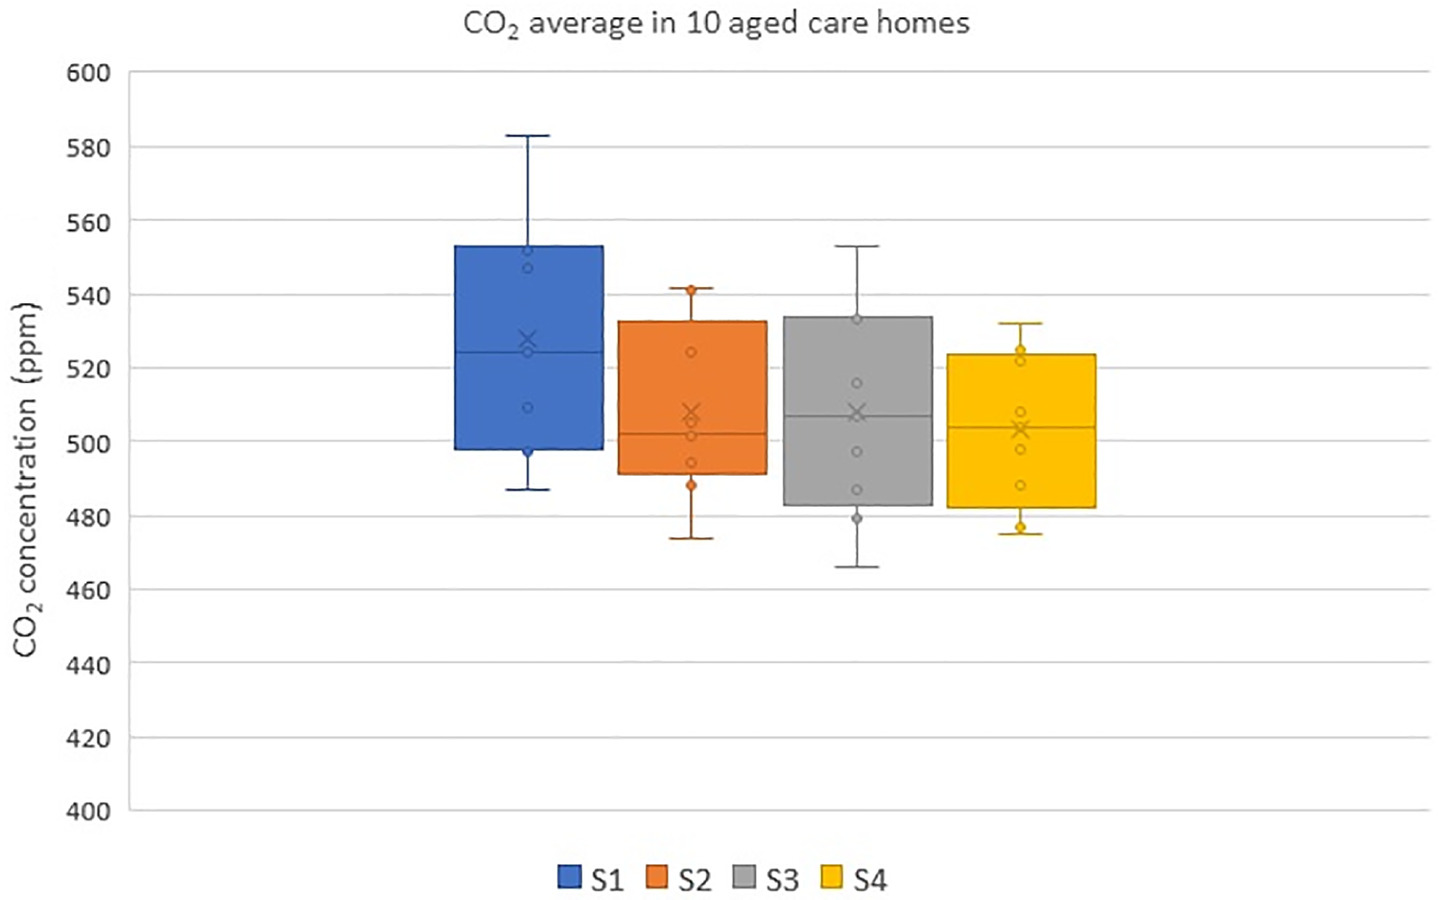
Fig. 9 shows the typical CO2 concentration profile in a common room (AC4B) at 15-min intervals for 12 h. The indoor concentration of CO2 rose at the start of an event with people arriving in the room, then started to reduce once people started leaving the room. The CO2 concentration levels for 10 rooms across various seasons are shown in Fig. 10. Table S2 lists the descriptive statistics of CO2 levels. The range of CO2 levels in the five aged care homes during Seasons 1 and 2 represent the preinstallation period. Seasons 3 and 4 represent the postinstallation period. As discussed in the section “IAQ Parameters,” indoor CO2 concentrations above approximately 1,000 ppm are generally considered indicative of poor ventilation rates (ASTM 2018). The maximum CO2 levels were generally high in AC1B (Fig. 10) during all seasons, with readings above 1,000 ppm on multiple occasions. The highest CO2 level was approximately 2,000 ppm. High CO2 levels are associated with an increased number of occupants. Observational data showed that the occupant numbers in the room were from zero to 33 people during daily activities, up to 33 people on normal days, and up to 52 people occasionally for festive seasons and special events. Fig. 11 shows the variations in average and maximum CO2 concentration levels across the four seasons. The range of average CO2 concentrations was between 466 and 553 ppm, and the range of maximum CO2 concentration was between 667 and 2,066 ppm.
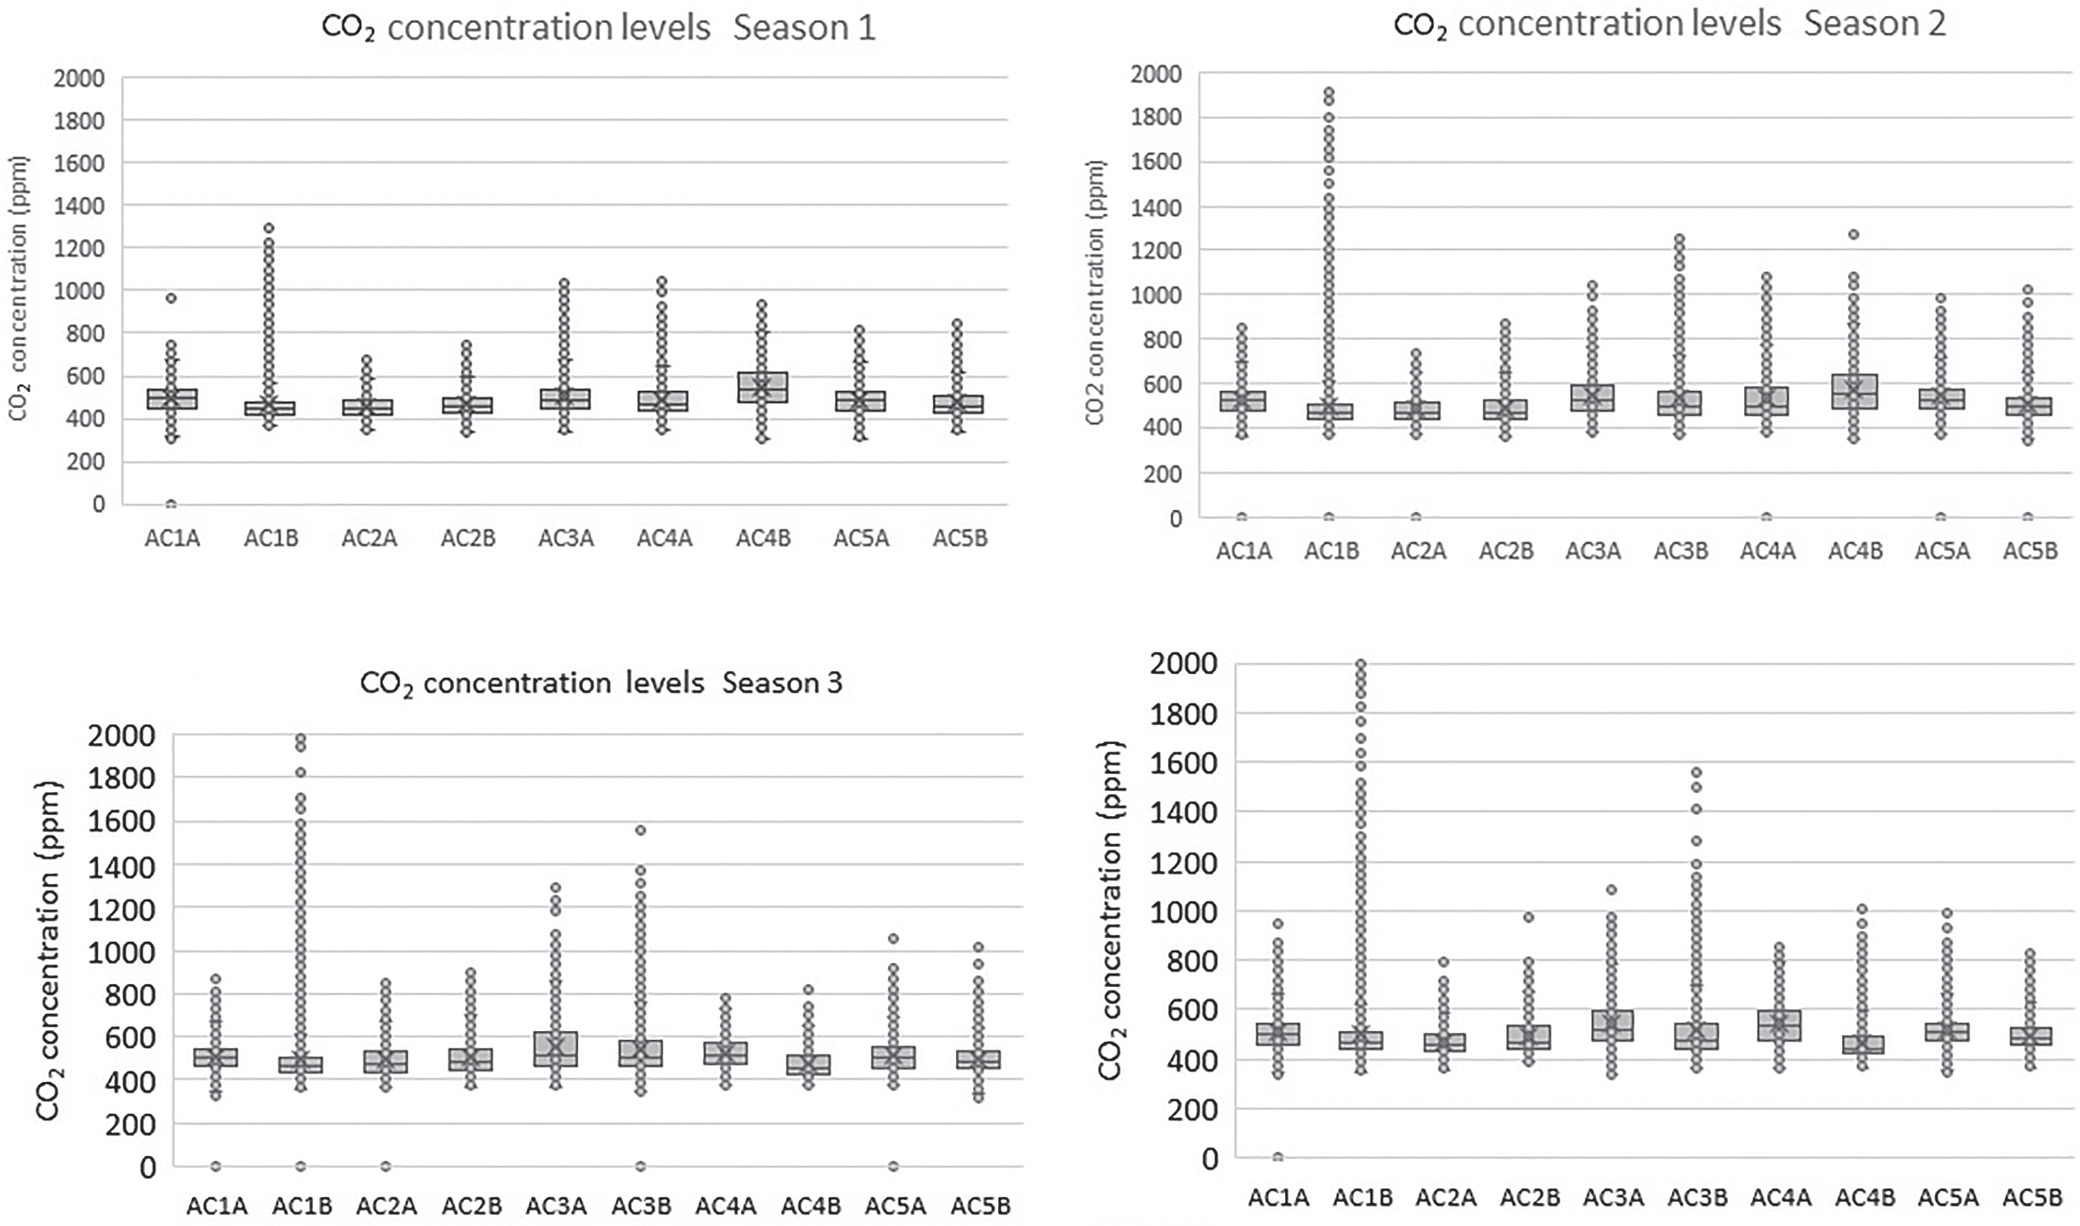
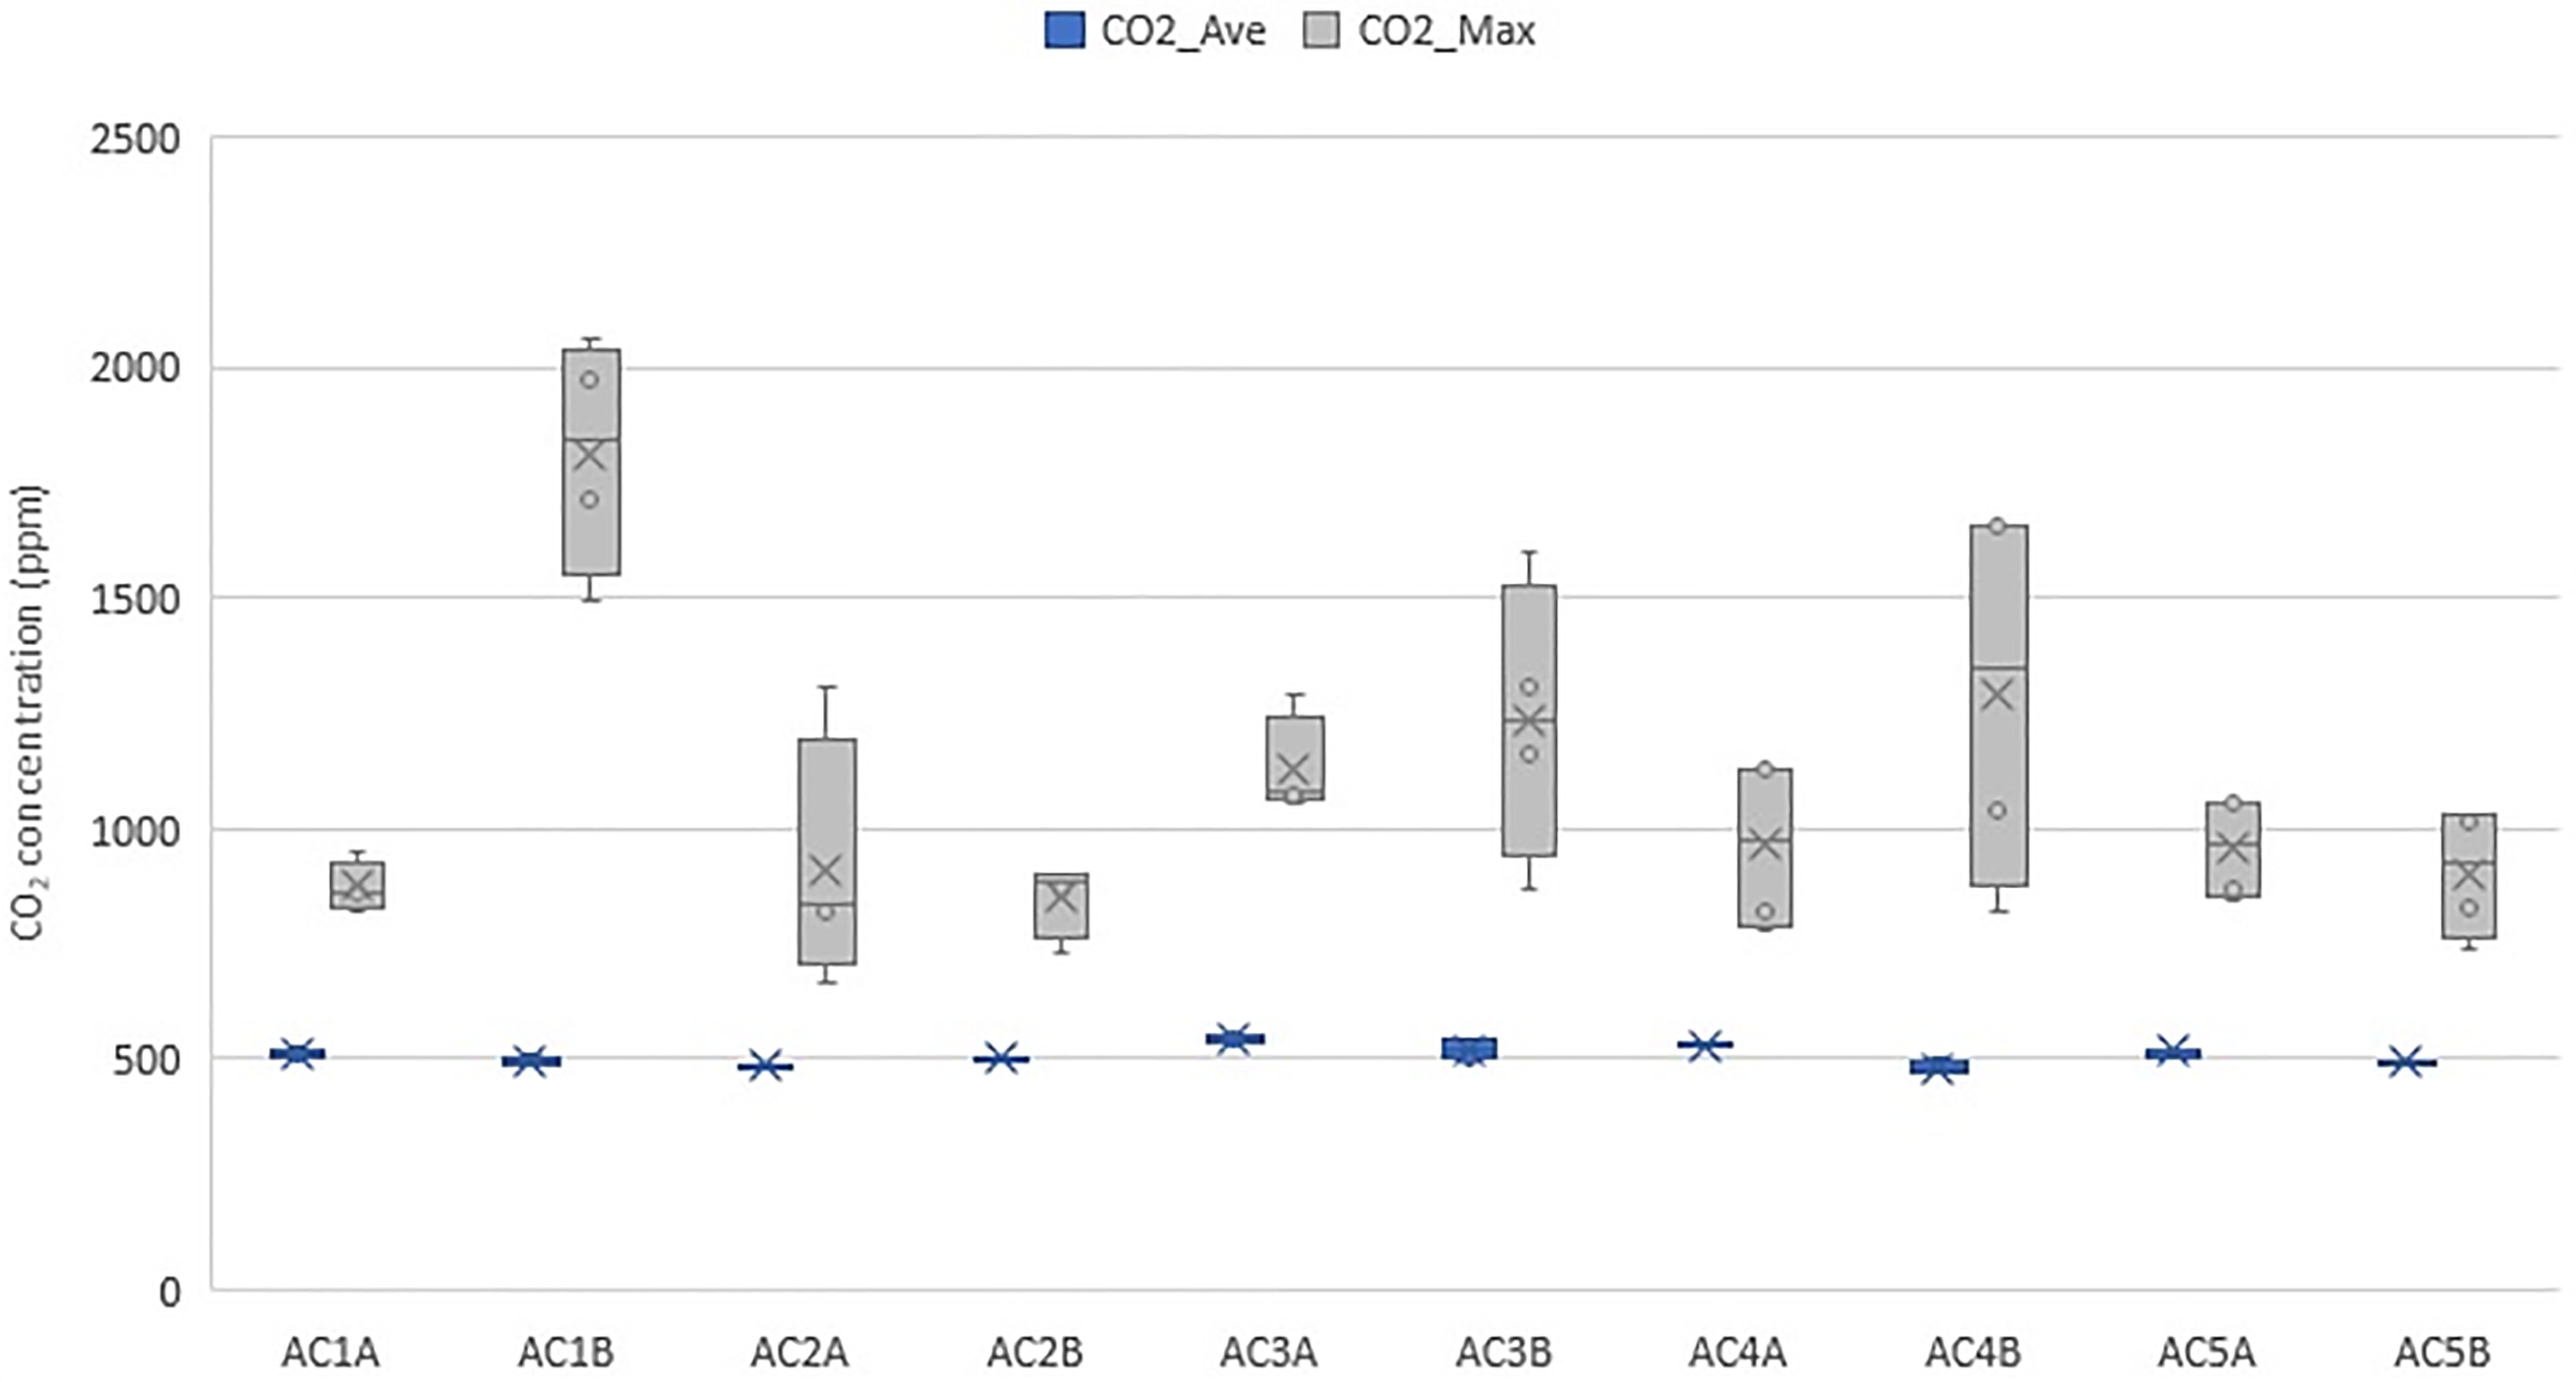
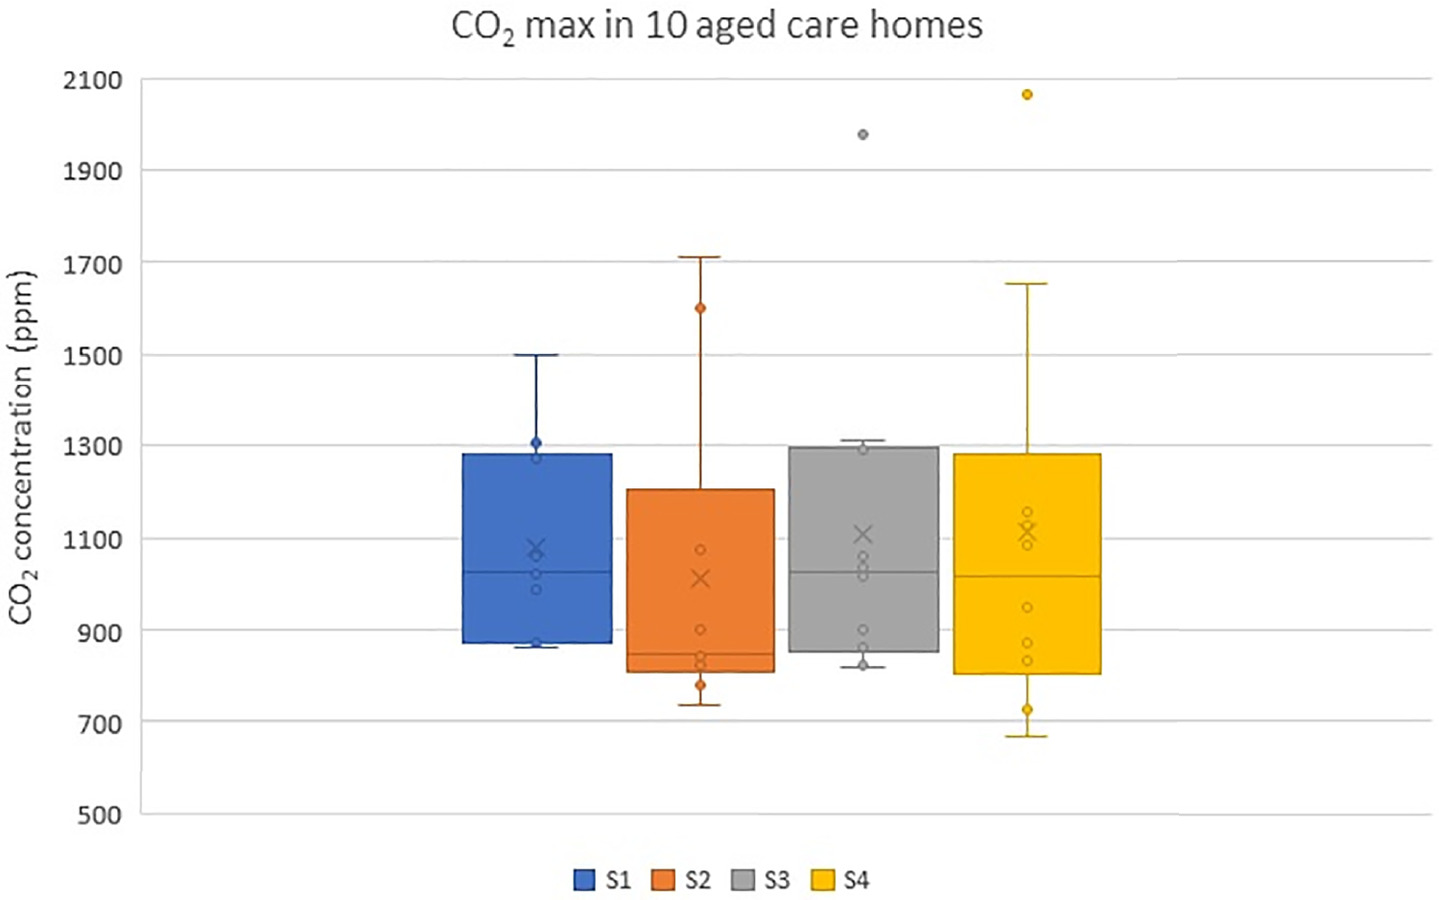
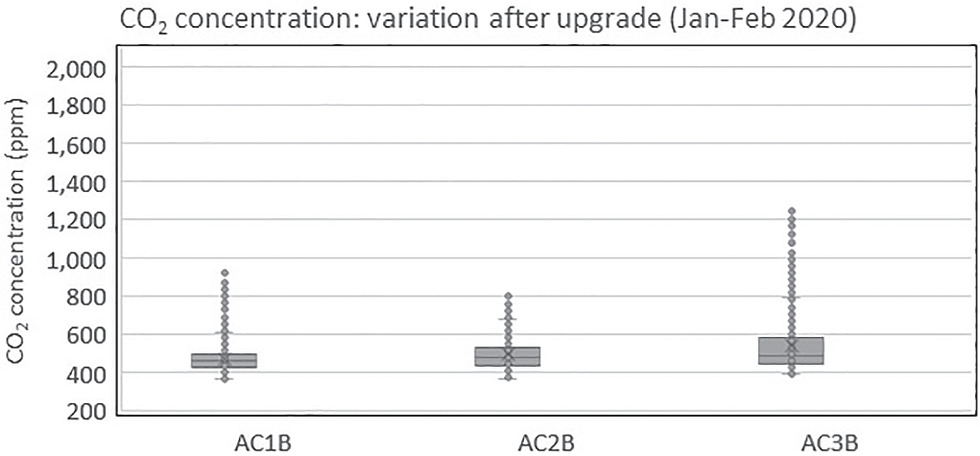
Figs. 12 and 13 show the maximum and average CO2 concentration levels across the four seasons, respectively. The ANOVA tests revealed high variability and significant differences in the maximum CO2 concentration levels across the 10 aged care homes with F (9,30) = 7.775, p = 0.000. In addition, there was a significant difference and high variability in the average CO2 concentrations with F (9,30) = 2.81, p = 0.016. Fig. 10 shows that the post-installation (Seasons 3 and 4) measurements did not show any reduction in CO2 compared with preinstallation (Seasons 1 and 2) measurements, which implied that the ACHs were insufficient. Therefore, the ventilation systems were enhanced by increasing the flow rate and filtration. Three facilities (AC1, AC2, and AC3) were selected for the upgrade. A booster fan was included, and an F7 (MERV 13) filter was added to the existing G4 prefilter. Fig. 14 shows the CO2 levels after the upgrade for a single day sampled at 15-min intervals for 6 h. A visual comparison against Fig. 10 shows that there was a reduction in the peak CO2 levels because of increased ventilation.
To examine the variability and differences in CO2 levels between seasons and before and after the upgrade, one-way ANOVA with a Tukey post hoc test was performed for a single day with some similarity in occupancy levels. The results show that there was variability between seasons for AC1 [ANOVA F (2,96) = 5.363 and p = 0.006]. For AC2, there was no variability between seasons [ANOVA F(3,116) = 1.37 and p = 0.257]. For AC3, variability between seasons was observed [ANOVA F(2,84) = 99.3 and p = 0.000].
The Tukey highest significant difference (HSD) post hoc test confirmed that for AC1, a significant difference in CO2 concentration was found between Season 2 (M = 630 and SD = 229) and the upgrade (M = 769, SD = 129); t(32) = 2.04 and p = 0.000 and Season 3 (M = 639 and SD = 208) and the upgrade (M = 769 and SD = 129); t(32) = 2.04 and p = 0.001. The CO2 mean was higher, and the SD was lower after the upgrade. This is because occupants were present throughout when upgrade measurement was conducted, resulting in higher mean and lower variance. For AC3, a significant difference was found between S2 (M = 622, SD = 45) and upgrade (M = 739, SD = 127); t(29) = 2.05, p = 0.000. The CO2 mean and SD were higher after the upgrade. No significant difference was found between S3 (M = 759, SD = 112) and the upgrade (M = 739, SD = 127); t(29) = 2.05 and p = 0.167. This could be due to the variations in occupancy levels during different seasons.
Air Change Rates
As discussed in the “Methodology” section, steady state method was used to calculate the ACH rate. The floor area of the common rooms was from 48 to 192 m2, and the volume was from 154 to 616 m3 (Table 1). Table 8 lists the ACH (h) that was calculated for the four seasons. For the ACH calculation, a typical day was selected, and the CO2 concentration during maximum occupation was used, because the number of residents that used the room varied significantly from one day to another. The calculated ACHs and ventilation rates were from 0.84 ACH to 3.81 ACH and 5.52 to 30.95 L/s per person, respectively. According to Australian Standards AS 1,668.2 (Standards Australia 2012), the minimum outdoor airflow rate for patient rooms that could be referenced for aged care homes is 10–12 L/s per person with a net floor area of 10 m2 per person. The ventilation rates that are recommended by ASHRAE Standard 62.1 (ASHRAE 2022) are 10 L/s for a physical therapy exercise area, 5 L/s for individual physical rooms, and 2.5 L/s for examination and consultation rooms. Then, ACHs of two and four are prescribed for resident rooms and resident gathering, activity, or dining spaces, respectively, by ASHRAE Standard 170: Ventilation of Health Care Facilities (ASHRAE 2017). In addition, DIN EN 15251 prescribes 10 L/s per person or 1.4 L/s/m2 as the airflow rate for living rooms and bedrooms (DIN 2007, Table B.5, p. 37). Table 8 highlights that seven out of 22 ventilation rates that were recorded were below the recommended standards.
| Room | RH (%) Season 1 (Autumn) | RH (%) Season 2 (Winter) | ||||||||
|---|---|---|---|---|---|---|---|---|---|---|
| Median | Mean | Minimum | Maximum | Standard deviation | Median | Mean | Minimum | Maximum | Standard deviation | |
| AC1A | 45.1 | 45.5 | 28.6 | 63.6 | 5.8 | 39 | 39.2 | 21 | 59.2 | 5.8 |
| AC1B | 49.3 | 49.5 | 33 | 70.7 | 7.1 | 41.9 | 42 | 26.2 | 63.1 | 7.6 |
| AC2A | 46.1 | 47 | 33.6 | 67.5 | 5.7 | 39.2 | 40 | 30.8 | 65.3 | 3.9 |
| AC2B | 44.2 | 45.2 | 26.4 | 69.4 | 6.4 | 38.4 | 39 | 28 | 57.4 | 5.4 |
| AC3A | 42.5 | 42.9 | 31.4 | 61.5 | 4.5 | 39.3 | 39 | 29.7 | 49.1 | 3.5 |
| AC3B | 44.2 | 45.2 | 26.4 | 69.4 | 6.4 | 43.6 | 44 | 36 | 54.3 | 3.5 |
| AC4A | 46 | 46.4 | 35.4 | 63.4 | 5 | 36.8 | 37 | 31.7 | 46.6 | 2.5 |
| AC4B | 50.4 | 51.2 | 38.1 | 69.7 | 5.9 | 35.1 | 35 | 31.3 | 43.1 | 2.1 |
| AC5A | 48 | 48.4 | 37.8 | 66.1 | 5.2 | 41.3 | 42 | 32.5 | 58 | 4.4 |
| AC5B | 47.1 | 47.5 | 27.5 | 64.6 | 6.2 | 36.7 | 37 | 22.5 | 62.4 | 5.6 |
| Room | RH (%) Season 3 (Winter–Spring) | RH (%) Season 4 (Spring–Summer) | ||||||||
|---|---|---|---|---|---|---|---|---|---|---|
| Median | Mean | Minimum | Maximum | Standard deviation | Median | Mean | Minimum | Maximum | Standard deviation | |
| AC1A | 37.8 | 37.8 | 22 | 57.3 | 6.0 | 46.3 | 46.7 | 28.8 | 68.4 | 6.5 |
| AC1B | 45.6 | 45.3 | 29 | 63 | 6.9 | 45.7 | 47 | 27.3 | 68.3 | 7.2 |
| AC2A | 38.6 | 39.2 | 29.5 | 51 | 4 | 42.8 | 43.3 | 22.9 | 66.6 | 7 |
| AC2B | 40.8 | 40.7 | 28 | 58.2 | 5.5 | 41.3 | 41.3 | 27.7 | 54.8 | 5.8 |
| AC3A | 37.5 | 37.7 | 29 | 50.2 | 3.5 | 41.5 | 41.7 | 29.3 | 61.4 | 4.8 |
| AC3B | 39.2 | 39.5 | 31.5 | 51.4 | 4.1 | 42.7 | 42.8 | 32.5 | 56.5 | 4.5 |
| AC4A | 40.4 | 40.9 | 31.3 | 53 | 4.4 | 45.5 | 47.3 | 32.4 | 66.7 | 5.9 |
| AC4B | 37.4 | 37.7 | 30.4 | 47.3 | 3.4 | 43.7 | 44.2 | 27.0 | 61.3 | 5.9 |
| AC5A | 39.9 | 40.2 | 28.3 | 57.1 | 4.5 | 45 | 45.2 | 32.0 | 67.4 | 4.9 |
| AC5B | 39.5 | 39.2 | 21 | 57 | 5.9 | 45.6 | 45.9 | 31.3 | 68.2 | 5.9 |
| Aged care home | Room | N | V (m3) | Cs (ppm) | Co (ppm) | Air changes per hour (h) | Ventilation rates | ||||||||||||||
|---|---|---|---|---|---|---|---|---|---|---|---|---|---|---|---|---|---|---|---|---|---|
| S1 | S2 | S3 | S4 | S1 | S2 | S3 | S4 | S1 | S2 | S3 | S4 | After upgrade | S1 | S2 | S3 | S4 | After upgrade | ||||
| AC1 | AC1A | 1–9 | 154 | 765 | 517 | 634 | 703 | 362 | 362 | 362 | 332 | — | — | — | — | — | — | — | — | — | — |
| AC1B | 1–22 | 169 | 1,044 | 1,203 | 656 | 632 | 369 | 369 | 361 | 332 | — | 2.9 | — | — | 2.01 | — | 6.24a | — | — | 9.45 | |
| AC2 | AC2A | 19–21 | 616 | 558 | 765 | 605 | 522 | 362 | 362 | 362 | 354 | 3.26 | 1.43 | 2.5 | 3.62 | — | 26.53 | 12.9 | 21.4 | 30.95 | — |
| AC2B | 6–8 | 269 | 654 | — | 668 | 635 | 369 | — | 366 | 385 | — | NA | — | — | 2.46 | — | — | — | — | 14.13 | |
| AC3 | AC3A | 14–25 | 363 | 714 | 715 | 822 | 1,085 | 376 | 376 | 367 | 334 | 3.81 | 2.13 | 1.7 | 1.3 | — | 15.38 | 15.34 | 11.43 | 6.92a | — |
| AC3B | 15–25 | 355 | 937 | 992 | 976 | 1,300 | 366 | 366 | 348 | 358 | 2.31 | 2.02 | 1.6 | 0.84 | 1.7 | 9.11a | 8.31a | 8.28a | 5.52a | 8.36 | |
| AC4 | AC4A | 6–33 | 543 | 785 | 762 | 704 | 794 | 359 | 362 | 359 | 359 | — | 1.72 | 3.3 | — | — | — | 13 | 15.07 | — | — |
| AC4B | 16–52 | 576 | — | — | 741 | 1,244 | 362 | — | 362 | 362 | NA | NA | 1.37 | 1.92 | — | — | — | 13.72 | 5.9a | — | |
| AC5 | AC5A | 6–12 | 429 | 726 | 731 | 630 | 585 | 371 | 371 | 370 | 342 | 1.23 | 1.21 | 2.01 | — | — | 14.65 | 14.44 | 20 | — | — |
| AC5B | 5–12 | 260 | 587 | 429 | 622 | 590 | 342 | 342 | 319 | 361 | — | — | 2.85 | 3.77 | — | — | — | 17.16 | 22.71 | — | |
a
Ventilation rates below recommended standards.
Compared with similar studies in other countries, an assessment of the indoor environmental quality in elderly care centers in Central Portugal showed that very low ACH values were found in living rooms (Pinto et al. 2019). High levels of CO2 were observed in this study when the room was heavily occupied. In addition, the RH values were higher than the maximum prescribed most of the time. After the system upgrade, AC1, AC2, and AC3 had ACH values of 2.01, 2.46, and 1.7, respectively, and ventilation rates of 9.45, 14.13, and 8.36 L/s per person, respectively.
Particulate Matter
The PM is used broadly as a proxy indicator of air pollution and is recognized as one of the pollutants with public health concerns by the WHO. Many previous worldwide studies have assessed that indoor PM levels are higher than outdoor ones. The PM levels recorded in the aged care homes were generally low and lower than the WHO recommendations of not more than 20 μg/m3 per year and 50 μg/m3 per 24 h for PM10 levels, and not more than 10 μg/m3 per year and 25 μg/m3 for 24 h for PM2.5.
PM2.5 Concentration Levels
The indoor peak concentration of PM2.5 was generally observed at approximately 11:00 a.m. and 3:00 p.m. A closer look at the PM concentrations showed that the peaks were associated with some local activities near the dust monitor, such as people gathering close to the monitor or walking past to go to their rooms. Cooking occurred in a separate room, and regular cleaning was performed in the evening. Fig. 15 shows the indoor to outdoor ratio of PM2.5 concentrations in the intervention rooms of five aged care homes. When the ratio was above one, more particles existed indoors than outdoors. As shown in Fig. 15, no noticeable pattern was observed across the seasons, and this could be due to the limited occupancy and activities during the monitoring period. However, in Facility AC2, the ratio was high during Season 1, and this ratio went up to 4.5. Similarly, the ratio in Facility AC3 during Season 2 was higher. Approximately 25 people were in the room during the measurement, participating in physical exercise activities during Season 2.
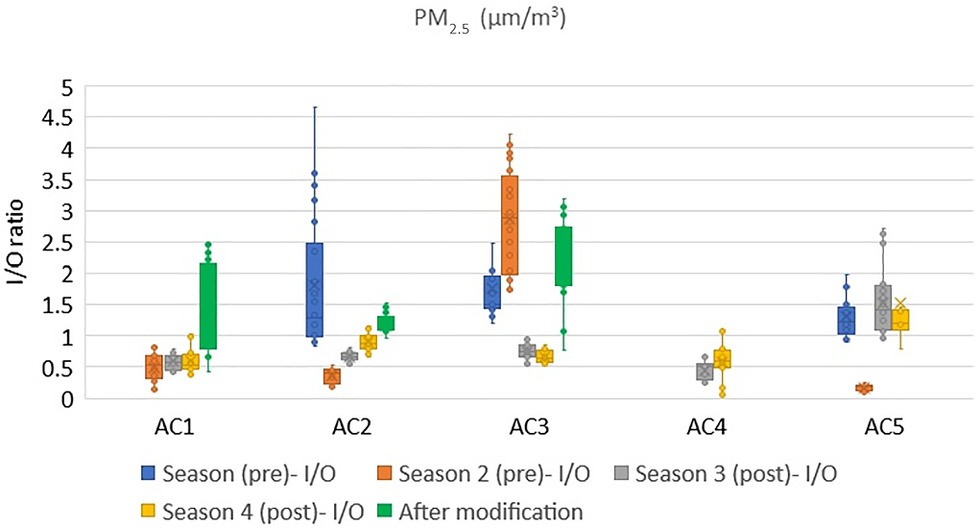
Looking at the ratio of indoor and outdoor PM concentrations after modifying the system (legend-after modification in Fig. 15), the PM2.5 ratio generally increased in all aged care homes. This could be because of the activities and people’s movement in the room or due to the resuspension of fine particles due to higher ACHs. In Facility AC1, the indoor PM2.5 levels were more than the outdoor levels after the modification. The selected intervention room in Facility AC1 was smaller and more confined compared with other facilities, and this could have contributed to these outcomes. In addition, the room was occupied and used to train the aged care staff on the day of the measurements.
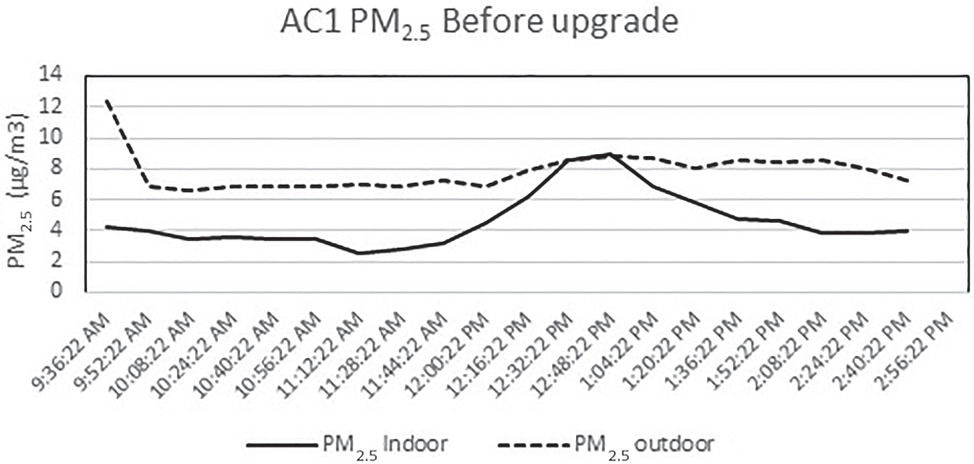
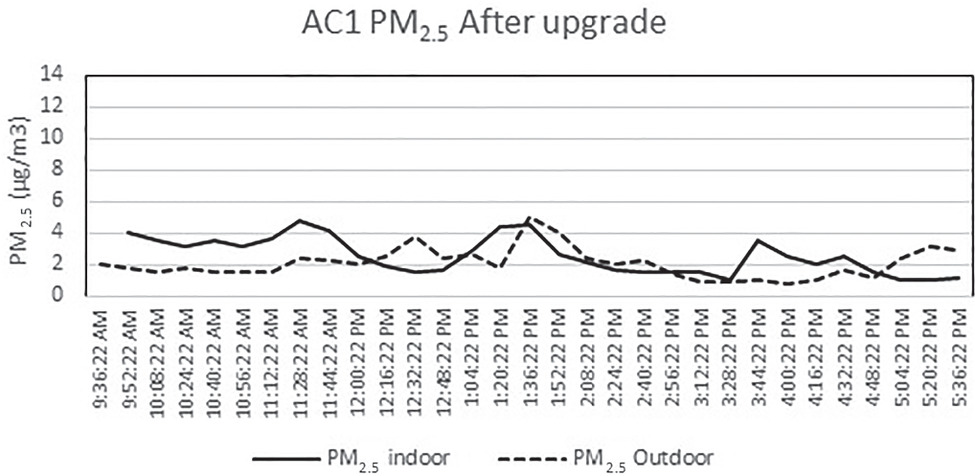
Figs. 16 and 17 show the concentration of PM2.5 in one of the facilities (AC1) from 9:00 a.m. to 3:00 p.m. on a representative day before and after the system upgrade. The hikes displayed were mainly associated with the movement of people (residents and staff). In addition to occupant activities, the indoor PM concentration mainly depends on factors such as outdoor weather conditions and particle concentrations, air exchange rate, and rate of particle penetration from outside to indoors; low indoor concentrations suggest an airtight building envelope. As shown in Figs. 16 and 17, the outdoor PM2.5 concentration was higher in the former case, Fig. 16, and this could be due to the external weather conditions. After the upgrade, the indoor PM2.5 concentration was higher than the outdoor concentration, and this could be because the F7 filter was insufficient for small-sized particles.
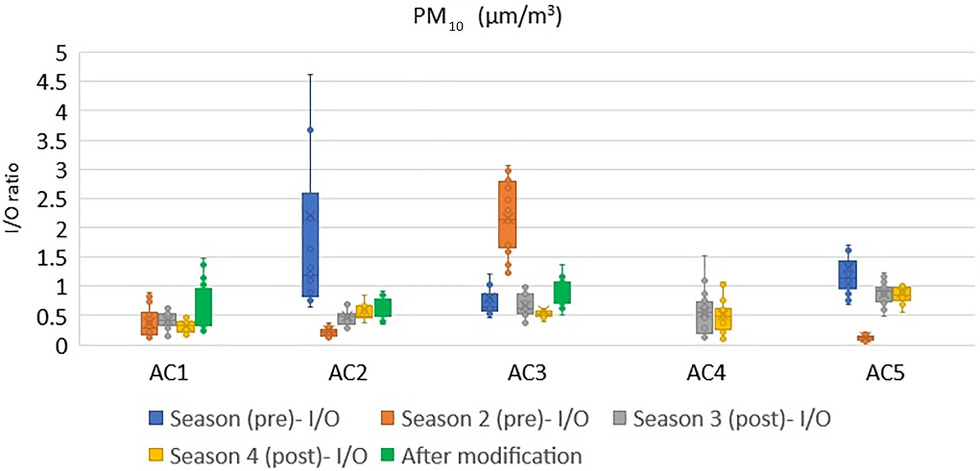
PM10 Concentration Levels
The PM10 consists of particles of any substances that are <10 μm. People are an important source of PM10 indoors. As shown in Fig. 18, Facility AC2 had a high indoor–outdoor ratio of PM10 concentration during Season 1 that was similar to the PM2.5, which could be because of some local movement or activities next to the dust monitor. During Season 2 in Facility AC3, the indoor PM10 was higher than the outdoor level due to physical exercise activities during the measurement period. In general, there was no difference in the indoor–outdoor ratio after the modification. In Facility AC1, the indoor levels were consistent and did not vary with respect to the outdoors. This could be due to the limited exchange with the outdoor air, low levels of air infiltration due to closed windows and doors, and the outside weather conditions. In an intervention study that used portable air purifiers conducted in aged care homes in China, Guo et al. (2021) found that weather conditions, window opening and closing status, and air purifiers were the main factors that predicted the PM concentration in aged care homes. Higher PM removal effectiveness was observed in rooms that kept the windows closed compared with rooms that had kept them open.
Discussions
All previous studies in aged care homes indicated that pollution concentrations and ventilation parameters should be regularly monitored to proactively address vulnerabilities in these facilities. However, the IAQ in aged care homes is rarely monitored and is not regulated by legislation (Reddy et al. 2021). This study presented a practical way of retrofitting spaces in aged care buildings in Australia that used a readily available ventilation system. The capital and installation costs of the proposed system are affordable for aged care home facility management. The data that were presented in this study, as well as the thermal conditions and air quality characteristics of five aged care homes’ common rooms for a year, characterized the IAQ in aged care homes. In addition, they were the prepandemic baseline, which will assist when creating pandemic resilient building stock. The IAQ studies on aged care homes are limited, perhaps because problems that are associated with IAQ are considered less significant due to the relatively low occupant density. In addition, approvals to access aged care homes could be limited and restricted. In addition, establishing the performance of systems in aged care home settings is challenging due to potential confounding factors. The findings from this study are relevant to aged care homes in other countries that are mechanically ventilated and with variations in occupancy rates. Currently, aged care legislation does not regulate the IAQ in aged care homes; therefore, significant public concern has been raised in the last few years. Researchers agree that fragmented information and a disjointed approach around building ventilation, particularly in response to COVID-19, hinder an integrated approach for the best possible outcome. The HVAC systems in healthcare buildings such as hospitals are mainly designed for comfort rather than infection control, except for isolation rooms (Buising et al. 2022). Although most aged care homes could be naturally ventilated with openable windows to improve air quality, this is often impractical because of the outdoor weather conditions during peak summer and winter and some shoulder transitional seasons. Much of the advice on improving the IAQ is concerned with opening windows to enhance ventilation, increasing airflow rates, filtration, and purging air through the building. To address the risk of COVID-19 transmission in the community, the Victorian Department of Health and Human Services (DHS 2022) recommends the installation of stand-alone AC units or the placement of air purifiers with high-efficiency particulate air filtration if the number of air exchanges or the availability of fresh air could not be increased. If not integrated, such actions could increase energy consumption and associated costs.
This study found that the occupancy rate in the common rooms in aged care homes varied throughout the day and seasons corresponding to the activities. Moderate or full occupancy brought CO2 concentrations up to 2,000 ppm. The ACHs were between 0.84 and 3.81 h, and ventilation rates per person were between 5.52 and 30.95 L/s. Up to a 1,000 ppm reduction in indoor CO2 levels was achieved by the addition of the supplementary ventilation system, particularly when booster fans were installed to increase the airflow, as demonstrated by the results of the 1-year monitoring. However, no reduction was observed in the PM concentration levels. The PM2.5 levels increased with the booster fans. The PM concentration levels were higher in common rooms and highly affected by local activities and people’s behavior, as reported in previous studies (Mendes et al. 2015). Control experiments and the close monitoring of individual activities that extend into unoccupied hours would be required for the detection of specific sources of particles.
Collecting data on the residents’ perception of indoor environmental conditions is important to understand their level of comfort and satisfaction. In a recent study in nursing homes in a Mediterranean climate, Forcada et al. (2020) measured indoor climatic parameters along with a questionnaire to investigate the thermal sensation of elderly people during the summer season and found that residents had different thermal comfort perception than nonresidents and they were more accepting of high temperatures than nonresidents. The residents used physical activities for thermal adaptation instead of modifying their clothing to adapt to unacceptable thermal conditions. Although this study developed a questionnaire to gather residents’ air quality perception after the first season, the majority of residents were unable to answer the survey questions accurately, which was a limitation. In addition, a pilot study in an aged care home in Melbourne by Chau et al. (2018) noted that many residents could not answer the survey due to language barriers and health conditions such as dementia. In the absence of self-reported comfort, health outcomes, and health data, such as the frequency of hospital visits and infections during the study period, future studies might adjust the methodology and gather evidence on the effect of the IAQ on health by collecting respiratory health data that uses a standardized questionnaire.
Conclusion
This study presented a practical way for ventilation retrofits in existing aged care homes and evaluated the effectiveness of readily available technology. The proposed method is affordable and fit for purpose to suit the various design typologies in Victoria and has the flexibility to be mounted in the roof–ceiling space or on top of the roof. The data set that constituted a year-long measurement contributed evidence to develop a pandemic resilient design for aged care homes. Improving indoor conditions could often be considered an energy-intensive technique when managing a building due to the potential increased energy demand. The air quality that is perceived by building occupants could be significantly influenced by the indoor temperature and humidity, and it is less acceptable with increased air temperature, humidity, or both. Understanding the unique and shared contribution of temperature, humidity, and ventilation on the elderly could be a useful strategy to improve aged care building performance. The results of the long-term monitoring showed that the ventilation in common rooms is generally good for low or average occupancy but insufficient when the room is fully occupied. The indoor CO2 levels were reduced by up to 1,000 ppm with the addition of a demand-controlled supplementary ventilation system, particularly with the introduction of booster fans. However, no reduction was observed in the PM concentrations. People’s behavior and local activities inside the room substantially influenced the PM concentrations. In addition, the particle arrestance efficiency of F7 grade filters was insufficient to block small particles such as PM2.5.
Poor air quality in aged care homes affects health and has other social and economic consequences, such as quality of life and staff productivity. COVID-19 has further demonstrated the urgency of developing and implementing IAQ solutions in aged care homes. Improving the ventilation rate in an enclosed, indoor space might decrease the risk of aerosol transmission of virus particles if an infectious person is present; however, this does not reduce the risk of droplet and contact transmission. This study presented evidence that informs the development of a pandemic resilient design for aged care homes. The findings from this study shed light on the suitability of air quality interventions that are recommended by local and international organizations as a reaction to the pandemic. This study’s findings will inform the facility management of aged care homes with a practical method of retrofitting. A systematic approach to regularly monitoring air quality and analyzing data to verify compliance with standards is essential to address any concerns proactively. This could improve the health, well-being, and quality of life of aged care residents and ease hospital visits and associated expenditures. Detailed monitoring of daily activities is essential and crucial to supplement the analysis and findings.
Supplemental Materials
File (supplemental materials_jaeied.aeeng-1700_rajagopalan.pdf)
- Download
- 110.34 KB
Data Availability Statement
Some or all data, models, or codes that support the findings of this study are available from the corresponding author upon reasonable request.
Acknowledgments
The authors thank the owners, facility managers, and staff of the participating aged care homes. This project was funded by the Department of Energy, Environment and Climate Action, the State Government of Victoria, Australia, under the Climate Change Innovation Grant Scheme 2018. This study obtained approval from RMIT University’s Human Research Ethics (CHEAN B 21563-06/18) and the Victoria Department of Education and Training (Project Number 2018_003781).
References
ABS (Australian Bureau of Statistics). 2013. Population projections in Australia. Canberra, ACT, Australia: ABS.
Aguiar, L., A. Mendes, C. Pereira, P. Neves, D. Mendes, and J. P. Teixeira. 2014. “Biological air contamination in elderly care centers: Geria project.” J. Toxicol. Environ. Health Part A 77 (14-16): 944–958. https://doi.org/10.1080/15287394.2014.911135.
AIHW (Australian Institute of Health and Welfare). 2021. “Australia’s older population.” Australian Government. Accessed January 20. https://www.aihw.gov.au/reports/older-people/older-australians/contents/demographic-profile#Australia's older population.
Allen, J. G., J. D. Spengler, E. Jones, and J. Cedeno-Laurent. 2020. “5-step guide to checking ventilation rates in classrooms (Schools for Health: How School Buildings Influence Student Health, thinking and Performance, Issue.” Accessed March 20, 2022. https://schools.forhealth.org/ventilation-guide/.
Apte, M. G., W. J. Fisk, and J. M. Daisey. 2000. “Associations between indoor CO2 concentrations and sick building syndrome symptoms in U.S. office buildings: An analysis of the 1994-1996 BASE study data.” Indoor Air 10: 246–257. https://doi.org/10.1034/j.1600-0668.2000.010004246.x.
ASHRAE (American Society of Heating, Refrigerating and Air-Conditioning Engineers). 2009. Indoor air quality guide: Best practices for design, construction and commissioning. Atlanta: ASHRAE.
ASHRAE (American Society of Heating, Refrigerating and Air-Conditioning Engineers). 2017. ANSI/ASHRAE/ASHE standard 170-2017: Ventilation of health care facilities. Atlanta: ASHRAE.
ASHRAE (American Society of Heating, Refrigerating and Air-Conditioning Engineers). 2022. ANSI/ASHRAE standard 62.1-2022: Ventilation for acceptable indoor air quality. Atlanta: ASHRAE.
ASHRAE (American Society of Heating, Refrigerating and Air-Conditioning Engineers). 2023. ANSI/ASHRAE standard 241-2023: Control of infectious aerosols. Atlanta: ASHRAE.
ASTM. 2017. Standard test method for determining air change in a single zone by means of a tracer gas dilution. ASTM E741-11. West Conshohocken, PA: ASTM.
ASTM. 2018. Standard guide for using indoor carbon dioxide concentrations to evaluate indoor air quality and ventilation. ASTM D6245-18. West Conshohocken, PA: ASTM.
Batterman, S., et al. 2012. “Particulate matter concentrations in residences: An intervention study evaluating stand-alone filters and air conditioners.” Indoor Air 22 (3): 235–252. https://doi.org/10.1111/j.1600-0668.2011.00761.x.
Baudet, A., E. Baurès, O. Blanchard, P. Le Cann, J.-P. Gangneux, and A. Florentin. 2022. “Indoor carbon dioxide, fine particulate matter and total volatile organic compounds in private healthcare and elderly care facilities.” Toxics 10: 136. https://doi.org/10.3390/toxics10030136.
Bentayeb, M., et al. 2015. “Indoor air quality, ventilation and respiratory health in elderly residents living in nursing homes in Europe.” Eur. Respir. J. 45 (5): 1228–1238. https://doi.org/10.1183/09031936.00082414.
Bentayeb, M., M. Simoni, D. Norback, S. Baldacci, S. Maio, G. Viegi, and I. Annesi-Maesano. 2013. “Indoor air pollution and respiratory health in the elderly.” J. Environ. Sci. Health., Part A 48 (14): 1783–1789. https://doi.org/10.1080/10934529.2013.826052.
Berquist, J., N. Cassidy, M. Touchie, W. O'Brien, and J. Fine. 2022. “High-rise residential building ventilation in cold climates: A review of ventilation system types and their impact on measured building performance.” Indoor Air 32 (11): e13158. https://doi.org/10.1111/ina.13158.
BoM (Bureau of Meteorology) and CSIRO. 2018. “State of the climate.” Accessed March 20, 2021. http://www.bom.gov.au/state-of-the-climate/index.shtml.
Buising, K. L., et al. 2022. “Use of portable air cleaners to reduce aerosol transmission on a hospital coronavirus disease 2019 (COVID-19) ward.” Infect. Control Hosp. Epidemiol. 43 (8): 987–992. https://doi.org/10.1017/ice.2021.284.
Chau, H.-W., L. Aye, M. Noguchi, C. Newton, J. Zhou, and C. M. M. Woo. 2018. “A pilot study on users” IEQ perceptions in a residential aged care facility in Melbourne.” In Proc., 52nd Int. Con. of the Architectural Science Association (ANZAScA). Melbourne, Australia: RMIT University.
Chen, Z., C. Chen, S. Wei, Y. Wu, Y. Wang, and Y. Wan. 2016. “Impact of the external window crack structure on indoor PM2.5 mass concentration.” Build. Environ. 108: 240–251. https://doi.org/10.1016/j.buildenv.2016.08.031.
Cuce, P. M., and E. Cuce. 2017. “Toward cost-effective and energy-efficient heat recovery systems in buildings: Thermal performance monitoring.” Energy 137: 487–494. https://doi.org/10.1016/j.energy.2017.02.159.
DELWP (Department of Environment, Land, Water and Planning, Victroria). 2022. “Built environment climate change adaptation action plan 2022–2026.” Accessed September 10, 2023. https://www.planning.vic.gov.au/data/assets/pdf_file/0034/635965/Built-Environment-Climate-Change-Adaptation-Action-Plan-2022-2026.pdf.
DHS (Department of Health and Human Services). 2022. “Ventilation strategies to reduce Covid 19 transmission in residential aged care facilities.” Accessed January 10, 2023. https://www.health.vic.gov.au/ventilation-strategies-reduce-covid-19-transmission-racf-doc.
DIN (German Institute for Standardization). 2007. Indoor environmental input parameters for design and assessment of energy performance of buildings addressing indoor air quality, thermal environment, lighting and acoustics. DIN EN 15251:2007. Berlin: DIN.
DoHAC (Department of Health and Aged Care). 2023. “Consultation on Australia’s health and Climate Strategy.” Accessed September 10, 2023. https://consultations.health.gov.au/ohp-2013-environmental-health-and-health-protection-policy-branch/national-health-and-climate-strategy-consultation/user_uploads/national-health-and-climate-strategy-consultation-paper-3.pdf.
EPA (United States Environmental Protection Agency). 2018. Accessed September 24, 2019. https://www.epa.gov/iaq-schools/why-indoor-air-quality-important-schools.
Fang, L., D. P. Wyon, G. Clausen, and P. O. Fanger. 2004. “Impact of indoor air temperature and humidity in an office on perceived air quality, SBS symptoms and performance.” Indoor Air 14 (Supplement 7): 74–81. https://doi.org/10.1111/j.1600-0668.2004.00276.x.
Fisk, W. J. 2017. “The ventilation problem in schools: Literature review.” Indoor Air 27 (6): 1039–1051. https://doi.org/10.1111/ina.12403.
Forcada, N., M. Gangolells, M. Casals, B. Tejedor, M. Macarulla, and K. Gaspar. 2020. “Summer thermal comfort in nursing homes in the Mediterranean climate.” Energy Build. 229: 110442. https://doi.org/10.1016/j.enbuild.2020.110442.
Guerra Santin, O., A. Grave, S. Jiang, C. Tweed, and M. Mohammadi. 2021. “Monitoring the performance of a Passivhaus care home: Lessons for user-centric design.” J. Build. Eng. 43: 102565. https://doi.org/10.1016/j.jobe.2021.102565.
Guo, M., M. Zhou, S. Wei, J. Peng, Q. Wang, L. Wang, D. Cheng, and W. Yu. 2021. “Particle removal effectiveness of portable air purifiers in aged-care centers and the impact on the health of older people.” Energy Build. 250: 111250. https://doi.org/10.1016/j.enbuild.2021.111250.
Gupta, R., A. Howard, M. Davies, A. Mavrogianni, I. Tsoulou, E. Oikonomou, and P. Wilkinson. 2021. “Examining the magnitude and perception of summertime overheating in London care homes.” Build. Serv. Eng. Res. Technol. 42 (6): 653–675. https://doi.org/10.1177/01436244211013645.
Hänninen, O. 2013. “Novel second-degree solution to single zone mass-balance equation improves the use of build-up data in estimating ventilation rates in classrooms.” J. Chem. Health Saf. 20 (2): 14–19. https://doi.org/10.1016/j.jchas.2012.12.001.
Hart, J. F., T. J. Ward, T. M. Spear, R. J. Rossi, N. N. Holland, and B. G. Loushin. 2011. “Evaluating the effectiveness of a commercial portable air purifier in homes with wood burning stoves: A preliminary study.” J. Environ. Public Health 2011: 324809. https://doi.org/10.1155/2011/324809.
IEA (International Energy Agency). 2022. Renovation of near 20% of existing building stock to zero-carbon-ready by 2030 is ambitious but necessary. Paris: IEA.
Kemp, P. C., and H. G. Neumeister. 2010. Australian mould guideline: The go-to guide for everything mould. 2nd ed. Sydney, Australia: Messenger Publishing.
Lee, J., J. Son, and Y. Cho. 2007. “The adverse effects of fine particle air pollution on respiratory function in the elderly.” Sci. Total Environ. 385 (1–3): 28–36. https://doi.org/10.1016/j.scitotenv.2007.07.005.
Maio, S., G. Sarno, S. Baldacci, I. Annesi-Maesano, and G. Viegi. 2015. “Air quality of nursing homes and its effect on the lung health of elderly residents.” Expert Rev. Respir. Med. 9 (6): 671–673. https://doi.org/10.1586/17476348.2015.1105742.
Mendes, A., S. Bonassi, L. Aguiar, C. Pereira, P. Neves, S. Silva, D. Mendes, L. Guimarães, R. Moroni, and J. P. Teixeira. 2015. “Indoor air quality and thermal comfort in elderly care centers.” Urban Clim. 14: 486–501. https://doi.org/10.1016/j.uclim.2014.07.005.
Mendes, A., et al. 2016. “The impact of indoor air quality and contaminants on respiratory health of older people living in long-term care residences in Porto.” Age Ageing 45 (1): 136–142. https://doi.org/10.1093/ageing/afv157.
Mendes, A., C. Pereira, D. Mendes, L. Aguiar, P. Neves, S. Silva, S. Batterman, and J. P. Teixeira. 2013. “Indoor Air quality and thermal comfort—Results of a pilot study in elderly care centers in Portugal.” J. Toxicol. Environ. Health Part A 76 (4–5): 333–344. https://doi.org/10.1080/15287394.2013.757213.
Milton, D. K., P. M. Glencross, and M. D. Walters. 2000. “Risk of sick leave associated with outdoor Air supply rate, humidification, and occupant complaints.” Indoor Air 10: 212–221. https://doi.org/10.1034/j.1600-0668.2000.010004212.x.
Padró-Martínez, L., E. Owusu, E. Reisner, W. Zamore, M. Simon, M. Mwamburi, C. Brown, M. Chung, D. Brugge, and J. Durant. 2015. “A randomized cross-over Air filtration intervention trial for reducing cardiovascular health risks in residents of public housing near a highway.” Int. J. Environ. Res. Public Health 12 (7): 7814–7838. https://doi.org/10.3390/ijerph120707814.
Persily, A., and L. de Jonge. 2017. “Carbon dioxide generation rates for building occupants.” Indoor Air 27 (5): 868–879. https://doi.org/10.1111/ina.12383.
Pinto, M., J. Lanzinha, J. Viegas, C. Infante, and T. Freire. 2019. “Quality of the indoor environment in elderly care centers in two cities in central Portugal: Viseu and Covilhã.” Int. J. Environ. Res. Public Health 16 (20): 3801. https://doi.org/10.3390/ijerph16203801.
Reddy, M., M. Heidarinejad, B. Stephens, and I. Rubinstein. 2021. “Adequate indoor air quality in nursing homes: An unmet medical need.” Sci. Total Environ. 765: 144273. https://doi.org/10.1016/j.scitotenv.2020.144273.
Seppänen, O. A., W. J. Fisk, and M. J. Mendell. 1999. “Association of ventilation rates and CO2 concentrations with health and other responses in commercial and institutional buildings.” Indoor Air 9 (4): 226–252. https://doi.org/10.1111/j.1600-0668.1999.00003.x.
Shao, D., et al. 2017. “Cardiorespiratory responses of air filtration: A randomized crossover intervention trial in seniors living in Beijing: Beijing indoor air purifier StudY, BIAPSY.” Sci. Total Environ. 603–604: 541–549. https://doi.org/10.1016/j.scitotenv.2017.06.095.
Simoni, M., S. Baldacci, S. Maio, S. Cerrai, G. Sarno, and G. Viegi. 2015. “Adverse effects of outdoor pollution in the elderly.” J. Thorac. Dis. 7 (1): 34–45. https://doi.org/10.3978/j.issn.2072-1439.2014.12.10.
Simonson, C. J., M. Salonvaara, and T. Ojanen. 2002. “The effect of structures on indoor humidity—possibility to improve comfort and perceived air quality.” Indoor Air 12 (4): 243–251. https://doi.org/10.1034/j.1600-0668.2002.01128.x.
Standards Australia. 2012. The use of ventilation and airconditioning in buildings—Part 2: Mechanical ventilation in buildings. AS 1668.2-2012. Sydney, Australia: SAI Global under licence from Standard Australia.
Tartarini, F., P. Cooper, and R. Fleming. 2018. “Thermal perceptions, preferences and adaptive behaviours of occupants of nursing homes.” Build. Environ. 132: 57–69. https://doi.org/10.1016/j.buildenv.2018.01.018.
Xu, Y., S. Raja, A. R. Ferro, P. A. Jaques, P. K. Hopke, C. Gressani, and L. E. Wetzel. 2010. “Effectiveness of heating, ventilation and air conditioning system with HEPA filter unit on indoor air quality and asthmatic children's health.” Build. Environ. 45 (2): 330–337. https://doi.org/10.1016/j.buildenv.2009.06.010.
Zhao, W., S. Kilpeläinen, W. Bask, S. Lestinen, and R. Kosonen. 2022. “Operational challenges of modern demand-control ventilation systems: A field study.” Buildings 12 (3): 378. https://doi.org/10.3390/buildings12030378.
Information & Authors
Information
Published In

Journal of Architectural Engineering
Volume 30 • Issue 3 • September 2024
Copyright
This work is made available under the terms of the Creative Commons Attribution 4.0 International license, https://creativecommons.org/licenses/by/4.0/.
History
Received: Jul 3, 2023
Accepted: Feb 20, 2024
Published online: May 17, 2024
Published in print: Sep 1, 2024
Discussion open until: Oct 17, 2024
ASCE Technical Topics:
- [Inorganic compounds]
- Age factors
- Air pollution
- Air quality
- Architectural engineering
- Building systems
- Business management
- Carbon compounds
- Carbon dioxide
- Chemicals
- Chemistry
- Construction engineering
- Construction methods
- Environmental engineering
- HVAC
- Indoor environmental quality
- Organic compounds
- Pollution
- Practice and Profession
- Rehabilitation
- Ventilation
- Workplace diversity
Authors
Metrics & Citations
Metrics
Citations
Download citation
If you have the appropriate software installed, you can download article citation data to the citation manager of your choice. Simply select your manager software from the list below and click Download.