Acoustic Emission of Biocemented Calcareous Sand Base
Publication: International Journal of Geomechanics
Volume 23, Issue 9
Abstract
A meter-scale model test with microbially induced calcite precipitation (MICP) is an efficient method to validate this sustainable soil reinforcement technique. Mechanical and physical testing methods for evaluating the biocementation efficiency of model tests are still being explored. In this study, a meter-scale calcareous sand base was treated with MICP. The mechanical and physical characteristics of the sand base, such as strength, shear-wave velocity (SWV), and acoustic emission (AE) signals, were measured via cone penetration tests (CPTs), bender element tests, unconfined compression tests (UCTs), and AE tests. The CPTs showed that the strength of the sand base increases with the biotreatment level, and the maximum strength could be reached at eight-cycle treatment. The biotreatment showed heterogeneity within the sand base, which can be reflected by the differences in the dry density, SWV, and unconfined compression strength of the segmented specimens. The AE signals from both the CPTs and UCTs with avalanche analysis showed that the damage model in the tests involves both fracture and friction.
Introduction
Microbially induced calcite precipitation (MICP) is an innovative method for reinforcing soils in geotechnical engineering (DeJong et al. 2013; Xiao et al. 2022b). With the potential of developing to be a green and ecofriendly technique in the construction field, MICP has been studied extensively in recent years. It has been proven that MICP is efficient in improving soil engineering behavior, such as improving strength (DeJong et al. 2006; Gowthaman et al. 2019; Cheng et al. 2021; Mujah et al. 2021; Wu et al. 2021; Ma et al. 2022b, d), mitigating liquefaction (Montoya et al. 2013; O’Donnell et al. 2017; Dilrukshi et al. 2018; Xiao et al. 2018, 2019a; Zomorodian et al. 2019; Riveros and Sadrekarimi 2020a, b; Sun et al. 2021; Xiao et al. 2021c), reducing erosion (Wang et al. 2018; Al Imran et al. 2019; Liu et al. 2021; Xiao et al. 2022c, d), preventing desertization (Ivanov et al. 2019; Fattahi et al. 2020; Li et al. 2020; Nikseresht et al. 2020; Meng et al. 2021), and lowering permeability (Chu et al. 2013; Botusharova et al. 2020; Ma et al. 2021; Montoya et al. 2021; Song et al. 2021a, b). The investigation on MICP has been carried out with a multiscale method involving microfluidic tests (Wang et al. 2019; Xiao et al. 2021a, 2022a), particle-scale cementation (Ham et al. 2022; Ma et al. 2022a; Zhou et al. 2023; Gao et al. 2023; Wu et al. 2023; Xiao et al. 2023a, b), element tests such as sand column and triaxial tests (Feng and Montoya 2016; Cui et al. 2017, 2021, 2023; Liu et al. 2019; Xiao et al. 2019b, c; Ma et al. 2022c), small-to-large-scale model tests (Darby et al. 2019; Zhang et al. 2020; Gao et al. 2021; Zamani et al. 2021), and meter-scale or in situ tests (Gomez et al. 2017, 2018; Nassar et al. 2018; Xiao et al. 2021b, 2022d; Zamani et al. 2021). In addition, a series of numerical predictions have been performed for bio-chemical-hydro reactions (Wang and Nackenhorst 2020), reaction flow transportation (Barkouki et al. 2011; Qin et al. 2016; Nishimura and Matsubara 2021), bonding degradation (Gai and Sánchez 2019; Xiao et al. 2021c), stress–strain relationships (Yang et al. 2017, 2019; Kashizadeh et al. 2021; Zhang et al. 2021), and so on. The strength and stiffness improvement is the basic mechanical feature of the MICP-treated soil. The strength and stiffness of MICP-treated soil have been widely determined with the element test (Xiao et al. 2022b). The unconfined compression strength (UCS), drained and undrained strength, small strain stiffness, and dynamic strength can be determined, and their relationships with calcium carbonate (CaCO3) content can be established (Xiao et al. 2022b). For model-scale tests, the traditional in situ testing methods, such as cone penetration tests (CPTs) (Zeng et al. 2021; El Kortbawi et al. 2022) and geophysical seismic wave (GSW) measurements (Zeng et al. 2021), can be used. For example, Gomez et al. (2018) performed a large-scale model test to investigate the strength and stiffness of MICP-treated sands with CPT and shear-wave velocity (SWV) measurement. They showed that the CPT and the GSW measurement can detect the low-level biocementation for in situ applications. Darby et al. (2019) evaluated the CPT and SWV behavior of biocemented sand bases in the centrifuge tests. They found that both CPT and SWV results can capture the liquefaction and the postliquefaction behavior of the biotreated sand base. Montoya et al. (2021) used CPTs and bender element tests to evaluate the biocementation of a 0.91 × 1.22 × 1.22-m sandbox. They showed that the highest tip resistance is found at the two-diameter distance from the injection pile. We can see that CPT and SWV measurements are two efficient ways to evaluate the cementation efficiency of biocemented sand bases.
Acoustic emission (AE) is a nondestructive technique to detect the quality and physical properties of materials, which has been applied in the field of geotechnical engineering for decades (Dixon and Spriggs 2007). Acoustic emission can be used to detect damage and fracture development of various rocks under different test conditions (Lockner 1993; Jiang et al. 2021; Wang et al. 2021a). For soft and granular soils, acoustic emission is more complex due to the difficulty in analyzing the signals (Smith and Dixon 2019). Recently, with the development of the sensor technology and signal analyzing technique, the utilization of acoustic emission for investigating the engineering behavior of soils has gained more and more attention. Xiao et al. (2019d) analyzed the AE signals of single particle crushing corresponding to the force drop, and good correlations of the statistical properties between the two aspects can be found. Smith and Dixon (2019) measured the acoustic emission of sands in a drained triaxial test, and they found that AE is indicative of the deformation, peak strength, and shear zone development of sands. On a large scale, Dixon and Spriggs (2007) used a real-time acoustic emission monitoring system to access the stability of a slope under rainfall. They found a good relationship between the acoustic emission signal and slope movement. For cemented soils, the collapse of bonds and grains could also be indicated with AE signals (Wang et al. 2021b). However, the collapse and discontinuous damages of biocemented sands are complex and cannot be easily explained with traditional mechanical theory (Salje et al. 2021). The avalanche dynamics in statistical physics, which has been used in earthquake studies with the advantages of explaining the signals crossing several orders of magnitudes (Cieplak and Robbins 1988; Salje and Dahmen 2014; Chen et al. 2019), provides a new way for analyzing the discontinuous damages of biocemented sands. Wang et al. (2021b) investigated the collapse of biocemented sands via avalanches, and they showed that the avalanche exponents of biocemented sands are identical to those of consolidated sands, indicating that they have similar collapse mechanisms. It was recognized that the collapse of biocemented samples involves the models of fracture and friction, and their characteristics can be captured with the information in AE signals. Measuring acoustic emission within the CPTs has been reported in previous studies. It was attempted to characterize the soil properties with acoustic signals. Yu et al. (2022) showed that the soil particle size can be differentiated with the axial interface shearing-induced AE signals during the CPT. As aforementioned, it was proposed that AE signals from the CPTs in the cemented soils could be helpful in identifying the cementation and breakage features, where related studies are still rare. In this paper, a meter-scale model test was performed to reinforce a calcareous sand base with MICP. The CPT and AE measurements were performed during the tests to quantify the biocementation strength and characterize the cementation effect. The biocemented sand base was segmented after the final treatment, and the SWV and UCS, with AE signals, were measured. Finally, the AE signal characteristics with the failure of the biocemented sands were discussed.
Experimental Details and Testing Procedures
The bacteria used in this study were Sporosarcina pasteurii. The bacterial solution was prepared with culturing bacteria in a large reactor, as shown in Fig. S1(a) (provided as the Supplemental Materials ), where 70 L of cultured bacterial solution was diluted to 100 L with 30 L of warm boiled water. The activity of the bacterial solution was examined with electrical conductivity before treatment (van Paassen et al. 2010). The cementation solution was prepared with industrial urea and calcium chloride at a volume of 100 L with a concentration of 1 mol/L. The tested sand was calcareous sand from the South China Sea. It was composed of biological fragments, and the CaCO3 content was larger than 95%. The sand possessed the following physical properties: a specific gravity of 2.81, a mean diameter of 0.43 mm, a coefficient of uniformity of 1.96, a maximum dry density of 1,588 kg/m3, and a minimum dry density of 1,279.2 kg/m3. The morphology and its particle shape parameters are shown in Fig. S2 (provided as the Supplemental Materials ). As shown in Fig. S1(b) (provided as the Supplemental Materials ), the soil model box with a removable loading reaction frame had a length of 1 m, a width of 0.8 m, and a height of 0.8 m. The sand base was prepared with the air pluviation method (Shi et al. 2022) in three layers at 0.7 m depth. During sand deposition, the opening of the pluviation apparatus was kept nearly zero to the sand base surface, and the overall dry density and the global void ratio of the sand base were determined at 1,362.5 kg/m3 and 1.063, respectively, which can be recognized as a loose sand base. Four injection pipes and one outlet pipe were buried in the sand base with the distribution diagram shown in Figs. S1(b) and S3 (provided as the Supplemental Materials ). The holes on the injection pipes were made uniformly and covered with a layer of scouring pad to prevent the clogging. The holes on the outlet pipe were larger than those on the injection pipe to ensure the draining capacity. The injection pipes were connected to a self-priming pump, which had a pressure capacity of 300 kPa. In this study, the grouting pressure was kept at around 20 kPa to avoid the disturbance to the soil matrix, as shown in Fig. S1(b) . In the first step of the biotreatment procedure, the sand base was flushed with tap water by an injection pipe and submerged for 24 h before the treatment. As for the second step, water (or the cementation solution) was discharged by the other pump, while the bacterial solution was injected into the sand base and cycled for 4–5 h, as shown in Fig. S1(b) . In the third step, the bacterial solution was discharged, while the cementation solution was injected into the sand base and cycled for 18–20 h. Therefore, the first cycle of treatment was completed. Then, the second and third steps were repeated 12 times until the final treatment was completed.
A self-developed CPT system was used in this study, as shown in Fig. S1(c) (provided as the Supplemental Materials ). The system was composed of two penetration rods with a length of 300 mm and a diameter of 10 mm, a load cell with a capacity of 500 kg, a probe with a diameter of 15 mm and a cone tip angle of 60°, and a data acquisition module. The penetration rate was set at 2 mm/s. With the adjustable reaction frame, the penetration could be performed at 22 locations in the sand base, as shown in Fig. S4 (provided as the Supplemental Materials ). The penetration depth was 60 cm. For measuring the AE signals, two AE sensors (Nano30 from Physical Acoustics Corporation, Princeton, NJ, USA) were fixed on the penetration rods oppositely. After amplification, the signals were recorded with an acoustic emission workstation. The background noise, which was mainly from the driving motor, was erased from the signals by setting a threshold value of 48 dB by running the unloading tests. After the final treatment and the CPT, the biotreated sand base was segmented into three layers, A, B, and C, from top to bottom. Each layer was equally divided into nine areas so the sand base could be segmented into 27 blocks, which were further cut into cuboid specimens with a size of 50 × 50 × 100 mm, as shown in Fig. S1(c) . A total of 27, 36, and 36 samples in A, B, and C, respectively, were selected for testing SWV and UCS after drying in an oven at 110°C for 48 h. In the UCS test, the loading rate was set at 0.2 mm/min, and the AE signals were also recorded simultaneously, as shown in Fig. S1(c) . The measurement of SWV in this study was performed with one pair of bender elements. Single sine waves with an amplitude of 20 V and a frequency of 15 kHz were excited, and the peak-to-peak method (Shi et al. 2021, 2022) was used for signal interpretation, as shown in Fig. S4 . The diagram of the measuring system is shown in Fig. S1(d) (provided as the Supplemental Materials ).
Experimental Results and Discussion
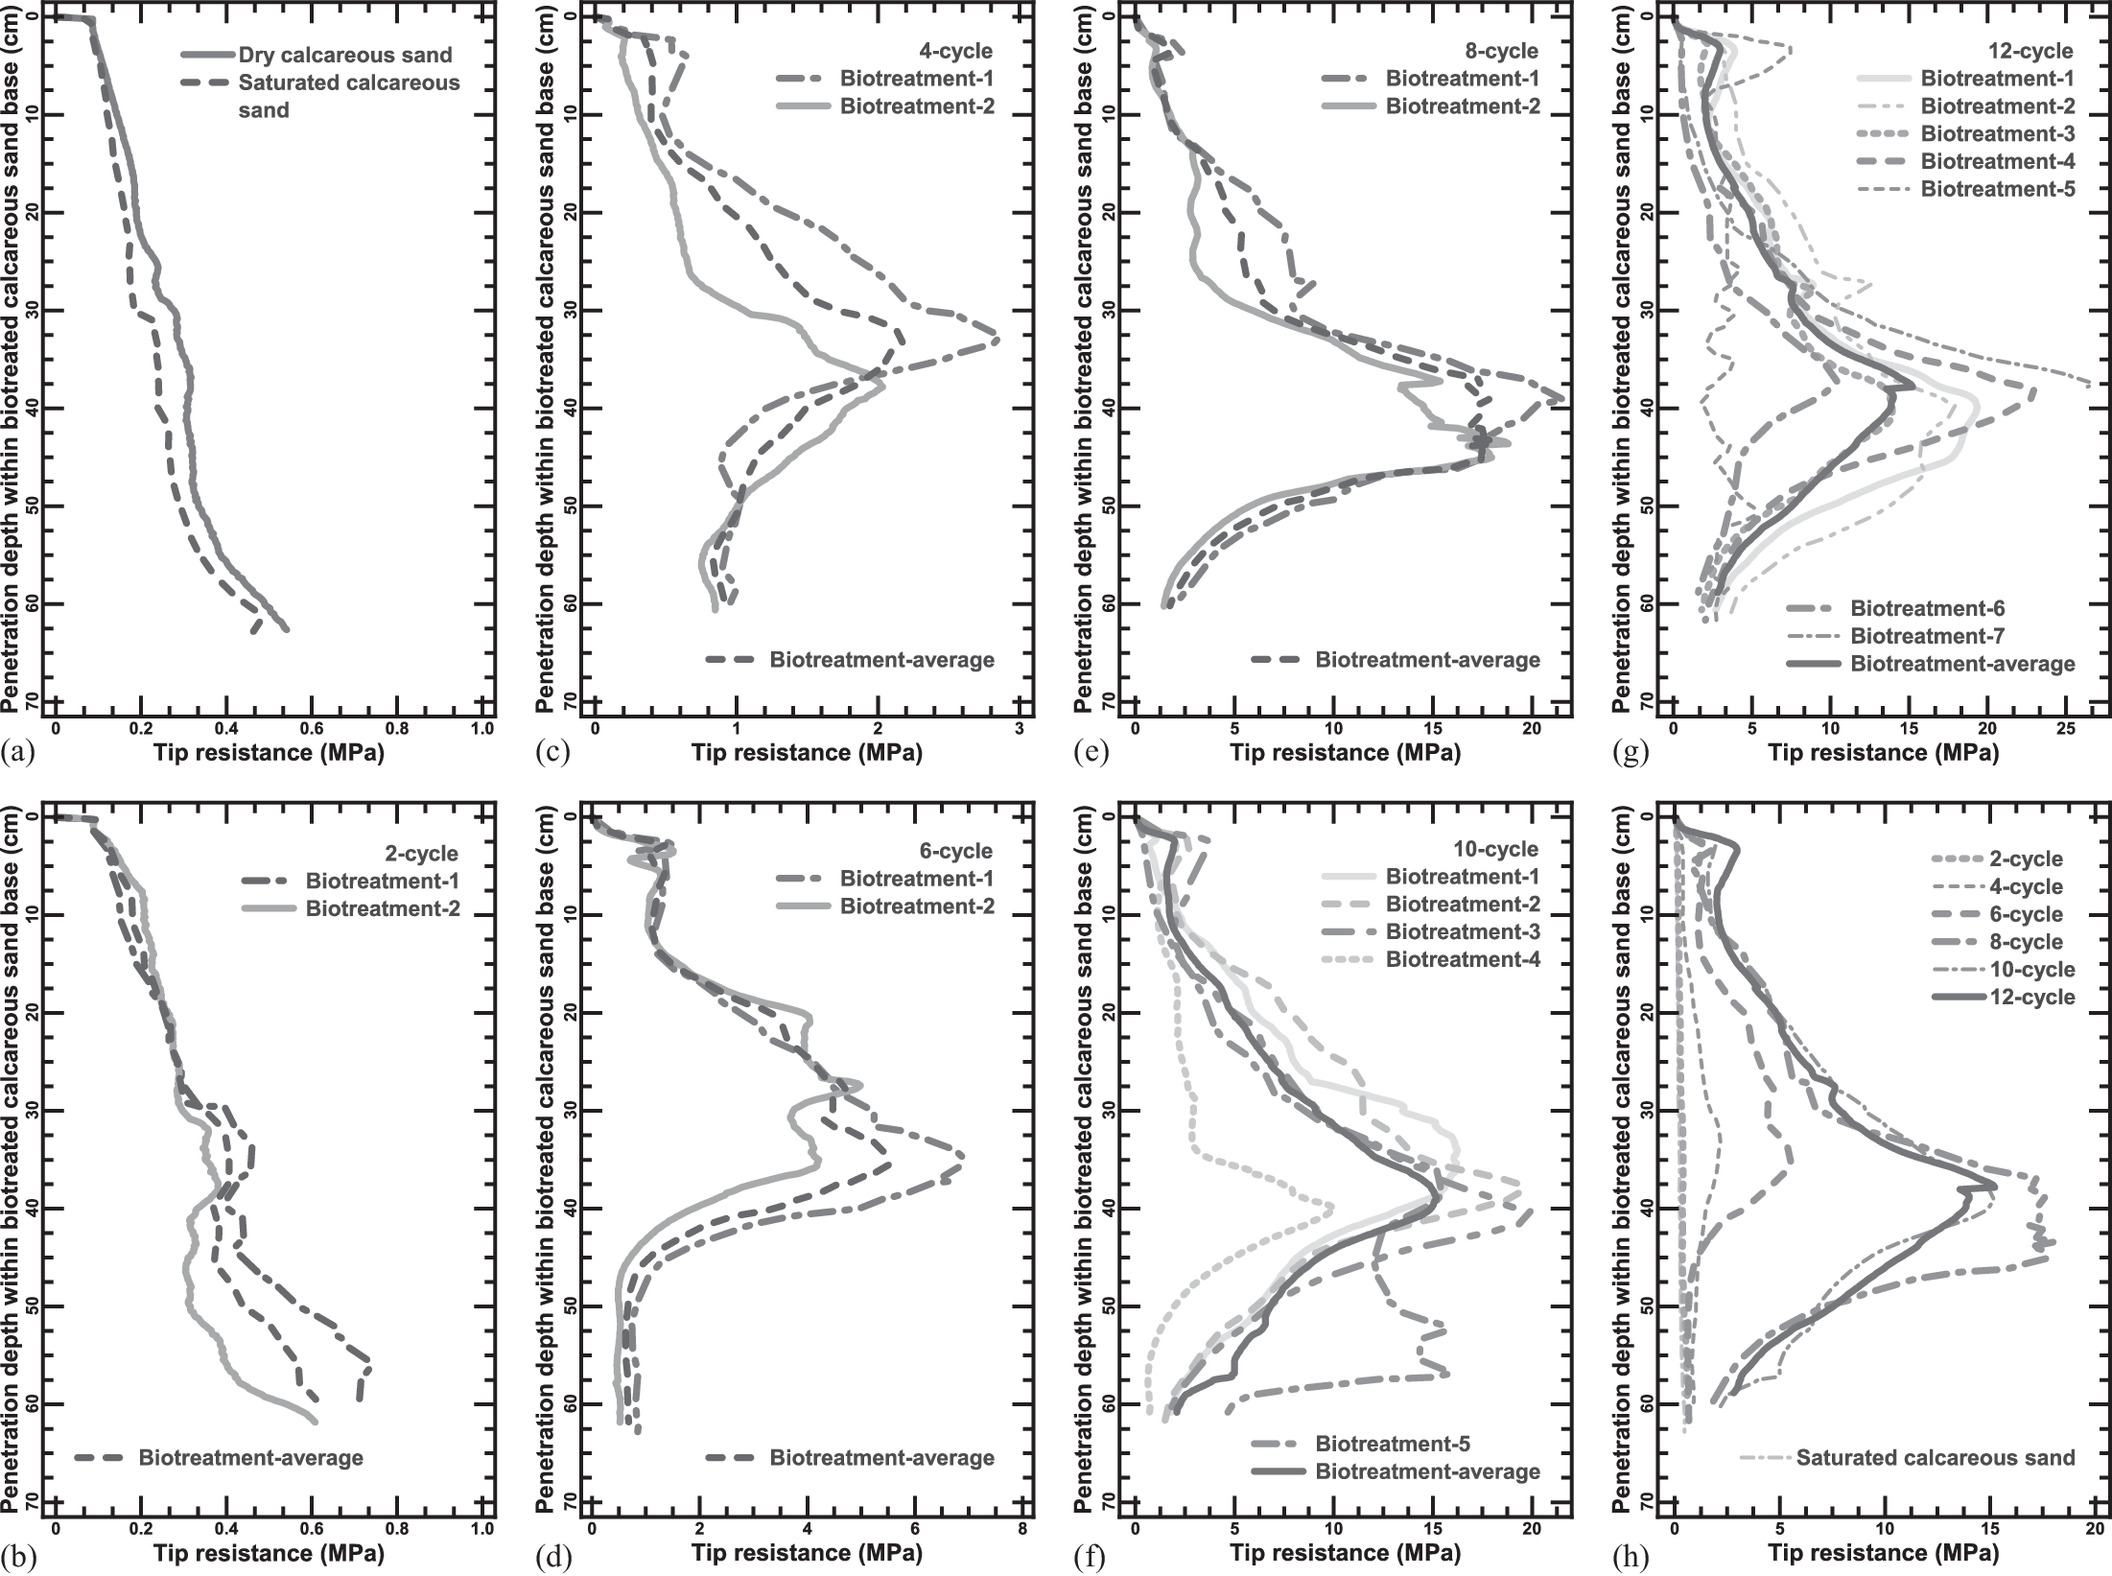
Figs. 1(a–h) show the tip resistance, qt, along the sand base depth for all the biotreatments. It can be seen that qt increases significantly with an increase of biocementation level. The maximum qt observed along the depth, denoted qtm, is 26.59 MPa after the final treatment, which is around 55 times the lowest value from the saturated untreated condition. Specifically, we can find that the qt of the dry sand is larger than that of the saturated sand in Fig. 1(a), which is reasonable due to the decreased friction in the saturated state. For the untreated sand base, the qt increases continuously with the penetration depth, and the qtm is found at the end of the penetration. With biotreatment, the qt starts to change. For the two-cycle treatment in Fig. 1(b), the qt shows a sudden fluctuation at a depth of 30–40 cm, but the qtm is still at the deepest location. For four-cycle and higher-cycle treatments in Figs. 1(c–g), the qtm is always located at a depth of 30–50 cm except Point 5 of the 10-cycle and 12-cycle treatments. Point 1, which is closer to the outlet pipe in Fig. 1(c), shows higher qt in the four-cycle treatment, indicating that the biotreatment around the outlet pipe is more efficient. The qtm value of the six-cycle treatment in Fig. 1(d) is 2–3 times larger than that of the untreated one. Furthermore, the qtm value is 6–10 times larger for the eight-cycle treatment in Fig. 1(e) than for the untreated one. It is necessary to mention that Point 4 of the 10-cycle treatment in Fig. 1(f) overlaps with the point of the untreated dry sand in Fig. 1(a). Therefore, the qtm value is much lower than the others at the same biotreatment level. This also indicates that the disturbance to soil integrity induced by the penetration cannot be neglected even in the uncemented state. Seven penetration points were tested after the 12-cycle treatment, and the qt showed significant differences, as shown in Fig. 1(g). The first four points could again prove that the closer to the outlet pipe, the higher the soil strength. The low qt of Point 5 is due to the disturbance of the scouring pad because it is too close to the outlet pipe. The largest value of qtm in the whole tests is given by Point 7. The CPT results in this study indicate that the lower middle layer of the sand base was treated most efficiently by the MICP method. In addition, the overall strength increases with the biotreatment levels, as shown in Fig. 1(h) for the average value of each biotreatment level. However, the strength improvement after eight-cycle treatment seems to be mitigated, which might be caused by clogging.
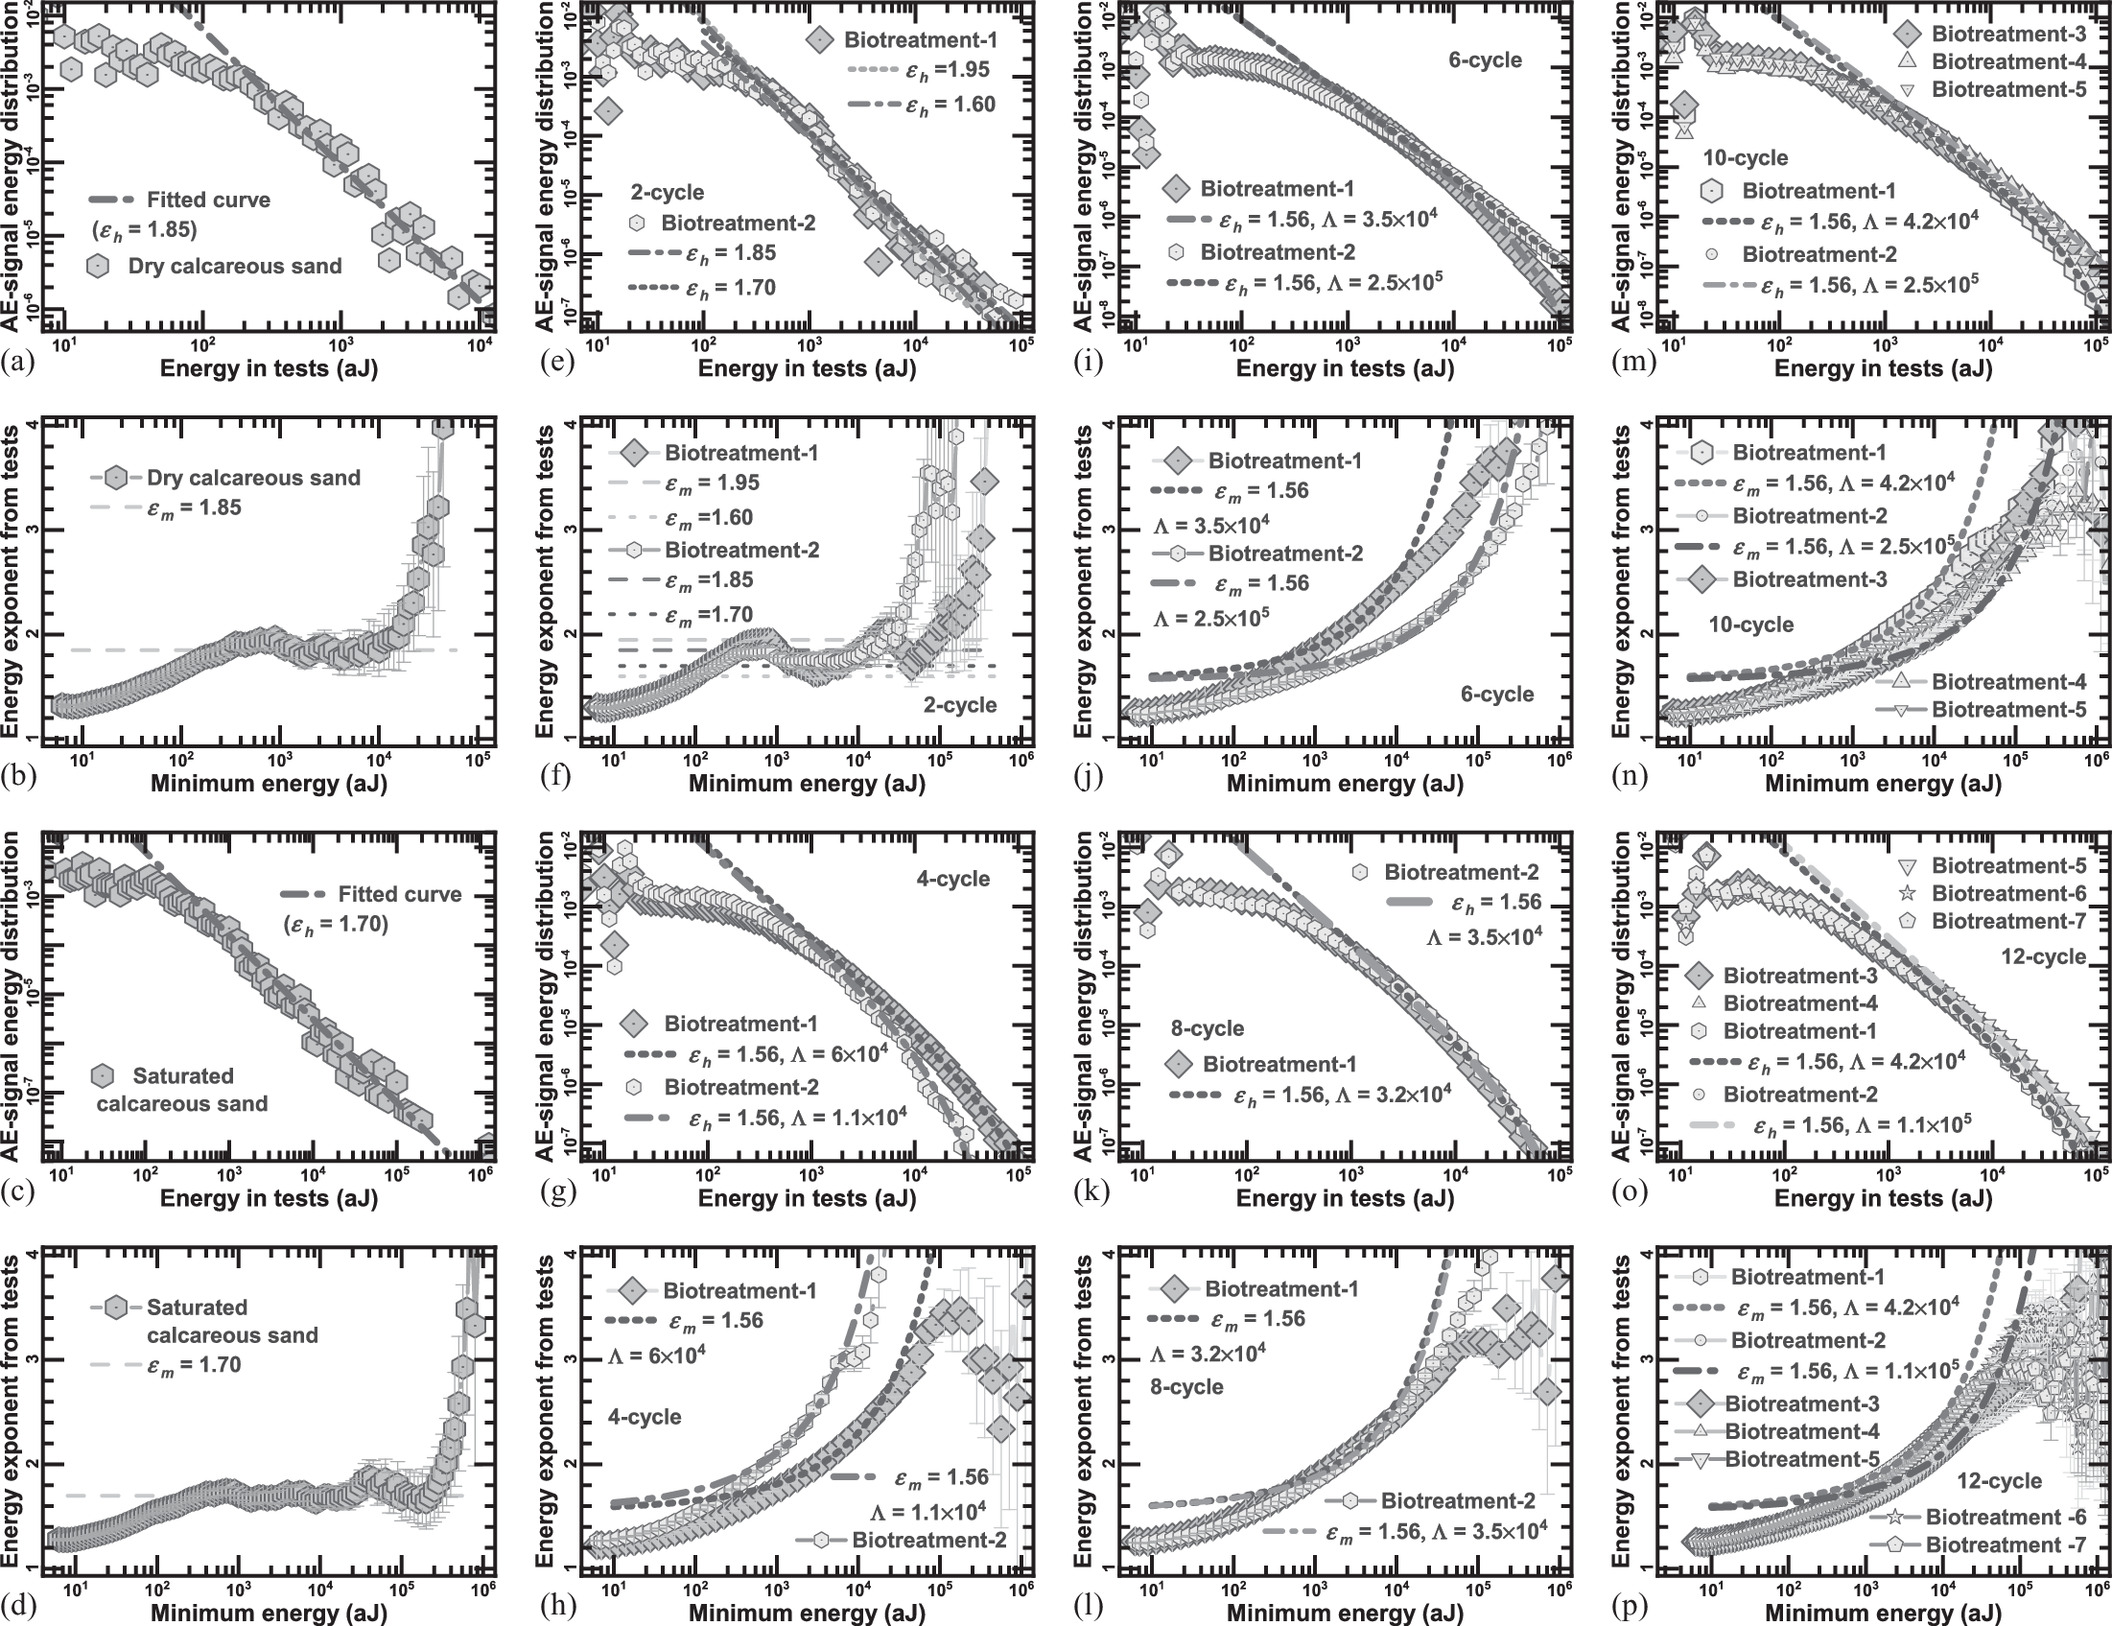
The avalanche analysis for the cone penetration in the biotreated sand base would be performed via the distribution of the AE signal energy and the maximum likelihood (ML) estimation, where the power-law (PL) exponent of avalanche parameters used in this study can be obtained from the PL distribution of the AE-signal energy. The PL distribution and PL exponent from CPTs under dry, saturated, and different biocemented levels were compared. The details of the concepts in avalanche analysis are given in Eqs. (S1)–(S18) (provided as the Supplemental Materials ). Figs. 2(a and b) show the AE-signal energy distribution and the result-based ML estimation on the CPT data of the biotreated sand base. The relationship between the energy probability distribution, P(E), and energy, E, can be fitted with a power function [see Eq. (S3) in detail]. The slope of the fitted line was taken as the PL exponent with the AE-signal energy distribution method ( ), as shown in Fig. 2(a). For the analysis of the ML method, the plateau in the energy exponent versus a certain varying minimum event energy indicates the PL distribution. The energy exponent at the plateau is denoted the PL exponent with the ML method ( ). It is seen that both the PL exponents from energy probability distribution and ML method are similar for the dry condition [ = = 1.85 in Figs. 2(a and b)] and the saturated condition [ = = 1.70 in Figs. 2(c and d)], respectively. Wang et al. (2021b) reported that the threshold or of calcareous sand for friction is 1.70, which is the same as that at the saturated condition and close to that in the dry condition in this study, further implying that the avalanche mechanism from the CPTs in the dry and saturated sand base is the friction regime. Besides, the addition of water in the friction among sand grains leads to a decrease in the PL exponent (Lin et al. 2020). Figs. 2(e and f), (g and h), (i and j), (k and l), (m and n), and (o and p) show the results of the AE-signal energy distribution and ML estimation for the biotreated sand base with 2, 4, 6, 8, 10, and 12 treating cycles, respectively. Based on Figs. 2(e and f), it is seen that the value of or is in the range from 1.6 to 1.95, which is mostly higher than the threshold value of 1.7 for the friction regime. The or of 1.6, lower than the threshold value for the friction regime, means that the sources of AE change, and the cracking appears as the sands are slightly treated with two-cycle biotreatment. The damped PL distribution is another critical exponential distribution model for the ML estimation [see Eq. (S15) in detail] (Salje et al. 2017; Zhao et al. 2019). From Figs. 2(g–p), following four-cycle biotreatment, the AE-signal energy distribution exhibits the format of the damped PL distribution, which is consistent with the PL distribution in Zhao et al. (2019). Strength of the calcareous sand base with four-cycle biotreatment or more increases significantly due to the sufficient amount of CaCO3 bonds. During the CPT, the bonds among grains fracture; meanwhile, the sand movement is restrained by the surrounding soils fixed with biocementation, which is similar to crackling noise under confining pressure for avalanches in compressed sandstone (Zhao et al. 2019). The fracture of the sand base shows certain damping, inducing the change of PL distribution. The data in Figs. 2(g–p) are well predicted by Eq. (S15) . It is seen that or is 1.56 for all the penetrations in the biotreated sand base with 4–12 treating cycles, and the influence of biotreatment level on or is negligible. The or of 1.56 falls in the range between the thresholds of 1.37 and 1.70, which indicates the coexistence of the fracture and friction regimes (Zhao et al. 2019; Wang et al. 2021b). A damping scale (Λ) exhibits different values for the CPTs with different biotreatment levels, but it shows no correlation with the core penetration strength (CPS). It is summarized that the avalanche in the CPTs develops from the pure PL distribution with a single friction model in the untreated states to the mixed PL distribution containing both friction and fracture models in the two-cycle biotreated sand base. With the biotreatment level further increasing, the sand base shows the avalanche of the damped PL distribution with the coexistence of the fracture and friction regimes.
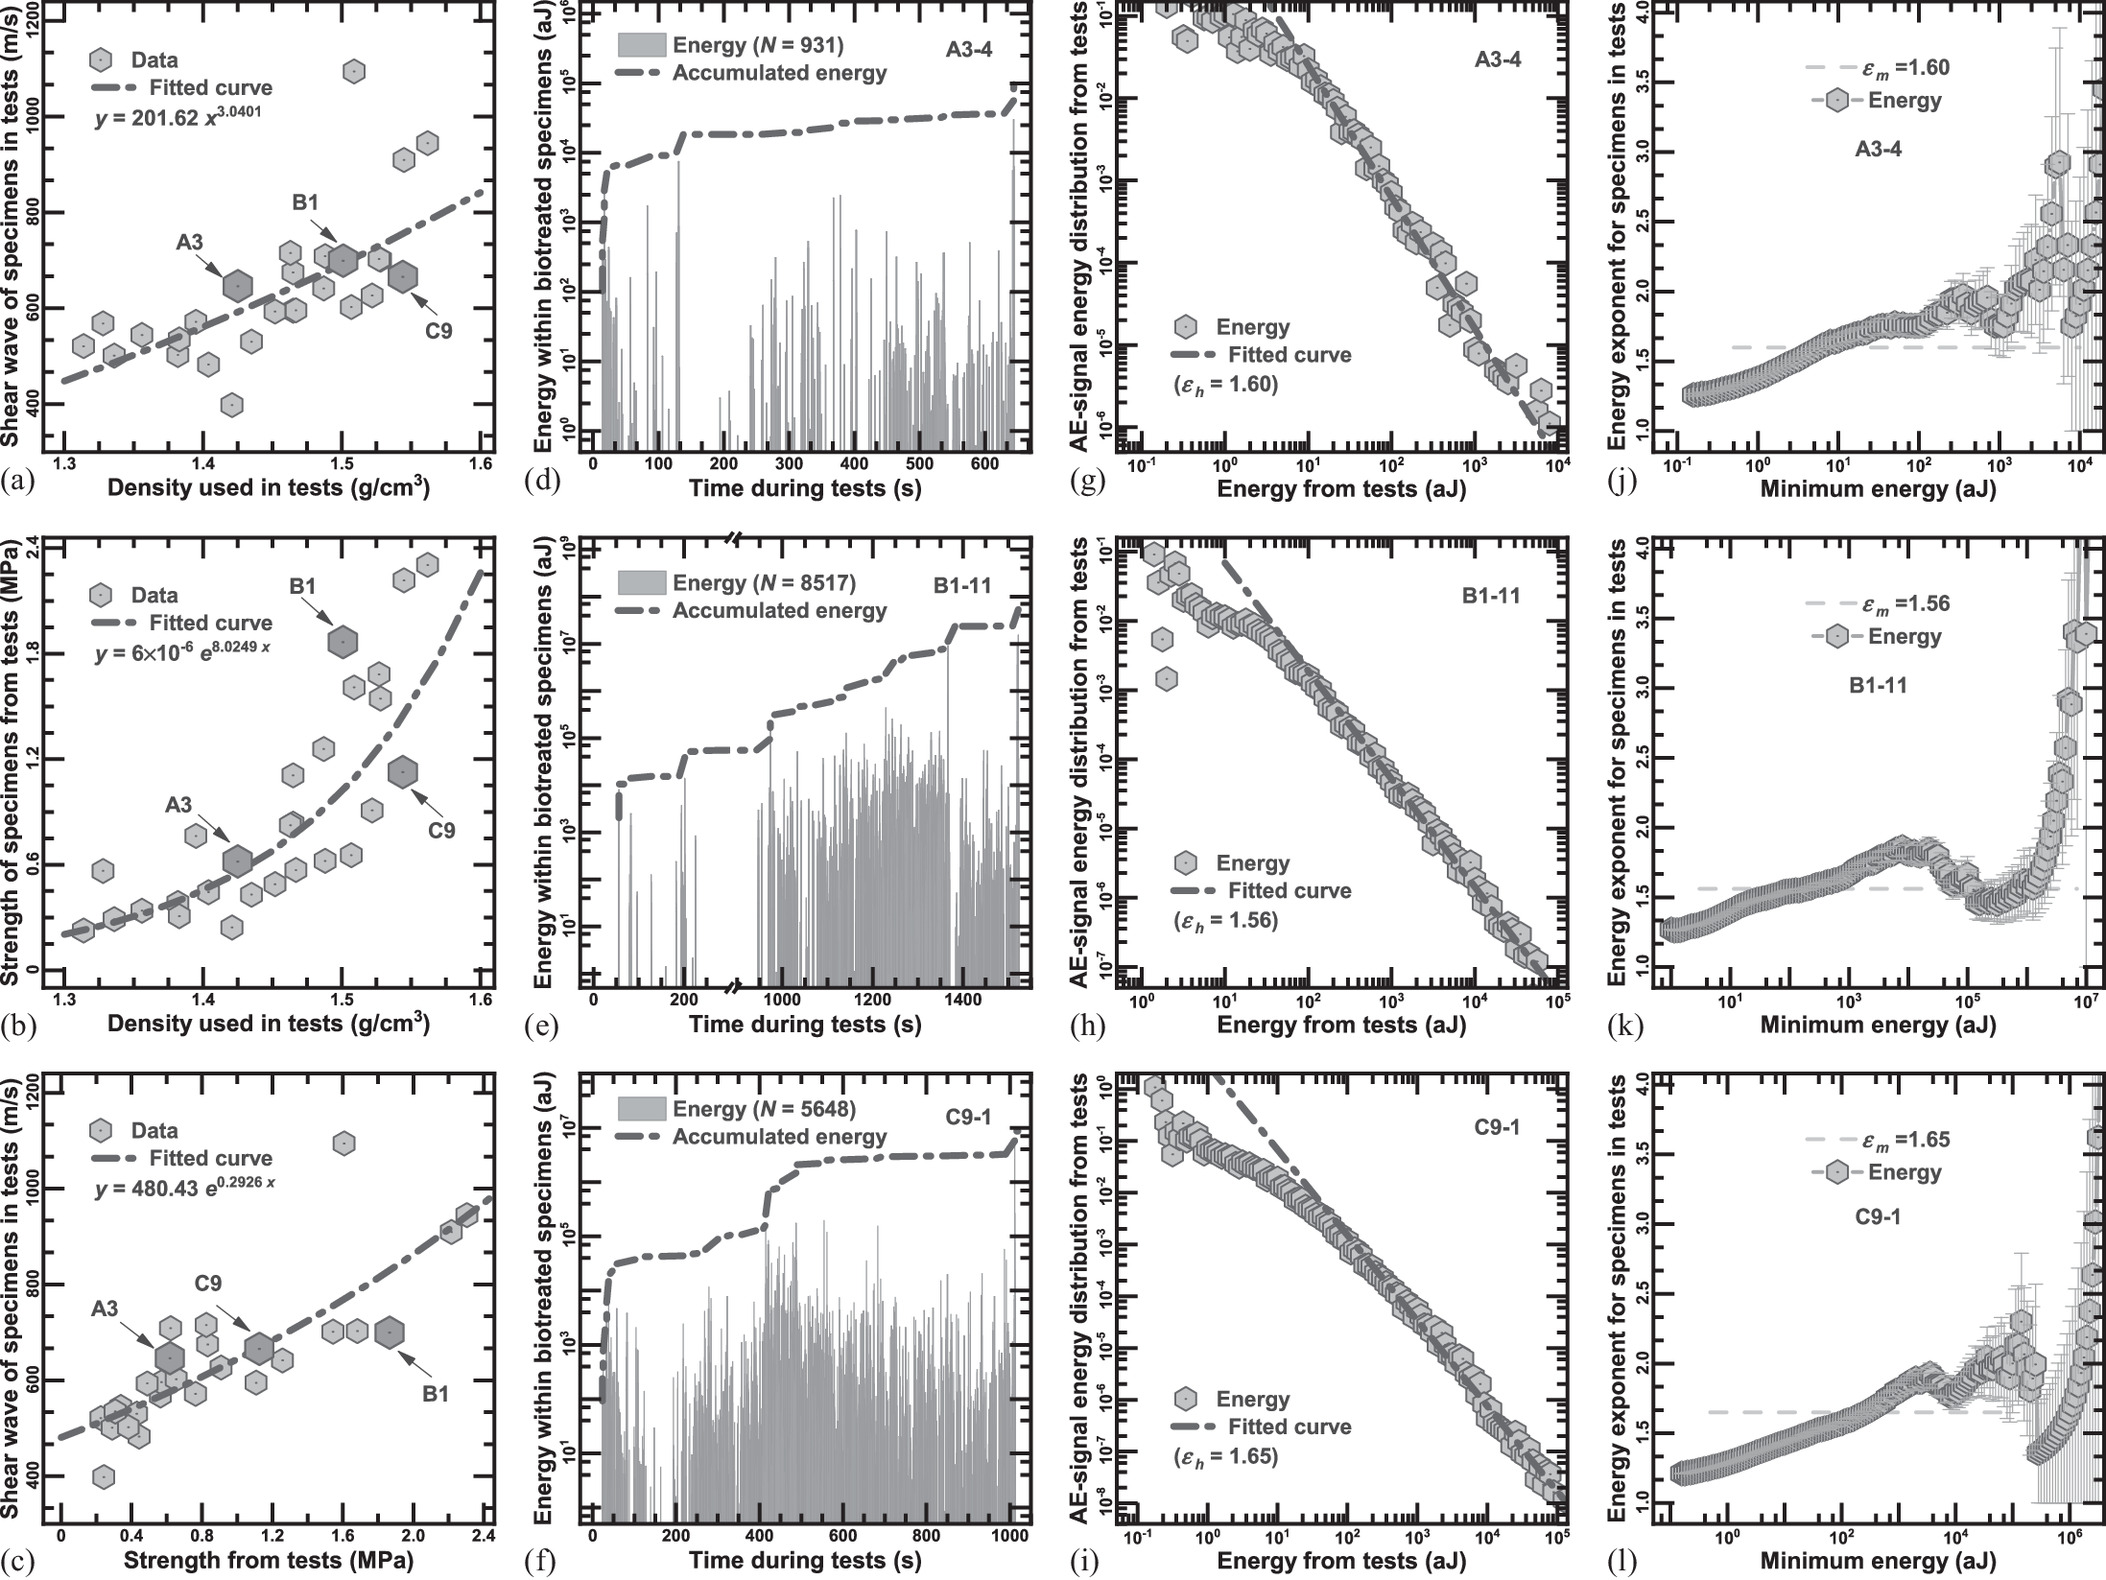
To find more information of the biotreated sand base, the segmented specimens were subjected to the SWV measurement, density determination, and UCS tests with AE measurements, as exhibited in Figs. 3(a–l) and S5 (provided as the Supplemental Materials ). Figs. 3(a–c) show the relationships among the SWV, dry density, and UCS, respectively. It is seen that the dry density varies from around 1.32 to 1.56 g/cm3, implying that the biotreatment is inhomogeneous in the calcareous sand base. The SWV and UCS show a positive correlation with the dry densities, which can be fitted with a power function and an exponential function, respectively. The increment of dry density could be mainly due to the CaCO3 precipitate and the remnant of other chemical and organic substances. Based on the data in this study, the UCS is more sensitive to biotreatment, and the increased amplitude is enlarged with the increase of dry density. Gomez et al. (2018) reported similar relationships between the SWV and CPS with the CaCO3 content. In this study, due to the use of calcareous sand, the determination of the CaCO3 content is impractical. The variation of dry density could be used as an indicator for the amount of CaCO3 generated. Therefore, it is deemed that the test results in this study can meet the conclusions in previous studies, providing the evidence for further AE signal analysis. For each of Layers A, B, and C, the AE signals of seven specimens were selected for avalanche analysis. Figs. 3(d–l) show the exampled specimens of Layers A, B, and C, respectively. The AE spectra of the three specimens in the UCS tests are plotted in Figs. 3(d–f), which are in line with the typical AE spectra of the biocemented specimens found by Wang et al. (2021b). Figs. 3(g–i) show the PL distribution of AE-signal energy for the three specimens. In log–log coordinates, the distributions exhibit linear forms. The fitted values by Eq. (S3) for A3-4, B1-11, and C9-1 are 1.6, 1.56, and 1.65, respectively. The different values might be attributed to the different components of facture models in the AE signals. As discussed for the results of CPTs, the values of for three specimens are in the range between 1.37 and 1.7, which indicates that the fracture in UCS tests involves both crack propagation and friction. Considering the heterogeneity of biotreatment, the proportions of crack propagation and friction vary for different specimens, leading to the inconsistency of PL exponents. However, the values of are quite close to each other and stay at around 1.6. This also reflects the generally consistent AE behavior of the calcareous sand base. In Figs. 3(j–l), the ML estimation curves exhibit the plateau or the progressive lifting stages. This indicates that the avalanche mechanism of the specimens from unconfined compression tests (UCTs) is the PL distribution, which is similar to the element test results from Wang et al. (2021b).
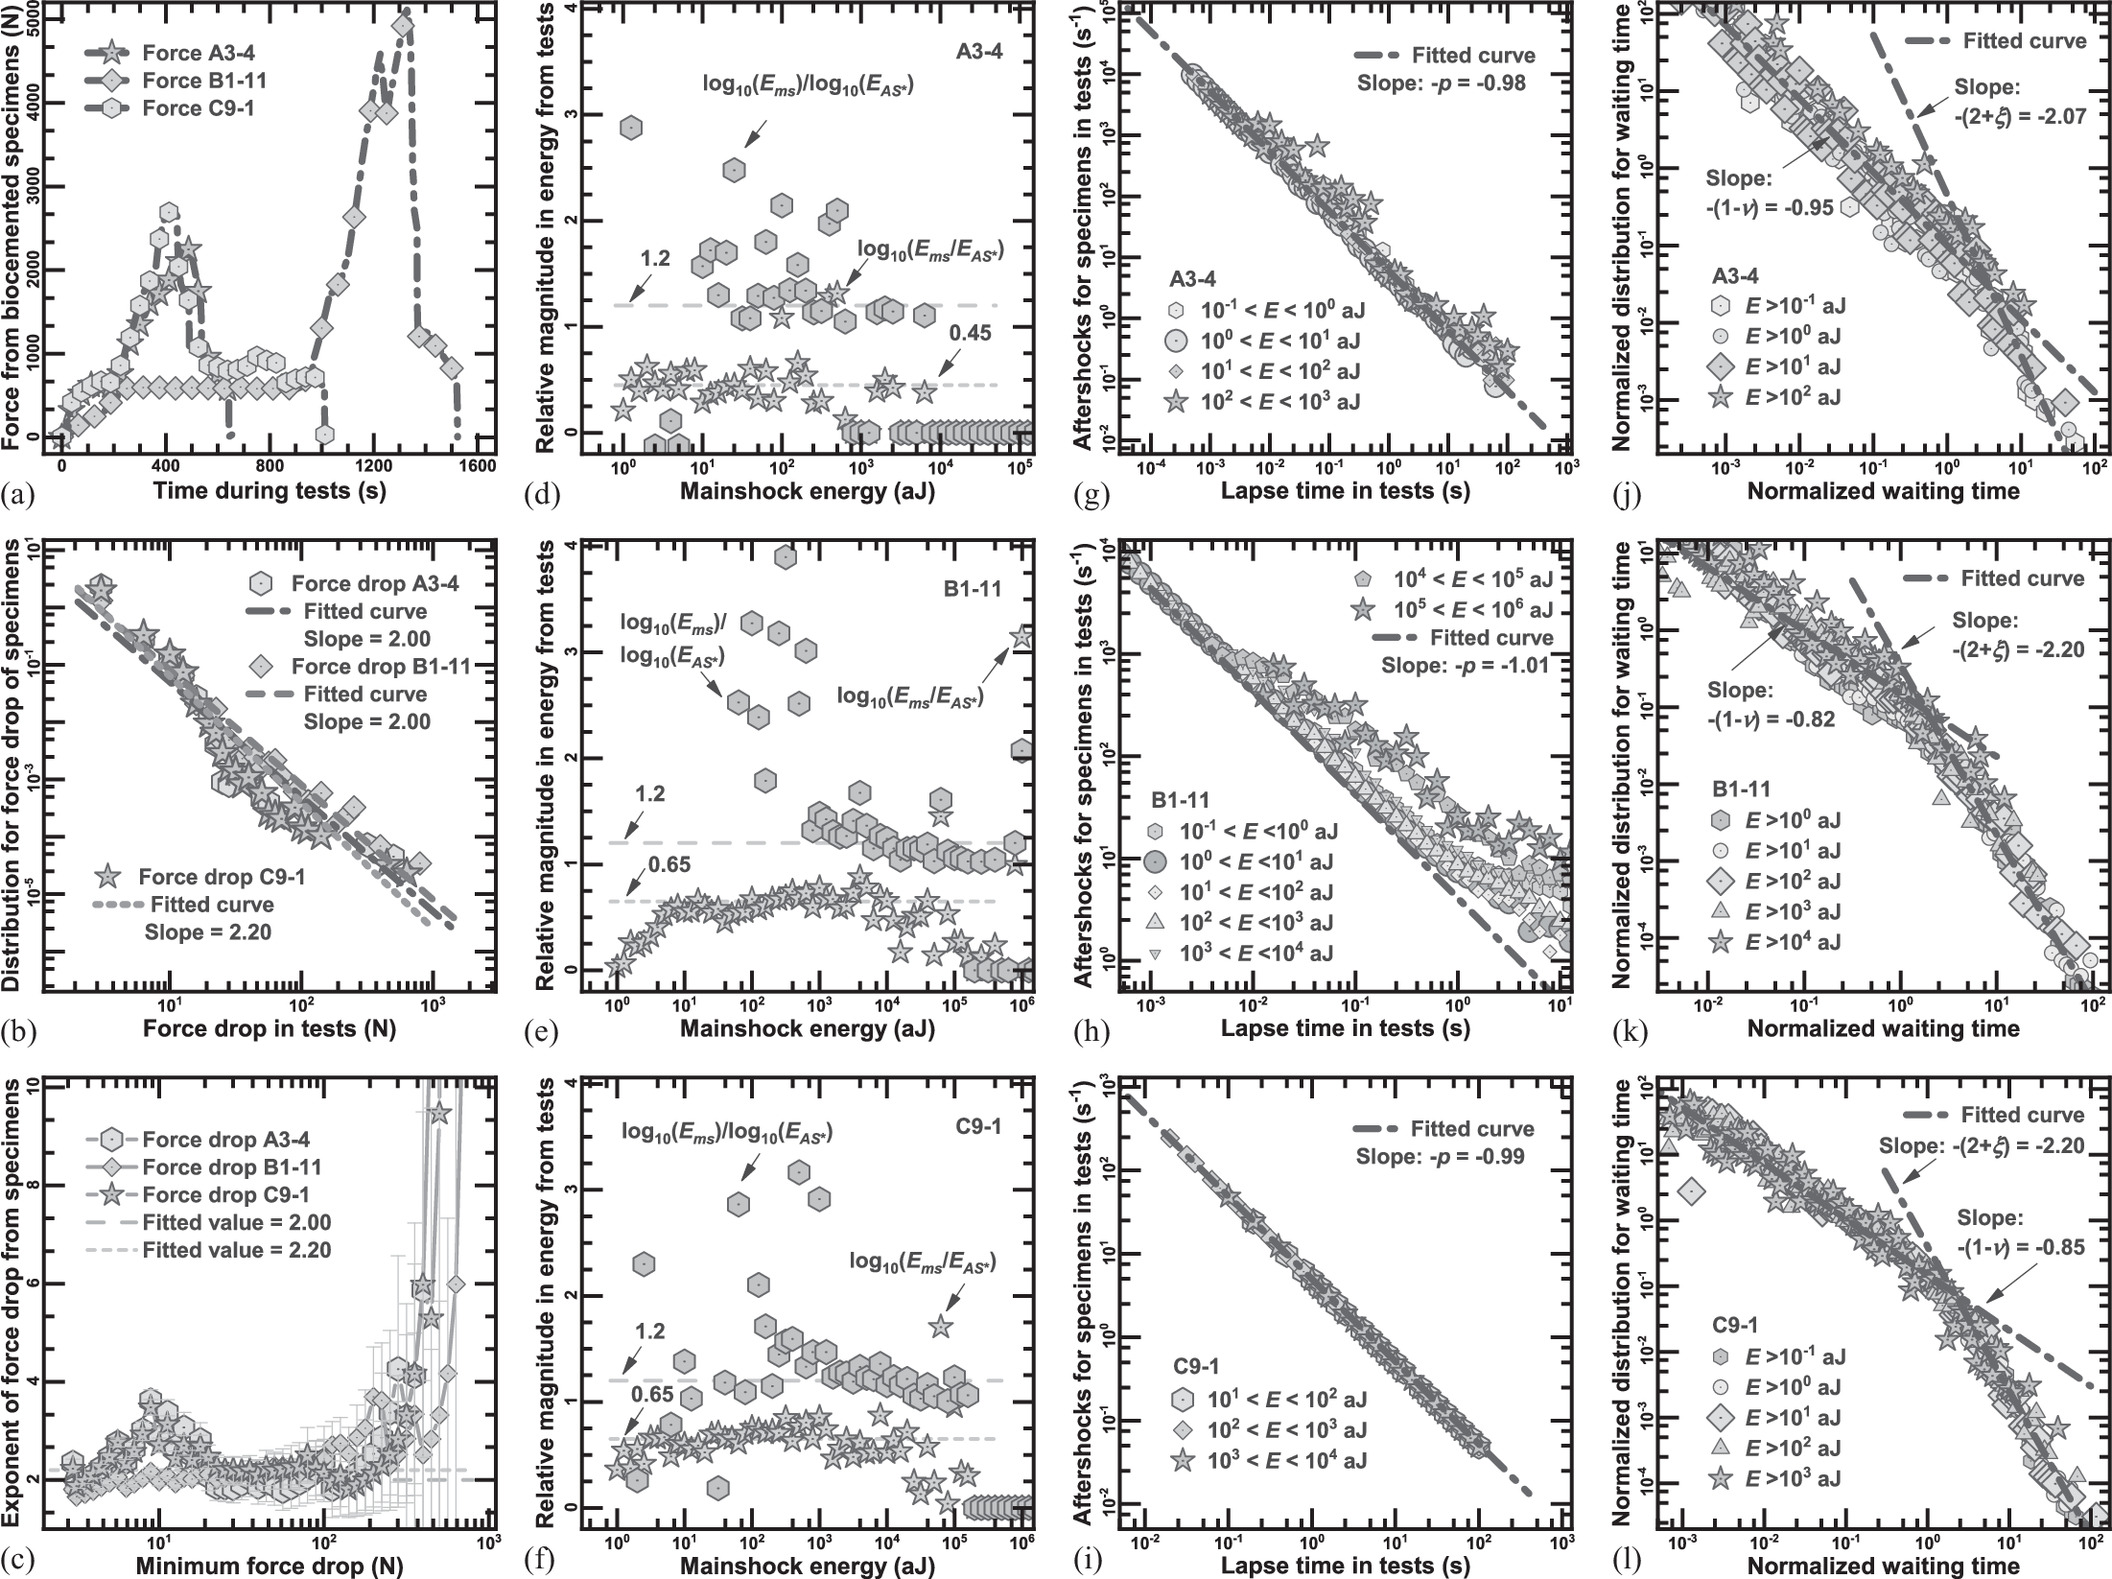
The force–time relationships for the three specimens are given in Fig. 4(a). The middle layer specimen, B1-11, shows the highest force among the three specimens, indicating the best performance of biotreatment for this layer. Xiao et al. (2019d) analyzed the discrete signals generated by the force drop via avalanche statistic laws and found that the power law can well describe the force drop distribution. In this study, the force drop was also analyzed by the avalanche analysis with the PL distribution and ML estimation methods, as shown in Figs. 4(b and c). It is seen that the PL exponents of the drop forces for A3-4, B1-11, and C9-1 are 2.0, 2.0, and 2.2, respectively. The fitting of A3-4 and C9-1 is not linearly well exhibited, corresponding to the discrete data in the ML estimation with the mixed PL distributions and the show-up peaks at low force drops. Few studies report whether the mechanism of the mixed PL distribution of force drop is identical with that of energy. Soprunyuk et al. (2017) showed that the avalanche statistical analysis cannot produce acceptable results due to the lack of signals when using “drop” signals. It can also be observed in Figs. 4(b and c) that the amount of “drop” is quite limited, which constrains the analysis in this study as well. Figs. 4(d–l) present the relative-magnitude (RM) distribution based on Båth’s (1965) law, the aftershock-sequence (ASS) distribution based on Omori’s (1894) law, and the waiting-time (WT) distribution. In Båth’s law, the relative magnitude, ΔM, is defined as the logarithm of the ratio between the main shock energy, EMS, and the maximum-aftershock energy, [see Eq. (S16) provided as the Supplemental Materials ], and the value of ΔM is statistically around 1.20 (Båth 1965; Console et al. 2003). However, the values of ΔM for Specimens A3-4, B1-11, and C9-1 in Figs. 4(d–f) are 0.45, 0.65, and 0.65, respectively, which are not the statistical result 1.20 of Båth’s law. Curiously, when the equation of Båth’s law is changed as the ratio of log10(EMS) to [see Eq. (S17) provided as the Supplemental Materials ], the values of ΔM obtained by the revised formulation for the three specimens approach 1.20 [Figs. 4(d–f)], which is in agreement with Båth’s law statistics for the biotreated calcareous-sand column (Salje et al. 2021; Wang et al. 2021b). Salje et al. (2021) also found a similar phenomenon in their experiments, which may be due to the effect of the choice of maximum aftershock. The “maximum aftershock” selected may not be the true maximum aftershock. Omori (1894) pointed out that a smaller earthquake influenced by the mainshock is called an aftershock. The “maximum aftershock” selected by Eq. (S16) may be a main shock caused by other actions. The selected “maximum aftershock” energy is generally greater than the real , and thereby, the result is smaller, as shown in this paper and Salje et al. (2021). Omori’s (1894) law was proposed for describing the attenuation of aftershocks with time after the main shock in the form of the PL distribution. Utsu et al. (1995) proposed the decay principle of the aftershock frequency [see Eq. (S18) provided as the Supplemental Materials ]. Figs. 4(g–i) show the ASS distribution of A3-4, B1-11, and C9-1, respectively. The ASS distribution can be fitted with a straight line crossing several energy ranges, where the slope for Specimens A3-4, B1-11, and C9-1 is −0.98, −1.01, and −0.97, respectively, and the negative value of the slope is Omori’ law exponent (p). The three distributions can meet Omori’s law, showing p approaching 1.0, which is in line with that for the biocemented calcareous-sand columns by Wang et al. (2021b). The WT distribution describes the distribution of the waiting time (δ), that is, the time interval of two adjacent avalanches (Alava et al. 2006), and the WT distribution generally shows a double PL distribution with two-straight-line fitting in a double-logarithmic coordinate (Baró et al. 2013). In Figs. 4(j–l), the WT distribution of the AE signals is normalized by their average, 〈δ 〉. Figs. 4(j–l) show that the specimens in this study follow the double PL distribution with two lines in the double-logarithmic coordinate, and the negative value of slope for the two lines is (1 − υ) in the lower segment and (2 + ξ) in the larger segment (Corral 2004; Salje and Dahmen 2014). The value of (1 − υ) or (2 + ξ) for the biotreated specimens in the current study is quite close to that for the biocemented calcareous-sand columns by Wang et al. (2021b). Consequently, the results of the RM, ASS, and WT distributions for the specimens from the biotreated calcareous-sand base in this study show high consistency with those for the biotreated calcareous-sand columns by Wang et al. (2021b), which is not influenced by the AE sources, specimen scale, and biotreatment strategy. As it is deemed that the RM, ASS, and WT distributions are greatly robust for avalanche analysis (Davidsen et al. 2007; Baró et al. 2013; Wang et al. 2021b), the AE signals of the specimens from the biotreated calcareous sand base could be used to classify the damage model based on avalanche analysis, further implying that AE signals can be applicable for identifying the fracture behavior of biotreated soils in field scale.
Conclusions and Remarks
In this study, a meter-scale calcareous sand base is reinforced with MICP for a total of 12-cycle biotreatment. During the treatment, miniature CPTs with the AE measurement are performed at different locations in the sand base. The tip resistance in the CPTs increases with the biotreatment level, and the maximum strength can be found in the soil depth of around 30–50 cm. The sand base strength increases to around 55 times the untreated strength, and the increment is mitigated after the eight-cycle biotreatment. The AE signals from CPTs can be described with the PL distribution and the exponentially damped PL distribution, showing the features of fracture and friction models for the biotreated conditions during CPTs, and only the friction model can be observed in the untreated sand base. With an increase in the biotreatment level, the sand base shows a transitional avalanche behavior from the mixed PL distribution to the damped PL distribution, which is attributed to the confined effect from the biotreatment. The sand base is segmented to rectangular specimens following the final biotreatment. The segmented specimens exhibit density heterogeneity within the sand base. The SWV increases with an increase in density, and the increment trend is weaker than that of the UCS. The PL distribution and ML estimation of the AE-signal energy from the segmented specimens indicate that the failure involves both fracture and friction models in UCTs, which show high consistency with the findings from the element tests on the biotreated calcareous-sand columns in the previous study. Furthermore, the RM, ASS, and WT distributions show that the avalanche mechanism of the segmented specimens is also consistent with that of the biotreated calcareous-sand columns in the previous study, indicating that the AE signals can be further used for detecting the fracture mechanism of field-scale biotreated soils.
Data Availability Statement
All data, models, and codes generated or used during the study appear in the published article. The optical images and videos for the penetration tests, bender element tests, compression tests, and acoustic emission tests, the additional SEM images for biotreated specimens, the additional repeated data used for validation, the calculations of the biotreated sand base, and specimens for the basic statistical laws of avalanche dynamics are available from the corresponding author upon reasonable request.
Supplemental Materials
File (supplemental_materials_ijgnai.gmeng-8817_xiao.zip)
- Download
- 36.92 MB
Acknowledgments
The authors acknowledge the financial support from the National Nature Science Foundation of China (Grant Nos. 52078085 and 52108301) and Chongqing Talents Program (Grant No. cstc2021ycjh-bgzxm0051). The authors thank Dr. X. Jiang for the instruction on basic statistical laws of avalanche dynamics for the biotreated calcareous sand base, including the Gutenberg–Richter law, Båth’s law, Omori’s law, the ML estimation method, and so on. The authors also thank Dr. X. He, Mr. W. J. Fan, Mr. H. H. Zhao, Mr. X. M. Zhang, and Mr. H. Zhao for the assistance in the preparation of the calcareous sand base, the biotreated process for the sand base using the bacterial solution and cement solution, the penetration tests, bender element tests, compression tests, and acoustic emission tests of the biotreated sand base, and biotreated element specimens. Finally, special thanks to the Analytical and Testing Center of Chongqing University for providing the instruments used in this study.
References
Alava, M. J., P. Nukalaz, and S. Zapperi. 2006. “Statistical models of fracture.” Adv. Phys. 55 (3–4): 349–476. https://doi.org/10.1080/00018730300741518.
Al Imran, M., S. Kimura, K. Nakashima, N. Evelpidou, and S. Kawasaki. 2019. “Feasibility study of native ureolytic bacteria for biocementation towards coastal erosion protection by MICP method.” Appl. Sci. 9 (20): 4462. https://doi.org/10.3390/app9204462.
Barkouki, T. H., B. C. Martinez, B. M. Mortensen, T. S. Weathers, J. D. De Jong, T. R. Ginn, N. F. Spycher, R. W. Smith, and Y. Fujita. 2011. “Forward and inverse bio-geochemical modeling of microbially induced calcite precipitation in half-meter column experiments.” Transp. Porous Media 90 (1): 23. https://doi.org/10.1007/s11242-011-9804-z.
Baró, J., Á Corral, X. Illa, A. Planes, E. K. Salje, W. Schranz, D. E. Soto-Parra, and E. Vives. 2013. “Statistical similarity between the compression of a porous material and earthquakes.” Phys. Rev. Lett. 110 (8): 088702. https://doi.org/10.1103/PhysRevLett.110.088702.
Båth, M. 1965. “Lateral inhomogeneities of the upper mantle.” Tectonophysics 2 (6): 483–514. https://doi.org/10.1016/0040-1951(65)90003-x.
Botusharova, S., D. Gardner, and M. Harbottle. 2020. “Augmenting microbially induced carbonate precipitation of soil with the capability to self-heal.” J. Geotech. Geoenviron. Eng. 146 (4): 04020010. https://doi.org/10.1061/(ASCE)GT.1943-5606.0002214.
Chen, Y., X. Ding, D. Fang, J. Sun, and E. K. Salje. 2019. “Acoustic emission from porous collapse and moving dislocations in granular Mg–Ho alloys under compression and tension.” Sci. Rep. 9 (1): 1–12. https://doi.org/10.1038/s41598-018-37604-5.
Cheng, Y.-J., C.-S. Tang, X.-H. Pan, B. Liu, Y.-H. Xie, Q. Cheng, and B. Shi. 2021. “Application of microbial induced carbonate precipitation for loess surface erosion control.” Eng. Geol. 294: 106387. https://doi.org/10.1016/j.enggeo.2021.106387.
Chu, J., V. Ivanov, M. Naeimi, V. Stabnikov, and B. Li. 2013. “Microbial method for construction of an aquaculture pond in sand.” Géotechnique 63 (10): 871–875. https://doi.org/10.1680/geot.SIP13.P.007.
Cieplak, M., and M. O. Robbins. 1988. “Dynamical transition in quasistatic fluid invasion in porous media.” Phys. Rev. Lett. 60 (20): 2042. https://doi.org/10.1103/PhysRevLett.60.2042.
Console, R., A. M. Lombardi, M. Murru, and D. Rhoades. 2003. “Båth’s law and the self-similarity of earthquakes.” J. Geophys. Res.: Solid Earth 108 (B2): 2128. https://doi.org/10.1029/2001JB001651.
Corral, A. 2004. “Universal local versus unified global scaling laws in the statistics of seismicity.” Physica A 340 (4): 590–597. https://doi.org/10.1016/j.physa.2004.05.010.
Cui, M.-J., H.-J. Lai, T. Hoang, and J. Chu. 2021. “Modified one-phase-low-pH method for bacteria or enzyme-induced carbonate precipitation for soil improvement.” Acta Geotech. 16 (5): 1457–1472. https://doi.org/10.1007/s11440-021-01384-6.
Cui, M.-J., H.-J. Lai, S.-F. Wu, and J. Chu. 2023. “Comparison of soil improvement methods using crude soybean enzyme, bacterial enzyme or bacteria-induced carbonate precipitation.” Géotechnique. https://doi.org/10.1680/jgeot.21.00131.
Cui, M.-J., J.-J. Zheng, R.-J. Zhang, H.-J. Lai, and J. Zhang. 2017. “Influence of cementation level on the strength behaviour of bio-cemented sand.” Acta Geotech. 12 (5): 971–986. https://doi.org/10.1007/s11440-017-0574-9.
Darby, K. M., G. L. Hernandez, J. T. DeJong, R. W. Boulanger, M. G. Gomez, and D. W. Wilson. 2019. “Centrifuge model testing of liquefaction mitigation via microbially induced calcite precipitation.” J. Geotech. Geoenviron. Eng. 145 (10): 04019084. https://doi.org/10.1061/(ASCE)GT.1943-5606.0002122.
Davidsen, J., S. Stanchits, and G. Dresen. 2007. “Scaling and universality in rock fracture.” Phys. Rev. Lett. 98 (12): 125502. https://doi.org/10.1103/PhysRevLett.98.125502.
DeJong, J. T., M. B. Fritzges, and K. Nüsslein. 2006. “Microbially induced cementation to control sand response to undrained shear.” J. Geotech. Geoenviron. Eng. 132 (11): 1381–1392. https://doi.org/10.1061/(ASCE)1090-0241(2006)132:11(1381).
DeJong, J. T., et al. 2013. “Biogeochemical processes and geotechnical applications: Progress, opportunities and challenges.” Géotechnique 63 (4): 287–301. https://doi.org/10.1680/geot.SIP13.P.017.
Dilrukshi, R. A. N., K. Nakashima, and S. Kawasaki. 2018. “Soil improvement using plant-derived urease-induced calcium carbonate precipitation.” Soils Found. 58 (4): 894–910. https://doi.org/10.1016/j.sandf.2018.04.003.
Dixon, N., and M. Spriggs. 2007. “Quantification of slope displacement rates using acoustic emission monitoring.” Can. Geotech. J. 44 (8): 966–976. https://doi.org/10.1139/T07-046.
El Kortbawi, M., D. M. Moug, K. Ziotopoulou, J. T. DeJong, and R. W. Boulanger. 2022. “Axisymmetric simulations of cone penetration in biocemented sands.” J. Geotech. Geoenviron. Eng. 148 (11): 04022098. https://doi.org/10.1061/(ASCE)GT.1943-5606.0002914.
Fattahi, S. M., A. Soroush, and N. Huang. 2020. “Biocementation control of sand against wind erosion.” J. Geotech. Geoenviron. Eng. 146 (6): 04020045. https://doi.org/10.1061/(ASCE)GT.1943-5606.0002268.
Feng, K., and B. M. Montoya. 2016. “Influence of confinement and cementation level on the behavior of microbial-induced calcite precipitated sands under monotonic drained loading.” J. Geotech. Geoenviron. Eng. 142 (1): 04015057. https://doi.org/10.1061/(ASCE)GT.1943-5606.0001379.
Gai, X., and M. Sánchez. 2019. “An elastoplastic mechanical constitutive model for microbially mediated cemented soils.” Acta Geotech. 14 (3): 709–726. https://doi.org/10.1007/s11440-018-0721-y.
Gao, K., H. Lin, T. Suleiman Muhannad, P. Bick, T. Babuska, X. Li, J. Helm, G. Brown Derick, and N. Zouari. 2023. “Shear and tensile strength measurements of CaCO3 cemented bonds between glass beads treated by microbially induced carbonate precipitation.” J. Geotech. Geoenviron. Eng. 149 (1): 04022117. https://doi.org/10.1061/(ASCE)GT.1943-5606.0002927.
Gao, Y., L. Hang, J. He, F. Zhang, and L. Van Paassen. 2021. “Pullout behavior of geosynthetic reinforcement in biocemented soils.” Geotext. Geomembr. 49 (3): 646–656. https://doi.org/10.1016/j.geotexmem.2020.10.028.
Gomez, M. G., C. M. Anderson, C. M. R. Graddy, J. T. DeJong, D. C. Nelson, and T. R. Ginn. 2017. “Large-scale comparison of bioaugmentation and biostimulation approaches for biocementation of sands.” J. Geotech. Geoenviron. Eng. 143 (5): 04016124. https://doi.org/10.1061/(ASCE)GT.1943-5606.0001640.
Gomez, M. G., J. T. DeJong, and C. M. Anderson. 2018. “Effect of bio-cementation on geophysical and cone penetration measurements in sands.” Can. Geotech. J. 55 (11): 1632–1646. https://doi.org/10.1139/cgj-2017-0253.
Gowthaman, S., S. Mitsuyama, K. Nakashima, M. Komatsu, and S. Kawasaki. 2019. “Biogeotechnical approach for slope soil stabilization using locally isolated bacteria and inexpensive low-grade chemicals: A feasibility study on Hokkaido expressway soil, Japan.” Soils Found. 59 (2): 484–499. https://doi.org/10.1016/j.sandf.2018.12.010.
Ham, S.-M., A. Martinez, G. Han, and T.-H. Kwon. 2022. “Grain-scale tensile and shear strengths of glass beads cemented by MICP.” J. Geotech. Geoenviron. Eng. 148 (9): 04022068. https://doi.org/10.1061/(ASCE)GT.1943-5606.0002863.
Ivanov, V., V. Stabnikov, O. Stabnikova, and Z. Ahmed. 2019. “Biocementation technology for construction of artificial oasis in sandy desert.” J. King Saud Univ.– Eng. Sci. 32 (8): 3463298. https://doi.org/10.1016/j.jksues.2019.07.003.
Jiang, R. C., F. Dai, Y. Liu, A. Li, and P. Feng. 2021. “Frequency characteristics of acoustic emissions induced by crack propagation in rock tensile fracture.” Rock Mech. Rock Eng. 54 (4): 2053–2065. https://doi.org/10.1007/s00603-020-02351-5.
Kashizadeh, E., A. Mukherjee, and A. Tordesillas. 2021. “Experimental and numerical investigations on confined granular systems stabilized by bacterial cementation.” Int. J. Geomech. 21 (1): 04020244. https://doi.org/10.1061/(ASCE)GM.1943-5622.0001891.
Li, S., C. Li, D. Yao, and S. Wang. 2020. “Feasibility of microbially induced carbonate precipitation and straw checkerboard barriers on desertification control and ecological restoration.” Ecol. Eng. 152: 105883. https://doi.org/10.1016/j.ecoleng.2020.105883.
Lin, W. L., L. Ang, M. Wuwei, and K. Junichi. 2020. “Acoustic emission behavior of granular soils with various ground conditions in drained triaxial compression tests.” Soils Found. 60 (4): 929–943. https://doi.org/10.1016/j.sandf.2020.06.002.
Liu, K.-W., N.-J. Jiang, J.-D. Qin, Y.-J. Wang, C.-S. Tang, and X.-L. Han. 2021. “An experimental study of mitigating coastal sand dune erosion by microbial- and enzymatic-induced carbonate precipitation.” Acta Geotech. 16 (2): 467–480. https://doi.org/10.1007/s11440-020-01046-z.
Liu, L., H. Liu, A. W. Stuedlein, T. M. Evans, and Y. Xiao. 2019. “Strength, stiffness, and microstructure characteristics of biocemented calcareous sand.” Can. Geotech. J. 56 (10): 1502–1513. https://doi.org/10.1139/cgj-2018-0007.
Lockner, D. 1993. “The role of acoustic-emission in the study of rock fracture.” Int. J. Rock Mech. Min. Sci. Geomech. Abstr. 30 (7): 883–899. https://doi.org/10.1016/0148-9062(93)90041-b.
Ma, G., Q. Fang, Y. Xiao, J. Chu, and H. Liu. 2022a. “Microscopic investigation on bonding fracture of biocemented sand from novel in-situ Brazil splitting tests.” Acta Geotech. 17 (11): 4935–4951. https://doi.org/10.1007/s11440-022-01682-7.
Ma, G., X. He, X. Jiang, H. Liu, J. Chu, and Y. Xiao. 2021. “Strength and permeability of bentonite-assisted biocemented coarse sand.” Can. Geotech. J. 57 (7): 969–981. https://doi.org/10.1139/cgj-2020-0045.
Ma, G., X. He, Y. Xiao, J. Chu, L. Cheng, and H. Liu. 2022b. “Influence of bacterial suspension type on the strength of biotreated sand.” Can. Geotech. J. 59 (11): 2014–2021. https://doi.org/10.1139/cgj-2021-0295.
Ma, G., Y. Xiao, W. Fan, J. Chu, and H. Liu. 2022c. “Mechanical properties of biocement formed by microbially induced carbonate precipitation.” Acta Geotech. 17 (11): 4905–4919. https://doi.org/10.1007/s11440-022-01584-8.
Ma, G., Y. Xiao, X. He, J. Li, J. Chu, and H. Liu. 2022d. “Kaolin-nucleation-based biotreated calcareous sand through unsaturated percolation method.” Acta Geotech. 17 (8): 3181–3193. https://doi.org/10.1007/s11440-022-01459-y.
Meng, H., Y. Gao, J. He, Y. Qi, and L. Hang. 2021. “Microbially induced carbonate precipitation for wind erosion control of desert soil: Field-scale tests.” Geoderma 383: 114723. https://doi.org/10.1016/j.geoderma.2020.114723.
Montoya, B. M., J. T. DeJong, and R. W. Boulanger. 2013. “Dynamic response of liquefiable sand improved by microbial-induced calcite precipitation.” Géotechnique 63 (4): 302–312. https://doi.org/10.1680/geot.SIP13.P.019.
Montoya, B. M., J. Do, and M. A. Gabr. 2021. “Distribution and properties of microbially induced carbonate precipitation in underwater sand bed.” J. Geotech. Geoenviron. Eng. 147 (10): 04021098. https://doi.org/10.1061/(ASCE)GT.1943-5606.0002607.
Mujah, D., M. A. Shahin, L. Cheng, and A. Karrech. 2021. “Experimental and analytical study on geomechanical behavior of biocemented sand.” Int. J. Geomech. 21 (8): 04021126. https://doi.org/10.1061/(ASCE)GM.1943-5622.0002105.
Nassar, M. K., D. Gurung, M. Bastani, T. R. Ginn, B. Shafei, M. G. Gomez, C. M. R. Graddy, D. C. Nelson, and J. T. DeJong. 2018. “Large-scale experiments in microbially induced calcite precipitation (MICP): Reactive transport model development and prediction.” Water Resour. Res. 54 (1): 480–500. https://doi.org/10.1002/2017wr021488.
Nikseresht, F., A. Landi, G. Sayyad, G. Ghezelbash, and R. Schulin. 2020. “Sugarecane molasse and vinasse added as microbial growth substrates increase calcium carbonate content, surface stability and resistance against wind erosion of desert soils.” J. Environ. Manage. 268: 110639. https://doi.org/10.1016/j.jenvman.2020.110639.
Nishimura, I., and H. Matsubara. 2021. “Coupling simulation of microbially induced carbonate precipitation and bacterial growth using reaction-diffusion and homogenisation systems.” Acta Geotech. 16 (5): 1315–1330. https://doi.org/10.1007/s11440-021-01178-w.
O’Donnell, S. T., B. E. Rittmann, and E. Kavazanjian Jr. 2017. “MIDP: Liquefaction mitigation via microbial denitrification as a two-stage process. II: MICP.” J. Geotech. Geoenviron. Eng. 143 (12): 04017095. https://doi.org/10.1061/(ASCE)GT.1943-5606.0001806.
Omori, F. 1894. “On the after-shocks of earthquakes.” J. Coll. Sci. Imp. Univ. Tokyo 7: 111–200.
Qin, C. Z., S. M. Hassanizadeh, and A. Ebigbo. 2016. “Pore-scale network modeling of microbially induced calcium carbonate precipitation: Insight into scale dependence of biogeochemical reaction rates.” Water Resour. Res. 52 (11): 8969–8985. https://doi.org/10.1002/2016wr019128.
Riveros, G. A., and A. Sadrekarimi. 2020a. “Effect of microbially induced cementation on the instability and critical state behaviours of Fraser River sand.” Can. Geotech. J. 57 (12): 1870–1880. https://doi.org/10.1139/cgj-2019-0514.
Riveros, G. A., and A. Sadrekarimi. 2020b. “Liquefaction resistance of Fraser River sand improved by a microbially-induced cementation.” Soil Dyn. Earthquake Eng. 131: 106034. https://doi.org/10.1016/j.soildyn.2020.106034.
Salje, E. K., and K. A. Dahmen. 2014. “Crackling noise in disordered materials.” Annu. Rev. Condens. Matter Phys. 5 (1): 233–254. https://doi.org/10.1146/annurev-conmatphys-031113-133838.
Salje, E. K., X. Jiang, J. Eckstein, and L. Wang. 2021. “Acoustic emission spectroscopy: Applications in geomaterials and related materials.” Appl. Sci. 11 (19): 8801. https://doi.org/10.3390/app11198801.
Salje, E. K. H., A. Planes, and E. Vives. 2017. “Analysis of crackling noise using the maximum-likelihood method: Power-law mixing and exponential damping.” Phys. Rev. E 96 (4): 042122. https://doi.org/10.1103/PhysRevE.96.042122.
Shi, J., W. Haegeman, and V. Cnudde. 2021. “Anisotropic small-strain stiffness of calcareous sand affected by sample preparation, particle characteristic and gradation.” Géotechnique 71 (4): 305–319. https://doi.org/10.1680/jgeot.18.P.348.
Shi, J., Y. Xiao, J. Hu, H. Wu, H. Liu, and W. Haegeman. 2022. “Small-strain shear modulus of calcareous sand under anisotropic consolidation.” Can. Geotech. J. 59 (6): 878–888. https://doi.org/10.1139/cgj-2021-0329.
Smith, A., and N. Dixon. 2019. “Acoustic emission behaviour of dense sands.” Géotechnique 69 (12): 1107–1122. https://doi.org/10.1680/jgeot.18.P.209.
Song, C., S. Zhi, G. Feng, and J. Lin. 2021a. “Enhancing potential of hydrofracturing in mylonitic coal by biocementation.” Energy Sci. Eng. 9 (4): 565–576. https://doi.org/10.1002/ese3.860.
Song, C. P., D. Elsworth, S. Zhi, and C. Y. Wang. 2021b. “The influence of particle morphology on microbially induced CaCO3 clogging in granular media.” Mar. Georesour. Geotechnol. 39 (1): 74–81. https://doi.org/10.1080/1064119x.2019.1677828.
Soprunyuk, V., S. Puchberger, W. Schranz, A. Tröster, E. Vives, and E. K. H. Salje. 2017. “Towards a quantitative analysis of crackling noise by strain drop measurements.” In Avalanches in functional materials and geophysics, edited by E. K. H. Salje, 59–76. Cham, Switzerland: Springer.
Sun, X., L. Miao, R. Chen, H. Wang, L. Wu, and J. Xia. 2021. “Liquefaction resistance of biocemented loess soil.” J. Geotech. Geoenviron. Eng. 147 (11): 04021117. https://doi.org/10.1061/(ASCE)GT.1943-5606.0002638.
Utsu, T., Y. Ogata, and R. S. Matsuura. 1995. “The centenary of the Omori formula for a decay law of aftershock activity.” J. Phys. Earth 43 (1): 1–33. https://doi.org/10.4294/jpe1952.43.1.
van Paassen, L. A., C. M. Daza, M. Staal, D. Y. Sorokin, W. van der Zon, and M. C. M. van Loosdrecht. 2010. “Potential soil reinforcement by biological denitrification.” Ecol. Eng. 36: 168–175. https://doi.org/10.1016/j.ecoleng.2009.03.026.
Wang, J. J., X. D. Chen, M. D. Wei, and F. Dai. 2021a. “Triaxial fatigue behavior and acoustic emission characteristics of saturated tuff.” Int. J. Geomech. 21 (12): 04021230. https://doi.org/10.1061/(ASCE)GM.1943-5622.0002212.
Wang, L., X. Jiang, X. He, J. Chu, Y. Xiao, H. Liu, and E. K. H. Salje. 2021b. “Crackling noise and bio-cementation.” Eng. Fract. Mech. 247: 107675. https://doi.org/10.1016/j.engfracmech.2021.107675.
Wang, X., and U. Nackenhorst. 2020. “A coupled bio-chemo-hydraulic model to predict porosity and permeability reduction during microbially induced calcite precipitation.” Adv. Water Resour. 140: 103563. https://doi.org/10.1016/j.advwatres.2020.103563.
Wang, X. R., J. L. Tao, R. T. Bao, T. Tran, and S. Tucker-Kulesza. 2018. “Surficial soil stabilization against water-induced erosion using polymer-modified microbially induced carbonate precipitation.” J. Mater. Civ. Eng. 30 (10): 04018267. https://doi.org/10.1061/(ASCE)MT.1943-5533.0002490.
Wang, Y., K. Soga, J. T. DeJong, and A. J. Kabla. 2019. “A microfluidic chip and its use in characterising the particle-scale behaviour of microbial-induced calcium carbonate precipitation (MICP).” Geotechnique 69 (12): 1086–1094. https://doi.org/10.1680/jgeot.18.P.031.
Wu, H., W. Wu, W. Liang, F. Dai, H. Liu, and Y. Xiao. 2023. “3D DEM modeling of biocemented sand with fines as cementing agents.” Int. J. Numer. Anal. Methods Geomech. 47: 212–240. https://doi.org/10.1002/nag.3466.
Wu, S., B. Li, and J. Chu. 2021. “Stress–dilatancy behavior of MICP-treated sand.” Int. J. Geomech. 21 (3): 04020264. https://doi.org/10.1061/(ASCE)gm.1943-5622.0001923.
Xiao, P., H. Liu, A. W. Stuedlein, T. M. Evans, and Y. Xiao. 2019a. “Effect of relative density and biocementation on cyclic response of calcareous sand.” Can. Geotech. J. 56 (12): 1849–1862. https://doi.org/10.1139/cgj-2018-0573.
Xiao, P., H. Liu, Y. Xiao, A. W. Stuedlein, and T. M. Evans. 2018. “Liquefaction resistance of bio-cemented calcareous sand.” Soil Dyn. Earthquake Eng. 107: 9–19. https://doi.org/10.1016/j.soildyn.2018.01.008.
Xiao, Y., X. He, T. M. Evans, A. W. Stuedlein, and H. Liu. 2019b. “Unconfined compressive and splitting tensile strength of basalt fiber-reinforced biocemented sand.” J. Geotech. Geoenviron. Eng. 145 (9): 04019048. https://doi.org/10.1061/(ASCE)GT.1943-5606.0002108.
Xiao, Y., X. He, A. W. Stuedlein, J. Chu, T. M. Evans, and L. A. van Paassen. 2022a. “Crystal growth of MICP through microfluidic chip tests.” J. Geotech. Geoenviron. Eng. 148 (5): 06022002. https://doi.org/10.1061/(ASCE)GT.1943-5606.0002756.
Xiao, Y., X. He, W. Wu, A. Stuedlein, W. T, M. Evans, J. Chu, H. Liu, L. A. van Paassen, and H. Wu. 2021a. “Kinetic biomineralization through microfluidic chip tests.” Acta Geotech. 16 (10): 3229–3237. https://doi.org/10.1007/s11440-021-01205-w.
Xiao, Y., X. He, M. Zaman, G. Ma, and C. Zhao. 2022b. “Review of strength improvements of biocemented soils.” Int. J. Geomech. 22 (11): 03122001. https://doi.org/10.1061/(ASCE)GM.1943-5622.0002565.
Xiao, Y., G. Ma, H. Wu, H. Lu, and M. Zaman. 2022c. “Rainfall-induced erosion of biocemented graded slopes.” Int. J. Geomech. 22 (1): 04021256. https://doi.org/10.1061/(ASCE)GM.1943-5622.0002239.
Xiao, Y., A. W. Stuedlein, X. He, F. Han, T. M. Evans, Z. Pan, H. Lin, J. Chu, and L. A. van Paassen. 2021b. “Lateral responses of a model pile in biocemented sand.” Int. J. Geomech. 21 (11): 06021027. https://doi.org/10.1061/(ASCE)GM.1943-5622.0002179.
Xiao, Y., A. W. Stuedlein, J. Ran, T. M. Evans, L. Cheng, H. Liu, L. A. van Paassen, and J. Chu. 2019c. “Effect of particle shape on strength and stiffness of biocemented glass beads.” J. Geotech. Geoenviron. Eng. 145 (11): 06019016. https://doi.org/10.1061/(ASCE)GT.1943-5606.0002165.
Xiao, Y., L. Wang, X. Jiang, T. M. Evans, A. W. Stuedlein, and H. Liu. 2019d. “Acoustic emission and force drop in grain crushing of carbonate sands.” J. Geotech. Geoenviron. Eng. 145 (9): 04019057. https://doi.org/10.1061/(ASCE)GT.1943-5606.0002141.
Xiao, Y., W. Xiao, H. Wu, Y. Liu, and H. Liu. 2023a. “Fracture of interparticle MICP bonds under compression.” Int. J. Geomech. 23 (3): 04022316. https://doi.org/10.1061/IJGNAI.GMENG-8282.
Xiao, Y., Z. Zhang, A. W. Stuedlein, and T. M. Evans. 2021c. “Liquefaction modeling for biocemented calcareous sand.” J. Geotech. Geoenviron. Eng. 147 (12): 04021149. https://doi.org/10.1061/(ASCE)GT.1943-5606.0002666.
Xiao, Y., H. Zhao, H. Wu, X. Jiang, and H. Liu. 2023b. “Anisotropic fracture of sandstone with biotreated cracks.” Int. J. Geomech. 23. https://doi.org/10.1061/IJGNAI.GMENG-8821.
Xiao, Y., W. Zhou, J. Shi, H. Lu, and Z. Zhang. 2022d. “Erosion of biotreated field-scale slopes under rainfalls.” J. Perform. Constr. Facil. 36 (3): 04022030. https://doi.org/10.1061/(ASCE)CF.1943-5509.0001732.
Yang, P., E. Kavazanjian, and N. Neithalath. 2019. “Particle-scale mechanisms in undrained triaxial compression of biocemented sands: Insights from 3D DEM simulations with flexible boundary.” Int. J. Geomech. 19 (4): 04019009. https://doi.org/10.1061/(ASCE)GM.1943-5622.0001346.
Yang, P., S. O’Donnell, N. Hamdan, E. Kavazanjian, and N. Neithalath. 2017. “3D DEM simulations of drained triaxial compression of sand strengthened using microbially induced carbonate precipitation.” Int. J. Geomech. 17 (6): 04016143. https://doi.org/10.1061/(ASCE)GM.1943-5622.0000848.
Yu, M., T. Reddyhoff, D. Dini, A. Holmes, and C. O'Sullivan. 2022. “Acoustic emission enabled particle size estimation via low stress-varied axial interface shearing.” IEEE Trans. Instrum. Meas. 71: 6501410. https://doi.org/10.1109/tim.2022.3156175.
Zamani, A., P. Xiao, T. Baumer, T. J. Carey, B. Sawyer, J. T. DeJong, and R. W. Boulanger. 2021. “Mitigation of liquefaction triggering and foundation settlement by MICP treatment.” J. Geotech. Geoenviron. Eng. 147 (10): 04021099. https://doi.org/10.1061/(ASCE)GT.1943-5606.0002596.
Zeng, C., Y. Veenis, A. Hall Caitlyn, S. Young Elizabeth, R. L. van der Star Wouter, J.-j. Zheng, and A. van Paassen Leon. 2021. “Experimental and numerical analysis of a field trial application of microbially induced calcite precipitation for ground stabilization.” J. Geotech. Geoenviron. Eng. 147 (7): 05021003. https://doi.org/10.1061/(ASCE)GT.1943-5606.0002545.
Zhang, J., C. Li, S. Wang, and S. Bai. 2021. “Three-dimensional reconstruction of biomineralized sand and particle-flow-code numerical simulation of penetration resistance characteristics of biomineralization crust.” Int. J. Geomech. 21 (5): 04021048. https://doi.org/10.1061/(ASCE)GM.1943-5622.0002001.
Zhang, X., Y. Chen, H. Liu, Z. Zhang, and X. Ding. 2020. “Performance evaluation of a MICP-treated calcareous sandy foundation using shake table tests.” Soil Dyn. Earthquake Eng. 129: 105959. https://doi.org/10.1016/j.soildyn.2019.105959.
Zhao, Y. F., H. L. Liu, K. N. Xie, E. K. H. Salje, and X. Jiang. 2019. “Avalanches in compressed sandstone: Crackling noise under confinement.” Crystals 9 (11): 582. https://doi.org/10.3390/cryst9110582.
Zhou, B., X. Zhang, J. Wang, H. Wang, and J. Shen. 2023. “Insight into the mechanism of microbially induced carbonate precipitation treatment of bio-improved calcareous sand particles.” Acta Geotech. 18: 985–999. https://doi.org/10.1007/s11440-022-01625-2.
Zomorodian, S. M. A., H. Ghaffari, and B. C. O'Kelly. 2019. “Stabilisation of crustal sand layer using biocementation technique for wind erosion control.” Aeolian Res. 40: 34–41. https://doi.org/10.1016/j.aeolia.2019.06.001.
Information & Authors
Information
Published In

International Journal of Geomechanics
Volume 23 • Issue 9 • September 2023
Copyright
This work is made available under the terms of the Creative Commons Attribution 4.0 International license, https://creativecommons.org/licenses/by/4.0/.
History
Received: Jan 20, 2023
Accepted: Apr 1, 2023
Published online: Jul 6, 2023
Published in print: Sep 1, 2023
Discussion open until: Dec 6, 2023
Authors
Metrics & Citations
Metrics
Citations
Download citation
If you have the appropriate software installed, you can download article citation data to the citation manager of your choice. Simply select your manager software from the list below and click Download.