Risk Tolerance, Aversion, and Economics of Energy Utilities in Community Resilience to Wildfires
Publication: ASCE-ASME Journal of Risk and Uncertainty in Engineering Systems, Part A: Civil Engineering
Volume 10, Issue 2
Abstract
Electric and gas investor-owned utilities operate in a regulated environment and are scrutinized by media and stakeholders for key strategic and operational decisions. Some decisions entail significant risk, requiring special attention to risk tolerances and attitudes including risk aversion. Utilities typically institute enterprise risk management programs to efficiently and effectively manage safety, reliability, and financial risks for their customers, employees, and communities in a changing climate with intensifying risks, such as wildfire. Consequences from such events could include human life and property losses, health effects, environmental damage, service loss, and other indirect financial and economic impacts. A spectrum of risk quantification and management methods are available for assessing these hazards. Varying risk tolerances and attitudes of stakeholders creates situations that are central to decision-making where the safety, service delivery reliability, rate affordability, and the financial wellbeing of entities come together and interact in a complex manner. This paper sets context, defines key terms, and develops an innovative approach for methodically reflecting risk tolerance and attitude with a focus on risk aversion in informing risk management decisions by offering flexibility to account for preferences by stakeholders in a structured manner. The concept of risk-aversion amplification factors is proposed to reflect attitudes and preferences of decision makers in typical economic models used in benefit-cost analysis. Such amplification factors can be calibrated by applicable markets, such as insurance and catastrophe bond markets and used to estimate certainty-equivalent valuations of risks, costs, and benefits. The proposed methods are illustrated in the context of wildfire risk management for communities and utilities using two examples from these domains for enhancing resilience.
Electric Power and Gas Utilities: Background and Context
Investor-owned utilities (IOUs), particularly with electric and gas operations, are regulated by governmental entities and scrutinized by media and stakeholders. IOUs engage in strategic and operational decisions that entail significant uncertainties and risks. These decisions are challenged by many considerations including and reflecting risk tolerances and attitudes. Public trust is predicated on how an IOU manages risks both within its control, such as operational risks, and external risks including nonstationary natural hazards in a changing climate such as weather extremes, wildfires, and so on. IOUs typically institute Enterprise Risk Management (ERM) and other programs to efficiently, effectively, and consistently manage safety, property, reliability, and financial risks for their customers, employees, and communities across a portfolio of undertakings and pursuits.
For example, wildfires have increased in annual counts and severities within the US and globally, with an annual US average of about 70,000 fires since 1983 (EPA 2022). The California Public Utilities Commission (CPUC 2020) reported that California wildfires originating from utility infrastructure accounted for 42% of the damaged acreage in the reported period of 2014–2017, with only 9% of the total wildfire ignitions, and 35% of the fatalities in the top 20 deadliest wildfires in California. The total economic burden of wildfire in the US is estimated to be between $71.1 and $347.8 ($2016) billion annually (Thomas et al. 2017). Consequences from such events generally include human life and property losses, health effects, environmental damage, service loss, and financial and economic impacts. Utilities face other safety risks, e.g., gas pipeline ruptures, cyber-attacks, dam failures, workforce safety, and so on.
To determine appropriate rules and requirements for managing such risks, the CPUC instituted a rulemaking to develop a Risk-Based Decision-Making Framework (RDF) [formerly known as Safety Model Assessment Proceeding (S-MAP)]. Through the S-MAP, CPUC (2023) set a requirement for a regulatory review and public-vetting process known as the Risk Assessment and Mitigation Phase (RAMP) to ensure the four major IOUs [i.e., Pacific Gas and Electric (PG&E), San Diego Gas and Electric (SDG&E), Southern California Edison (SCE), and the Southern California Gas Company (SoCalGas)] to carefully consider and fully disclose safety risks associated with their services and activities, and to explain how those risks are identified, quantified, and managed at the lowest practicable costs. The RAMP requirements were set to incorporate RDF into the regulatory process of approving utilities’ funding requests, as a pre-requisite to the IOUs’ general rate case (GRC) applications.
Fig. 1 illustrates the complexity associated with decision-making by engaging stakeholders, and considering hazards, risks including safety consequences measured by injury and death, reliability consequences measured by different metrics such as System Average Interruption Duration Index (SAIDI), System Average Interruption Frequency Index (SAIFI), Customer Average Interruption Duration Index (CAIDI), and customer-minutes interrupted, and costs, impacts, and valuations within legal, insurance, and economic efficiency requirements. This decision-making by IOUs requires balancing public and private (e.g., investor) interests with transparency, and a formal treatment for the quantification of risk tolerances and attitudes for compliance, economic efficiency and consistency is necessary for fulfilling missions in equitable terms.
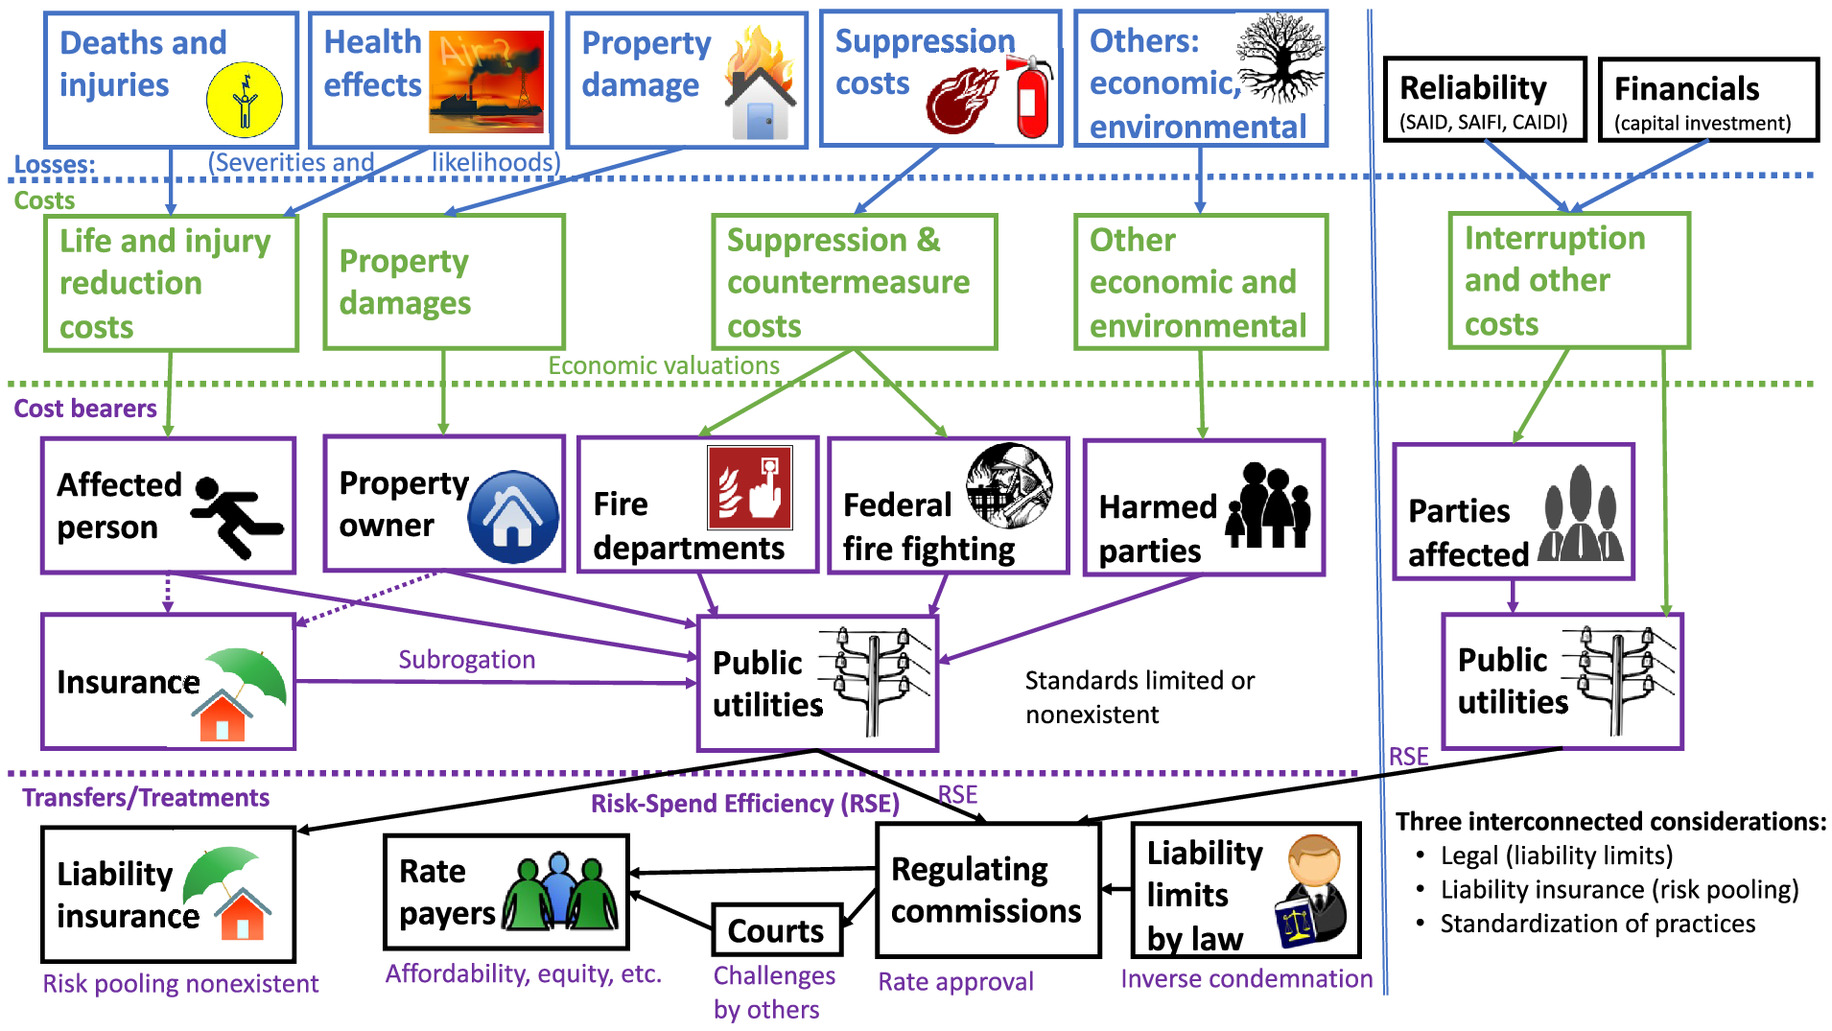
From community resilience perspectives [for example ASTM E3130-21 (ASTM 2021)] risk preferences and tolerance have not been formally incorporated although noted as a need (Gilbert et al. 2015; Helgeson et al. 2020). It is essential for this study to set terminology, as presented in the next section, to appropriately propose novel methods for setting risk-tolerance criteria and quantifying risk attitudes, e.g., risk aversion, in the economics of electric power and gas utilities illustrated for the case of wildfire in community resilience.
Key Risk Terminology and Methods
Risk Terminology for Tolerance and Attitude Setting
Terminology provided herein is based primarily on CPUC (2022), ISO (2009a, b), Institute of Actuaries of Australia (IAA) (IAA 2015), Hertwig et al. (2019), Gilbert et al. (2015), Emerson (2023), Ayyub (2014), and Hillson and Murry-Webster (2016). Risk is defined in three contexts related to typical or common applications in (1) banking and finance, (2) technology and engineering, and (3) microeconomics. ISO (2009a, b) with dominance in origins related banking and finance defines risk as the (1) effect of uncertainty on objectives; whereas from technology and engineering perspectives with a focus enhancing property and life safety, risk is defined as the (2) potential loss resulting from an uncertain exposure to a hazard, defined as a potential source for harm, or event scenario that exploits the system’s vulnerability (Ayyub 2014). From microeconomic perspectives (e.g., Emerson 2023), risk is defined as (3) a situation, including an economic activity, that has uncertain outcomes with known probabilities.
These definitions are congruent through offering varied foci and perspectives across fields; i.e., they are not at odds with one another, but rather offer harmonious foci and perspectives across fields. For example, defining risk as an effect of uncertainty on objectives can provide a basis of having the objectives to be loss-centric, such as property and life, and leading to congruency with the engineering definition of risk; similarly, by changing objectives to outcomes, the first definition becomes congruent with the third.
At an enterprise level, risk appetite is willingness to pursue for return particular risk types with respective maximum loss amounts; in contrast, risk tolerance is manageable loss amounts by events (or risk types) or annually after applying risk treatment for achieving objectives within legal or regulatory bounds as set by risk criteria. Risk preference is an element of choice in the behavioral sciences. It is often conceptualized in economics by focusing on the variance of monetary payoffs, whereas in psychology, it is considered by focusing on propensity to engage in behavior with the potential for loss or harm. Hence, it is respectively associated with distinct measurement traditions, behavioral measures in economics, and self-reporting in psychology.
Risk attitude is the analytics associated with risk preference for informing decisions that account for subjectivity of a decision makers within risk appetite and tolerance by (1) turning away from heightened risks as a case of risk aversion, (2) pursuing, retaining, or undertaking the risk for potential return as the case of risk-seeking, or (3) maintaining proportionality in decisions based on expected loss, i.e., maintaining same attitude, as the case of risk neutrality. Of particular interest in the case of focusing on losses, e.g., in studying hazards and impacts in engineering, is the attitude toward uncertainty through relative levels of risk aversion.
This differs from loss aversion, which encapsulated in the expression losses loom larger than gains and accompanied with risk-seeking behavior (Kahneman and Tversky 1979). The pain of losing might be thought to be psychologically more powerful than the pleasure of gaining. Therefore, people are more willing to take risks to avoid losses, including behaving dishonestly, as noted by Schindler and Pfattheicher (2017), than to seek a gain.
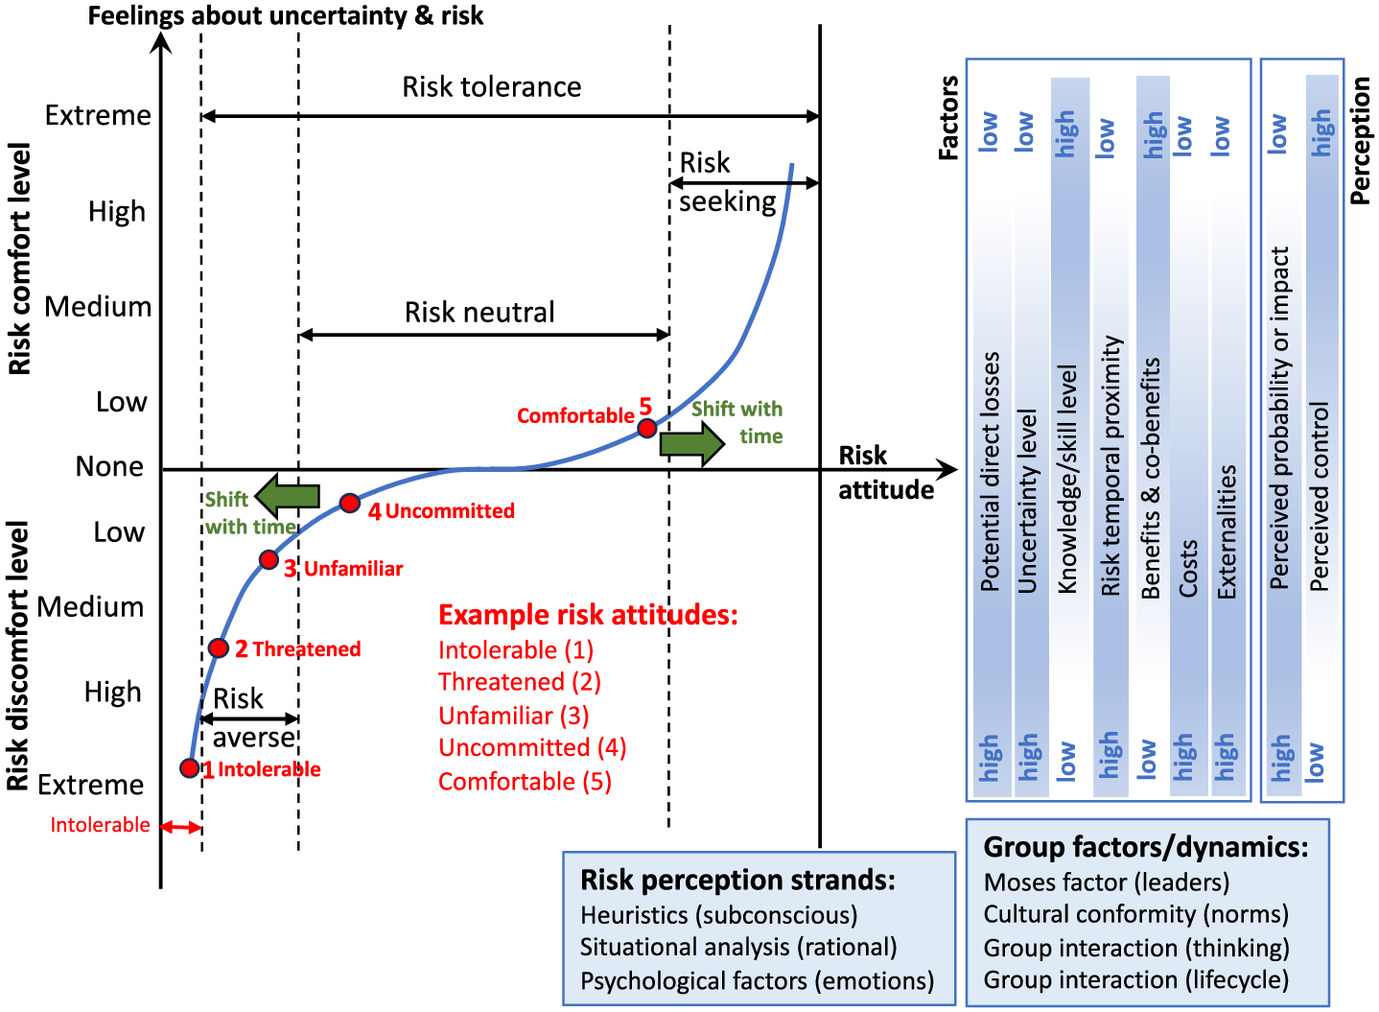
As for communities, not just single investors, the certainty effect is where individuals prefer outcomes without uncertainty over probable ones, and the isolation effect is where individuals might outweigh what is different in information than the rest in making a decision requiring their consideration in risk-aversion quantification. Fig. 2, adapted and expanded from Hillson and Murry-Webster (2016), shows a schematic representation of the relationship between the feelings toward risk as a result of comfort level with uncertainty and risk attitude with a list of influencing factors. The noted shift in time reflects any gained experience with changes in perception and confidence.
Risk acceptance is the degree of risk that a decision maker perceives and accepts in actions under a given set of circumstances and associated net costs. Always some residual risk remains, and sometimes risk retention is considered needed for potential benefit of gain. Risk sharing is an option in the form of insurance or contracts sometimes per legal or regulatory requirements, including risk finance by funds to meet or modify the financial consequences. Safety is the judgment of risk tolerance, or acceptability, commonly associated with human injury or loss. Resilience is the ability to prepare for and adapt to changing conditions and withstand and recover rapidly from disruptions (PPD 2013). Other risk terms have been defined by Ayyub (2014).
Utility functions provide relationships between preferences and some measure of value (e.g., wealth or net benefit). For goods, utility functions are upward sloping because more value (i.e., greater quantity) is preferred to less. Risk aversion implies a diminishing marginal utility of value (i.e., utility increases at a decreasing rate), which results in a concave utility function (Friedman 1976). Following from expected utility theory, the utility of the expected return on investment is greater than the expected utility of the return on investment (Varian 1992), implying that a smaller return on investment is preferred, if known with certainty, over a larger expected return that carries more uncertainty. Planning for hazards under an assumed equal investment cost, a risk-averse preference favors planning scenarios that are developed based on larger potential loss estimates (i.e., smaller net benefits) when there is greater certainty that the losses will not be exceeded, opposed to smaller potential loss estimates (i.e., larger net benefits) associated with greater uncertainty. The methods proposed in subsequent sections of the paper offer options to explicitly introduce risk adjustments to build in risk-averse preferences on values with a baseline of risk neutrality.
Risk Methodology and Methods
A spectrum of risk quantification and management methods are available for addressing hazards and gaps in community resilience associated with electric power and gas utilities. The methods favored in recent RAMP submission utilize event and fault trees with a bowtie framework consisting of (1) defining risk drivers and triggers for each hazard, (2) identifying existing and proposed barriers or controls, (3) examining impacts and consequences, and (4) identifying mitigation measures [Ayyub (2014) has discussed other methods]. Fig. 3 illustrates a bowtie framework for wildfire triggered by equipment as an example risk concern.
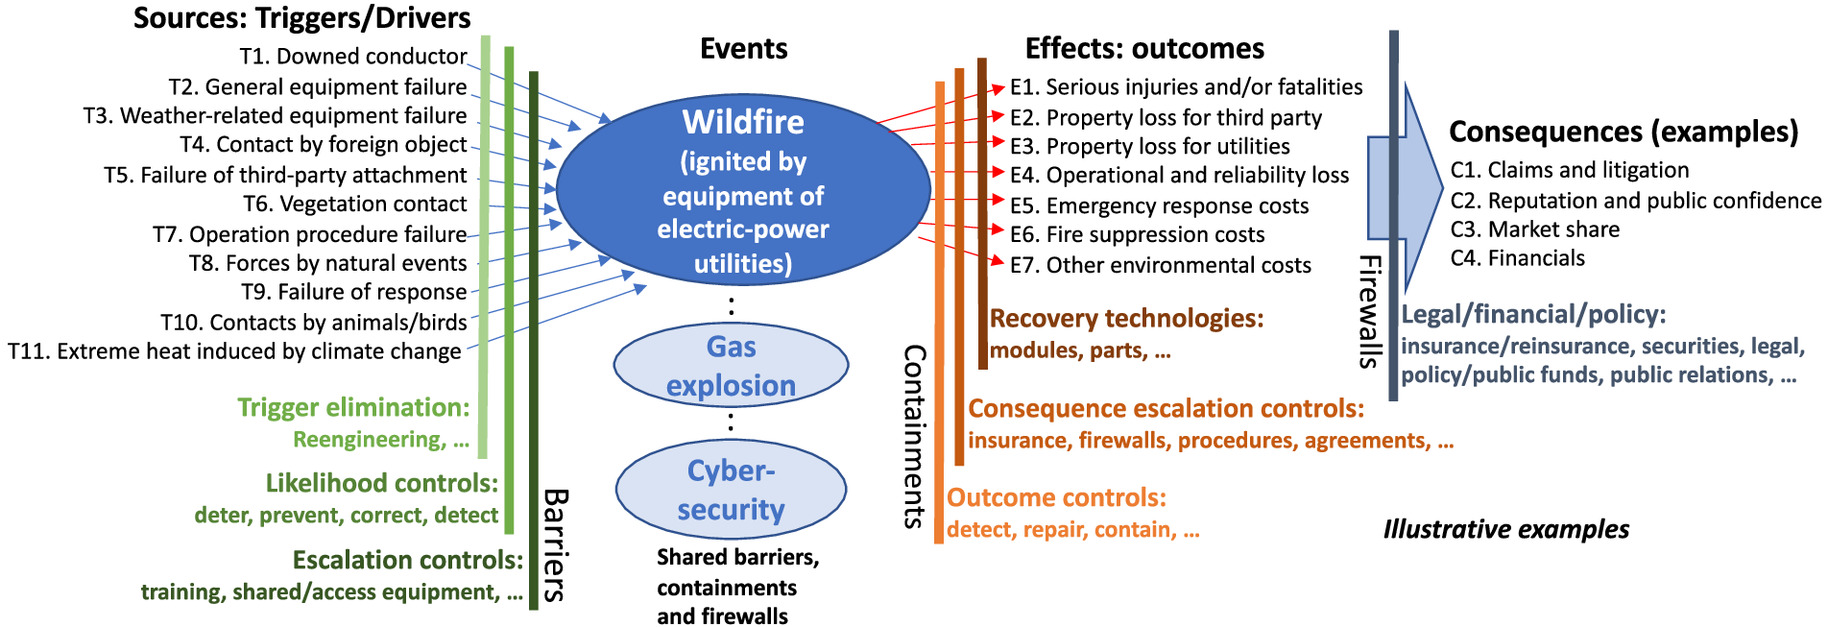
The different events are used to construct event-fault trees for assessing and quantifying risk in terms of loss exceedance curves. The figure shows several wildfire-related (1) triggers, such as downed conductor (T1), general equipment failure (T2), and so on; (2) effects or outcomes, such as serious injuries and/or fatalities (E), property loss for a third party (E2), and so on; and (3) consequences, such as claims (C1), financials (C4), and so on. Fig. 3 shows barriers placed between triggers and events, and containment, such as controls, placed between events and effects.
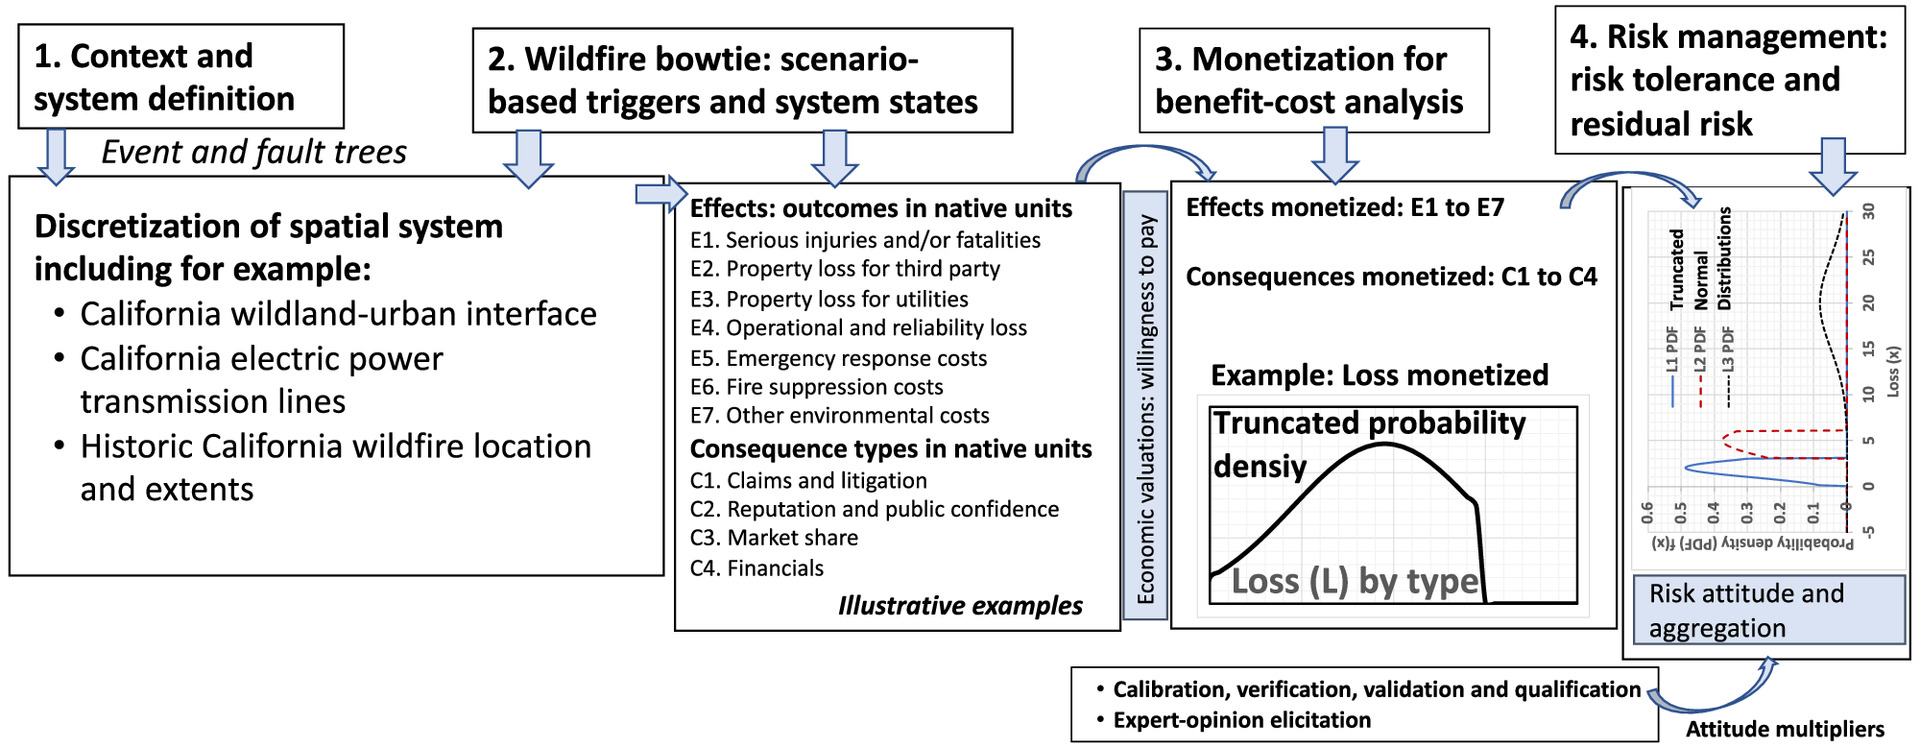
The proposed risk methodology in this paper is consistent with accepted practices (ISO 2009a; Ayyub 2014), fits well with CPUC’s RDF, and is illustrated at a high level in Fig. 4 by four steps: (1) context and system definition, (2) wildfire bowtie analysis, (3) monetizing losses for benefit-cost analysis, and (4) risk management, including risk tolerance and attitude and residual risk. The third and fourth steps are of particular interest because they allow for economic valuation and introducing risk aversion into the decision-making process. Also, the fourth step starts by setting risk tolerances with residual risks and using risk attitudes for loss accumulation by utilizing subjectively set risk-attitude amplification factors determined from applicable safety and other related insurance, bond, and other markets or elicited from experts and subjected to calibration including public elicitation, e.g., collective intelligence methods.
For example, in the context of Fig. 1, risk tolerance in the case of wildfire from the perspective of an IOU can be set as a risk type to be managed with a level defined by three ranges of potential losses reflecting varying risk attitudes: Loss range 1 () from zero to $300 million; Loss range 2 () from $300 to $600 millions; and Loss range 3 () from $600 to $3,000 millions as the largest possible level. The risk attitude of the IOU in this case is a mixture depending on the uncertain potential loss level, ranging from risk neutrality for lower loss levels (with less uncertainty) to varied risk aversion for higher loss levels (with greater uncertainty). Risk-seeking typically is an inappropriate attitude in this case. The analytics and quantification associated with such risk attitudes reflect the decision situation where the public interest, safety, service delivery reliability, rate affordability, and the financial wellbeing of entities come together in a complex manner. Subsequent sections offer methods for setting risk tolerances and attitudes by offering flexibility to account for preferences by stakeholders.
Benefit-Cost Analysis for Informing Decisions
The 1993 Executive Order 12866 (EO 1993) on regulatory philosophy states that costs and benefits shall be understood to include both quantifiable measures and qualitative measures that are essential in order to select approaches or options that maximize net benefits, including (1) potential economic, environmental, public health and safety, and other advantages; (2) distributive impacts; and (3) equity. Benefit-cost analysis (BCA) expresses both benefits and costs in monetary units to the extent feasible, which enables evaluating different options with a variety of attributes using a common measure. The net benefit is the absolute difference between the projected benefits and costs. The benefits should include monetized avoided losses that are associated with a particular approach or option.
The ratio of benefits to costs might not be a meaningful indicator of net benefits. Considering such ratios alone may ignore the absolute size of costs and benefits because such ratios do not clarify which alternative yields the greatest net benefits, and they are sensitive to whether negative willingness-to-pay (WTP) or willingness-to-accept (WTA) valuations are subtracted from benefits or added to costs (Boardman et al. 2018). Net benefits can be accumulated based on the underlying costs and benefits by their respective cashflows with the use of discount rates. Accumulation models and distributions are presented in this section for the purpose of computing net benefits and grouped into three categories covering a planning horizon or the life associated with an approach or option:
•
Benefits () include (1) disaster economic benefits associated with response and recovery costs, direct loss reduction and indirect loss reductions, (2) value of mortality reduction, and (3) non-disaster-related benefits.
•
Costs () are associated with an approach or option as a cashflow including direct costs, indirect costs, and one-time or recurring operations, maintenance, and repair costs.
•
Externalities () are typically not included in traditional benefit-cost analysis, but may be appropriate at societal benefits and costs. They capture additional benefits (positive) or costs (negative) from any spatial or temporal spaces associated with third-parties to an option or strategy being examined including one-time or recurring over the planning horizon or associated life of an option.
The respective cashflows of , , and with the appropriate probabilities and discount rates can be used in accumulation models to compute the distribution of the net benefits and other economic indicators of interest such as the expected and other moments of the net present value, the benefit-to-cost ratio, internal rate of return, return on investment (ROI), and nondisaster ROI. The net benefit can be expressed
(1)
The loss reduction or loss avoidance associated with an approach or option is typically included as a benefit in . Computing the loss reduction or avoidance requires accumulating loss () over a planning period () as follows (Ayyub 2014):where = cumulative distribution function; = loss; = event count in time period ; and -fold convolution of with symbolizing infinity, where using instead the largest possible number of events in the planning period requires normalizing by the sum of all the Poisson probabilities over the range of used. Eq. (2) can be generalized to cover loss accumulation of multiple loss Poisson processes. For the case of a untruncated normal, Eq. (2) is expressed
(2)
(3)
These loss-reduction benefits associated with an approach or action based on Eqs. (2) and (3) assume a Poisson stochastic process with losses that are independently identically distributed (IID) and having an occurrence rate , and a probability density function (PDF) for loss magnitudes or intensity ().
Setting Risk Tolerances and Quantifying Risk Attitudes
Risk tolerance is a function of adverse event types and respective maximum possible losses in native or monetized measurements over a range of exposures per event or on an annual basis. A monetized loss distribution over its range can be represented by a truncated probability distribution, e.g., the truncated normal distribution used herein and can be treated by a mixture distribution (Ayyub 2014) as discussed in a subsequent section.
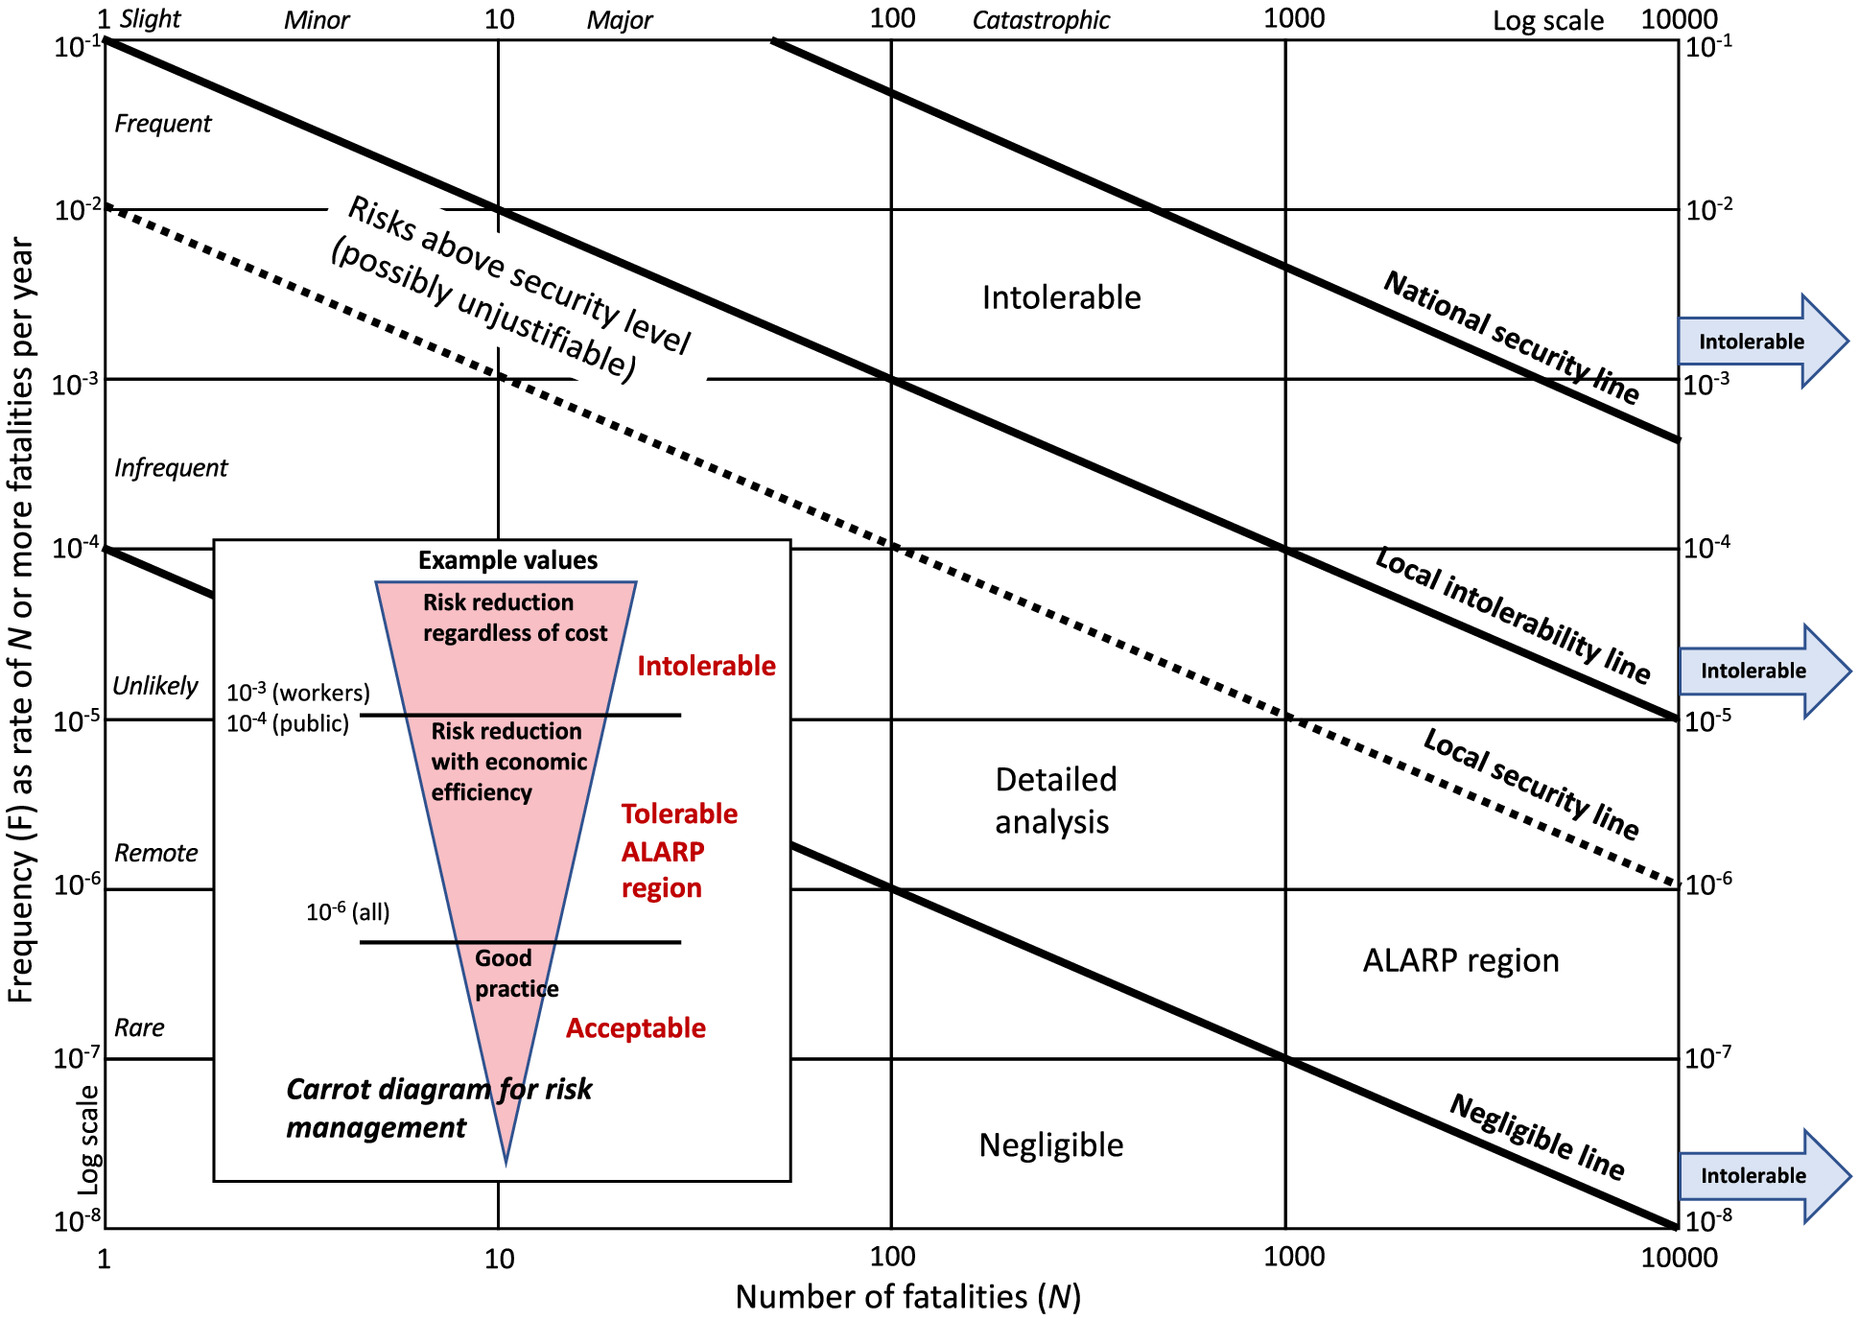
For each risk type, an overall loss () range is defined for setting the risk tolerance and divided in practical or readily comprehensible ranges (, , , and so on) based on a decision-maker or community’s preferences and uncertainty levels per event or annualized. These ranges can be named using terms such as operational, critical and catastrophic regions as illustrated by , , and in Fig. 5. Some of these ranges are tolerable (i.e., acceptable) without any changes, and other are subjected to risk treatments in economically efficient terms for reduction to acceptable levels. Other ranges can be included that are tolerable but requiring particular treatments through changes to an underlying system, market, regulations and policies, or demonstrating the attainment in its risk reduction to as low as reasonably practicable levels (ALARP) as set in for risk criteria (Fig. 6, which was developed for a major hazards of transport study) (HSE 1992, 2023; TRB 2018). Such layering of losses (or in general liability) is a common practice in the insurance and reinsurance marketplace, for example
•
The 1957 Price-Anderson Act limited liability of its reactor licensees for radioactive damages to members of the public (Ayyub and Parker 2011).
•
The 1980 US Supreme Court ruled in AFL-CIO (oil and chemicals industry) v. American Petroleum Institute for the occupational safety and health administration (OSHA) standard limiting benzene in the workplace (US Supreme Court 1980).
•
ALARP weighs risks against efforts or costs needed to respectively control them (HSE 1992, 2023; TRB 2018).
The aforementioned 1980 Supreme Court ruling made distinctions according to the following two items: (1) a significant safety concern defined by scientific evidence requiring regulatory action, and (2) the use of benefit-cost analysis for safety enhancement. This ruling affirmed that reducing benzene exposure from 10 to 1 parts per million (ppm) (per OSHA new standard) does not meet Item 1 by lacking scientific evidence. Additionally, the ruling states that benefit-cost analysis (BCA) per Item 2 can be used only after meeting Item 1, and benefit-cost analysis can go as far as technologically and economically possible to eliminate the safety concern. This 1980 case founded the rulemaking space for safety threshold setting applicable to other risks including ones encountered by utilities, and the monetization and economics for safety enhancement in efficient economic terms after thresholds are met.
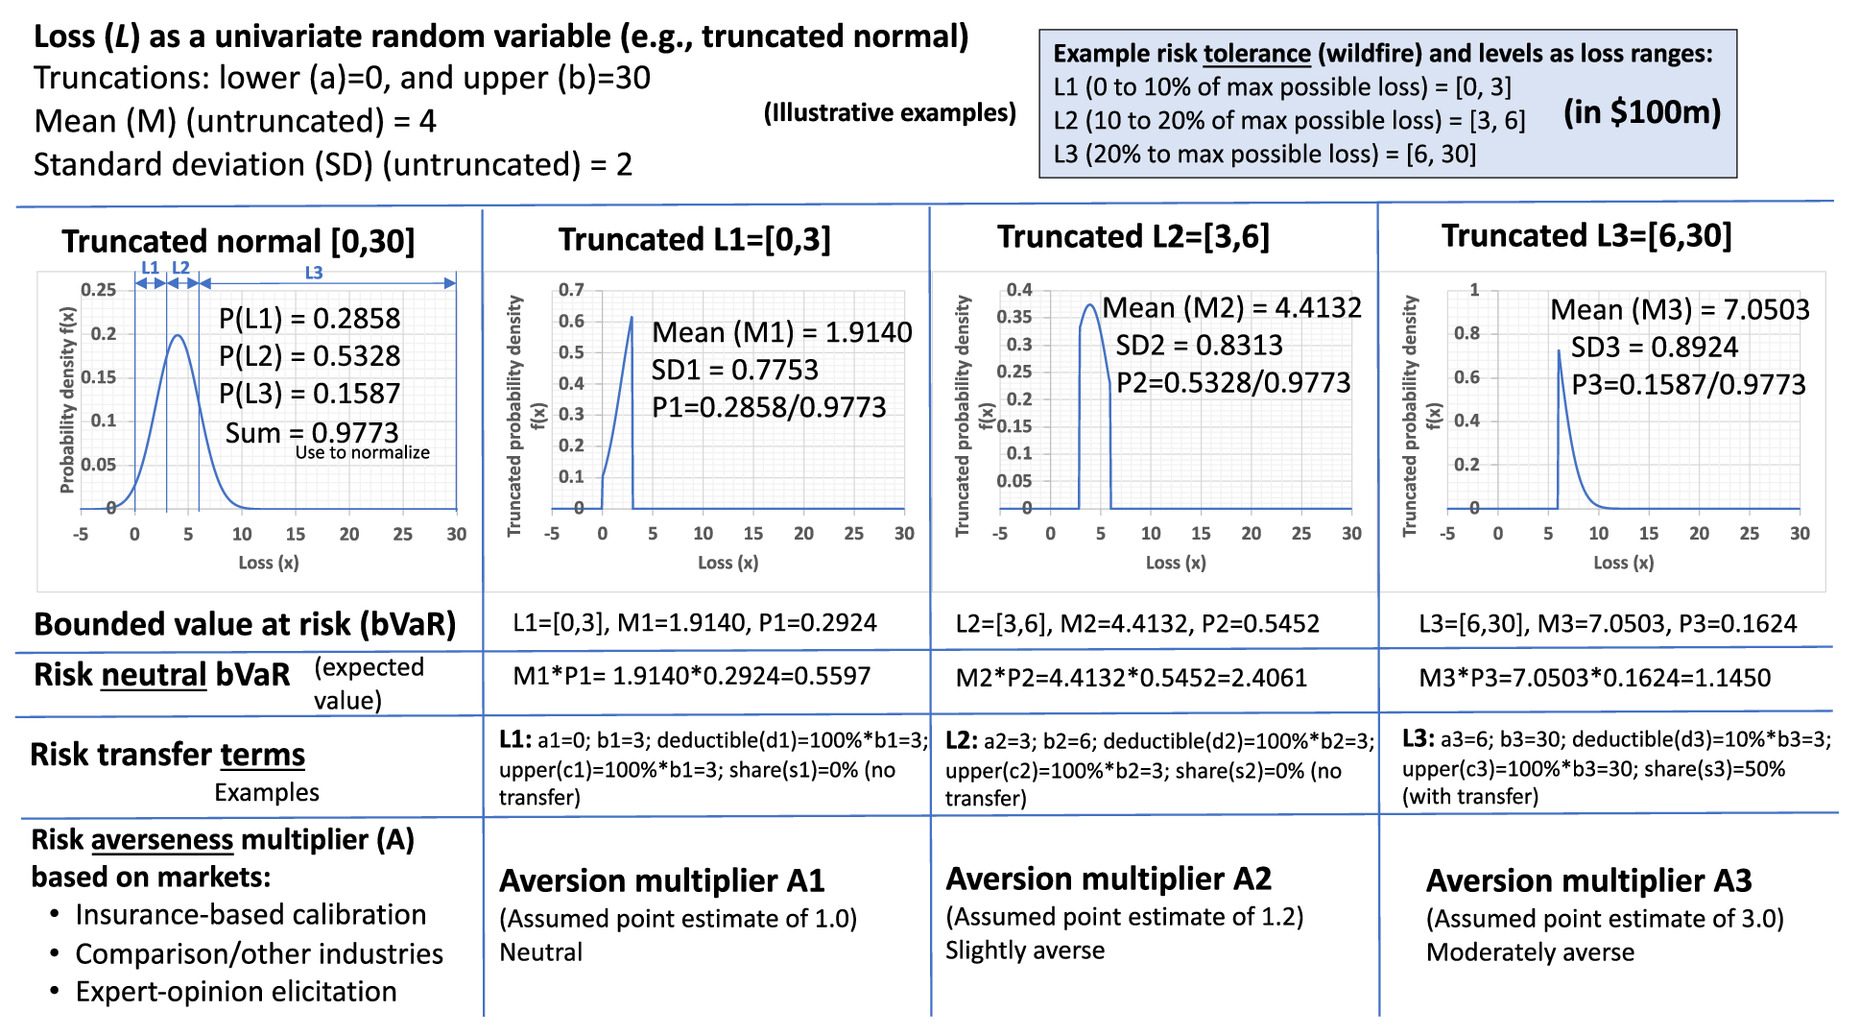
Tolerable losses are then managed further by analytics for economic efficiency in a manner to reflect the risk attitudes of a decision maker. Fig. 5 illustrates the risk-tolerance concepts, and the definition of loss ranges and associated uncertainties. The case of wildfire is considered in this figure by defining from 0 to $3 billion, i.e., [0,30] in $100 millions, and dividing it in , , and . The distribution of is assumed to be a [0,30] truncated normal with a nontruncated mean and standard deviation of 4 and 2, respectively (in $100 millions). Each loss range of , , and are truncated from the distribution of , and the corresponding Bounded Value At Risk (bVaR) in terms of its mean () and probability () is introduced herein to further illustrate risk attitudes and associated analytics as provided in Fig. 6.
The concept of the bVaR introduced herein builds on the value at risk (VaR) defined as a single-valued, i.e., thresholdlike loss associated with an exceedance probability. Also, it is related to the conditional value at risk (cVaR) defined as the mean value of the loss exceeding VaR. Whereas VaR represents a threshold loss associated with an exceedance probability and cVaR is the expected loss of exceeding VaR, i.e., cVaR is greater than VaR; bVaR is the expected value of losses in the range from VaR and an upper-bounded maximum possible loss, with infinite maximum possible loss bVaR becoming cVaR.
To account for risk attitude in assessing risk treatments for risk reduction, the corresponding expected net benefits (monetized using economic valuations) are computed under the assumption of risk neutrality, i.e., their expected value, followed by their adjustment to higher levels corresponding to the respective market-related, such as willingness-to-pay, amounts on the basis of hypothetically transferring them fully or partially by agreement for premium-receiving other entities such as insurers or reinsurers in the cases of losses, guided by existing practices and judgment within regulatory constraints.
A distinction is necessary herein between loss aversion and risk aversion as defined under terminology. Loss aversion entails paying a premium (as a loss with certainty) in a market to avoid or reduce loss and its associated uncertainties. On the other hand, risk aversion entails paying a premium in a market to ensure a certain level of gain or net-gain, such as the net-benefit outcomes including loss avoidance and other benefits, extraneities, and costs including uncertainty reduction in outcomes. Basically, a particular loss and its associated uncertainties, represented by a loss incident rate and loss intensity distribution, can be transferred in a market, such as an insurance or bond market, to a certainty-equivalent valuation determined by the corresponding insurance-related premium or bond-related return as provided by Office of Management and Budget (OMB) Circular A-4 (OMB 2023) and detailed as a function of willingness-to-pay concepts and expected damages by Kind et al. (2017).
For example, in the case of risk aversion in an insurance market, an insurance-premium payment that is higher than the expected loss value can be viewed as a sure-loss premium for a loss transfer, reflecting risk aversion by an insurance purchaser (i.e., to avoid or reduce the loss), and by an insurance provider (i.e., to take on the loss and associated profit and fee benefit). The ratios of risk-aversion premiums to the risk-neutral expected loss values are used as estimates of the extent of risk aversion as the reciprocal of loss ratios reported in actuarial insurance studies (US Dept. of Treasury 2022), and called herein as risk-aversion amplification factors. These are similar to the risk-premium multiplier of Kind et al. (2017).
These factors are further adjusted by the product of the reciprocals of satisfactory outcomes of loss psychological aspects. Therefore, they reflect both the psychological and microeconometric considerations in risk preference, noting that other considerations, such as prioritization for disadvantaged and vulnerable communities, can be reflected under risk preference for loss psychological aspects (illustrated in Fig. 7 for loss avoidance). The use of reciprocals is illustrative of the process proposed and can be applied for each loss range and for each risk event including wildfires, earthquakes, gas pipeline ruptures, and so on.
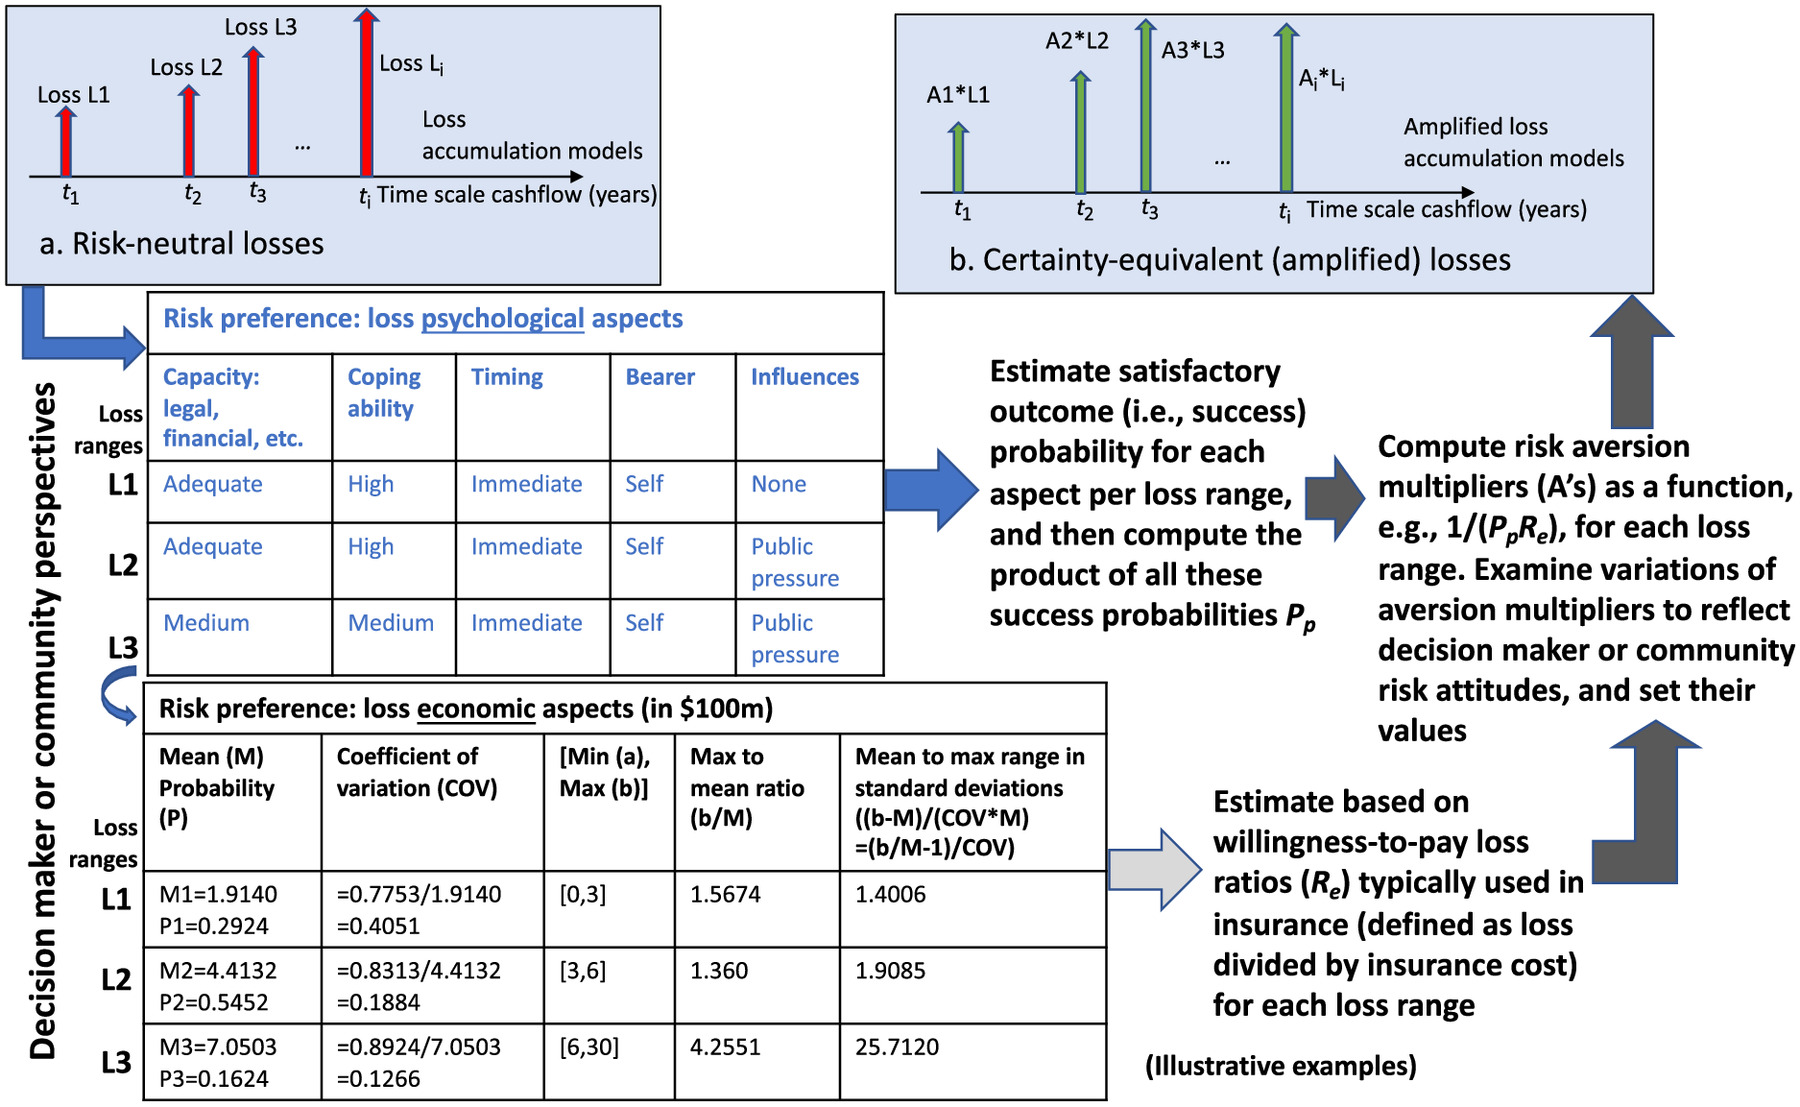
In this paper, this proposed approach is illustrated by loss-ratio and probability reciprocals for incorporating such information broadly into aversion amplification factors. These amplification factors can be treated as random variables and analyzed further to estimate and recommend point estimates for use. Such factors offer a workable scaling function to reflect risk-aversion premiums associated with losses and used in loss accumulation models (Gilbert and Ayyub 2016). This method is not limited to a particular risk type and is applicable broadly for risks associated with electric power and gas IOUs and other industries. It can reflect individual entity and societal risk preferences and can be empirically constructed to reflect the prevailing general aversion with variability across hazards, events, and decisions.
Risk attitudes are generally nonstationary, dynamic, and evolving, and this method can accommodate any applicable trend. The degree of risk aversion according to portfolio theory is defined by the additional marginal return an investor demands for any additional loss exposure and benefits (collectively outcomes) represented by greater bounds or greater standard deviations for the return; the concept of loss bounds is more applicable than standard deviations for hazard types encountered by IOUs.
The proposed factors are termed partial risk-aversion amplification factors used in the respective cashflows of , , and with the appropriate probabilities and discount rates in accumulation models to reflecting aversion and compute the distribution of the net benefits and other economic indicators of interest. The net expected benefit with aversion can be expressed as follows:where = loss reduction or loss avoidance associated with an approach or option treated as a benefit based on using Eqs. (2) or (3); = risk-aversion amplification factor that can take different values dependent of loss level; = other added benefits including cobenefits with the respective factor for risk aversion; = costs with the respective factor for risk aversion, if applicable; and = other added benefits or impacts with the respective factor for risk aversion. Use of these factors to produce a certainty-equivalent valuation of, in this case, the losses avoided or averted as an expected benefit is in agreement with 2023 draft OMB Circular A-4 (OMB 2023) and consistent with Kind et al. (2017). In engineering studies with a focus on loss-reduction only, particularly associated with natural and other hazards, Eq. (4) can be limited to the first term focusing on loss reduction or avoidance as follows:
(4)
(5)
The other terms in Eq. (4) can be viewed as unaffected by the approach or option being examined compared with the do-nothing base option.
Mixture Loss Distributions: An Example
In this section, each loss range of , , and , as introduced in previous sections, is separately modeled using a truncated normal distribution with respective bounds and moments as shown in Fig. 8. Other distributions may be used to meet the characteristics of the potential loss being modeled.
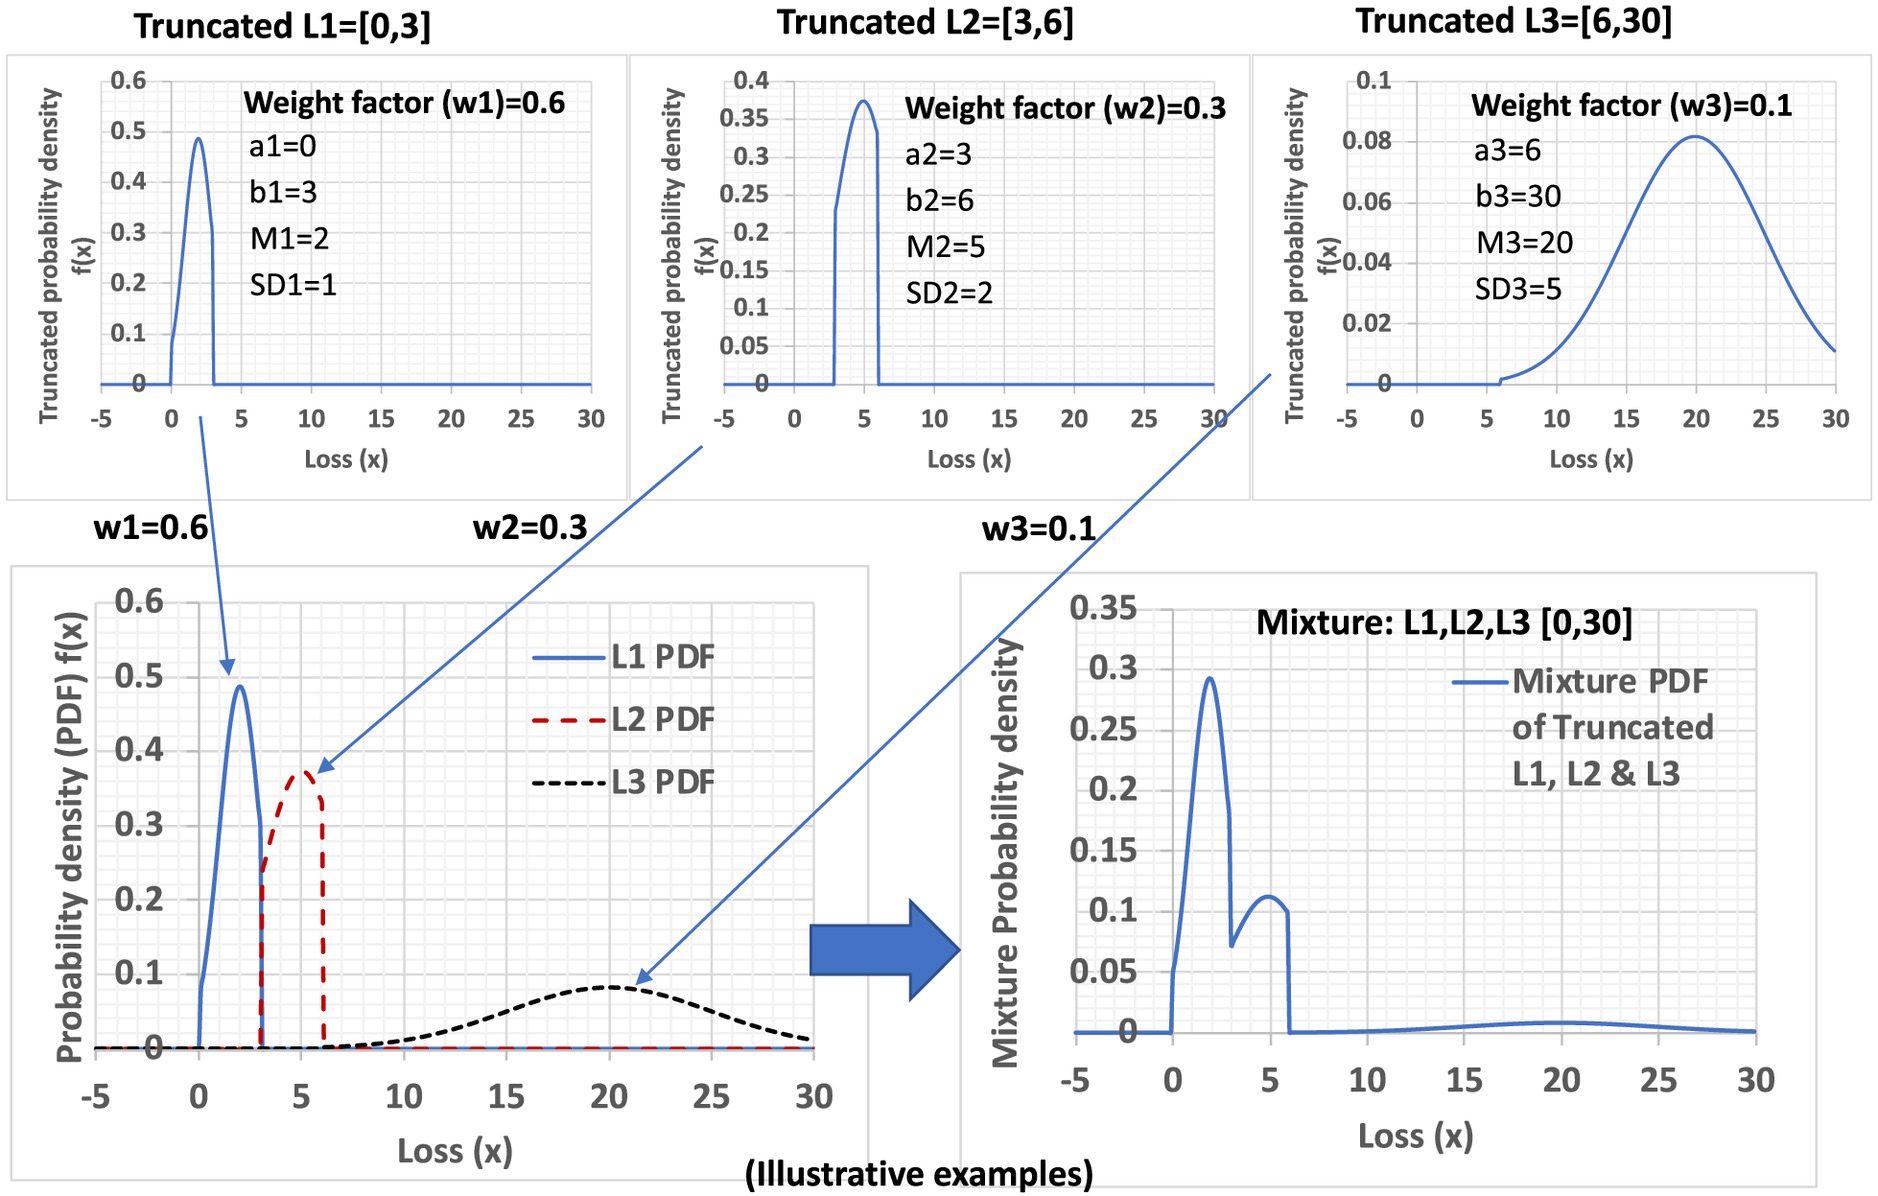
Then, the individual PDFs of , , and are aggregated to construct a mixture PDF as the weighted sum of the three PDFs using respective weight factors of 0.6, 0.3, and 0.1 as examples. The weight factors must add up to one. The resulting truncated mixture distribution shows as expected trimodality. Alternatively, the loss distribution for entire range can be initially examined for appropriateness prior to truncating at the tails for each loss range. Also, instead of using weight factors, loss occurrences for , , and can be modeled by stochastic Poisson processes with losses that are IID having respective occurrence rates , , and as provided in Eqs. (2) and (3).
Use and Quantification of Partial Risk-Aversion Amplification Factors
The use of partial risk-aversion amplification factors as multipliers (Fig. 7) is straightforward and works with loss-accumulation models as provided by Eqs. (1) and (2), following Gilbert and Ayyub (2016). The use of these factors produces a certainty-equivalent valuation of underlying components of economic models that is in agreement with OMB Circular A-4 (OMB 2023). The primary models for using these factors are provided in Eqs. (4) and (5). The following types of amplification factors can be used: (1) risk-aversion factors, (2) benefit factors, (3) cost factors, typically assigned values of one, and (4) externality factors.
The risk-aversion amplification factors are applied to each loss component, and the amplified losses reflecting risk aversion are treated in these models in the same manner as other losses that were not amplified for cases of risk neutrality. Similarly, partial risk-aversion amplification factors are applied to each benefit or externality component that account for uncertainty in outcomes, and the amplified values reflecting aversion are treated in these models in the same manner as other values that were not amplified for cases of risk neutrality. Such an approach offers simplicity, compatibility with existing practices, and transferability across decision situations and industries for the goal of achieving consistency and transparency.
Methods and Markets for Quantifying Risk Attitudes
Risk tolerances and attitudes can be set based on explicit objectives of decision makers by public or corporate policy or best practice within legal bounds. Risk tolerances can be calibrated based on existing public policies to define loss ranges. Such risk-tolerance policies affect investment planning decisions and should be carefully examined parametrically to gain insights in impacts on stakeholders and identification of any dominant strategies.
The models proposed in this paper can be calibrated and validated using applicable markets, such as follows:
•
Insurance markets, e.g., property loss, life and health (e.g., US Dept. of Treasury 2022).
•
Catastrophe bonds, e.g., wildfire and seismic (e.g., ARTEMIS 2023).
•
Policymaking and rule-making markets, e.g., cost of regulations (e.g., Tengs et al. 1995; Ayyub 2014).
•
Other financial markets.
For example, the insurance and reinsurance policies and other risk-transfer agreements by contracts may offer insights for quantifying such factors. A similar approach can be used based on catastrophe bonds, e.g., wildfire and seismic, and associated risks and yields. Regulations and rulemaking practices, accepted practices in other industries, such as commercial nuclear power, and ligation and court decisions might offer other sources to quantify these factors. Ayyub and Parker (2011), further developed by Ayyub et al. (2016) and Shao et al. (2017), provided information on nuclear catastrophe bonds. The Health and Safety Executive (HSE) (HSE 1992, 2023), Transportation Research Board (TRB 2018), and Charness et al. (2013) provided additional information on setting tolerances and risk attitudes. The paper additionally recommends and proposes the use of formal expert-opinion elicitation methods to calibrate underlying parameters using input from specialists and stakeholders based on related practices, and markets including regulatory pricing, insurance, reinsurance, bond, and investment decisions in a structured and formal setting (Ayyub 2001, 2014; Ayyub and Klir 2006).
Illustrative Examples for Risk Aversion
Example 1. Wildland Urban Interface Wildfire Impact
This section is based on the National Institute of Standards and Technology (NIST) economic decision guide software (commonly called by its acronym EDGe$) tutorial case study leveraging the use of EDGe$ in a wildland–urban interface (WUI) (Helgeson and Zhang 2020). The Ronald Reagan Presidential Library (RRPL) is explored as a motivation and for illustration in this section. It hosts an archive of scholarly and historic material and is a popular tourist attraction. It is located in Simi Valley, Ventura County, California, which is classified as a Very High Fire Hazard Severity Zone (Cal Fire 2020), qualitatively indicating a high chance of experiencing a wildfire in the next 30 to 50 years. For example, the Easy Fire of 2019 surrounded the RRPL campus, and the building narrowly avoided becoming engulfed in flames. From this fire alone, the library suffered $500,000 in losses from damage to decorations, the internet box, and the surrounding landscape (Sanchez and Chan 2019). Table 1 provides estimated losses for Simi Valley from a future fire that ignites the RRPL based on Helgeson and Zhang (2020) with annotations and assumptions by the authors.
| Category | Risk attitude | Item | Value | Source |
|---|---|---|---|---|
| Direct | Neutral | Structural and content | $37.23 million | Siemens (2015): Property structural losses the value of artifacts average cost of 12 museum wildfires since 2000 |
| Indirect | Neutral | Downtime | $7.8 million | Rodríguez Mega (2019) and Foerch (2020) |
| Indirect | Neutral | Long-term | $24.82 million | Helgeson and Zhang (2020) |
| Response and recovery | Neutral | Evacuation | $10.68 million | Helgeson and Zhang (2020) |
| Mortality reduction | Averse | Mortality reduction | 3 mortalities | Assumed (Helgeson and Zhang 2020) |
The Ventura County board worked with RRPL and community stakeholders for enhancing resilience and identified two options:
•
Option 1. Upgrade the current library by conducting a thorough retrofit with wildfire-resistant materials and green building design at the current location in Simi Valley.
•
Option 2. Construct a new, green library in the nearby city of Oxnard, California.
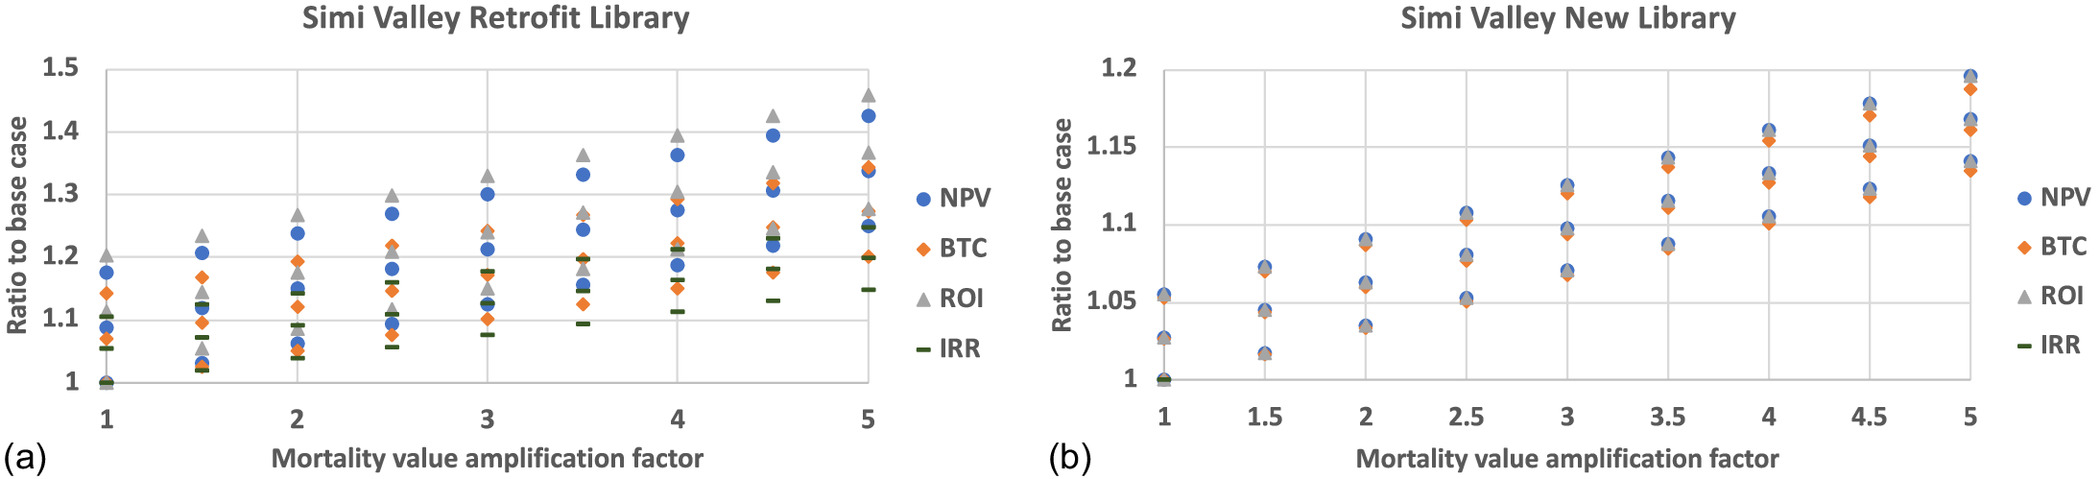
Helgeson and Zhang (2020) considered separately the nearby city of Oxnard in terms of wildfire risk, which is not included in this example, and limiting the example to the Simi Valley. The analysis included several assumptions such as a planning horizon of 50 years, wildfire recurrence of 40 years, real discount rate of 5%, and a 2011 value of mortality reduction (typically termed value of statistical life) of $7.9 million. The two options were compared with the status quo of doing nothing. The focus of this example is illustrating the use of risk-aversion factors as proposed in the paper. It was assumed that loss of content and mortality reduction will be treated with risk aversion, whereas other loss categories listed in Table 1 are maintained with the risk neutrality as provided by Helgeson and Zhang (2020).
The costs of the two options have been detailed by Helgeson and Zhang (2020) and are summarized herein approximately as follows: Option 1 has costs of $10.74 million of direct and indirect costs, and Option 2 has costs of $101 million direct historic value cost, $56 million property resale as gain and $2.5 million in operation savings for Simi Valley.
The benefits as loss and life reduction are 60%, 60%, 20%, and 1, respectively, for direct, indirect, response and recovery, and mortality. Additionally, non-disaster-related benefits are included as cobenefits, such as for Simi Valley asset value increase, noise reduction, energy savings, operation savings, productivity, and construction earnings. Externalities are considered for the retrofit plan because Oxnard’s new library would impose strong negative externalities on Simi Valley. The combined costs of lost library access and foregone tourism, offset by the increase in students, is considered to be a negative economic externality on Simi Valley.
The risk attitude treatment assumed herein in the form of loss amplification factors as follows: (1) direct property loss amplification factor () based on the reciprocal insurance loss ratios, and (2) mortality amplification factor () based on catastrophe bond return-to-risk ratios. These factors were varied from the baseline case of having values of from (1,1) to (2,5) in increments of 0.5 as summarized in Table 2. The results are plotted in Fig. 9 for the two options as ratios top the base case of economic indicators, i.e., net present value (NPV), benefit-to-cost (BTC) ratio, return on investment (ROI), and internal rate of return (IRR). The results of these options can inform decisions in conjunction with other considerations including political and fiscal limitations.
| Direct property loss amplification factor | Mortality amplification value factor | NPV ($1,000s) | BTC ratio | ROI (%) | IRR (%) |
|---|---|---|---|---|---|
| Option 1. Library retrofit for Simi Valley | |||||
| 1 | 1 | 45,050 | 5.175 | 8.17 | 53.54 |
| 1.5 | 1 | 49,021 | 5.543 | 9.09 | 56.42 |
| 2 | 1 | 52,992 | 5.911 | 9.82 | 59.23 |
| 1 | 1.5 | 46,454 | 5.305 | 8.61 | 54.57 |
| 1.5 | 1.5 | 50,425 | 5.673 | 9.35 | 57.42 |
| 2 | 1.5 | 54,396 | 6.041 | 10.08 | 60.20 |
| 1 | 2 | 47,859 | 5.435 | 8.87 | 55.58 |
| 1.5 | 2 | 51,829 | 5.803 | 9.61 | 58.41 |
| 2 | 2 | 55,800 | 6.171 | 10.34 | 61.17 |
| 1 | 2.5 | 49,263 | 5.565 | 9.13 | 56.59 |
| 1.5 | 2.5 | 53,234 | 5.933 | 9.87 | 59.39 |
| 2 | 2.5 | 57,205 | 6.301 | 10.60 | 62.13 |
| 1 | 3 | 50,667 | 5.695 | 9.39 | 57.59 |
| 1.5 | 3 | 54,638 | 6.063 | 10.13 | 60.37 |
| 2 | 3 | 58,609 | 6.431 | 10.86 | 63.08 |
| 1 | 3.5 | 52,072 | 5.825 | 9.65 | 58.58 |
| 1.5 | 3.5 | 56,042 | 6.193 | 10.39 | 61.34 |
| 2 | 3.5 | 60,013 | 6.561 | 11.12 | 64.04 |
| 1 | 4 | 53,476 | 5.956 | 9.91 | 59.56 |
| 1.5 | 4 | 57,447 | 6.324 | 10.65 | 62.30 |
| 2 | 4 | 61,418 | 6.692 | 11.38 | 64.97 |
| 1 | 4.5 | 54,880 | 6.086 | 10.17 | 60.54 |
| 1.5 | 4.5 | 58,851 | 6.454 | 10.91 | 63.25 |
| 2 | 4.5 | 62,822 | 6.822 | 11.64 | 65.91 |
| 1 | 5 | 56,285 | 6.216 | 10.43 | 61.50 |
| 1.5 | 5 | 60,255 | 6.584 | 11.17 | 64.19 |
| 2 | 5 | 642,26 | 6.952 | 11.90 | 66.84 |
| Option 2. New library for Simi Valley | |||||
| 1 | 1 | 239,555 | 23.45 | 44.89 | |
| 1.5 | 1 | 246,173 | 24.07 | 46.13 | |
| 2 | 1 | 252,792 | 24.69 | 47.37 | |
| 1 | 1.5 | 243,768 | 23.84 | 45.68 | |
| 1.5 | 1.5 | 250,386 | 24.46 | 46.92 | |
| 2 | 1.5 | 257,005 | 25.08 | 48.16 | |
| 1 | 2 | 247,981 | 24.24 | 46.47 | |
| 1.5 | 2 | 254,599 | 24.86 | 47.71 | |
| 2 | 2 | 261,217 | 25.48 | 48.95 | |
| 1 | 2.5 | 252,194 | 24.63 | 47.26 | |
| 1.5 | 2.5 | 258,812 | 25.25 | 48.50 | |
| 2 | 2.5 | 265,430 | 25.87 | 49.74 | |
| 1 | 3 | 256,407 | 25.03 | 48.05 | |
| 1.5 | 3 | 263,025 | 25.65 | 49.29 | |
| 2 | 3 | 269,643 | 26.27 | 50.53 | |
| 1 | 3.5 | 260,620 | 25.42 | 48.84 | |
| 1.5 | 3.5 | 267,238 | 26.04 | 50.08 | |
| 2 | 3.5 | 273,856 | 26.66 | 51.32 | |
| 1 | 4 | 264,833 | 25.82 | 49.63 | |
| 1.5 | 4 | 271,451 | 26.44 | 50.87 | |
| 2 | 4 | 278,069 | 27.06 | 52.11 | |
| 1 | 4.5 | 269,046 | 26.21 | 50.42 | |
| 1.5 | 4.5 | 275,664 | 26.83 | 51.66 | |
| 2 | 4.5 | 282,282 | 27.45 | 52.90 | |
| 1 | 5 | 273,259 | 26.61 | 51.21 | |
| 1.5 | 5 | 279,877 | 27.23 | 52.45 | |
| 2 | 5 | 286,495 | 27.85 | 53.69 | |
Example 2. Wildfire and Electric Utilities
Risk Tolerance
Risk tolerance is typically set by regulations or policy by a government or an entity, for example, the HSE (1992), or as advanced by Haine (2015) for the California Public Utilities Commission, which is consistent with HSE (1992) with lower limits on life loss as illustrated in Fig. 10. The figure shows illustrative criteria in bold lines defining the three regions of intolerable risk, ALARP region, and acceptable region. Such criteria can be defined by regulation or enterprise policy. The figure shows as a dashed blue line an example of a typical case that was intentionally drawn to cut through the three regions defining the criteria by Haine (2015). The figure identifies three illustrative zones as follows:
•
Zone 1 falling above the upper-limit criterion. Within this zone, actions are necessary to bring the particulars of the case in compliance with the upper-limit criterion at any costs in order to justify the use of the case represented.
•
Zone 2, which falls within the ALARP region. Within this zone, actions are necessary to bring the particulars of the case in compliance with the lower-limit criterion, ideally with economic efficiency.
•
Zone 3, which falls within the acceptable region. Within this zone, actions can be pursued to bring the particulars of the case to greater safety and cost efficiency as long as staying within the lower-limit criterion.
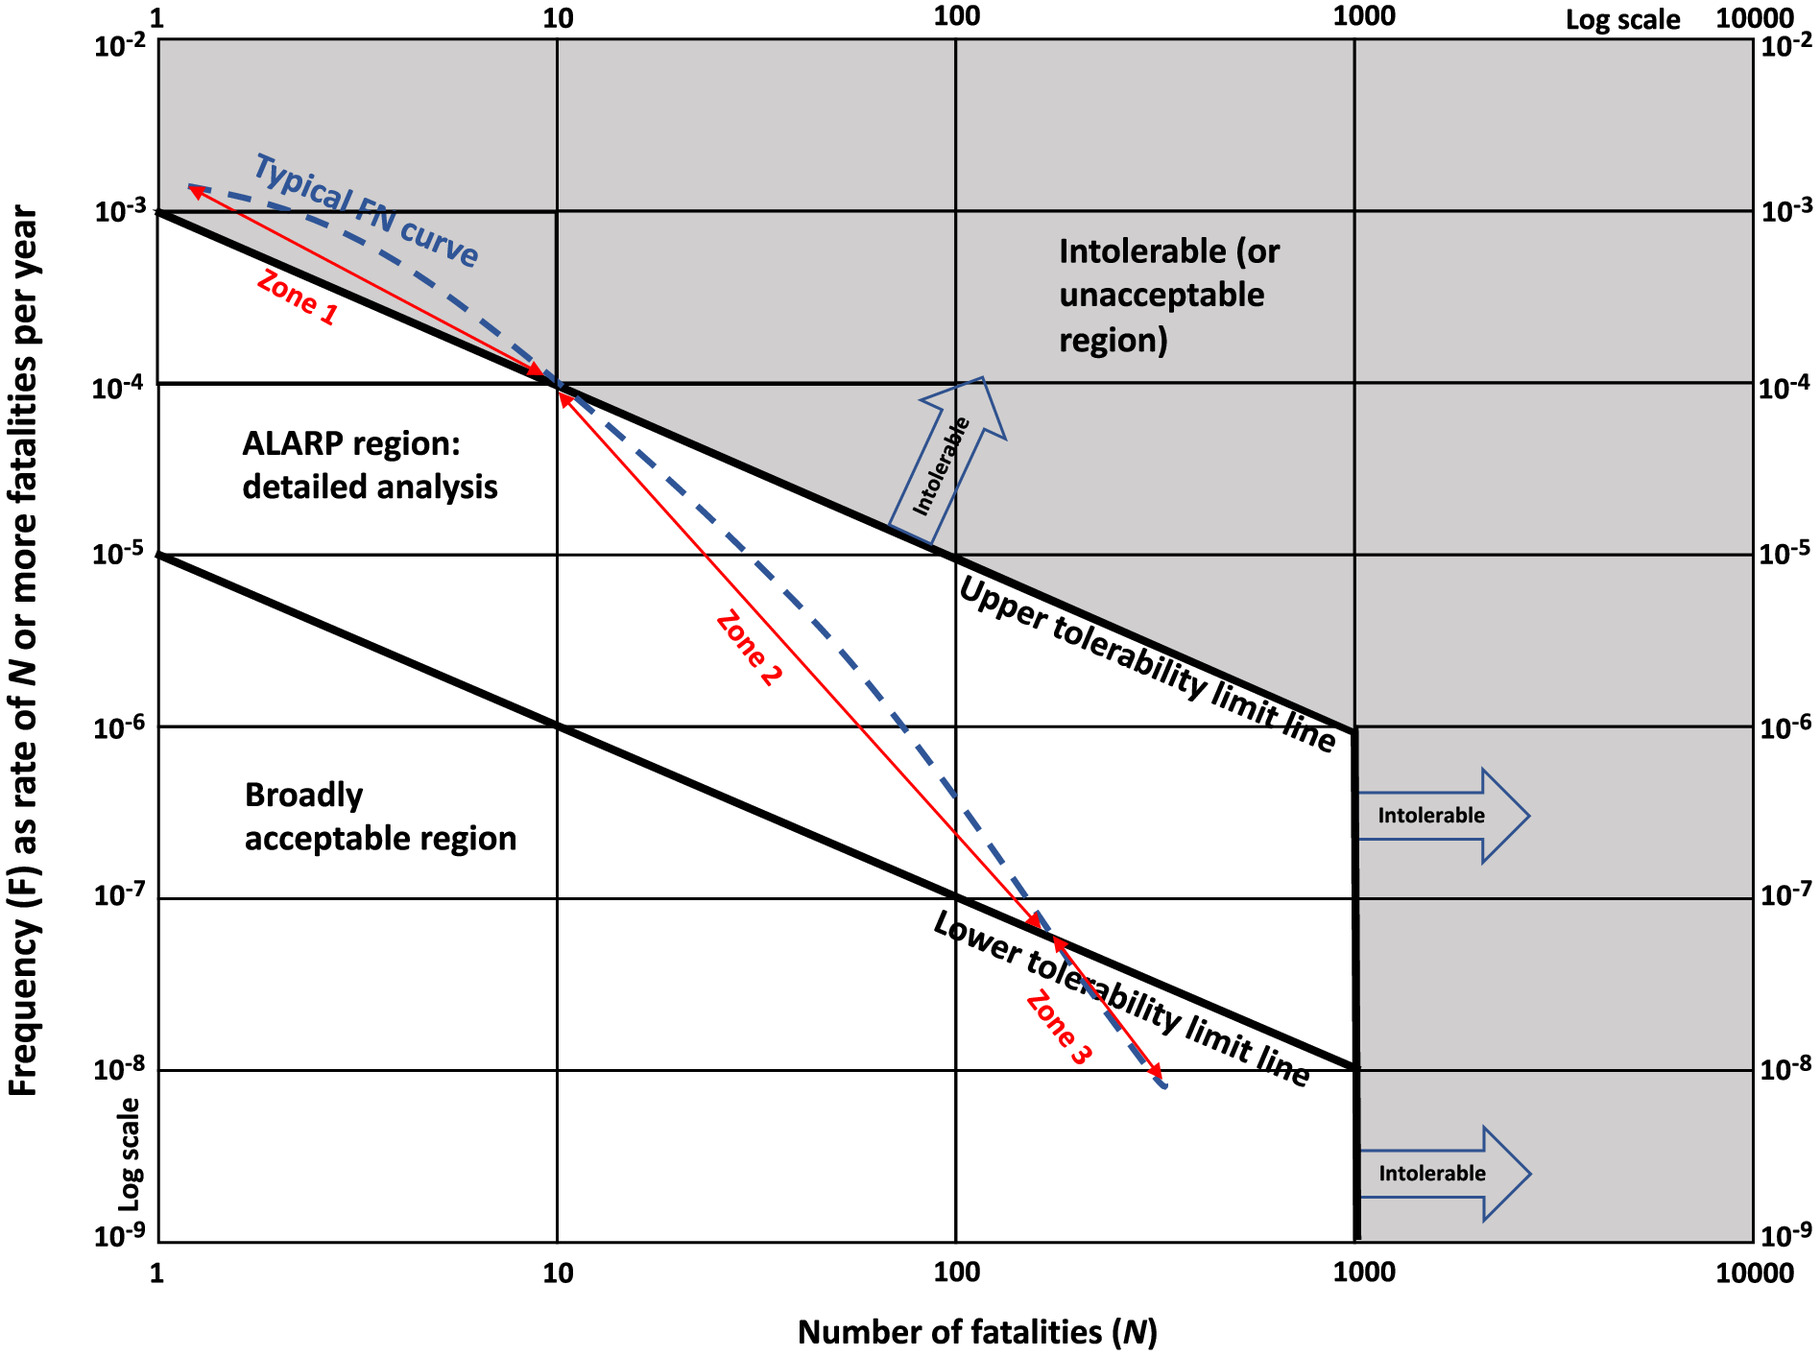
The lower and upper values for each zone are set for the purpose of illustration and do not carry with them any significance. Such an approach is in agreement with the intent of the law as set by the 1980 US Supreme Court ruling in AFL-CIO (oil and chemicals industry) v. American Petroleum Institute for the OSHA standard limiting benzene in workplace (US Supreme Court 1980).
Estimated Risk-Aversion Amplification Factors from Insurance and Catastrophe Bond Markets
The purpose of this example is to illustrate estimating risk-aversion amplification factors from insurance and catastrophe (CAT) bond markets. This example assumes having a regulatory or enterprise policy in place consistent with applicable laws and existing liability insurance and other risk-transfer mechanisms. Loss-related information from historic claim data or projections based on related analytics should be obtained and characterized as histograms with percentiles and probability distributions. These distributions can be used to define loss ranges, as an example, three loss ranges , , and as illustrated in Figs. 5 and 8. Truncation can facilitate making them disjoint if needed. The three ranges may correspond to the cases of retention for , i.e., risk neutral, treated by insurance-related models for , i.e., low risk-aversion levels, and treated by capital- (or bond- or security-) related models for , i.e., high risk-aversion levels as illustratively detailed in this section.
The first loss range () covers risks and associated losses that are retained by an IOU. For the purpose of illustration, the range can be set differently for safety, reliability, and financial concerns. Any losses within this range are covered directly by a utility for repairs, recovery, claim fulfillments, and so on. Generally, IOUs might find it cost-effective to retain low-magnitude and high-frequency losses. The probabilistic characteristics of can be estimated from historic records with adjustments to reflect future projections accounting for use and user changes, among other things. This range reflects risk neutrality in the treatment of the losses, and the loss-amplification factor is taken as one for .
For the second loss range (), which represents losses covered by insurance, the property and casualty loss ratios as reported to the US Dept. of Treasury (2022) by the insurance industry or loss ratios obtained for insurers of the respective IOUs can be used. Table 3 provides illustrative values taken from the US Dept. of Treasury (2022) for property and casualty insurance. The insurance industry makes additional gains from investments in financial and equity markets while maintaining liquidity for fulfilling claims within regulatory bounds. The loss ratios can be used as a basis for computing risk-aversion amplification factors by taking their reciprocals and adjusted subjectively as needed to enhance relevance. Typical loss ratios between 0.5 and 0.75 mean an amplification factor between 1.3 and 2.0 of expected loss, reflecting a modest level of risk aversion. For example, a risk-aversion amplification factor of 2.0 could be used for .
| Item | 2017 | 2018 | 2019 | 2020 | 2021 |
|---|---|---|---|---|---|
| Loss ratio (claims divided by premiums) | 0.6414 | 0.6071 | 0.6005 | 0.5934 | 0.6238 |
| Loss and loss adjustment expense ratio (claims plus expenses divided by insurance premiums) | 0.7591 | 0.7142 | 0.7103 | 0.7013 | 0.7253 |
Source: Data from US Department of Treasury (2022).
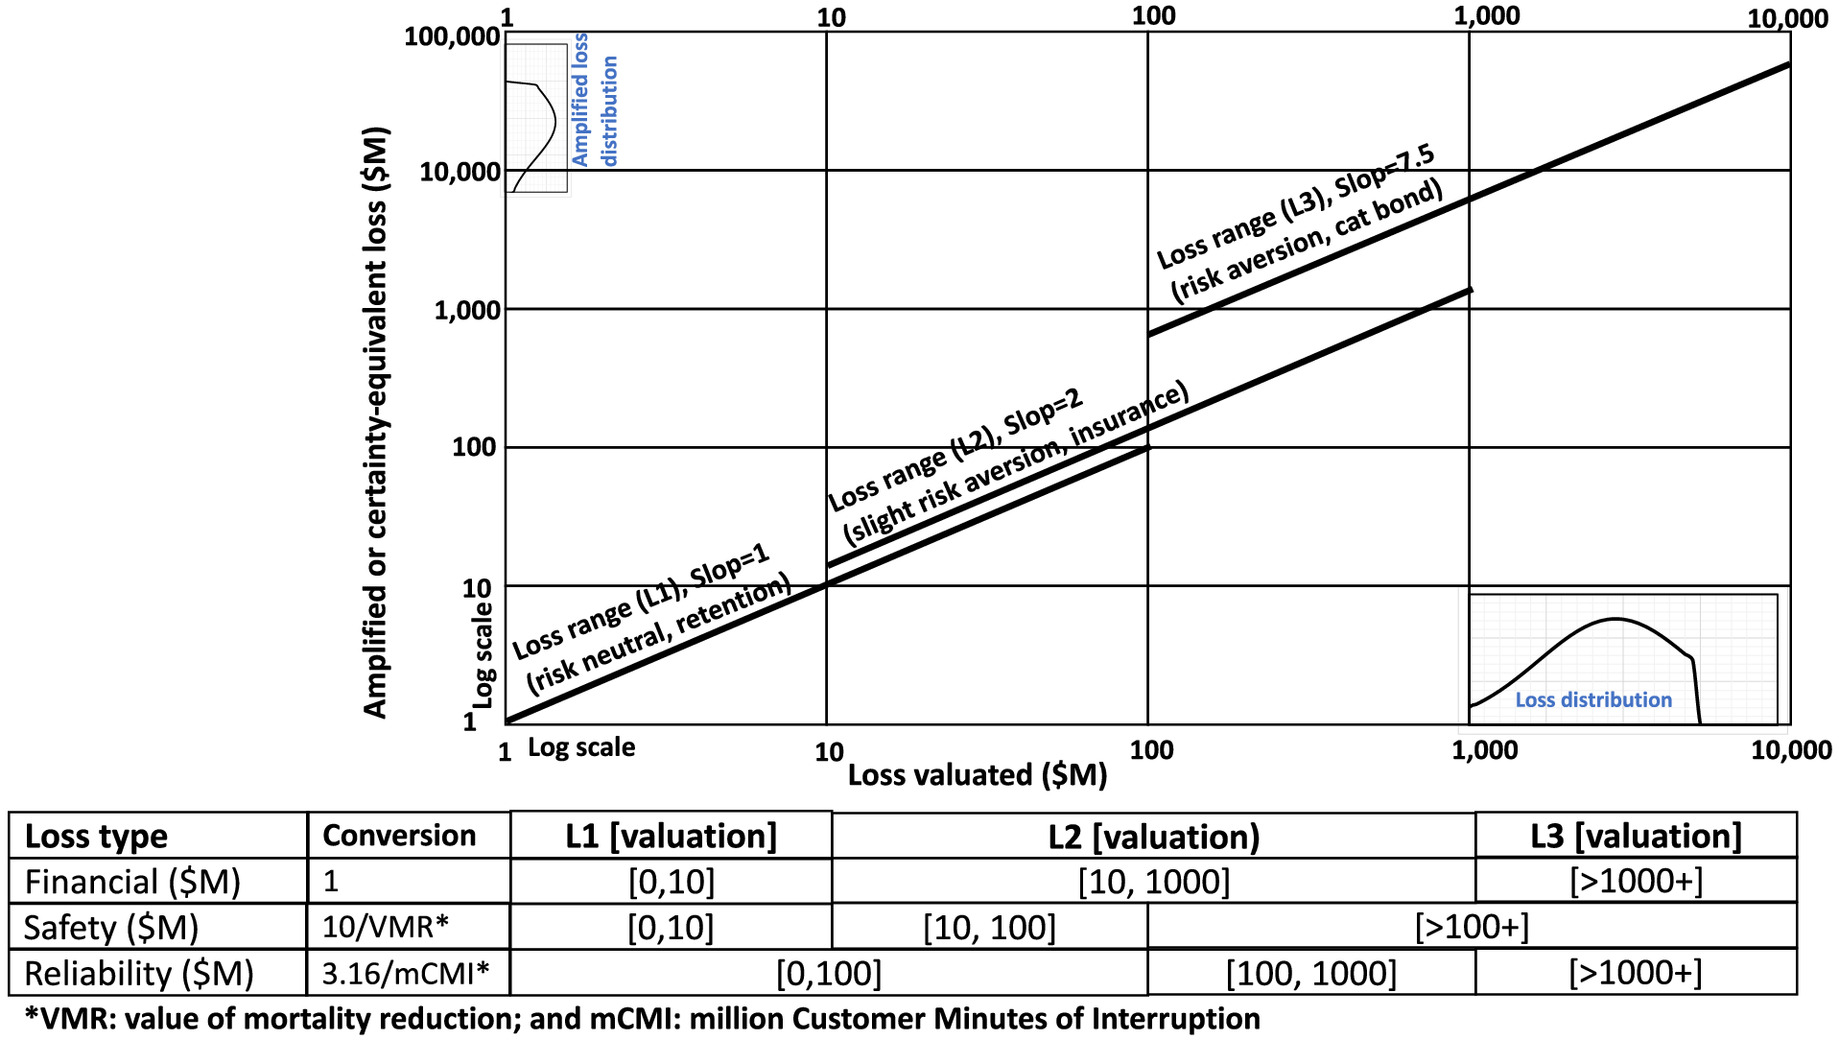
The third range () entails catastrophic losses, perhaps exceeding US $1 billion. CAT bonds and other types of insurance-linked securities (ILS) offer a market-based approach for economic valuation for obtaining a certainty-equivalent valuation. Upon amplifying a loss or a benefit to reflect aversion as determined by an appropriate corresponding market, the amplified value can be treated as an expected value with the underlying uncertainty in the loss or benefit removed, i.e., producing a respective certainty-equivalent valuation per OMB (2023), as illustrated in Fig. 11. The values in the figure are for illustration purposes and not necessarily reflect preferences and attitudes of IOUs.
CAT bond prices compared with the expected loss provide the cost of transferring catastrophic risks, but still can underestimate of the cost of risk transfer due to a limited coverage and transaction cost (e.g., ARTEMIS 2023). Of particular interest are wildfire CAT bonds sponsored by utilities. CAT bond risks and returns can be used to compute ratios in a similar manner to the treatment used based on the insurance industry reported information (US Dept. of Treasury 2022). The results are summarized in Table 4.
| CAT bond product | Date issued | Attachmenta | Coverageb | Potential for loss (%)c | Coupon pricing (%)d | Price/loss ratioe |
|---|---|---|---|---|---|---|
| PG&E Cal Phoenix | August 2018 | US$1.25 billion | US$200 million | 1.01 | 7.5 | 7.5 |
| Sempra SD Re Ltd (series 2018-1) | October 2018 | US$1.326 billion | US$125 million | 0.21 | 4.0 | 19.0 |
| Sempra SD Re Ltd. (series 2020-1) | July 2020 | US$1.0 billion | US$90 million | 1.52 to 1.8 | 9.75 | 5.4 to 6.4 |
| LA DWP Power Protective Re Ltd. (series 2021-1) | December 2020 | Unavailable | US$50 million | 0.64 to 0.74 | 10.75 | 15 to 18 |
| Sempra SD Re Ltd. (series 2021-1) class B | October 2021 | US$1.21 billion | US$135 million | 1.56 to 1.85 | 9.25 | 5 to 6 |
| LA DWP Power Protective Re Ltd (series 2021-1) | October 2021 | US$125 million | US$30 million | 0.64 to 0.76 | 15 | 20 to 23 |
Source: Data from ARTEMIS (2023).
a
Attachment is the amount that triggers the loss of the investment principal.
b
Coverage is the investment principal.
c
Potential for loss is annual probability expressed as percent.
d
Coupon pricing is an annual return on investment principal that does not include the risk-free return, separately paid, on the outlaid investment principal.
e
Risk-aversion amplification factors can be informed by this ratio and other considerations related to relevance.
These ratios can be used as a basis for computing risk-aversion amplification factors for cases that are more catastrophic than property and casualty insurance, such as significant life loss. For example, a risk-aversion amplification factor of 7.5 could be used for . The risk-aversion amplification factors in this case can be informed by this ratio and any other considerations. CAT bond coupons are effectively premiums on top of risk-free interest rates. Capital outlaid by the insurer, i.e., the investor, is placed in a collateral account created for this purpose, and invested in the US Treasury money market fund, which pays risk-free interest on top of the bond coupon, i.e., the risk-free return is not included in the coupon pricing and is paid separately (Polacek 2018). For example, if the return from the collateral account is 3% and the CAT bond coupon is 7.5%, CAT bond investors receive a total return of 10.5%.
It is possible to introduce uncertainty in the amplified loss and benefit based on other markets where pricing is dynamic, such as bond prices in investment or finance. Fig. 11 shows schematically a loss probability distribution for as an example that is amplified by a factor of 7.5 to illustrate schematically an amplified loss distribution for , as indicated in the figure. Such a treatment might be suitable for loss cases associated with utilities. The overlaps and discontinuity in the risk-aversion lines can be eliminated, if needed or necessary, for particular applications by having nonoverlapping ranges, and monotonic gradual change in the amplification factors.
Conclusion
Electric and gas investor-owned utilities operate in a regulated environment and are key contributors to community wellbeing and resilience. Decisions associated with utilities and communities entail significant risks requiring a special attention to risk tolerances and attitudes. This paper set context, defined key terms, and developed an innovative approach for methodically reflecting risk tolerance and attitude in informing risk-management decisions by offering flexibility to account for preferences by stakeholders in a structured manner. The paper proposed the use of risk-aversion amplification factors in economic and trade-off studies for utilities and communities in a method easily implementable in existing practices. This approach enables consistency, transparency, and adaptability to existing decision-making cultures of utilities and communities, and associated policymaking and rule-making practices. It offers a strong basis to tie risk-aversion quantification to markets, such insurance, bonds, and policy, for calibration in order to produce and use certainty-equivalent economic valuations in benefit-cost and trade-off analyses. The method was illustrated in the context of wildfire risk management, and it provides a proposed way forward, including calibration approaches.
Data Availability Statement
All data, models, and code generated or used during the study appear in the published article.
Acknowledgments
The authors acknowledge the input of T. Brown and A. Tzamaras; and reviews by A. Maranghides, Dr. S. W. Gilbert, and T. Ibn Faiz; the guidance of R. Ito and A. Mani; and input of S. Elsibaie, C.C. Gore, and Ryan Flynn-deOnis. The financial support of Pacific Gas and Electric (PG&E), KPMG LLP, the National Institute of Standards and Technology (NIST), and BMA Engineering, Inc. is acknowledged.
Disclaimer
Statements in the paper are those of the authors and do not represent views of sponsors nor a consensus that the method constitutes the best practice. The information in the paper shall not be used without securing competent advice with respect to its suitability for any general or specific application, and assuming all liability arising from such use. The opinions, recommendations, findings, and conclusions do not necessarily reflect the views or policies of NIST or the United States Government.
References
ARTEMIS. 2023. “Catastrophe bonds, insurance linked securities, reinsurance capital & investment, risk transfer intelligence.” Accessed July 14, 2023. https://www.artemis.bm/about/.
ASTM. 2021. Standard guide for developing cost-effective community resilience strategies. ASTM E3130-21. West Conshohocken, PA: ASTM.
Ayyub, B. M. 2001. Elicitation of expert opinions for uncertainty and risks. Boca Raton, FL: Chapman & Hall.
Ayyub, B. M. 2014. Risk analysis in engineering and economics. Boca Raton, FL: Chapman & Hall.
Ayyub, B. M., and G. J. Klir. 2006. Uncertainty modeling and analysis in engineering and the sciences. Boca Raton, FL: CRC Press.
Ayyub, B. M., A. A. Pantelous, and J. Shao. 2016. “Toward resilience to nuclear accidents: Financing nuclear liabilities via catastrophe risk bonds.” ASCE-ASME J. Risk Uncertainty Eng. Syst. Part B: Mech. Eng. 2 (4): 041005. https://doi.org/10.1115/1.4033518.
Ayyub, B. M., and L. Parker. 2011. “Financing nuclear liability.” Science 334 (6062): 1494. https://doi.org/10.1126/science.334.6062.1494-a.
Boardman, A. E., D. H. Greenberg, A. R. Vining, and D. L. Weimer. 2018. Cost-benefit analysis: Concepts and practice. 5th ed. Cambridge, UK: Cambridge University Press.
Cal Fire. 2020. “California fire hazard severity zone viewer.” Accessed June 13, 2023. https://gis.data.ca.gov/datasets/789d5286736248f69c4515c04f58f414.
Charness, G., U. Gneezy, and A. Imas. 2013. “Experimental methods: Eliciting risk preferences.” J. Econ. Behav. Organ. 87 (Mar): 43–51. https://doi.org/10.1016/j.jebo.2012.12.023.
CPUC (California Public Utilities Commission). 2022. “Decision D2212027. Risk-based Decision Framework, Appendix A.” Accessed April 1, 2023. https://docs.cpuc.ca.gov/PublishedDocs/Published/G000/M500/K043/500043720.PDF.
CPUC (California Public Utilities Commission). 2023. “Risk assessment mitigation phase.” Accessed February 19, 2024. https://www.cpuc.ca.gov/Home/About-CPUC/Divisions/Safety-Policy-Division/Risk-Assessment-and-Safety-Analytics/Risk-Assessment-Mitigation-Phase.
CPUC (California Public Utilities Commission) and Boston Consulting Group. 2020. “Reducing utility-related wildfire risk.” Accessed January 3, 2023. https://energysafety.ca.gov/wp-content/uploads/docs/strategic-roadmap/final_report_wildfiremitigationstrategy_wsd.pdf.
Emerson, P. M. 2023. “Intermediate microeconomics.” Accessed July 8, 2023. https://open.oregonstate.education/intermediatemicroeconomics/.
EO (Executive Order). 1993. “Regulatory planning and review.” Presidential Documents. Accessed February 19, 2024. https://www.archives.gov/files/federal-register/executive-orders/pdf/12866.pdf.
EPA. 2022. “Climate change indicators: Wildfires.” Accessed January 3, 2023. https://www.epa.gov/climate-indicators/climate-change-indicators-wildfires.
Foerch, A. 2020. “Shutdown costs Reagan library $150,000 a week in lost revenue.” Accessed June 13, 2023. https://www.sfvbj.com/news/2020/mar/31/shutdown-costs-reagan-library-150000-week-lost-rev/.
Friedman, M. 1976. Price theory. New York: Aldine Publishing.
Gilbert, S., and B. M. Ayyub. 2016. “Models for the economics of resilience.” ASCE-ASME J. Risk Uncertainty Eng. Syst. Part A: Civ. Eng. 2 (4): 04016003. https://doi.org/10.1061/AJRUA6.0000867.
Gilbert, S. W., D. T. Butry, J. T. Helgeson, and R. E. Chapman. 2015. Community resilience economic decision guide for buildings and infrastructure systems. Gaithersburg, MD: NIST.
Haine, S. 2015. “As low as reasonably practicable (ALARP) risk-informed decision framework applied to public utility safety.” Accessed July 10, 2023. https://docs.cpuc.ca.gov/PublishedDocs/Efile/G000/M157/K359/157359431.PDF.
Helgeson, J. F., D. Webb, and P. Lavappa. 2020. EDGe$ (Economic Decision Guide Software) online tool, software. Gaithersburg, MD: NIST.
Helgeson, J. F., and P. Zhang. 2020. Economic decision guide software (EDGe$) online tutorial: Wildland-urban interface (WUI) case study. Gaithersburg, MD: NIST.
Hertwig, R., D. U. Wulff, and R. Mata. 2019. “Three gaps and what they may mean for risk preference.” Philos. Trans. R. Soc. London, Ser. B 374 (1766): 20180140. https://doi.org/10.1098/rstb.2018.0140.
Hillson, R., and R. Murry-Webster. 2016. Understanding and managing risk attitude. 2nd ed. New York: Taylor & Francis.
HSE (Health and Safety Executive). 1992. The tolerability of risk from nuclear power stations. London: HSE.
HSE (Health and Safety Executive). 2023. “ALARP at a glance.” Accessed March 5, 2023. https://www.hse.gov.uk/managing/theory/alarpglance.htm.
IAA (Institute of Actuaries of Australia). 2015. Developing the risk appetite framework of a life insurance business. Sydney, NSW, Australia: IAA.
ISO. 2009a. Risk management: Principles and guidelines. ISO 31000. Geneva: ISO.
ISO. 2009b. Risk management: Vocabulary. ISO Guide 73. Geneva: ISO.
Kahneman, D., and A. Tversky. 1979. “Prospect theory: An analysis of decision under risk.” Econometrica 47 (2): 263–292. https://doi.org/10.2307/1914185.
Kind, J., W. J. Wouter Botzen, and J. C. Aerts. 2017. “Accounting for risk aversion, income distribution and social welfare in cost-benefit analysis for flood risk management.” Wiley Interdiscip. Rev. Clim. Change 8 (2): e446. https://doi.org/10.1002/wcc.446.
OMB (Office of Management and Budget). 2023. “Circular A-4 OMB (draft for public comments) guidance to federal agencies on the development of regulatory analysis as required under Section 6(a)(3)(C) of Executive Order 12866 of September 30, 1993.” Accessed July 14, 2023. https://www.whitehouse.gov/wp-content/uploads/2023/04/DraftCircularA-4.pdf.
Polacek, A. 2018. “Catastrophe bonds: A primer and retrospective.” Accessed September 23, 2023. https://www.chicagofed.org/publications/chicago-fed-letter/2018/405.
PPD (Presidential Policy Directive). 2013. Critical infrastructure security and resilience. Washington, DC: White House.
Rodríguez Mega, E. 2019. “The battle to rebuild centuries of science after an epic inferno.” Nature 571 (7765): 312–315. https://doi.org/10.1038/d41586-019-02141-2.
Sanchez, R., and S. Chan. 2019. “Wildfire caused $500,000 in damage at Reagan Presidential Library.” Accessed June 13, 2023. https://www.cnn.com/2019/11/19/us/california-easy-fire-reagan-library-damage/index.html.
Schindler, S., and S. Pfattheicher. 2017. “The frame of the game: Loss-framing increases dishonest behavior.” J. Exp. Soc. Psychol. 69 (Mar): 172–177. https://doi.org/10.1016/j.jesp.2016.09.009.
Shao, J., A. A. Pantelous, B. M. Ayyub, S. Chan, and S. Nadarajah. 2017. “Nuclear catastrophe risk bonds in a Markov-dependent environment.” ASCE-ASME J. Risk Uncertainty Eng. Syst. Part A: Civ. Eng. 3 (4): 04017018. https://doi.org/10.1061/AJRUA6.0000923.
Siemens. 2015. “Fire protection in historical buildings and museums.” Accessed June 13, 2023. https://www.downloads.siemens.com/download-center/Download.aspx?pos=download&fct=getasset&id1=A6V10562738.
Tengs, T. O., M. E. Adams, J. S. Pliskin, D. G. Safran, J. E. Siegel, M. C. Weinstein, and J. D. Graham. 1995. “Five-hundred life-saving interventions and their cost-effectiveness.” Risk Anal. 15 (3): 369–390. https://doi.org/10.1111/j.1539-6924.1995.tb00330.x.
Thomas, D. S., D. T. Butry, S. W. Gilbert, D. H. Webb, and J. H. Fung. 2017. The costs and losses of wildfires. Gaithersburg, MD: NIST. https://doi.org/10.6028/NIST.SP.1215.
TRB (Transportation Research Board). 2018. Designing safety regulations for high-hazard industries. Washington, DC: TRB.
US Department of Treasury. 2022. Annual report on the insurance industry. Washington, DC: US Department of Treasury.
US Supreme Court. 1980. “Indus. Union Dept. v. Amer. Petroleum Inst., 448 U.S. 607 (1980).” Industrial Union Department, AFL-CIO v. American Petroleum Institute, No. 78-911. Accessed February 19, 2024. https://supreme.justia.com/cases/federal/us/448/607/.
Varian, H. 1992. Microeconomic analysis. New York: W.W. Norton.
Information & Authors
Information
Published In
ASCE-ASME Journal of Risk and Uncertainty in Engineering Systems, Part A: Civil Engineering
Volume 10 • Issue 2 • June 2024
Copyright
This work is made available under the terms of the Creative Commons Attribution 4.0 International license, https://creativecommons.org/licenses/by/4.0/.
History
Received: Oct 12, 2023
Accepted: Dec 13, 2023
Published online: Mar 9, 2024
Published in print: Jun 1, 2024
Discussion open until: Aug 9, 2024
Authors
Metrics & Citations
Metrics
Citations
Download citation
If you have the appropriate software installed, you can download article citation data to the citation manager of your choice. Simply select your manager software from the list below and click Download.