Survey of the Socioeconomic and Environmental Impact of
Publication: Journal of Environmental Engineering
Volume 150, Issue 8
Abstract
Sustainable remediation demonstrates that the benefit of undertaking remediation is more significant than its impact, and the optimum remediation solution is selected through a balanced decision-making process. Assessing sustainable remediation is site and project-specific and is strongly multifactorial across a wide range of categories, which may or may not be readily quantifiable. The applied socio-economic survey framework is based on the 2020 SuRF-UK guidance. The assessment was carried out in three steps. A small core team, an interim evaluation by the project of all beneficiaries, and a final assessment including the views of a broad range of external stakeholders developed an initial “pilot” sustainability assessment. The sustainability assessment process compared options across 45 individual criteria in 15 overarching “headline” categories: environmental, social, and economic. Members selected suitable criteria and the individual rankings of the project consortium from research, service providers and the site owner. The assessments compared with the wastewater treatment plant (WWTP) and no-intervention scenario. outranked the use of WWTP, and both performed significantly better than the no-intervention scenario. The quantitative data from LCA confirmed the results devoted to environmental impact.
Practical Applications
Remediation of contaminated sites is site-specific, and each site requires a specific targeted approach that should take into account not only the environmental benefits of the measures but also economic and social aspects. In the case of water contaminated with hexachlorocyclohexane (HCH) substances, there are various methods of dealing with it, ranging from removal and relocation to a secure site-to-site encapsulation to various methods of contaminated water treatment. In the case of mega-sites, the solution often reduces to water treatment, as other solutions are not acceptable, especially economically, but also environmentally (transporting large volumes of materials) and socially (large construction and material handling). The present paper gives guidance on the selection of the most accepted water treatment option from a sustainability point of view. A three-step process based on a multiparametric assessment shows how the subjective approach of technologists, activists, or the public can be eliminated. The paper shows that a wetland-based solution is accepted significantly more than a WWTP or a no-action scenario. The approach will be further applied to similar localities with HCH contamination but can be generalized to a much broader set of contaminated sites.
Introduction
LIFEPOPWAT, the EU LIFE project, focuses on treating hexachlorocyclohexane (HCH)-contaminated water by an innovative technology based on constructed wetlands. The worldwide volume of wasted HCH pesticides exceeded 250,000 tons in 2007 in about 300 sites, including 40 mega-sites (IHPA). Most sites must be more properly protected, and contaminated water enters the surrounding environment. Various systems were constructed to preserve downgradient soil and water bodies such as impermeable containments, covered walls, or underground pumping systems. In most cases, the sites need additional drainage to collect HCH leakages and subsequent treatment of collected contaminated water. Such a system is often based on chemical processes in the wastewater treatment plant (WWTP). A substantial HCH waste deposit exists in Hajek in the Czech Republic, where lindane production wastes were deposited in the spoil heaps of a uranium mine. The drainage channel from this deposit carries HCH isomers and chlorinated benzenes and impacts local soils and waterways. That is why there has been a consequent regulatory demand for action. Removal of the source term (the waste deposit) is not feasible for multiple reasons, including the scale of environmental impacts of such an exercise, the unavailability of waste treatment taking into account the nature of the spoil deposits the HCH wastes are mixed with, and the enormous cost. Therefore, risk mitigation is practicable only by managing the pathway (i.e., the waterborne contamination).
The LIFEPOPWAT project implemented a full-scale low-input treatment solution for this drainage water using an integrated in situ pretreatment and nature-based treatment system of constructed wetlands, referred to as . The claim for is that it is more “sustainable” than the conventional WWTP alternative, based on filtration and stripping with granular activated carbon. LIFEPOPWAT explored this claim by benchmarking the site-specific implementation of at Hajek against a theoretical WWTP implementation and a no-intervention scenario (as a status quo situation). The assessment was carried out using a tool from sustainable remediation, complying with the 2017 International Standard [ISO 18504:2017 (ISO 2017)]. The objectives of the paper are to (1) present this benchmarking of the system against WWTP and no intervention as a case study of qualitative sustainable remediation assessment; (2) show how assessment outcomes evolved over different phases of consultation with an expanding constituency of stakeholders; and (3) describe the relative sustainability gains that delivers found from this comparison.
Sustainability assessment case studies for contaminated sites have been relatively few (Sweeney et al. 2023). A recent set of case studies for the European industry network CONCAWE has been produced. However, all of these have been based on a relatively limited amount of stakeholder engagement, mainly to the core teams around projects (consultants, site managers, and sometimes regulators). What makes this Hajek case study more or less unique is its incremental development across a widening constituency of stakeholders and its documenting of how this changed assessment outcomes.
Good practice is for contaminated site management decisions to be based on risk assessment, and this has been the case for many years (Vegter et al. 2002). Risk mitigation is based on breaking the linkages between source, pathway, and receptor that give rise to risks, in the case of Hajek managing the pathway. Since the mid-2000s, interest has grown in demonstrating that this risk management is in itself sustainable so that the approach selected is the one that achieves the most significant net benefit across a wide range of environmental, social, and economic criteria (Bardos et al. 2020; Braun et al. 2020, Smith 2019; Favara et al. 2019; Gurdon et al. 2021). Sustainability assessment compares remedial alternatives based on their aggregate net benefit as part of a balanced decision-making process (Smith et al. 2022).
One of the earliest sustainability-based assessments was the REC method, developed in the Netherlands in the early 1990s (Cappuyns and Kessen 2014). In REC, three indices are derived: one for risk reduction, one for cost, and one for “environmental merit.” Environmental merit aggregates several environmental benefits (e.g., clean soil and water and waste production). The best remedial scenario is selected based on the combination of risk, environmental merit, and cost indices.
Since then, a more holistic approach has been developed by multiple networks around the world (Braun et al. 2019; Rizzo et al. 2016), often called Sustainable Remediation Forum, e.g., SuRF-UK, SURF-Japan. This has been codified in the descriptive standard ISO18504:2017. As for risk assessment, a tiered approach is recommended for sustainability assessment to ensure that decision costs are not excessive. Sustainability assessment can start with simple qualitative comparisons, for example, using rankings and moving to semiquantitative methods if the qualitative outcome is unclear. It only needs to move to quantitative methods when semiquantitative methods, such as multicriteria analysis (MCA), do not yield a clear result or support specific comparisons, such as carbon burdens (Smith et al. 2022). The sustainable remediation approach is based on the concept of sustainability set out in the 1987 Brundtland Report (Brundtland 1987) and subsequent UN Sustainable Development Goals or SDGs (United Nations Department of Economic and Social Affairs 2015) and is now described in the international standard on Sustainable Remediation ISO 18504:2017. The method is widely applied (e.g., Gill et al. 2016; Hou et al. 2014; Hu et al. 2022). Table 1 provides some examples of the different methods that have been used.
| Method | Description |
|---|---|
| Müller (2014) | The methodology was used, e.g., to assess the sustainability of remediation measures on an industrial site, where various approaches were compared. It shows that construction and operation steps are essential, but a realistic estimate of the operational time can imply the results. |
| Bayer and Finkel (2006) | The Monte Carlo uncertainty analysis of the emission and consumption data for various possible technological variants. Although broad uncertainty ranges of up to 50 % were assumed for the data, clear trends could be observed and recommendations derived. |
| Da S Trentin et al. (2019) | Quantitative Assessment of the Life Cycle Sustainability framework (QUALICS), which combines the Integrated Value Model for Sustainable Assessment (MIVES) and Analytic Hierarchy Process (AHP). Using the AHP method allows the stakeholders to participate in the decision-making process by weighing the requirements, criteria, and indicators that form the decision tree. |
| Harwell et al. (2021) | The method recommended by the US EPA to enhance remediation and redevelopment processes. The activities for case study applications are presented in four phases: (1) identify site-specific E.S.; (2) quantify relevant E.S.; (3) examine how cleanup activities affect E.S.; and (4) identify, select, and implement solutions. |
| Favara et al. (2016) | The best management practices (BMPs) method applied the sustainable remediation method to compare several in situ and ex-situ technologies. |
| Song et al. (2018) | LCA was used to evaluate environmental impacts, and the results were combined with social and economic appraisal via MCA. Although the best remedial scenario was selected, the socioeconomic scores were limited by a lack of public engagement. The method was applied for a “mega-site” remediation in China. The case study results have shown that the indicator set is valid worldwide. |
| Cappuyns (2016) | The sustainability of site remediation should be tuned to the legislation, guidelines, and procedures in force in a specific country or region. |
| Huang et al. (2016) | A spreadsheet evaluation tool on a site contaminated by petroleum hydrocarbons (TPHs). The study evaluated five core elements of green and sustainable remediation (GSR): energy, air, water resources, materials and wastes, and land and ecosystem. |
| Li et al. (2022) | The remediation options and the decision-making processes were optimized based on enhancing information between stakeholders. Seventeen decision sensitivity parameters were analyzed, and their influence on the management patterns of contaminated sites was identified using artificial intelligence technology to predict strategy-based decision-making for contaminated site management. Long-term monitoring, the type of land reuse, and ex-situ performance are the most essential factors in determining the field implementation of cleanup activities. |
| Hu et al. (2022) | The input–output LCA method quantified environmental and economic impacts. The impacts are evaluated along with other suitability considerations, presented in 32 indicators under 10 criteria, by practitioners through a questionnaire survey. The (LCA)-fuzzy synthetic evaluation showed that the economic, technical, and environmental impact considerations are the top three essential criteria. |
| Naseri-Rad et al. (2022) | A dynamic framework for promoting sustainable remediation realized in the decision support system, which enables quicker evaluation of various scenarios. |
| Norrman et al. (2020) | A questionnaire was used to collect input from residents regarding local acceptance and economic externalities of the remediation alternatives. Alternatives with a high degree of contaminant removal received a high ranking in the assessment, primarily due to social and economic effects. |
The comparison at Hajek used qualitative sustainability assessment based on rankings for several reasons: (1) it allowed the widest range of criteria to be considered, including many not readily quantifiable; and (2) it was the most inclusive approach, particularly for nonexpert stakeholders as no knowledge of methods such as LCA or complicated mathematics with scores and weighting was used. The approach used was based on guidance provided by SuRF-UK (CL:AIRE 2020a, b) because SuRF-UK was available in the most detailed procedural guidance, which also had the most well-advanced (and broadest) checklist of potential sustainability criteria (Bardos et al. 2018). In addition, the SuRF-UK guidance had the broadest track record of international use (Sweeney et al. 2023) and is well adopted in its national contaminated sites regulatory framework, demonstrating its practicability.
Methodology
Site Description
The Hajek site is located in Western Bohemia (the Czech Republic) near the Karlovy Vary spa. Uranium mining occurred here between 1965 and 1971, during which a tailings impoundment was created. Following the cessation of uranium mining, the mining of kaolin, basalt, and later bentonite began in the foreground of the open pit. In total, 200 tons of uranium, of kaolin, of basalt, and of bentonite were mined (Brucek 2013). In 1966–1968, according to the decision of the state authorities, about 3,000–5,000 tons of residual ballast isomers of HCH and chlorinated benzenes (hereafter CB) from the production of lindane (-HCH) from the Spolana chemical plant (Neratovice, Czech Republic) were loaded into the Hajek quarry spoil heap. The waste was stored in paper containers, metal drums, or loose in different dump locations without security. In 1977, the stored chemicals were exposed by a landslide on the dump. The landslide remediation was carried out by establishing a gravity bench into which a drainage system was incorporated. Concentrations of CB and HCH isomers were documented and monitored in the outflow from the drainage system until January 1989. Czech Government Regulation No. 57/2016 Coll. sets out indicators of the permissible pollution level of surface waters by discharged wastewater, particularly wastewater and mine water, so that surface waters are polluted only to a tolerable extent (immission indicators). It also sets out the maximum permissible pollution level in discharged waters (emission indicators), but specific data are given only for the more common discharged waters. Immission limit values for some specific organic substances, including HCH, are further presented in the Methodological Guidance of the Water Protection Department of the Ministry of the Environment of the Czech Republic.
Since about the beginning of the century, the average content of HCH and ClB has been about and , respectively, and the mass flux has been approximately 25 g HCH and 150 g ClB per day. The contaminated drainage water flowed via the Ostrovsky brook to the Hajek preserve and the adjacent breeding ponds Horni Stit and Dolni Stit. A sampling of boreholes drilled in 1994 showed that groundwater contamination with organic substances had already exceeded the contour of the spoil heap and was spreading mainly toward the flooded Hajek quarry. Between 1999 and 2002, remediation works were carried out by DIAMO, a.s. (installation of sealing and covering elements, biological reclamation of the entire Hajek mining area, creation of a protective ditch). A pilot remediation system was built at the site as part of the remediation of contaminated tailings (Brucek 2023), which formed the basis of the technology reported here.
Treatment Alternative
Constructed wetlands (CW) have become an eco-friendly technology for easy operation and maintenance (Patyal et al. 2023). In addition to the pollutant removal processes, the combined environmental, economic, and social sustainability system is deeply discussed (Fernández Del Castillo et al. 2022). The system advantages are simple and low-cost construction, low operational and maintenance requirements, minimum energy consumption, reduced land occupation, and low emissions.
Lakho et al. (2022) compared two decentralized (waste) water treatment technologies (DWTS) based on a mobile-constructed wetland and a vertical flow-constructed wetland with conventional treatment technologies. They found that wetland-based systems had roughly an order of magnitude lower impact than their conventional alternatives. Similarly, a comparative LCA of four WWT methods, namely the activated sludge process, sequential batch reactor, constructed wetlands, and up-flow anaerobic sludge blanket using the IMPACT 2002+ approach and SimaPro 9.1 software showed that the sequential batch reactor has the highest environmental effects (Patel and Singh 2022). García-Herrero et al. (2022) assessed the sustainability of two typologies of constructed wetlands in two Italian areas: Sicily, with a vertical subsurface flow constructed wetland, and Emilia Romagna, with a surface flow constructed wetland. Both constructed wetlands bring more benefits than costs.
The technology for the treatment of water containing HCH substances, developed by the Technical University of Liberec and AQUATEST a.s., is based on the use of oxidation-reduction and biosorption processes. The technology comprises a sedimentation tank, a permeable reactive barrier filled with Fe chips, a bioreduction and biosorption unit, and an aerobic wetland (Fig. 1). In September 2021, the full-size system was commissioned on an area of . Since then, it has been running in test mode, where the efficiency of each stage is gradually improving. The wetland plants are growing, and the contribution of the wetland remediation step to the overall contaminant removal is increasing. The input to the system is drainage water with a flow of and HCH and ClB concentrations of and , respectively. During the first 14 months of operation, due to the system’s tuning, the contaminant removal efficiency gradually increased to almost 100% for ClB and 97% for HCH. Nowadays, the operation of the led to a significant decrease in HCH mass discharge to the Ostrovsky Creek from an initial to . The project also assumes regular maintenance of the system, including the eventual replacement of the iron chips in the permeable reactive barrier; however, the whole technology is without further input, and no waste is generated during regular operation.

Alternative Method of Waste Removal
As can be seen from the above brief overview of the situation at the Hajek site, it is not possible to locate the contaminated areas within the Hajek quarry tailings. Detailed exploratory work would be required to locate the contaminated area precisely, and, even then, the chances of removing all sources of contamination are minimal. The complete disposal of contaminants in the tailings body would involve processing at least several tens of thousands of tons of soil. Even then, the sources of HCH and CB would not be eliminated, because, during the last few decades, the contaminated water was spread in the more considerable repository volume. Moreover, once the detected contaminated sediments are excavated, they must either be redeposited in another secure landfill or cleaned up. Thermal desorption, catalytic oxidation, or soil washing can be considered as possible methods for cleaning HCH-contaminated sediments. At the cost of current soil decontamination technologies, which are in the order of several hundred € per tons of soil, the cost of soil decontamination can be estimated at several tens of millions of .
The estimated costs relate only to removing contamination in the soils and do not include complete remediation of the site, which would include the precise delineation of the contaminated areas, their exposure, and the subsequent reshaping of the tailings. This would increase the cost of a full remediation by an order of magnitude. Therefore, removing the contaminants was not considered an alternative for site remediation or considered in the socio-economic survey.
Conventional WWTP Treatment Alternative
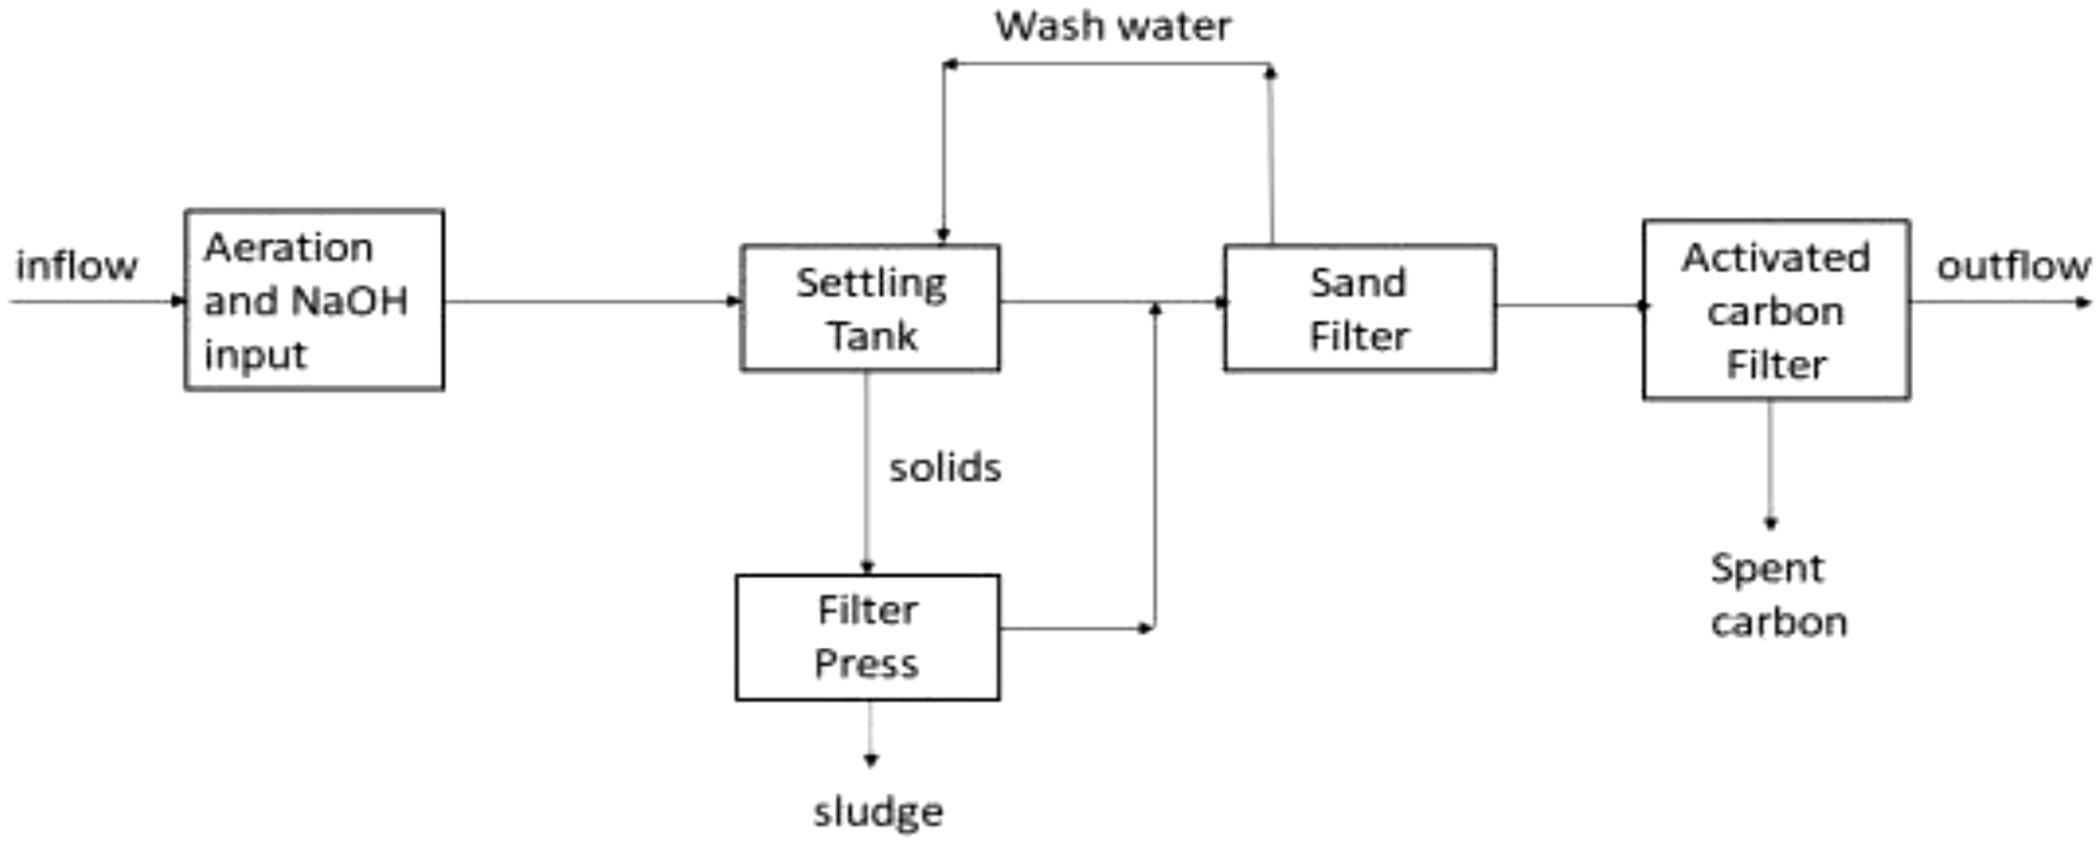
Another option is to build a wastewater treatment plant directly on the Hajek site for long-term treatment of drainage water (Fig. 2). As these are persistent organic contaminants, methods for their disposal are limited. The method considered here is based on pH adjustment separation and sorption of dissolved contaminants on activated carbon. The disadvantage of this method is the high consumption of this sorbent, which has to be subsequently deposited as a contaminant. The capacity of such a wastewater treatment plant would be at the level of the long-term average outflow of this water, which is about , i.e., . With an expected residence time of about 1 day, this is a relatively large technology. The initial estimate for the construction of such a plant is about . However, this cost is not significant in terms of overall costs, as its long-term operation would be considerably more financially demanding. Only the chemical, electricity, and waste transport can be estimated at about of treated water, which makes . Additional costs are the operational costs and maintenance at about .
No-Intervention Scenario Treatment Alternative
The third scenario considered for the socio-economic survey is the no-intervention scenario. This scenario is not acceptable to the owner of the site (DIAMO s.p.) as well as to the supervising state authorities because the present HCH contamination in the Ostrovsky Creek exceeds the environmental limit by many orders of magnitude, and the authorities insist on appropriate reduction of the contaminant concentrations. Its inclusion in the scenarios is due to the assessment of the two above-mentioned scenarios ( and WWTP) against the status quo (no-intervention scenario). The regulatory demand precludes no intervention being an acceptable solution in practice. However, it was included as a treatment alternative in the sustainability assessment for several reasons:
•
To provide a baseline for comparisons, especially for the later conversations with nonspecialist stakeholders: “Are the solutions better or worse than the status quo.”
•
To provide recognition that any intervention may have an impact for some sustainability criteria (for example, in terms of resource and energy use).
•
To ensure that the question of “net sustainability loss or gain” from the starting condition was properly addressed.
Sustainability Assessment Methodology
The SuRF-UK CL:AIRE (2020a, b) guidance provides a detailed process for qualitative assessment of the sustainability of contamination management alternatives. SuRF-UK provides an assessment checklist of 73 indicators across 15 broad categories around three basic elements of sustainability (environment, society, and economy). Assessing sustainable remediation is site and project-specific and is strongly multifactorial across a wide range of these categories, which may or may not be readily quantifiable (Table 2). Some outcomes are technique-related but also strongly related to the site or specific factors, for example, carbon sequestration versus carbon emissions (e.g., as a part of ENV1: emissions to air). Hence, single metrics such as a carbon footprint are inevitably highly reductive and do not represent “sustainability” in a holistic or overall way (Laurent et al. 2012). For this reason, SuRF-UK recommends taking a tiered approach to sustainability assessment for remediation, beginning with a qualitative stage that enables the most wide-ranging scope of sustainability to be considered with a more readily manageable degree of effort. Detailed assessments are only needed in this tiered approach, where a more straightforward approach cannot yield clear decision support.
| Environmental | Social | Economic |
|---|---|---|
| ENV1: Emissions to air | SOC1: Human health and safety | ECON1: Direct economic costs and benefits |
| ENV2: Soil and ground conditions | SOC2: Ethics and equity | ECON2: Indirect economic costs and benefits |
| ENV3: Ground- and surface water | SOC3: Neighborhoods and locality | ECON3: Employment and employment capital |
| ENV4: Ecology | SOC4: Communities involvement | ECON4: Induced economic costs and benefits |
| ENV5: Natural resources and water | SOC5: Uncertainty and evidence | ECON5: Project lifespan and flexibility |
The assessment has three stages: preparation, definition (Table 3), and execution. The preparation stage sets out the rationale for the assessment, the project or site being considered, the scenarios being compared, any opportunities and constraints that may apply, who will be consulted and when, and how the assessment will be reported and communicated. The definition stage summarizes and formats the preparation work as a series of objectives for the assessment and then goes further to set careful boundaries for the work, how the comparison will be made, and how uncertainties will be dealt with. The execution stage applies the framing developed during preparation and definition to a sustainability assessment. The framing is specific to each site/project.
| Framing step | Activities/site conditions |
|---|---|
| Preparation stage | |
| Describe the requirement | The LIFEPOPWAT hypothesis to be tested is that has sustainability benefits compared to the other remedial technologies. |
| Describe the project | The technology will be compared with WWTP and no intervention using sustainability assessment. |
| Describe constraints | • The slag heap Hajek is not in operation, it was stabilized and recovered. |
| • The site is poorly accessible, which limits the construction of a containment or barrier. | |
| • The HCH contamination is spread in a large volume of slag, and it is not feasible to extract, separate and dispose of it again. | |
| • The outflow of contaminated water is well-defined by a drainage system. | |
| • All of the environmental risks are related to drainage water and subsequent surface water. | |
| • The flow of drainage water is stable, and no flooding and other extremes are expected. | |
| Consider reporting and dialogue | In the assessment the project beneficiaries and local external stakeholders (see below) will be involved. |
| Definition stage | |
| Objectives | The assessment will be performed in three separate phases: |
| Phase 1: an initial sustainability assessment being developed by a small core tea (for Hajek site the project principal investigator, an SEI expert, and an expert on water treatment); | |
| Phase 2: an interim assessment by the project of all beneficiaries; and | |
| Phase 3: a final assessment by a broad range of external scope/indicators. | |
| Boundaries | The system boundary: The only feasible remediation methods are considered (e.g., excavation and replacement of the materials or making a compartment are not). |
| The “life-cycle” boundary: The assessment is divided into two steps—the construction of the technology and its long-term operation (up to 20 years, even though the outflow of contaminated water will be permanent for a much longer period). | |
| The spatial boundary: Due to the effect on the water system, the environmental effect is limited to surrounding of the Ostrovsky Creek in a length of about 1 km. | |
| Scope/indicators | All SuRF-UK categories will be assessed and the relevant ones will be selected in each phase. |
| Methodology | Used rankings, 1 = best, then 2, then 3 = worst. No scores or weightings will be used. |
| Individual rankings will be made for each indicator and averaged for the headline category they are in. Averaged rankings will be shown in radar plots. The smaller the area in the radar plot the higher (i.e., better) the overall ranking. One radar plot each for environmental, social, and economic elements of sustainability. | |
| Dealing with uncertainty | Sources of uncertainty might be connected with available information quality, and also with differences in opinion between stakeholders. The real data about environmental problems, economic indicators, and social issues will be provided to all stakeholders. |
The sustainability assessment process was also iteratively carried across three phases:
1.
implementation team for Hajek.
2.
Full LIFEPOPWAT project team.
3.
External stakeholders.
The policy for selecting external stakeholders was to be as inclusive as possible, and, initially, a broad classification was used (local communities, regulators, and users of the impacted area, such as hunters and anglers). Individuals within these categories were identified on the basis of site owner contacts in the local area, municipality, and region. Phase 1 and 2 sustainability assessment work was carried out in English using guided conversations supported by a facilitator experienced in SuRF-UK sustainability assessment contracted to TUL. The conversations were aligned with an on-screen spreadsheet that followed the framing process and then ranked the three treatment alternatives for the sustainability criteria agreed as relevant for the site problem during the framing. The ranking was on the basis 1 best to 3 worst. Each ranking was supported by lines of evidence also recorded in the spreadsheet. Where rankings were tied, they were given the same index, but the next ranking would be recorded at the next available position, e.g., 1,1,3. The spreadsheet aggregated the rankings, recording an average ranking for each of the 15 headline categories. Consultees at Phase 2 reviewed and amended both the framing and rankings of Phase 1.
A different approach was used to engage with the external stakeholders. The Phase 2 outcomes were simplified, to provide a single ranking for each category and a commentary on the rationale for this ranking (based on the lines of evidence), which was translated into the local language (Czech). A series of simple questions were asked:
•
Do you think we missed any key considerations in this category? If so, what?
•
Do you agree with the ranking? If not, why and how would you change it?
A marketing Ph.D. student then approached each of the external stakeholder groups in turn on a bilateral basis with the ranking, commentary, and questions. The results of the conversation were then recorded in Czech. At the close of this engagement process, the conversations were summarized in English for the facilitator. The facilitator then mapped the opinions received into the sustainability assessment Phase 2 spreadsheet to make the final assessment rankings. The mapping was based on the majority opinion of the external stakeholders, and dissenting opinions were also recorded.
Results and Discussion
Phase 1
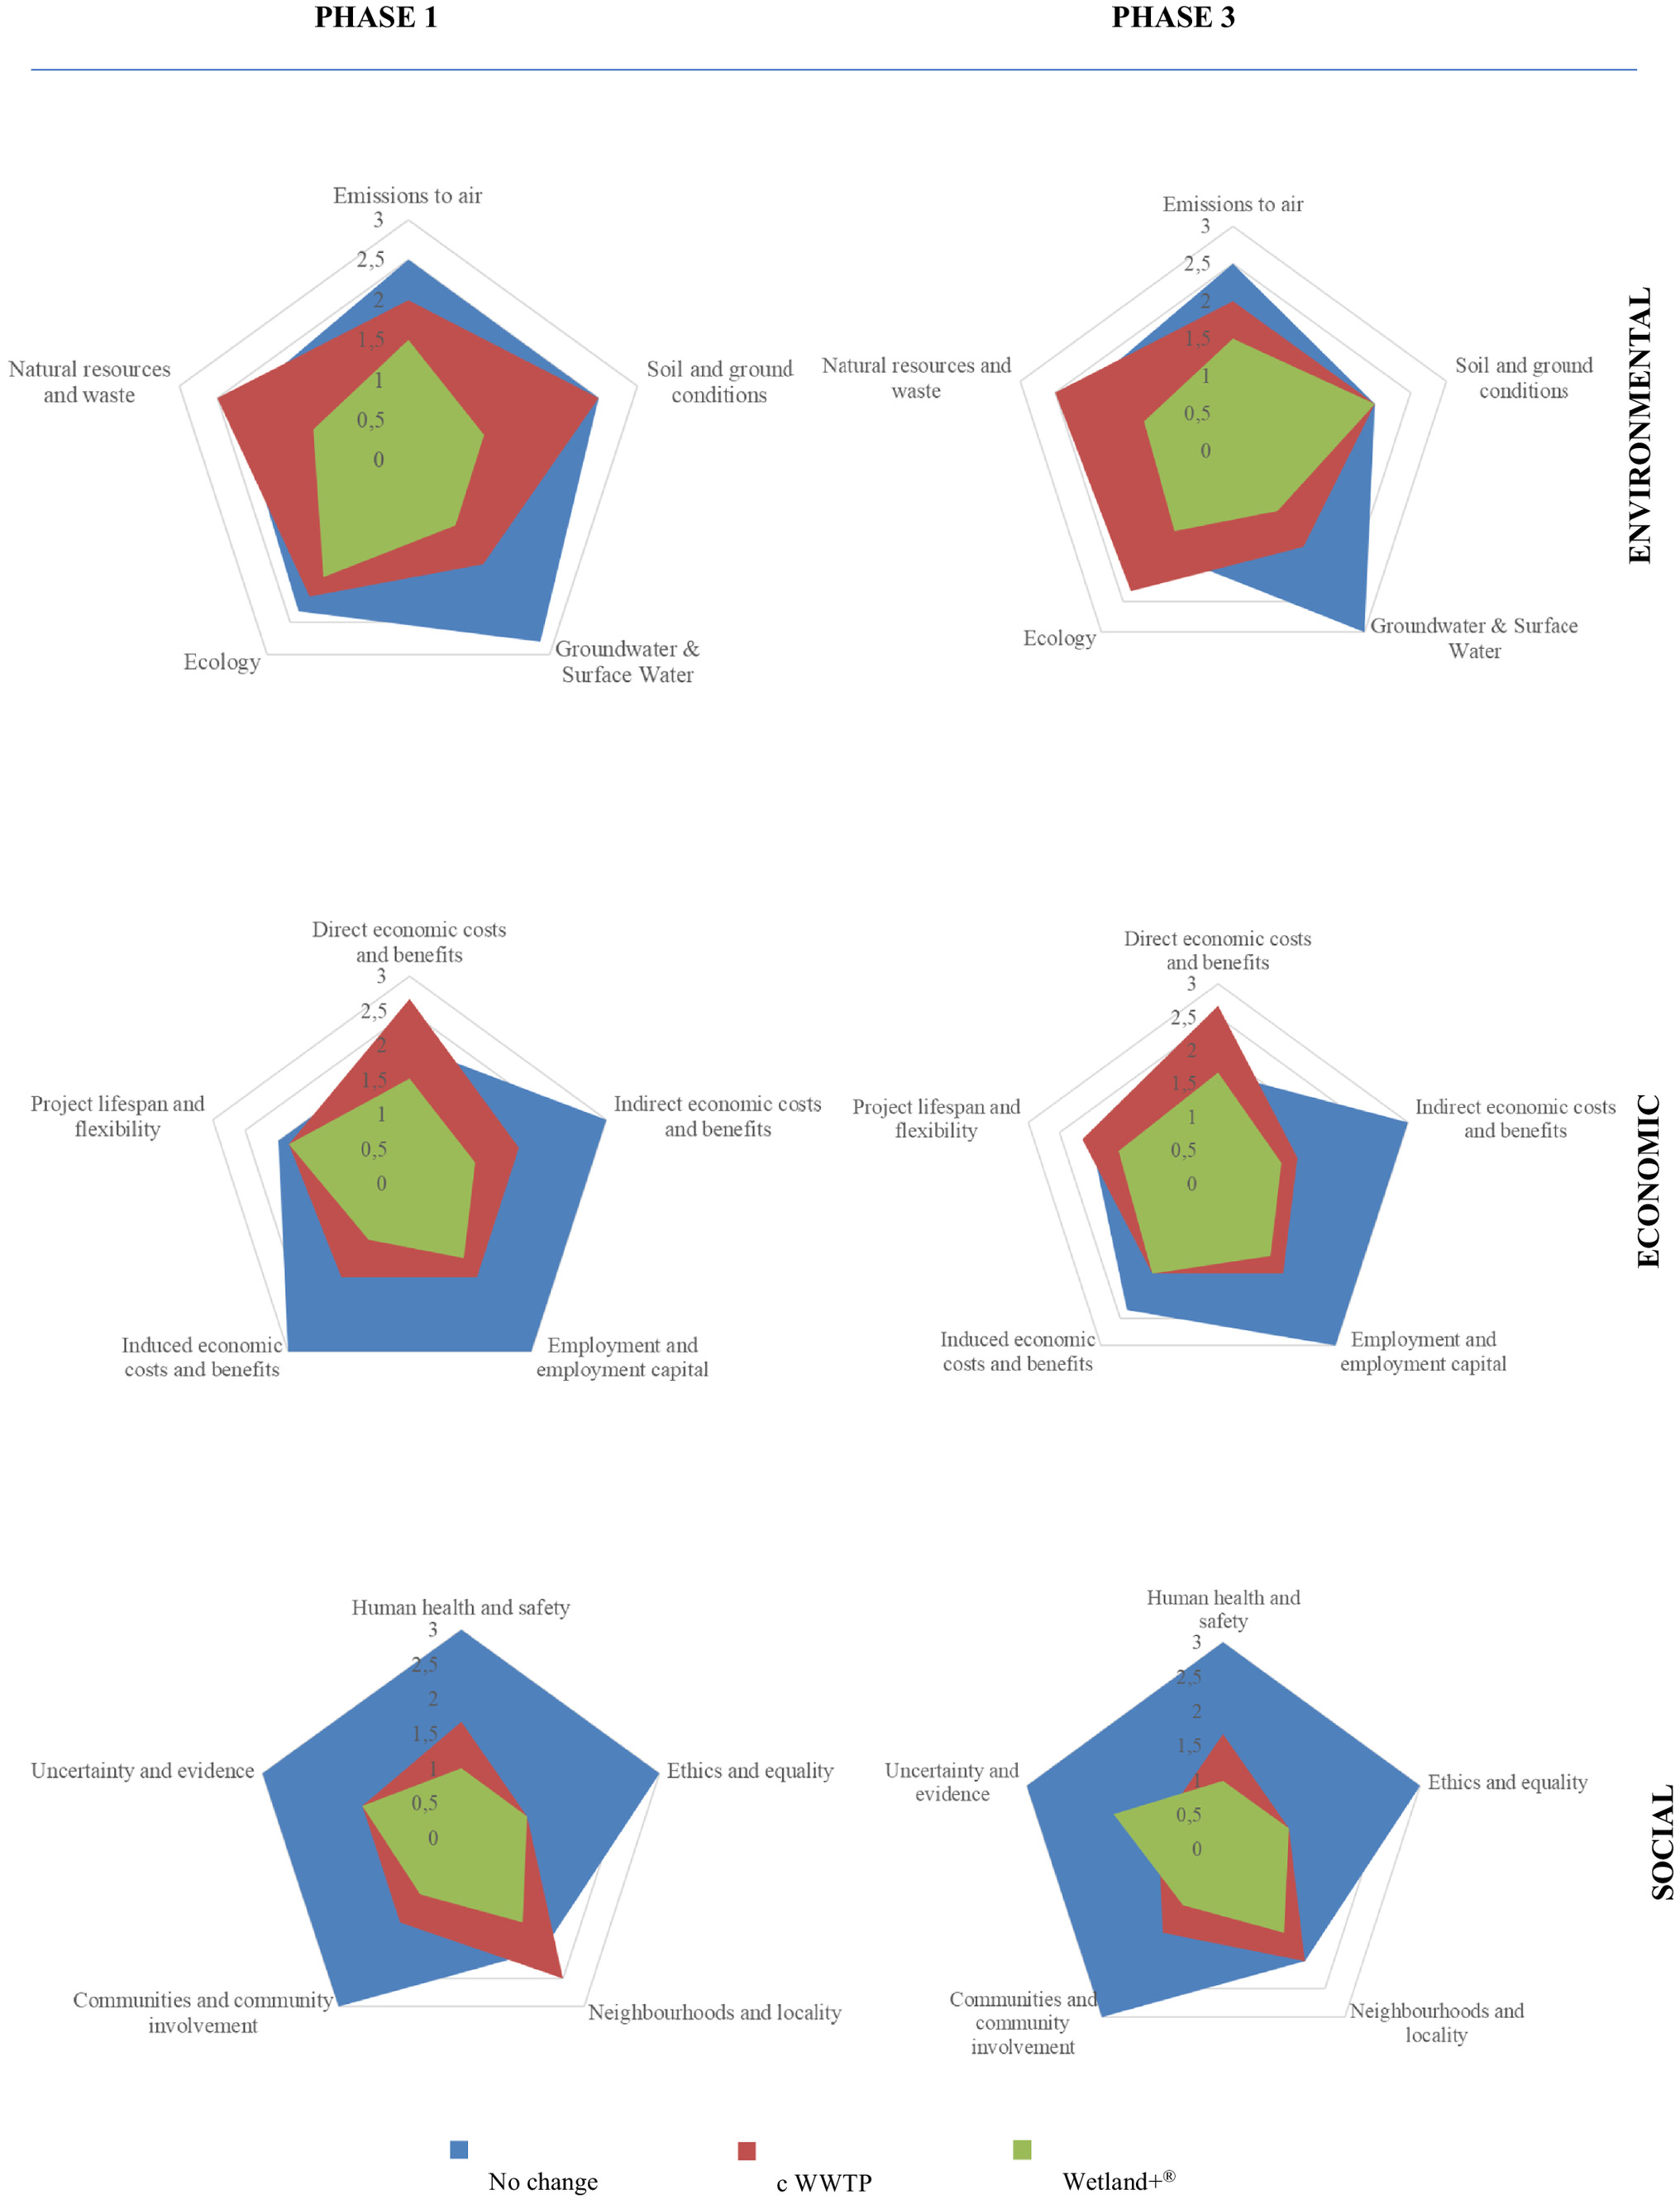
According to the methodology used, a process for determining the socio-economic impact is based on a survey, where the questions cover 15 broad socio-economic categories (five for each part of the survey). In the initial assessment provided by the core of the LIFEPOPWAT team, out of a total of 73 criteria, 45 criteria were identified as relevant (15 from the Environment, 19 from the Economic, and 11 from the Social categories). For the selected relevant criteria, the three above-mentioned scenarios were compared comprehensively—regarding the construction, operation, and dismantling phases. The ranked answers were summarized in the categories (Table 4) and plotted as radar graphs in Fig. 3. In this initial qualitative assessment, outranked the use of conventional WWTP for most of the 15 general categories defined in Table 2 and shown in Fig. 3 (left side), and, where it did not outrank, the ranking was very similar. The detailed results for the categories are described below.
| Category | Phase 1 | Phase 2 | Phase 3 | ||||||
|---|---|---|---|---|---|---|---|---|---|
| No | cWWTP | W+ | No | cWWTP | W+ | No | cWWTP | W+ | |
| Environmental | |||||||||
| Emissions to air | 2.50 | 2.00 | 1.50 | 2.50 | 2.00 | 1.50 | 2.50 | 2.00 | 1.50 |
| Soil and ground conditions | 2.50 | 2.50 | 1.00 | 2.50 | 2.50 | 1.00 | 2.00 | 2.00 | 2.00 |
| Groundwater and surface water | 2.80 | 1.60 | 1.00 | 3.00 | 1.60 | 1.00 | 3.00 | 1.60 | 1.00 |
| Ecology | 2.33 | 2.10 | 1.80 | 2.33 | 2.00 | 1.67 | 1.67 | 2.33 | 1.33 |
| Natural resources and waste | 2.25 | 2.50 | 1.25 | 2.25 | 2.50 | 1.25 | 2.25 | 2.50 | 1.25 |
| Economy | |||||||||
| Direct economic costs and benefits | 2.00 | 2.67 | 1.52 | 1.67 | 2.67 | 1.67 | 1.67 | 2.67 | 1.67 |
| Indirect economic costs and benefits | 3.00 | 1.67 | 1.00 | 3.00 | 1.50 | 1.00 | 3.00 | 1.25 | 1.00 |
| Employment and employment capital | 3.00 | 1.67 | 1.33 | 3.00 | 1.67 | 1.33 | 3.00 | 1.67 | 1.33 |
| Induced economic costs and benefits | 3.00 | 1.67 | 1.00 | 2.33 | 1.67 | 1.67 | 2.33 | 1.67 | 1.67 |
| Project lifespan and flexibility | 2.00 | 1.83 | 1.83 | 2.00 | 1.86 | 1.71 | 2.00 | 2.14 | 1.57 |
| Social | |||||||||
| Human health and safety | 3.00 | 1.67 | 1.00 | 3.00 | 1.67 | 1.00 | 3.00 | 1.67 | 1.00 |
| Ethics and equality | 3.00 | 1.00 | 1.00 | 3.00 | 1.00 | 1.00 | 3.00 | 1.00 | 1.00 |
| Neighborhoods and locality | 2.00 | 2.50 | 1.50 | 2.00 | 2.50 | 1.50 | 2.00 | 2.00 | 1.50 |
| Communities and community involvement | 3.00 | 1.50 | 1.00 | 3.00 | 1.50 | 1.00 | 3.00 | 1.50 | 1.00 |
| Uncertainty and evidence | 3.00 | 1.50 | 1.50 | 3.00 | 1.00 | 2.00 | 3.00 | 1.00 | 1.67 |
Note: No = no action; cWWTP = conventional waste water treatment plant; and W+ = Wetland + system.
Environmental Criteria
If we look in detail at the overall Environmental category, then in all criteria, is the highest-rated scenario. No intervention is the worst except for natural resources and waste, where WWTP would generate waste that would have to be disposed of.
Emissions to air: The construction of generates greenhouse gases, but over the lifetime, it is sequestered, so the overall benefit is positive. WWTP will use fossil carbon in energy and resources. Fugitive emissions of volatile organic compounds (HCH isomers) will be most significant in the no-intervention scenario.
Soil and ground conditions: The improves topsoil biology.
Groundwater and Surface Water: Both the and WWTP improve water quality in the stream and downstream water bodies. Additionally, is an ecological process, and its outflow water will contain a range of aquatic microfauna and plankton that the WWTP would not.
Ecology: creates significant habitat and biodiversity benefits over other options. No change perpetuates ecosystem degradation in the surrounding environment and ongoing accumulation of pesticides along food chains, potentially affecting birdlife. Additionally, the operation of WWTP creates local disruption to ecology (for example, light and noise).
Natural resources and waste: Both treatments will help reduce the stream bed’s orange (iron) staining. WWTP consumes some water (e.g., for washing filters) and also generates waste. includes using locally generated recyclates/renewables (such as woodchip).
Economic Criteria
Direct economic costs and benefits: is cheaper over the long term than WWTP, although “no change” obviously has no direct costs. WWTP will have more control, daily operations, and monitoring than . The benefit is comparable for both installations, significantly higher than no intervention.
Indirect economic costs and benefits: has intrinsic value in making the area both safer and look safer compared with WWTP. may be closer to the sustainability aspirations of Diamo to show that the organizations involved share a goal of low input and sustainable solutions. In contrast, no change is damaging to its reputation. Treatment also protects fisheries and hunting.
Employment and employment capital: Conventional WWTP likely has the greatest local job creation potential (e.g., for a technician). creates some maintenance needs. offers the widest and most attractive range of opportunities for school visits and pathways for education and offers a platform for student projects.
Induced economic costs and benefits: Improvement of the stream, either by or WWTP, improves the attractiveness of the area downstream of treatment for a wider range of land use opportunities. offers the provider the chance to improve innovation and skills and provides a platform for replication elsewhere.
Project lifespan and flexibility: WWTP has the most significant process control and is likely best understood by regulators for permitting purposes. However, where a problem does occur, has the most extraordinary internal resilience and is likely to be most resilient to any constraints on the operator to pay. is also likely to have the most minor intuitional burden (e.g., maintenance of process control records). No action postpones the solution to the environmental problem to the future, likely increasing both the cost of the solution and the economic impact of the damage being caused.
Societal Criteria
Human health and safety: Both treatments meet the necessary surface water treatment criteria, reducing risks. Risks to site workers are likely to be greatest for the WWTP as it is an operating process plant. Both treatments improve the amenity value of the local area, making it more attractive for physical recreation. acts in its own right as a destination to encourage people outside.
Ethics and quality: No change means that the polluter does not pay and postpones the problem to future generations.
Neighborhoods and locality: Given the remoteness of the location, there are no likely neighborhood concerns over effects from dust, light, noise, odor, vibrations and traffic. A remote WWTP is potentially an attractive destination for thieves and vandals in a way that is not. Both treatments provide local improvement for hunting, fishing, and wildlife-based recreation.
Communities and community involvement: Both treatments improve the amenity of the river downstream, benefiting local communities. Treatment of the problem is in line with local planning and environmental policies, with offering the greatest linkage to sustainable development policy goals.
Uncertainty and evidence: The robustness and rigor of the information for option design provided is greatest for WWTP because it is so well established, it has more straightforward process control at present, and its outcomes are more readily validated. No change is obviously a completely uncontrolled process.
The general category rankings are averages of individual rankings made for each of the criteria shown in Table 2. Each individual ranking is supported by a specific rationale. The next stage of assessment will bring in wider stakeholders within the LifePopWat project to scrutinize and review these individual rankings and their rationales.
Phase 2
In the second phase, the results from PHASE 1 were put out for peer review by the whole LIFEPOPWAT project team, followed by a series of web discussions. All seven stakeholders had at least one representative in the discussion. The collective consisted of experts in the broader field of water treatment and remediation, as well as economists. The collective that participated in PHASE 1 was not part of the PHASE 2 team; only the SEI expert interpreted the questions for the collective. The results for the categories are included in the Table 4. However, Fig. 3 focuses on Phase 1 and Phase 3 because the changes delivered in Phase 2 are relatively small. Specifically, in the environmental criteria category, there are no changes; in the economic criteria, there is a small improvement for both active scenarios, and in the societal criteria, there is an improvement in the system in the Uncertainty and evidence criterion.
Phase 3
In the third phase of the analysis, external stakeholders who know the site and are interested in its remediation were invited to participate in the process. Unlike other studies (Nagisetty et al. 2020), the responders were not selected based on demographics, but based on profiles, so a wide range of types was covered. These included representatives of local or regional authorities, environmental authorities, watershed authorities, and local NGOs. The number of responders is so small that it is not possible to make detailed evaluations based on age, sex, race, education, and income. This may be applied to another location considered for the next evaluation. A list of the stakeholders involved organizations is provided in Table 5.
| Organization | Department |
|---|---|
| Ostrov nad Ohri Municipal Office | Environment Department |
| Ostrov nad Ohri Municipal Office | Department of Construction Management |
| Karlovy Vary Regional Office | Department of Environment and Agriculture–Water management |
| Karlovy Vary Regional Office | Department of Environment and Agriculture–Landscape Protection, Agriculture and Revitalisation |
| Czech Environmental Inspectorate | Water Protection Department in Karlovy Vary |
| Agency for the Protection of Nature and Landscape of the Czech Republic | Regional Office Karlovy Vary |
| Ohre Basin | Office in Chomutov |
| DIAMO state enterprise | Head of Ecology Department |
| Botanical garden in Dalovice | Head of the regional Meluzina Ecological Centre |
| Forest Administration Horni Blatna Hajek | Forest Preserve |
The discussions with external stakeholders were highly informative and questioned several of the Phase rankings, in particular, related to the following:
•
Environment: soil and ground conditions, where the putative relative improvements identified by the LIFEPOPWAT team were largely disregarded as being relatively local to the drainage channel and wetland site.
•
Environment: ecology, where impacts of the WWTP were of greater concern.
•
Economic: project lifespan and flexibility, where external consultees took a more favorable view of compared with the implementation and project teams and a less favorable view for WWTP.
•
Societal: uncertainty and evidence, where external consultees also supported the change seen at Phase 2 where the lack of knowledge of was seen as more of a limiting factor than was perceived by the implementation team.
The ranked answers were again summarized in the categories (Table 6) and plotted as radar graphs. Although the radar charts look different (mostly for the chart for economic comparison), their result is virtually the same as after the first phase. outranked the use of conventional WWTP for most of the 15 general categories defined in Table 2 and shown in Fig. 3 (right side), and where it did not outrank, the ranking was very similar. The only category where WWTP was rated better was in the area of Uncertainty and evidence, where external stakeholders, not as familiar with technology as the project investigators, gave the technology more uncertainty.
| Category | Question: changes |
|---|---|
| ENV | |
| Soil and groundwater conditions | Q: Changes in soil/subsurface structure affecting drainage, including soil sealing: installation at Hajek required larger areas of a concrete pool than WWTP (Deterioration of the grade for ). |
| Ecology | Q: Effects on flora, fauna, and food chains: ecological benefits remained the greatest overall, but the other two were ranked similarly (grade improvement for no-intervention). |
| Q: Significant changes in ecological community structure or function and consequent impacts on ecosystem services: ecological benefits remained the greatest overall, but the other two were ranked similarly (grade improvement for no-intervention). | |
| ECON | |
| Indirect economic costs and benefits | Q: Impact on corporate reputation: external stakeholders supposed that reputational benefit from any installation is similar (WWTP was levelled up to ). |
| Project lifespan and flexibility | Q: Duration of the risk management (remediation) benefit: the stakeholders think the benefit becomes more apparent. |
| Q: Ability to respond to changing regulation or its implementation: external comments are that may be more attractive to regulators (grade improvement for ). | |
| SOC | |
| Neighborhoods and locality | Q: Wider effects of changes in site usage by local communities (e.g., reduction in antisocial activities on a derelict site): generally agreed that risk reduced most for no change. There was some skepticism that vandalism or theft was a similar risk for both installations (grade improvement for WWTP). |
| Community involvement | Q: Requirements for validation/verification: while this ranking is broadly supported, several stakeholders comment that there is now good information for treatments, and this situation will improve and should be ranked equally. |
LCA Analysis
The above conclusions from qualitative research regarding the environmental impact were also demonstrated by quantitative data from LCA analysis of both systems: and WWTP. The life cycle assessment was carried out in four stages:
•
defining the purpose and scope, including setting the boundaries of the systems (construction and operation), the functional unit of treated water, and the 25-year lifetime of the systems,
•
inventory analysis (Life Cycle Inventory–LCI), i.e., collection of input data for both systems within construction and operation stages,
•
impact assessment (Life Cycle Impact Assessment–LCIA), i.e., ReCiPe2016 method at midpoint and endpoint level (Huijbregts et al. 2016),
•
interpretation (by SimaPro).
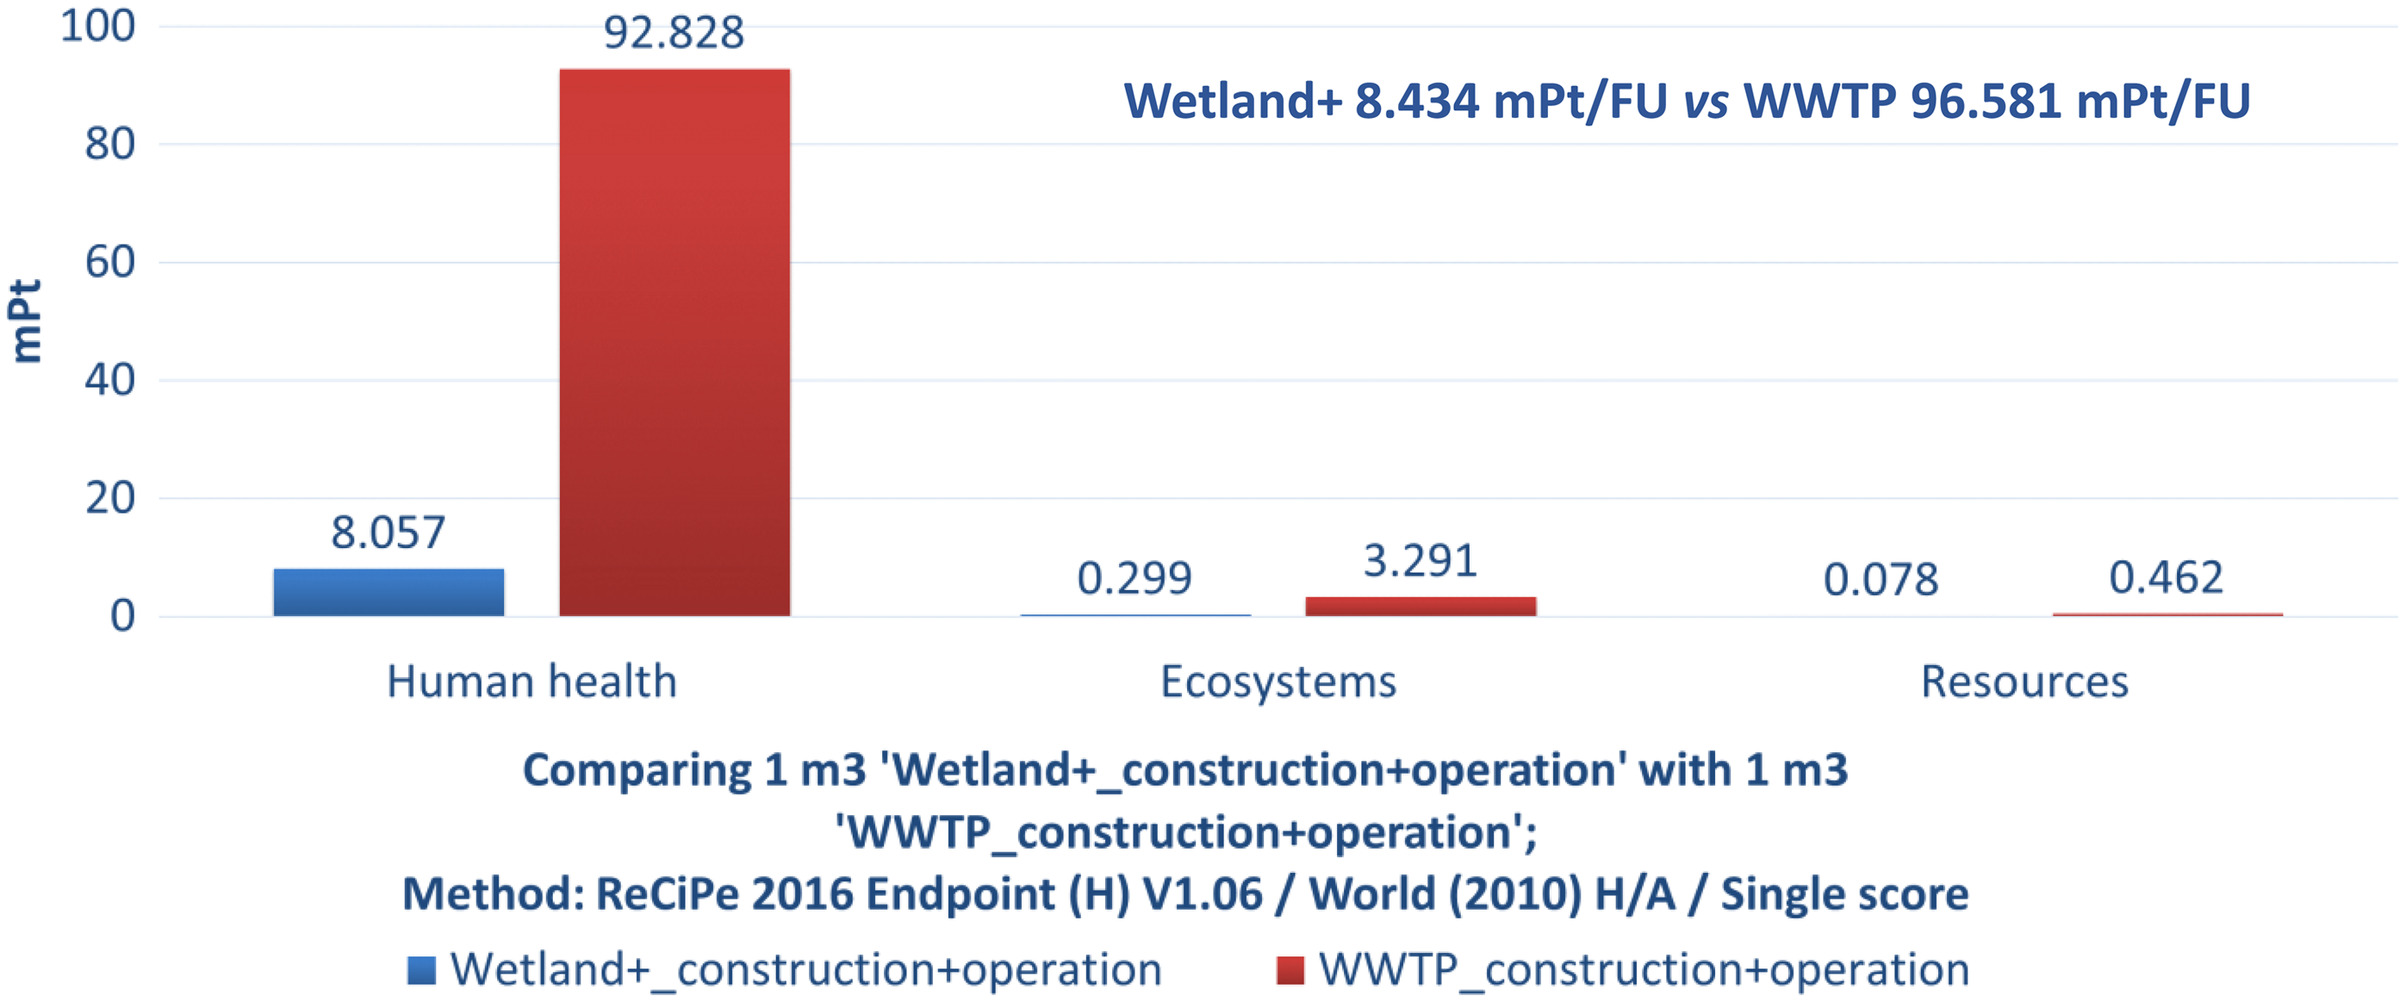
The total values of environmental effects for the and WWTP systems indicate that the WWTP system is characterized by a much higher environmental burden, both as a whole and within subsequent damage categories such as human health, ecosystems, or resources (Fig. 4). The level of value for human health concerning ecosystems and resources is many times higher for both the and WWTP systems. Finally, the total environmental burden for the system amounts to , while for the WWTP system it is .
Conclusions
This paper provides the assessment framework for the sustainability evaluation of implementations in Hajek. The proposed framework builds upon the 15 broad categories of indicators addressed by the SuRF-UK Indicator checklist, which revolves around three main elements of sustainable development: environment, society, and economy. The approach taken in this project develops the guidelines set out in the 1987 Brundtland Report (UN 1987) and subsequent UN Sustainable Development Goals or SDGs (UN 2015). The chosen framework considered both input and output effects within the sustainability assessment. The initial assessments compared with the conventional WWTP and no-intervention scenario. The assessment (qualitative research) was provided first by a small group of internal project stakeholders. outranked the use of WWTP, and both performed significantly better than the no-intervention scenario. This assessment was in the second phase and evaluated by the remaining team members from all stakeholders. In the third phase, the external stakeholders were involved, resulting in some changes in the evaluation. However, at all phases, ranked best for sustainability overall. After the final phase, including external stakeholder consultations, outranked all options across 10 out of the 15 headline sustainability categories and was equal first for four of the remaining five. In only one category, uncertainty and evidence, did it rank behind another option (WWTP), which was entirely predictable for an emerging technology being compared to an established one. The changes following the external stakeholder consultation were significant and provided both useful validation where rankings remained similar and useful additional information where rankings changed. The perspectives of external consultees were, unsurprisingly, not entirely consistent, so in some cases the majority opinion was used. While the external stakeholder consultation was very useful and refined the sustainability assessment, it did not lead to a change in the overall sustainability assessment outcome, which was consistent at all three phases. Lessons that could be drawn from this are that providing the assessment uses a rigorous and holistic process and indicator checklist as LIFEPOPWAT did, and a simple initial sustainability assessment across the implementation team can provide a useful indicative outcome. However, wider consultation provides useful validation and expands a supportive constituency for supporting an approach to an environmental restoration project. In terms of useful additional work, it would have been interesting to have debated some opinions with external stakeholders. However, from a pragmatic point of view, most people have limited time, so gaining the external perspectives provided was a good outcome for LIFEPOPWAT, and care should be taken not to exceed the boundaries of goodwill. Finally, formal LCA confirmed the rankings between and WWTP for the related qualitative sustainability criteria. The technology verified here will be used in the next stage to carry out a socio-economic assessment at the second project site, which differs in the extent of HCH pollution possible remediation scenarios and is located close to a residential area. Also, the LCA analysis will be carried out in greater detail.
Data Availability Statement
Data will be made available on request.
Acknowledgments
This work was funded by the project “Innovative technology based on constructed wetlands for treatment of pesticide-contaminated waters” granted by the LIFE EU program (Agreement No. LIFE18 ENV/CZ/000374).
Author contributions: All authors contributed equally to the planning and writing of the manuscript.
References
Bardos, R., H. Thomas, J. Smith, N. Harries, F. Evans, R. Boyle, T. Howard, R. Lewis, A. Thomas, and A. Haslam. 2018. “The development and use of sustainability criteria in SuRF-UK’s sustainable remediation framework.” Sustainability 10 (6): 1781. https://doi.org/10.3390/su10061781.
Bardos, R. P., et al. 2020. “Sustainability assessment framework and indicators developed by SuRF-UK for land remediation option appraisal.” Rem. J. 31 (1): 5–27. https://doi.org/10.1002/rem.21668.
Bayer, P., and M. Finkel. 2006. “Life cycle assessment of active and passive groundwater remediation technologies.” J. Contam. Hydrol. 83 (3–4): 171–199. https://doi.org/10.1016/j.jconhyd.2005.11.005.
Braun, A., A. D. S. Trentin, C. Visentin, and A. Thomé. 2020. “Sustainable remediation: A new way of thinking the contaminated sites management.” Soils Rocks 43 (1): 97–108. https://doi.org/10.28927/SR.431097.
Braun, A. B., A. W. D. S. Trentin, C. Visentin, and A. Thomé. 2019. “Sustainable remediation through the risk management perspective and stakeholder involvement: A systematic and bibliometric view of the literature.” Environ. Pollut. 255 (Dec): 113221. https://doi.org/10.1016/j.envpol.2019.113221.
Brucek, P. 2013. “LOM HÁJEK—A comprehensive solution for the remediation of a spoil heap contaminated with chlorinated substances (report on the course of research and preparation of a technical-economic study.” [In Czech.] Accessed June 11, 2023. https://slon.diamo.cz/hpvt/2014/Z/Z%2009.pdf.
Brundtland, G. R. 1987. “Our common future.” Accessed March 22, 2022. https://www.are.admin.ch/are/en/home/media/publications/sustainable-development/brundtland-report.html.
Cappuyns, V. 2016. “Inclusion of social indicators in decision support tools for the selection of sustainable site remediation options.” J. Environ. Manage. 184 (Dec): 45–56. https://doi.org/10.1016/j.jenvman.2016.07.035.
Cappuyns, V., and B. Kessen. 2014. “Combining life cycle analysis, human health and financial risk assessment for the evaluation of contaminated site remediation.” J. Environ. Plann. Manage. 57 (7): 1101–1121. https://doi.org/10.1080/09640568.2013.783460.
CL:AIRE. 2020a. “Supplementary report 1 of the SuRF-UK framework: A general approach to sustainability assessment for use in achieving sustainable remediation (SR1).” Accessed May 10, 2023. https://www.claire.co.uk/projects-and-initiatives/surf-uk.
CL:AIRE. 2020b. “Supplementary report 2 of the SuRF-UK framework: A general approach to sustainability assessment for use in achieving sustainable remediation (SR2).” Accessed May 12, 2023. https://www.claire.co.uk/projects-and-initiatives/surf-uk.
Da S Trentin, A. W., K. R. Reddy, G. Kumar, J. K. Chetri, and A. Thomé. 2019. “Quantitative assessment of life cycle sustainability (QUALICS): Framework and its application to assess electrokinetic remediation.” Chemosphere 230 (Sep): 92–106. https://doi.org/10.1016/j.chemosphere.2019.04.200.
Favara, P., et al. 2019. “Ten years later: The progress and future of integrating sustainable principles, practices, and metrics into remediation projects.” Rem. J. 29 (4): 5–30. https://doi.org/10.1002/rem.21612.
Favara, P., J. Tunks, J. Hatton, and W. DiGuiseppi. 2016. “Sustainable remediation considerations for treatment of 1,4-Dioxane in groundwater: Sustainable remediation for treatment of 1,4-Dioxane in groundwater.” Rem. J. 27 (1): 133–158. https://doi.org/10.1002/rem.21501.
Fernández Del Castillo, A., M. V. Garibay, C. Senés-Guerrero, D. A. Orozco-Nunnelly, J. De Anda, and M. S. Gradilla-Hernández. 2022. “A review of the sustainability of anaerobic reactors combined with constructed wetlands for decentralized wastewater treatment.” J. Cleaner Prod. 371 (Oct): 133428. https://doi.org/10.1016/j.jclepro.2022.133428.
García-Herrero, L., S. Lavrnić, V. Guerrieri, A. Toscano, M. Milani, G. L. Cirelli, and M. Vittuari. 2022. “Cost-benefit of green infrastructures for water management: A sustainability assessment of full-scale constructed wetlands in Northern and Southern Italy.” Ecol. Eng. 185 (Dec): 106797. https://doi.org/10.1016/j.ecoleng.2022.106797.
Gill, R., S. Thornton, M. Harbottle, and J. Smith. 2016. “Sustainability assessment of electrokinetic bioremediation compared with alternative remediation options for a petroleum release site.” J. Environ. Manage. 184 (Dec): 120–131. https://doi.org/10.1016/j.jenvman.2016.07.036.
Gurdon, L., L. Esmahi, N. Y. Amponsah, and J. Wang. 2021. “Life cycle cost analysis of contaminated site remediation using information technology tools.” Environ. Dev. Sustainability 23 (Jun): 10173–10193. https://doi.org/10.1007/s10668-020-01052-x.
Harwell, M. C., et al. 2021. “Ecosystem services consideration in the remediation process for contaminated sites.” J. Environ. Manage. 285 (May): 112102. https://doi.org/10.1016/j.jenvman.2021.112102.
Hou, D., A. Al-Tabbaa, P. Guthrie, J. Hellings, and Q. Gu. 2014. “Using a hybrid LCA method to evaluate the sustainability of sediment remediation at the London Olympic park.” J. Cleaner Prod. 83 (Nov): 87–95. https://doi.org/10.1016/j.jclepro.2014.07.062.
Hu, G., H. Liu, C. Chen, P. He, J. Li, and H. Hou. 2022. “Selection of green remediation alternatives for chemical industrial sites: An inte-grated life cycle assessment and fuzzy synthetic evaluation approach.” Sci. Total Environ. 845 (Nov): 157211. https://doi.org/10.1016/j.scitotenv.2022.157211.
Huang, W. Y., W. Hung, C. T. Vu, W. T. Chen, J. W. Lai, and C. Lin. 2016. “Green and sustainable remediation (GSR) evaluation: Framework, standards, and tool. A case study in Taiwan.” Environ. Sci. Pollut. Res. 23 (5): 21712–21725. https://doi.org/10.1007/s11356-016-7305-x.
Huijbregts, M. A. J., Z. Steinmann, P. M. F. Elshout, R. van Zelm, G. Stam, F. Verones, M. D. M. Vieira, M. Zijp, and A. Hollander. 2016. ReCiPe 2016: A harmonized life cycle impact assessment method at midpoint and endpoint level. Bilthoven, Netherlands: National Institute for Public Health and the Environment.
ISO. 2017. Soil quality. Sustainable remediation. ISO 18504:2017. Geneva: ISO.
Lakho, F. H., A. Qureshi, W. Igodt, H. Q. Le, V. Depuydt, D. P. Rousseau, and S. W. Van Hulle. 2022. “Life cycle assessment of two decentralized Water treatment systems combining a constructed wetland and a membrane based drinking water production system.” Resour. Conserv. Recycl. 178 (Mar): 106104. https://doi.org/10.1016/j.resconrec.2021.106104.
Laurent, A., S. I. Olsen, and M. Z. Hauschild. 2012. “Limitations of carbon footprint as indicator of environmental sustainability.” Environ. Sci. Technol. 46 (7): 4100–4108. https://doi.org/10.1021/es204163f.
Li, X., S. Yi, A. B. Cundy, and W. Chen. 2022. “Sustainable decision-making for contaminated site risk management: A decision tree model using machine learning algorithms.” J. Cleaner Prod. 371 (Oct): 133612. https://doi.org/10.1016/j.jclepro.2022.133612.
Müller, J. 2014. Untersuchungen zur Bewertung der Nachhaltigkeit einer Altlastsanierung auf einem Industriestandort mittels Ökobilanzierung und Multikriterienanalyse. Berlin: GRIN.
Nagisetty, R. M., D. A. Autenrieth, S. R. Storey, W. B. Macgregor, and L. C. Brooks. 2020. “Environmental health perceptions in a superfund community.” J. Environ. Manage. 261 (May): 110121. https://doi.org/10.1016/j.jenvman.2020.110151.
Naseri-Rad, M., R. Berndtsson, A. Aminifar, U. S. McKnight, D. O’Connor, and K. M. Persson. 2022. “DynSus: Dynamic sustainability assessment in groundwater remediation practice.” Sci. Total Environ. 832 (Aug): 154992. https://doi.org/10.1016/j.scitotenv.2022.154992.
Norrman, J., T. Söderqvist, Y. Volchko, P. E. Back, D. Bohgard, E. Ringshagen, H. Svensson, P. Englöv, and L. Rosén. 2020. “Enriching social and economic aspects in sustainability assessments of remediation strategies—Methods and implementation.” Sci. Total Environ. 707 (Mar): 136021. https://doi.org/10.1016/j.scitotenv.2019.136021.
Patel, K., and S. K. Singh. 2022. “A life cycle approach to environmental assessment of wastewater and sludge treatment processes.” Water Environ. J. 36 (3): 412–424. https://doi.org/10.1111/wej.12774.
Patyal, V., D. Jaspal, and K. Khare. 2023. “Performance enhancement of constructed wetlands for wastewater remediation by modifications and integration of technologies: A review.” Environ. Progress Sustainable Energy 42 (1): e13951. https://doi.org/10.1002/ep.13951.
Rizzo, E., et al. 2016. “Comparison of international approaches to sustainable remediation.” J. Environ. Manage. 184 (Dec): 4–17. https://doi.org/10.1016/j.jenvman.2016.07.062.
Smith, J., P. Bardos, F. Evans, A. Thomas, H. Thomas, G. Wolf, and J. Ricker. 2022. “Sustainable remediation column: Sustainable remediation tools.” Rem. J. 32 (1–2): 129–132. https://doi.org/10.1002/rem.21709.
Smith, J. W. N. 2019. “Debunking myths about sustainable remediation.” Rem. J. 29 (2): 7–15. https://doi.org/10.1002/rem.21587.
Song, Y., D. Hou, J. Zhang, D. O’Connor, G. Li, Q. Gu, S. Li, and P. Liu. 2018. “Environmental and socio-economic sustainability appraisal of contaminated land remediation strategies: A case study at a mega-site in China.” Sci. Total Environ. 610–611 (Jan): 391–401. https://doi.org/10.1016/j.scitotenv.2017.08.016.
Sweeney, R., P. Bardos, and N. Harries. 2023. “Case studies and analysis of sustainable remediation techniques and technologies.” Accessed November 1, 2023. https://www.concawe.eu/publication/case-studies-and-analysis-of-sustainable-remediation-techniques-and-technologies/.
United Nations Department of Economic and Social Affairs. 2015. “Transforming our world: The 2030 agenda for sustainable development.” Accessed March 15, 2023. https://sdgs.un.org/2030agenda.
Vegter, J., J. Lowe, and H. Kasamas. 2002. Sustainable management of contaminated land: An overview: On behalf of CLARINET. Wien, Austria: Austrian Federal Environment Agency.
Information & Authors
Information
Published In

Journal of Environmental Engineering
Volume 150 • Issue 8 • August 2024
Copyright
This work is made available under the terms of the Creative Commons Attribution 4.0 International license, https://creativecommons.org/licenses/by/4.0/.
History
Received: Sep 20, 2023
Accepted: Mar 7, 2024
Published online: Jun 7, 2024
Published in print: Aug 1, 2024
Discussion open until: Nov 7, 2024
Authors
Metrics & Citations
Metrics
Citations
Download citation
If you have the appropriate software installed, you can download article citation data to the citation manager of your choice. Simply select your manager software from the list below and click Download.