Open access
Technical Papers
Feb 23, 2024

Assessing the Applicability of Deep-Learning Method for Predicting Cyanobacteria in a Regulated River

Publication: Journal of Environmental Engineering
Volume 150, Issue 5

Abstract

Cyanobacterial harmful algal blooms (cyanoHABs) caused by cyanobacteria negatively affect humans via river water and aquatic life. Thus, reliable cyanobacteria predictions are essential for managing cyanoHABs. With recent advancements in computer technology and big data usage, artificial intelligence (AI) technologies have gained attention in various fields, such as water resources, weather and climate, and water quality. This study evaluated the applicability of deep-learning-based AI technology for predicting cyanobacteria. A convolutional neural network (CNN)–long short-term memory (LSTM) model, a deep-learning-based AI technology advantageous for predicting time-series data and cyanobacteria features, was built. Its results were analyzed and compared with those of the existing physical Environmental Fluid Dynamics Code (EFDC)–National Institute of Environment Research (NIER) model for cyanobacteria prediction. The CNN-LSTM model performed better, with an accuracy of 69%, which is an improvement over the previous EFDC-NIER model’s accuracy of 45%. In particular, there was a dramatic improvement in the prediction accuracy for low cyanobacteria cell counts in Level 1, which increased from 39% to 87%. There also was an improvement in the prediction accuracy for Levels 2 and 3. The accuracy for Level 2 increased from increased from 56% to 69%, and the accuracy for Level 3 increased from 38% to 48%. However, there was a significant decrease in prediction accuracy for high cyanobacteria cell counts in Level 4, for which the measured data were very scarce; accuracy decreased from 49% to 16.7%. The CNN-LSTM model yielded better overall prediction performance than the EFDC-NIER model, demonstrating its applicability in cyanobacteria prediction. However, it has limitations of overfitting areas with inadequate data and not accurately predicting patterns that have not occurred in the past. To address this issue, we propose an approach the combines the advantages of physics-based models and AI-based deep learning models, creating a hybrid concept.

Introduction

Every summer, South Korea faces many problems owing to algal blooms (NIER 2020; Ahn et al. 2021a), which cause the death of aquatic life and negatively affect water supply management (Schmidt et al. 2013; Pavagadhi and Balasubramanian 2013; 
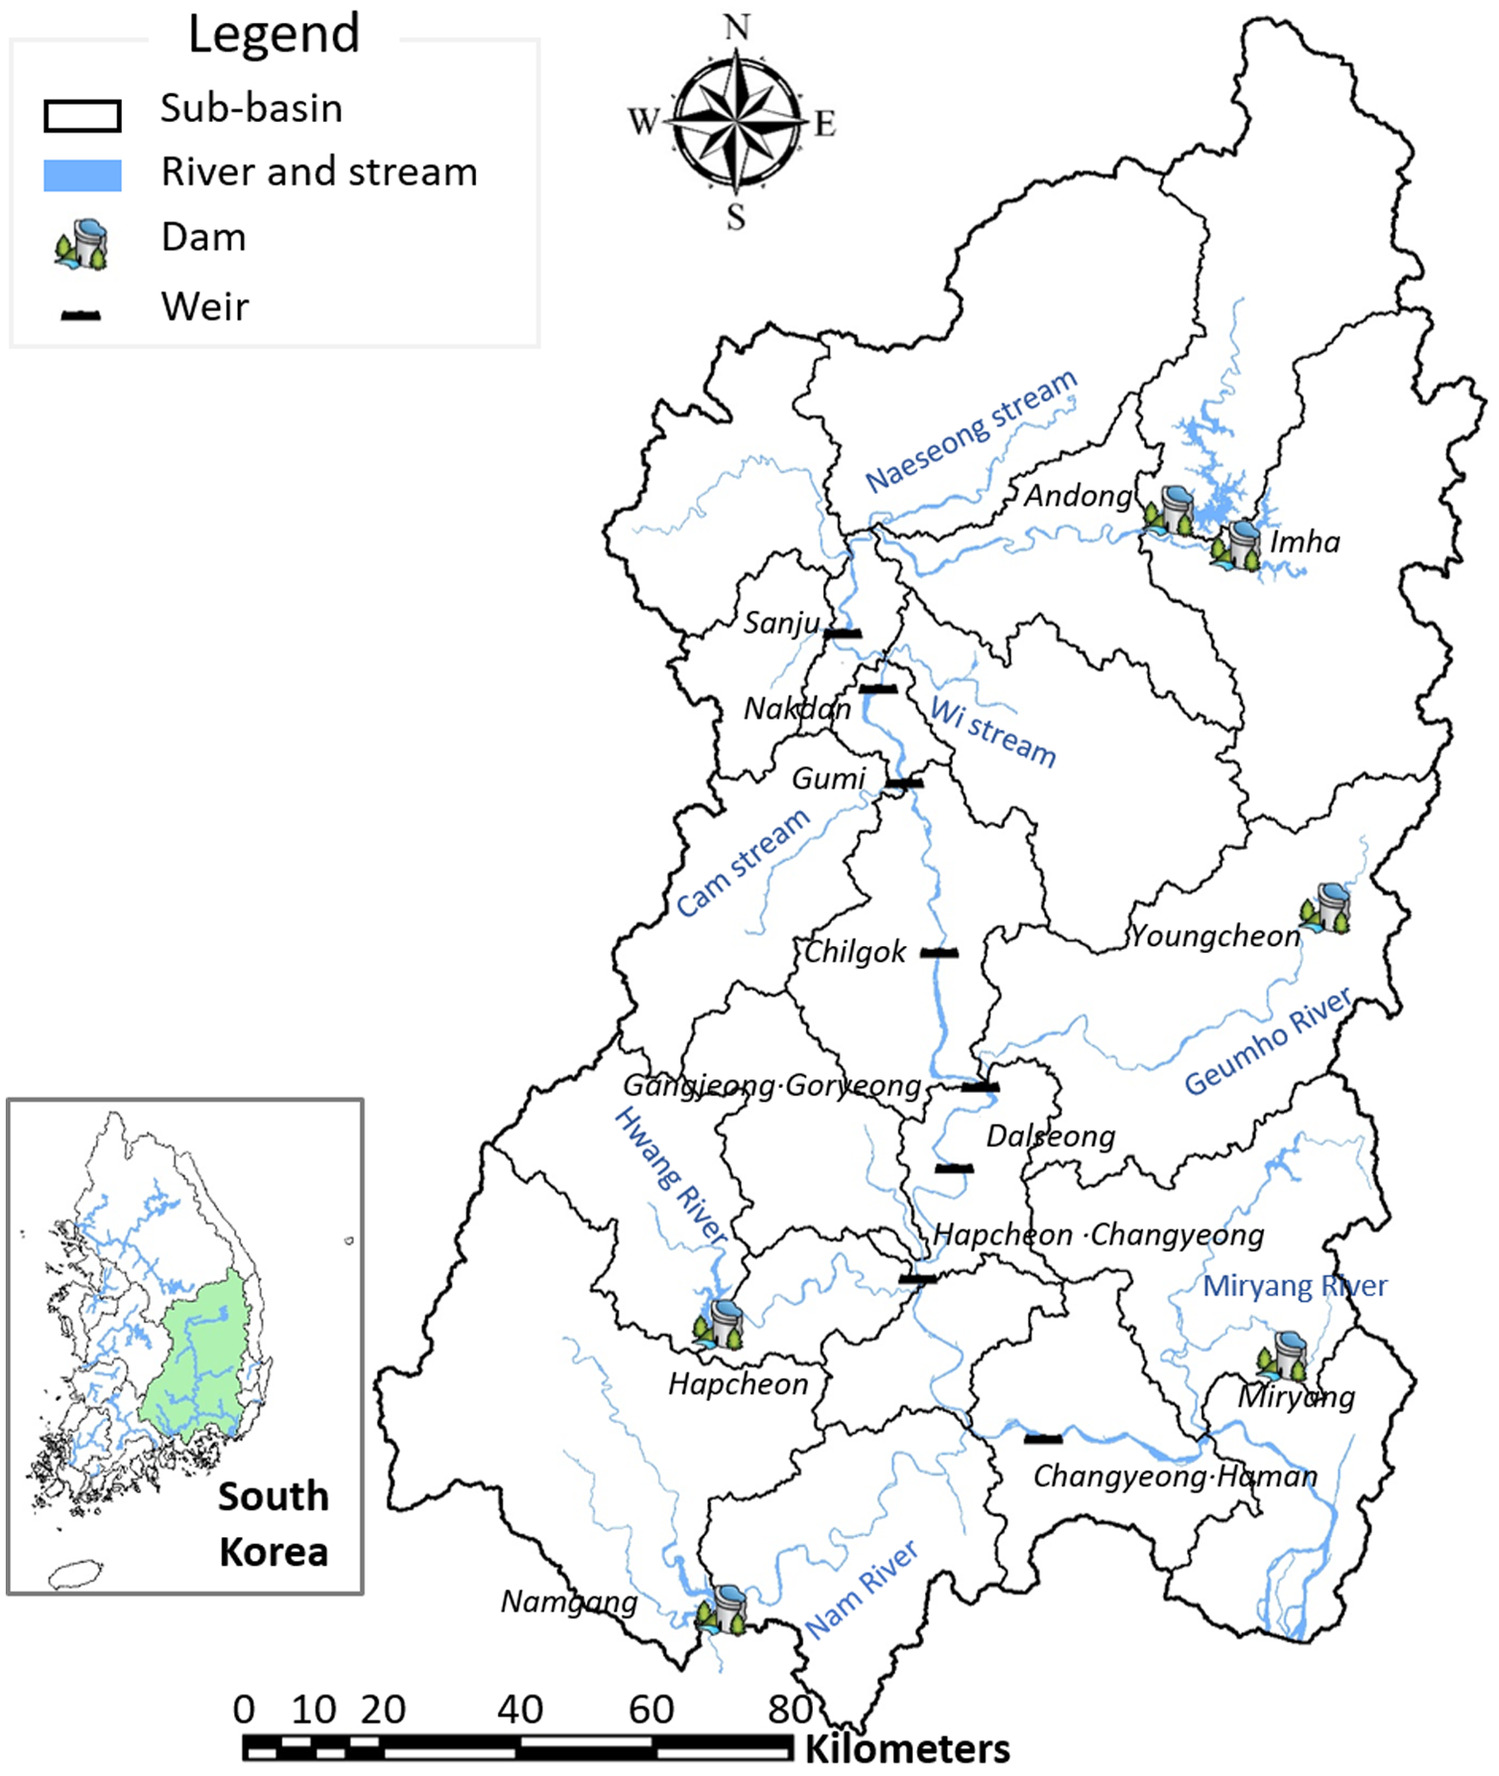
Preece et al. 2017). In particular, because the Nakdong River has been transformed artificially into a lake due to the Four Major Rivers Project, the occurrence of cyanoHABs has become even more severe. Algal blooms are a global environmental issue typically occurring when cyanobacteria proliferate (Huisman et al. 2004). In South Korea, algal blooms caused by cyanobacteria also are a serious social problem (Ahn et al. 2021c). Therefore, predicting cyanobacteria cell counts is crucial for managing cyanobacterial harmful algal blooms (cyanoHABs) (Pyo et al. 2020).
In South Korea, water quality and cyanobacteria cell counts are measured weekly for early response and management of cyanoHABs. These data are used to predict cyanobacteria cell counts. The physical Environmental Fluid Dynamics Code (EFDC)–National Institute of Environment Research (NIER) model predicts cyanobacteria cell counts. The EFDC-NIER model has been improved by the National Institute of Environmental Research to better suit South Korean river environments and has undergone extensive improvements for enhanced prediction accuracy (Ahn et al. 2021b). The EFDC-NIER model is utilized for two main purposes: short-term forecasting for operating the harmful algae alert system; and predicting variations in cyanobacterial occurrences based on various scenarios involving meteorological, hydrological, water quality, and hydraulic factors. It is crucial to predict the occurrence of harmful algal blooms (HABs) in the near future quickly and accurately. By doing so, sufficient time can be secured to implement proactive measures and strategies to effectively mitigate the impacts of HABs on river ecosystems and minimize potential risks to water supply safety in surrounding communities. The ability to make timely and precise short-term forecasts allows for better planning and preparation, thus enhancing the overall management and response to HAB events.
Operating a harmful algae alert system using a physics-based model can present several challenges. One of the major issues is the computational complexity and time required to execute the model. The process of simulating the physical interactions and environmental factors is resource-intensive and time-consuming. Running simulations to predict algal blooms and their dynamics involves complex calculations that require substantial computational power and data processing. Input data, model structure, and parameters considerably influence cyanobacteria cell count predictions using physics-based models (McAvoy et al. 2003; Zhang et al. 2015; Jiang et al. 2018; Su et al. 2018). Physics-based models can yield accurate results through well-validated mechanisms and processes. However, the complexity of these mechanisms and processes can make model construction difficult and result in significantly longer execution times. As a result, obtaining real-time or near-real-time predictions may be difficult, hindering the system’s ability to provide timely warnings and effective responses to potential HAB events. This limitation calls for the exploration of alternative modeling approaches or techniques that can strike a balance between accuracy and computational efficiency in order to improve the operational capabilities of the harmful algae alert system.
Our main research objective was to leverage the strengths of artificial intelligence (AI)-based deep learning prediction models to complement the weaknesses of the physics-based models. For this purpose, we applied artificial intelligence technology to predict harmful algal blooms and compared the results with those obtained from traditional physics-based models. Through discussions and analysis, we present the limitations of AI technology and propose potential solutions to overcome them, ultimately enhancing the accuracy and efficiency of algal bloom predictions.
AI-based deep learning models exhibit strengths in handling large-scale data processing and providing rapid predictions (Lek and Park 2008). By learning patterns and relationships from past data, they enable quicker response times and more-efficient short-term forecasting (Miotto et al. 2018). Therefore, data-driven models can be an alternative to physics-based models because they require only data distribution to predict cyanobacteria cell counts (KEI 2020). Research on cyanoHABs is relatively scarce, and it is still a very challenging field. However, several studies have been conducted recently. Neural-network-based AI technology mainly was used in those studies (Velo-Suarez and Gutierrez-Estrada 2007; Coad et al. 2014; Zhang et al. 2015). ANN techniques have been used widely in algae prediction, including for predicting cyanobacteria cell counts (Maier et al. 1998; Xiao et al. 2017; Yim et al. 2019; Chen et al. 2020). ANNs have evolved in various ways depending on the purpose of prediction. In particular, long short-term memory (LSTM) solves the gradient vanishing problem and improves performance when predicting long sequences (Kim et al. 2021). Cyanobacteria data and various weather and water-quality variables affecting cyanobacteria have a time-series distribution. LSTM is particularly effective for time-series analysis and is used widely in predicting algae (Lee and Lee 2018; Shin et al. 2019; Hill et al. 2020; Liang et al. 2020; Zheng et al. 2021). Recently, convolutional neural networks (CNNs) have been used to predict the temporal and spatial distribution of cyanobacteria (Pyo et al. 2020). Reports indicate that CNNs have advantages in understanding the features of cyanobacteria data. Accordingly, recent studies show that models combining a CNN and LSTM yield the best results compared with other neural-network-based models in cyanobacteria prediction (Naghdi et al. 2020; Cao et al. 2022).
In previous studies using CNN-LSTM to predict cyanobacteria, the focus was on utilizing the advantages of two-dimensional (2D) CNNs for image processing to extract features from cyanoHABs regions along with meteorological data, and then using LSTM for prediction. In other words, the studies aimed to forecast the spatial variation of algal blooms in lakes. Our main objective was to predict the cyanobacteria directly as a numerical value, specifically in terms of cell counts. This approach represents a significant advancement, because it allows for more-precise and quantitative predictions of cyanobacteria occurrences, which can be crucial for effective management and mitigation strategies. Comparing the results of the AI-based prediction model with those of the conventional physics-based model in regions with relatively scarce water quality and algal bloom data, such as Korea, is a critical aspect of our research. The significance of our research lies in evaluating the applicability of artificial intelligence in the fields of water quality and algal blooms, which have not been explored extensively compared with the existing evaluations focused on floods and droughts. Although the utilization of AI has been assessed in flood and drought aspects by comparison with physics-based models, our study provides a fresh perspective by focusing on water quality and algal bloom prediction.
In this study, we selected the CNN-LSTM model, a combination of a CNN and LSTM, as the AI-based deep learning model to compare with the physics-based model. When choosing the optimal model, it is crucial to consider the characteristics of the data that are to be predicted. Cyanobacteria cell counts exhibit a unique feature in which the observed data can vary drastically from 0 to as high as several hundred thousand cells/mL, unlike other variables. Recently, several studies have suggested that combining LSTM with a CNN can enhance accuracy in predicting time-series data with rapid and drastic changes (Hwang and Shin 2020). A CNN helps identify meaningful patterns and correlations in the data (Han et al. 2019), and LSTM can effectively capture temporal dependencies, thus enhancing the overall predictive performance (Wan et al. 2020; Xia et al. 2020). This combination of a CNN and LSTM allows the model to benefit from the complementary nature of these two architectures, leading to improved accuracy and more-robust predictions in time-series forecasting tasks, especially when dealing with data that exhibit rapid and drastic changes.
The primary contributions of this study are as follows:
1.
In the existing research on predicting harmful algal blooms, the focus has been on predicting the spatial distribution of harmful algae. In contrast, our study improved the model to predict cyanobacteria cell counts directly.
2.
The developed AI-based deep learning model was compared with the conventional physics-based model that traditionally is used in the field of cyanoHAB prediction. We advanced the evaluation process beyond comparing the predictions with the observed data by directly comparing the results of the AI-based model with those of the established physics-based model. This comprehensive comparison allowed us to thoroughly assess the applicability and limitations of the AI model in the context of predicting cyanobacteria cell counts.
3.
By evaluating the performance of AI-based models in these specific domains, our research contributes to a broader understanding of the potential and limitations of artificial intelligence in cyanobacterial forecasting and management.

Data and Methods

Study Area

The Nakdong River is the longest river in South Korea, and is one of its four major rivers. It is the only river in South Korea with a developed delta, and it has many wetlands, making it ecologically important. Since 2009, following a large-scale river improvement project for flood prevention, water resource security, and water quality improvement, eight weirs have been constructed on the Nakdong River; starting at the upstream, they are the Sangju, Nakdan, Gumi, Chilgok, Gangjeong-Goryeong, Dalseong, Hapcheon-Changnyeong, and Changnyeong-Haman Weirs. The Ministry of Environment has installed monitoring stations at weir sections. It measures water quality and algal items once each week (Fig. 1). The Nakdong River has a gentle slope and a meandering shape, which results in slow flow and increased water temperature every summer, causing extensive damage from algal blooms attributable to cyanobacteria, particularly in the downstream areas.
Fig. 1. Study area.

Data Construction

Water Quality, Algae, and Meteorological Data

Water-quality, algae, and meteorological data of the Nakdong River weir sections available for predicting cyanobacteria cell counts were constructed. The data for training, validation, and prediction were collected from 2012 to 2022. After the completion of the Four Major Rivers Restoration Project, monitoring stations were established at each weir of the Nakdong River. Since 2012, the Ministry of Environment has been conducting weekly observations of water quality and algal parameters at these monitoring stations. The water-quality data included water temperature (WT) (degrees Celsius), pH, dissolved oxygen (DO) (milligrams per liter), biochemical oxygen demand (BOD) (milligrams per liter), chemical oxygen demand (COD) (milligrams per liter), suspended solids (SS) (milligrams per liter), total nitrogen (TN) (milligrams per liter), total phosphorus (TP) (milligrams per liter), and total organic carbon (TOC) (milligrams per liter). The algae data included chlorophyll-a (Chl-a) (milligrams per cubic meter) and cyanobacteria (cells per milliliter). These data can be obtained from the Water Environment Information System operated by the Ministry of Environment (n.d.).
The meteorological observation stations located near the weirs along the Nakdong River include Sangju, Gumi, Daegu, Hapcheon, and Miryang. The Korea Meteorological Administration collects data from each of these meteorological observation stations every hour or every day. For this study, daily data with the closest resolution to the target data of harmful algal blooms were collected. The collected meteorological data included sea level pressure (SLP) (hectopascals), daily maximum temperature (MaxTEM) (degrees Celsius), relative humidity (RH) (percent), precipitation (PCP) (millimeters), solar radiation (SR) (megajoules per square meter), and cloud cover (CC) (1/10). The data from the meteorological observation stations can be obtained by downloading the Automated Surface Observing System (ASOS) data available on the Open MET Data Portal (Korea Meteorological Administration, n.d.) operated by the Korea Meteorological Administration (KMA). The collected data have different durations; meteorological data are available on a daily basis, and water quality and algae data are available on a weekly basis. Therefore, in this study, the daily meteorological data were transformed into a weekly resolution to match the duration of all the data. Detailed information is given in the section “Construction of Cyanobacteria Prediction Model.”

Data Preprocessing

Data preprocessing is required to ensure that negative influences do not affect the prediction results when using time-series data to construct a prediction model for cyanobacteria cell counts. After incomplete data are preprocessed, applying normalization and inputting the data into the prediction model are necessary.
Firstly, data cleaning was conducted to identify and remove missing values or outliers in the observed data. The missing values were interpolated for the daily data, whereas entire rows corresponding to the missing dates were removed for the weekly data. This decision was made because the time intervals for weekly data were relatively large, and interpolation could lead to biased and distorted data. Therefore, it was deemed more appropriate to remove the entire rows corresponding to the missing dates in the weekly data.
Secondly, data partitioning was performed to split the data into appropriate proportions for training and validation sets. According to empirical results, it is recommended to use approximately 70%–80% of the data for training and 20%–30% for validation (Gholamy et al. 2018).
Lastly, the data were transformed. By normalizing each data, the preprocessing step was carried out to align the range of the data, aiming to create an optimized model for analyzing data. For example, cyanobacteria cell counts range from 0 to 100,000 units, whereas water temperature is >35°C and TP values are between 0 and 1. Hence, each variable differs in scale, which would negatively affect the prediction results if used for training without normalization. Therefore, before training is performed, normalization must be applied to adjust the scale differences between variables and change the size of individual data to the same unit. Normalization methods include standard scaler, robust scaler, MinMaxScaler, and Normalizer. Cyanobacteria grow rapidly when the temperature and organic matter concentration conditions suitable for cyanobacteria growth in summer are met, with cell counts ranging from tens of thousands to millions even under the same environmental conditions. Therefore, rapidly increasing data may be considered to be an outlier with respect to past cyanobacteria growth patterns. In the past, cases of massive cyanobacterial blooms exceeding hundreds of thousands accounted for only approximately 5% of total observations. However, the occurrence rate is increasing gradually due to climate change and changes in river environments. In 2022, cyanoHABs of several hundred thousand cells or more appeared in the lower Nakdong River, causing algal bloom damage. Instead of such data being considered as outliers, maintaining the effect of these cases by normalizing and adjusting the scale was necessary while recognizing that these cases can occur in the actual Nakdong River environment. Additionally, the distribution characteristics of cyanobacteria that occur only in the summer should not be altered. Therefore, the MinMaxScaler method was adopted from among the several normalization methods. MinMaxScaler is a method that adjusts the scale by converting the values of each data variable with different maximum sizes to values between 0 and 1. The conversion formula is
MinMaxScaler(x)=xxminxmaxxmin
(1)
Even after normalization, the range of cyanobacteria cell counts can be high, and the data were extremely asymmetric compared with those of other variables. Learning such extremely asymmetric data can produce many errors in the results. In the harmful algae alert system, levels are distinguished in units of 1,000, 10,000, and 100,000 cells. Applying a log scale is recommended to improve the asymmetric cyanobacteria cell counts data as per the characteristics of cyanobacteria data (KEI 2020). Therefore, in this study, the cyanobacteria cell counts was normalized by using a log scale and the model was trained with these data.

Model for Cyanobacteria Simulation

Physics-Based Model: EFDC-NIER

The EFDC-NIER model is a widely used three-dimensional (3D) numerical model for analyzing hydrodynamics and water quality in various areas, such as rivers, lakes, estuaries, and oceans. It was developed by the National Institute of Environmental Research with improved environmental fluid dynamics code functions to suit domestic water conditions, and it currently is used as a water-quality prediction model for major river sections in South Korea. The EFDC-NIER model has new functions, such as weir functions for major domestic rivers, multispecies simulation for algae, vertical migration mechanisms of cyanobacteria, dormant spore formation and germination mechanisms, wind stress, and changes in nutrient release owing to changes in oxidation and reduction conditions. The EFDC-NIER model has been improved to accurately reflect flow and water-level control by using artificial hydraulic structures, such as multipurpose weirs, after the Four Major Rivers Project, thus enhancing the simulation accuracy for the changed domestic river environment. The existing EFDC model simulates algae in three separate groups (cyanobacteria, diatoms, and green algae), making the prediction of the rapid dominance and transition of specific algae species difficult. However, the EFDC-NIER model has an improved algae module that enables multispecies simulations, enabling quantitative prediction of algae occurrence, including the dominance and transition of specific algae species (Fig. 2). In this study, the EFDC-NIER model was constructed for all Nakdong River sections. Factors affecting the water balance, such as tributaries flowing into the main river, wastewater discharge from sewage treatment plants, and water intake facilities, were applied as boundary conditions to the model. For the weir sections for predicting cyanobacteria cell counts, the flow of the water body was reflected by allowing the inflow from upstream to be released downstream through the hydraulic structure module.
Fig. 2. Schematic of the reactions among multiple algal species. CHc = cyanobacteria; CHd = diatoms; CHg = green algae; CHx1–CHxn = multiple algal species; DOM = dissolved organic material; and POM = particulate organic material. [Reprinted from Ahn et al. 2021a, under CC BY 4.0 Deed Attribution 4.0 International license (http://creativecommons.org/licenses/by/4.0/).]

AI-Based Deep Learning Model: CNN-LSTM

LSTM is a model proposed by Hochreiter and Schmidhuber (1997), and it improves recurrent neural networks (RNNs) to solve problems such as gradient vanishing and exploding of the error slope when considering long-term data sets. LSTM comprises forget, input, update, and output gates, and it controls data input, storage, and output through the four gates. It is used mainly to learn continuously structured data, such as for speech pattern recognition and stock price prediction. In the water environment field, it is used widely for predicting time-series data, such as runoff (Fan et al. 2020), water level (Zhang et al. 2020), precipitation (Akbari Asanjan et al. 2018), and water quality (Hu et al. 2019; Li et al. 2020).
The CNN is an algorithm that can automatically learn features necessary for recognition, such as character, image, and object recognition, and effectively absorb morphological changes. Lecun et al. (1998) found that it demonstrated better performance than other methods in learning 2D data by successfully recognizing handwritten characters. The structure of a CNN is created by adding convolution layers and pooling layers to the basic artificial neural network (ANN) structure. The feature extraction area consists of multiple convolution and pooling layers. The convolution layer is an essential element that applies a filter to input data and reflects the activation function, extracting features (feature map) from input data through convolution (kernel). This is followed by the pooling layer, which reduces the input data size and emphasizes specific features. This significantly saves learning time and reduces overfitting, improving the CNN’s image-data-processing ability. In the last part of the CNN, a fully connected layer is added for image classification. A flattened layer converts image data into an array format, and a softmax layer, which normalizes values, is included between the image feature extraction and classification parts. CNNs are neural network models that include a preprocessing step called convolution and are primarily used in deep learning for processing image and video data. Although CNNs typically extract features from 2D layers (2D CNN) for images, they also can extract features from nonimage time-series data.

Construction of Cyanobacteria Prediction Model

Various data related to algal blooms, such as cyanobacteria, meteorological, and water-quality data, have time-series characteristics. To accurately predict cyanoHABs, the influence of data from the distant past must be considered. A LSTM model can analyze changes over time in the long term by solving the long-term dependency problem, in which the correlation and prediction power weakens as the distance between the input and output increases. Therefore, the LSTM is one of the optimal models for predicting cyanobacteria. Because cyanobacteria are living organisms, accurate prediction requires a precise understanding of the features between related data and consideration of spatiotemporal characteristics. A one-dimensional (1D) CNN (1D CNN) is used to automatically extract data features that are not visible in the time direction using convolution kernels, making it suitable for time-series applications. Zhao et al. (2021) reported that as input data pass through the layers of the CNN, they are refined into LSTM model input values that are more sensitive to time-series information.
Therefore, in this study a cyanobacteria prediction model was constructed by combining the CNN and LSTM. The first part of the CNN-LSTM model is a CNN model consisting of convolution layers and max-pooling layers. Meteorological, water-quality, and cyanobacteria data are input into the convolution layers. Convolution operations are performed on the convolution kernel weights and local sequence segments of input information to obtain a preliminary feature matrix. The feature matrix calculated from the previous convolution then is input in the pooling layers. A pooling window is slid over the sequence, taking the maximum value in each sliding window to output a more distinctive matrix. Because the input data here were 1D time-series data, a 1D CNN was constructed using the flatten function, which converted the 2D array output format in the CNN to a 1D format, and local features of the time-series data were extracted. To align the resolution of the data, daily data were transformed into weekly data. The daily weather data were passed through the CNN’s pooling layer to convert them into weekly data, taking into account the average weekly features present in the data. In the LSTM part, the LSTM architecture was configured to receive the features extracted from the CNN as input. Here, the training data were configured with the other gates of the LSTM model so that connections could be discovered in the input and output sequences. The architecture was configured to model time-series data using stacking of the LSTM network, and the cyanobacteria cell counts prediction results were output through the dense layer (Fig. 3).
Fig. 3. CNN-LSTM architecture for predicting harmful algal blooms.

Result and Discussion

Determining Major Factors Affecting Cyanobacteria Cell Counts

Variable selection is important in data-driven learning. Variables with low importance in prediction can add uncertainty to the prediction model and consequently degrade the performance of the model (Kuhn and Johnson 2013). In this study, correlation was analyzed using a data heatmap with the Seaborn library. Generally, a Pearson correlation coefficient of 0.4 or higher indicates some degree of correlation (Akoglu 2018). The absence of correlation means that each variable may not be independent but may have a nonlinear relationship; thus, determining the effect on the prediction results and controlling the influence of each variable when constructing a model will be difficult. To address this, a data set with correlated variables must be constructed to increase prediction accuracy.
In this study, the water temperature, DO, COD, TN, TOC, maximum temperature, and RH were found to be highly correlated with the cyanobacteria cell counts (Table 1). Therefore, these were selected as the main limiting factors affecting cyanobacteria occurrence. The water temperature had the most significant impact on cyanobacteria occurrence. A high water temperature aided the growth of cyanobacteria in the Nakdong River and contributed to the formation of cyanoHABs through large cyanobacteria blooms (Ha et al. 1998; Hur et al. 2013). Heavy summer rainfall results in large amounts of nonpoint pollutants, such as nitrogen and phosphorus, in the Nakdong River. This maintains a high nutrient concentration in the Nakdong River, which helps form cyanoHABs (Park et al. 2021).
Table 1. Correlation of water quality and meteorological data for cyanobacteria
VariableWeir
SJNDGMCGGGDSHCCH
WT0.590.680.730.680.690.700.650.63
pH0.100.050.020.100.160.050.010.15
DO0.550.600.630.660.700.650.560.47
COD0.340.280.310.220.190.130.240.41
SS0.170.030.040.030.060.010.050.01
T-N0.390.520.540.640.700.660.650.70
T-P0.170.160.180.070.130.030.040.01
TOC0.270.240.250.150.140.090.170.43
Chl-a0.210.060.040.170.250.270.150.00
SLP0.260.360.370.360.370.390.360.37
MaxTEM0.500.580.590.550.530.560.520.52
RH0.350.390.440.370.350.410.460.43
PCP0.060.150.090.080.020.060.120.05
SR0.040.040.040.060.030.020.050.01
CC0.020.240.230.210.200.240.280.24

Note: SJ = Sangju; ND = Nakdan; GM = Gumi; CG = Chilgok; GG = Gangjeong-Goryeong; DS = Dalseong; HC = Hapcheon-Changnyeong; and CH = Changnyeong-Haman.

Definition of Prediction Model Parameters

The aim of this study was to construct a prediction model for cyanobacteria cell counts using a CNN-LSTM model. Optimal hyperparameters must be selected to achieve the highest accuracy. Hyperparameters are parameters that influence the training of a model, such as the learning rate, hidden size, number of layers (num_layers), and dropout rate. Adjusting hyperparameter values is crucial to improve the model’s performance. However, manually tuning these hyperparameters requires significant time and effort, and finding the optimal values can be challenging. Therefore, various techniques such as Optuna, Hyperopt, KerasTuner, and so forth, recently have been used to automatically search for the optimal hyperparameter values.
In this study, the hyperparameters for the cyanobacteria cell count prediction model that yielded the highest test score among all possible combinations of the learning rate, hidden size, num_layers, and dropout rate were selected. We applied Optuna as the hyperparameter tuning technique to optimize the model parameters. Optuna is an algorithm that automatically optimizes various parameters. It automatically finds the optimal values of parameters required for training, helping to enhance learning efficiency. Optuna is based on a Bayesian optimization algorithm, which makes it more efficient in searching for optimal hyperparameters compared with other algorithms. It offers support for various optimization algorithms, including tree-structured Parzen estimator (TPE), evolution strategies (ES), and random search, among others. Additionally, Optuna can be used seamlessly with various popular libraries such as PyTorch, TensorFlow, and scikit-learn, providing flexibility and compatibility for researchers and practitioners. This versatility and efficiency make Optuna a powerful tool for hyperparameter tuning in machine learning models. Therefore, Optuna has been used widely in various AI-based deep learning models, including CNN-LSTM, to select the best parameters (Akiba et al. 2019; Ekundayo 2020). We applied the ReduceLROnPlateau scheduler as one of the important elements during training. This scheduler reduces the learning rate by 5% when the training results do not improve. By adjusting the learning rate of the optimizer dynamically using the scheduler, we initially applied a higher learning rate to facilitate faster convergence. As the training progresses, the scheduler gradually reduces the learning rate, allowing for more-precise adjustments and better convergence. This approach helps to achieve better optimization results during the training process. The results of hyperparameter tuning, optimal learning rate, hidden size, num_layers, and dropout rate for the model are presented in Table 2.
Table 2. Results of hyper-parameters for CNN-LSTM models
HyperparameterSearch rangeOptimal hyperparameter of CNN-LSTM
Learning rate0.00001–0.10.00075
Hidden size1–1282
Num_layers1–641
Dropout_rate0.0–0.5 (0.1)0.2

Results of Prediction Model Training and Validation

The input variables included the water temperature, DO, COD, TN, TOC, maximum temperature, and RH, and the output variable was cyanobacteria cell counts. The model parameters were constructed using the optimal parameters described in the section “Definition of Prediction Model Parameters.” The water quality and cyanobacteria cell count data were based on weekly data, whereas the meteorological data were based on daily data. Therefore, the resolution of each variable had to be transformed for consistency. In this study, a cyanobacteria cell count prediction model was constructed by converting daily meteorological data to weekly averages and applying consistent resolutions between variables.
The exact ratio for splitting the training and validation sets is not defined clearly, but having a training set that is too small may not provide enough data for the algorithm to learn effectively, whereas a small validation set can make it difficult to have confidence in the model. Based on the empirical results related to the ratio (Gholamy et al. 2018) and considering the limited weekly data available, we decided to use an 82 ratio for the model set, with 80% of the data allocated for training and 20% for validation. For this reason, data from 2012 to 2019 for these sites were used as training data, and data from 2020 to 2021 were used as a validation set for the trained model. The model was trained reasonably well for eight weir points in the Nakdong River, and when validated using the test data from 2020 to 2021, it accurately predicted the occurrence of cyanobacteria (Table 3). The accuracy of the model’s training and validation was evaluated using the coefficient of determination (R2), mean absolute error (MAE), and RMSE. Detailed information is presented in the Appendix.
Table 3. Results of training and validation for CNN-LSTM model
ParameterWeir
SJNDGMCGGGDSHCCH
Train R20.880.760.930.850.890.950.850.90
MAE_Train0.40.50.30.40.40.20.40.3
RMSE_Train0.50.70.40.50.50.30.60.4
Test R20.770.550.830.710.770.870.730.72
MAE_Test0.50.60.40.50.40.30.50.3
RMSE_Test0.60.90.50.70.70.40.70.4

Note: SJ = Sangju; ND = Nakdan; GM = Gumi; CG = Chilgok; GG = Gangjeong-Goryeong; DS = Dalseong; HC = Hapcheon-Changnyeong; and CH = Changnyeong-Haman.

Comparison of the Results from the Two Models

The performance of a deep-learning-based AI algorithm was compared with that of the currently used EFDC-NIER model for predicting cyanobacteria cell counts. To compare the prediction performance, the cyanobacteria cell counts for the eight weirs of the Nakdong River in 2022 were predicted (Fig. 4; Tables 4 and 5). In Korea, cyanobacteria cell counts are divided into four sections, called Harmful Algal Bloom (HAB) alert levels, and management measures for cyanoHABs are established accordingly. To evaluate the performance of the CNN-LSTM model, comparing the prediction accuracy at each level was considered to be the most suitable method for assessing the model’s applicability. The comparison of the level-by-level prediction accuracy showed that the CNN-LSTM model performed better than the EFDC-NIER model in most cases, except for Level 4 (>100,000  cells/mL) (Tables 6 and 7). By learning the characteristics of surrounding data and time-series patterns, the CNN-LSTM model simulated the observed cyanobacteria cell counts at a level very similar to the actual data and demonstrated better simulation performance than the EFDC-NIER model.
Fig. 4. Results from two models for (a) Sangju weir; (b) Nakdan weir; (c) Gumi weir; (d) Chilgok weir; (e) Gangjeong-Goryeong weir; (f) Dalseong weir; (g) Hapcheon-Changnyeong weir; and (h) Changnyeong-Haman weir.
Table 4. Cyanobacteria cell count prediction results of CNN-LSTM model and EFDC-NIER model
DateWeir
SJNDGMCG
OBSEFDC-NIERCNN-LSTMOBSEFDC-NIERCNN-LSTMOBSEFDC-NIERCNN-LSTMOBSEFDC-NIERCNN-LSTM
5/2004001900170027
5/90238131093603713
5/1600600147003610013
5/2300518502,1855,97013,3431070140
5/30128061148510523911391282145
6/755111781,055787981,6336832,1252,0175,3561,872
6/13554612,1273,7503833,1333,7662,6836,9756,0953,0828,323
6/20401833,82511,2007492,50924,0869,01018,620127,4068,964805,749
6/273451,1525924,5817,1762,8612,2365,4917,8516,86229,8067,303
7/44456,12917561,7804,1502,50513,5068,23043,2236,56829,4094,658
7/131,1681,0451,31758,0204,1551,74721,50527,41062,62013,31514,1695,438
7/186022,0011,1667,9193,4351,04166,13411,6376,99014,77437,7527,339
7/251504,30639915,9888,0341,811132,47020,88816,3521,99069,5703,145
8/16,2231,9501,7156073,5873,51520,34811,2442,56954539,7441,795
8/83,2546,5171,3551,96911,1002,6282,00939,3839724,70135,1834,801
8/221,6073,1603881,8294,2401691,9444,9201,3541,1352,9201,138
8/297,6293,7501,1392,5512,8001,3759591,3401,1673852,380788
9/1413,7014001,02314,8353001017,3633002,7409,7522002,227
9/208,2641,1001,00621,5002,17529,78516,4501,30386311,250412
9/2616,9598671,44714,5581,33399912,4151,5677,8391814,866335
10/42,3923,6335268,4493,2331,2921,5036,1833971,6386,366444
10/115602,9671128013,0008791,2753,7502794413,100359
10/171802,76761,2884,7673801,7522,8675315202,200183
10/241401756790425121,3062373406251,250395
10/312517565717571,3181503845,7846251,142

Note: SJ = Sangju; ND = Nakdan; GM = Gumi; CG = Chilgok; GG = Gangjeong-Goryeong; and OBS = observed.

Table 5. Cyanobacteria cell count prediction results of CNN-LSTM model and EFDC-NIER model
DateWeir
GGDSHCCH
OBSEFDC-NIERCNN-LSTMOBSEFDC-NIERCNN-LSTMOBSEFDC-NIERCNN-LSTMOBSEFDC-NIERCNN-LSTM
5/2002500120050055
5/9013000130385317659
5/16003700110042040313
5/2326705480011541085387201,918
5/305142650169024369703921,4721,477977
6/72,2961,5481,8028,7521,1888,96416,9164,01618,8344,7084,4434,939
6/1313,6725,10311,99638,5722,51328,01165,2325,60817,06415,4375,79922,175
6/2080,96136,23629,44450,85227,50728,03094,71323,68722,11571,96721,49735,521
6/2779,986133,02832,63733,64987,25218,36743,82771,50417,21243,49795,66529,981
7/458,08462,79522,07514,12692,1852,82042,050112,06216,39079,767109,14435,349
7/1371,51533,37725,53247,34853,5689,04237,92231,81015,46469,28146,08435,286
7/18114,73547,38137,08353,20348,14714,964123,34048,46230,48440,30844,73527,974
7/2598,59574,94531,988348,349107,81325,359165,74476,04432,906151,711150,71441,458
8/129,45468,49220,9265,800133,4582,353134,195121,71825,45093,310102,56038,217
8/832,20358,35016,93111,36397,9678,614148,64574,66733,719134,37394,73341,914
8/226,3211,2605,4215009,16094563512,8601,5425,38222,4805,138
8/291,0301,5401,5611,4258,8202,6242,6807,3604,7476,4339,68011,992
9/141,9633339121,3621,0671,3941941,1671399932,100404
9/201,16616,2008473,2445,2502,7491,5092,1751,6623,2642,0251,099
9/262405,0674376735,1331,0721,5123,4331,4843,0071,3674,514
10/41764,5332812,7532,8671,7451,4861,7331686,6342,1333,657
10/112,5101,2671,0654174335763,6642331,8665,4078002,615
10/172,5962,1678582,1751,9001,0884,8551,43317910,4763,9335,476
10/241,5358257362,2551,3001,6121,4132,425681,8082,525764
10/315,0313501,5804,5573752,0691,3591,300661,5591,450695

Note: GG = Gangjeong-Goryeong; DS = Dalseong; HC = Hapcheon-Changnyeong; CH = Changnyeong-Haman; and OBS = observed.

Table 6. Prediction accuracy of EFDC-NIER by HAB alert level (%)
Alert levelWeirAverage
SJNDGMCGGGDSHCCH
Level 1443138264839423239
Level 2636767335661683956
Level 314637715939522838
Level 41700100507549
Average493646355249534145

Note: SJ = Sangju; ND = Nakdan; GM = Gumi; CG = Chilgok; GG = Gangjeong-Goryeong; DS = Dalseong; HC = Hapcheon-Changnyeong; and CH = Changnyeong-Haman.

Table 7. Prediction accuracy of CNN-LSTM by HAB alert level (%)
Alert levelWeirAverage
SJNDGM (%)CG (%)GG (%)DS (%)HC (%)CH (%)
Level 181788092100861008087
Level 28375468950100505669
Level 300430100571008848
Level 40100000016.7
Average755450837979676769

Note: SJ = Sangju; ND = Nakdan; GM = Gumi; CG = Chilgok; GG = Gangjeong-Goryeong; DS = Dalseong; HC = Hapcheon-Changnyeong; and CH = Changnyeong-Haman.

Discussion

Limitation of the CNN-LSTM Model

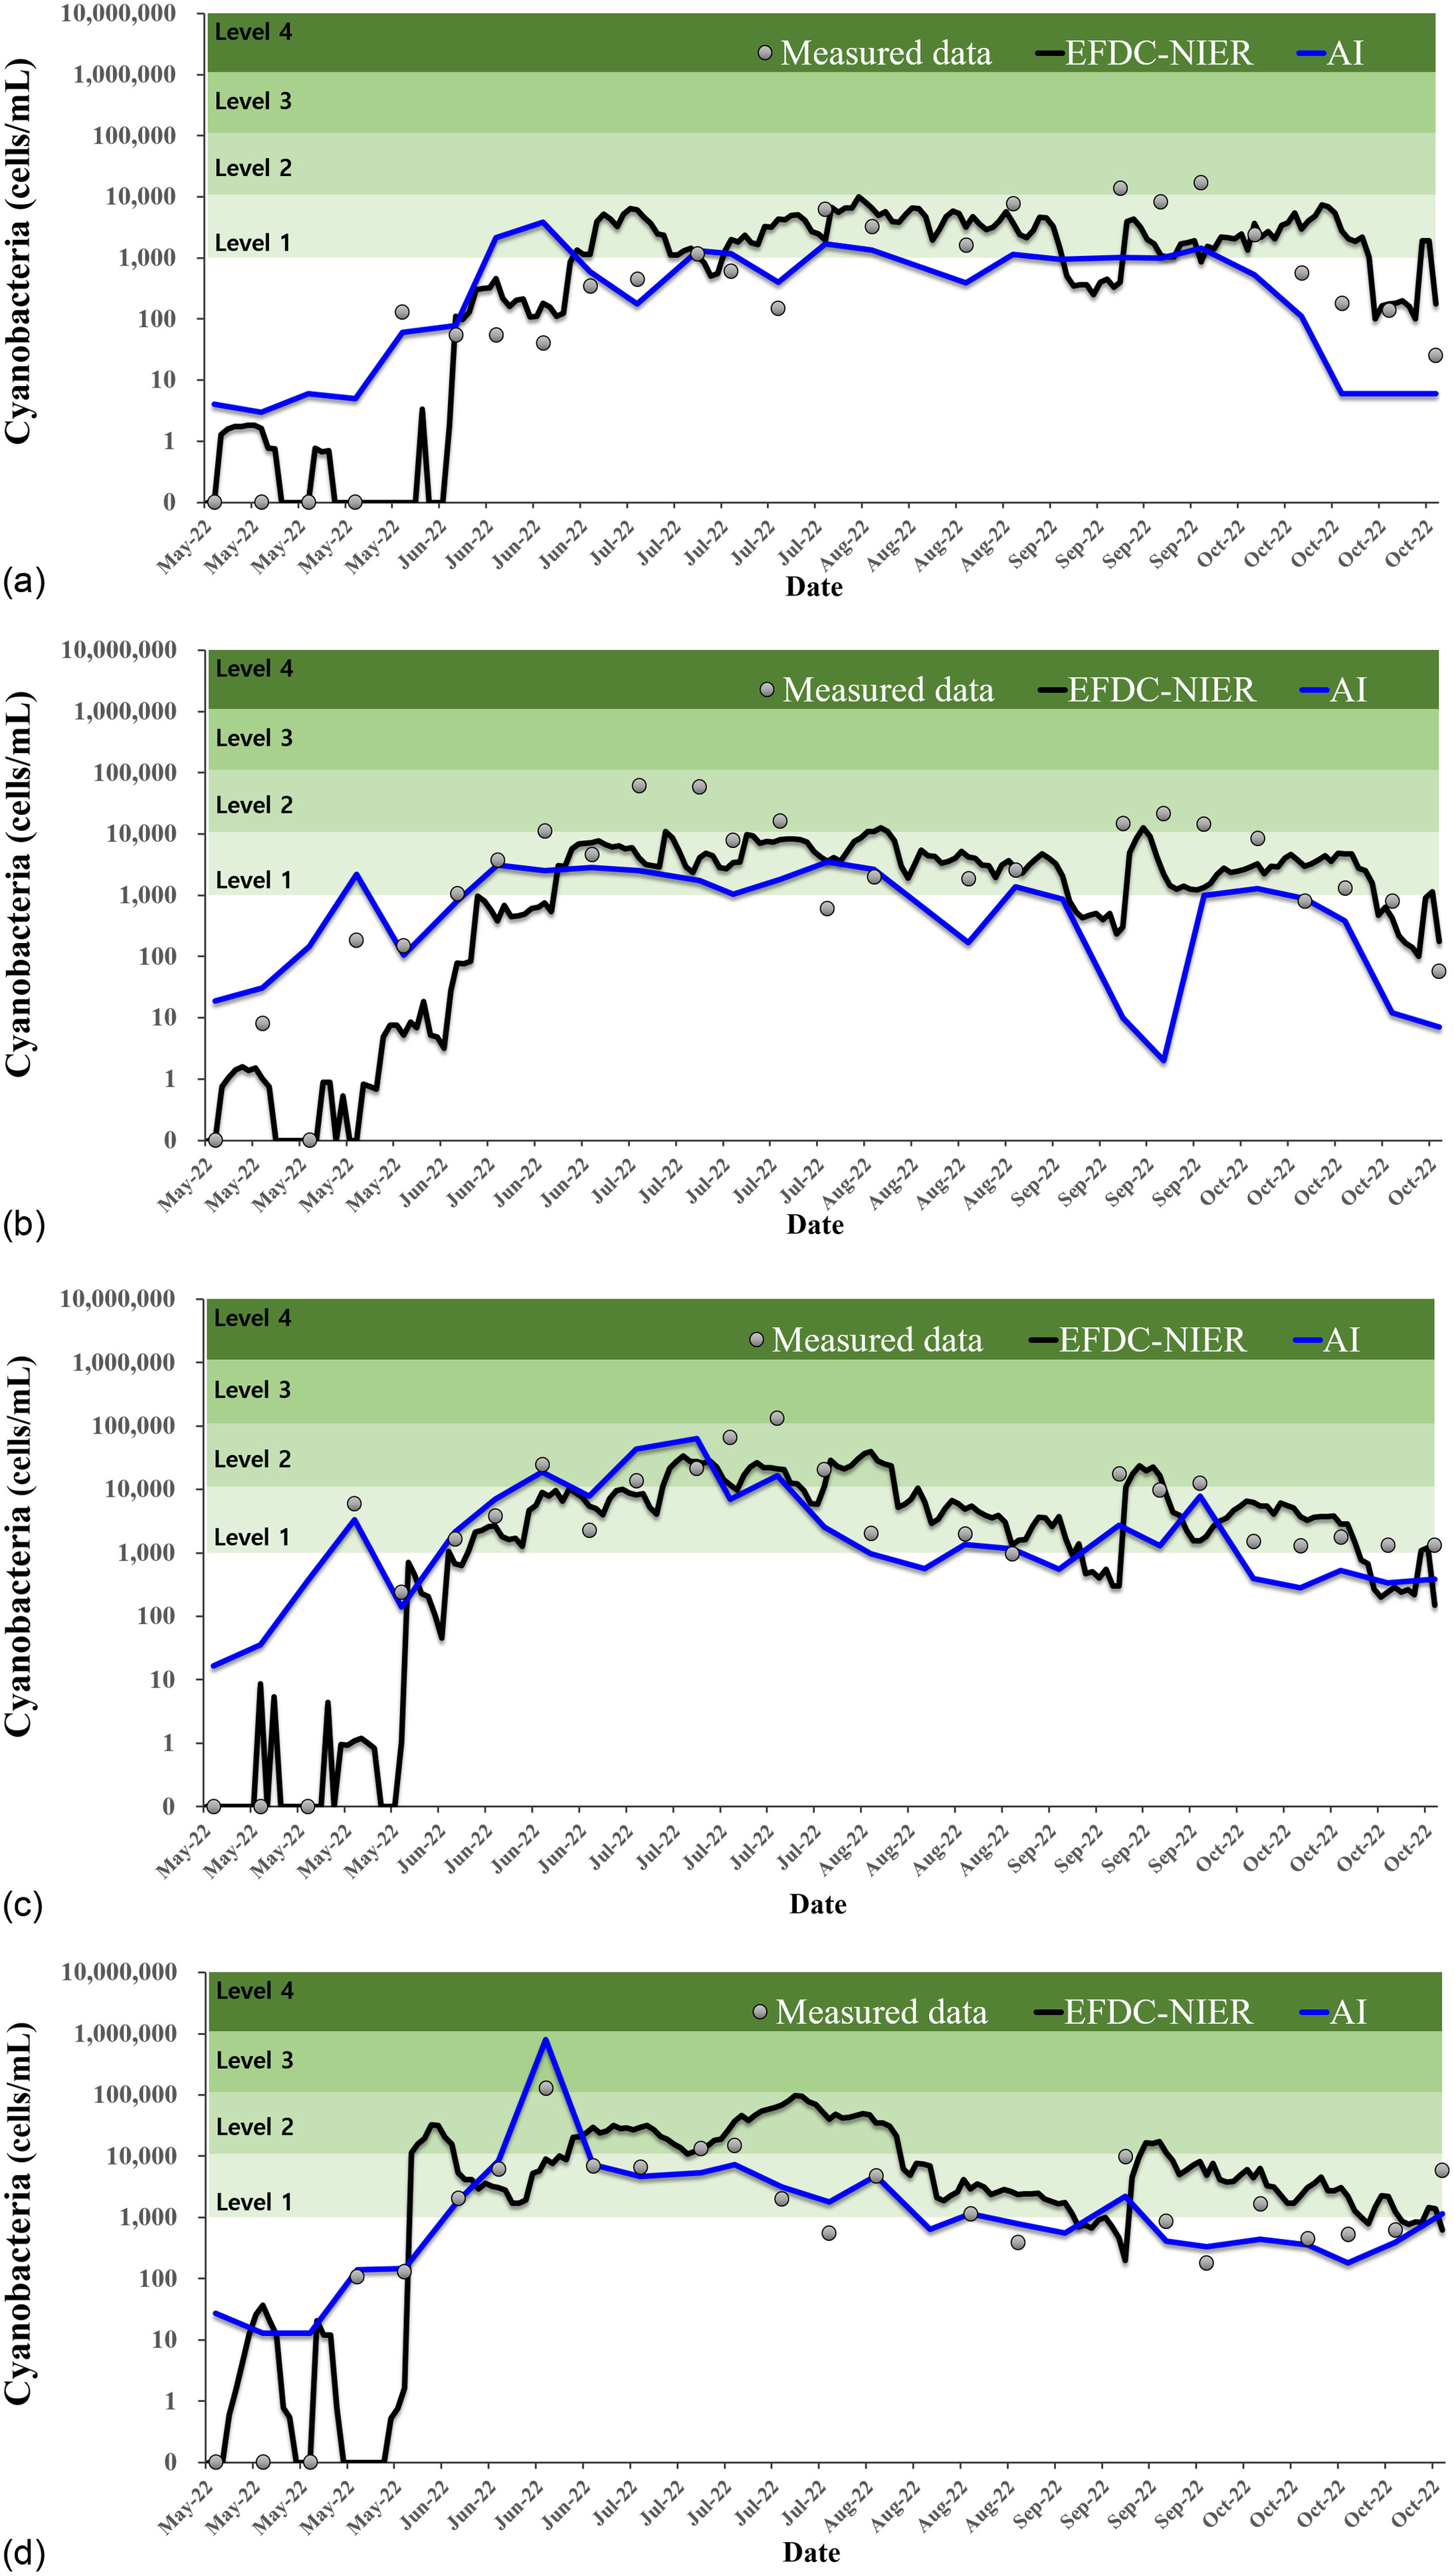
The comparison of the two models showed that the CNN-LSTM model outperformed the EFDC-NIER model overall. However, the CNN-LSTM prediction had a major limitation. The predictive power was significantly low for Level 4 (>100,000  cells/mL). If the HAB alert is at Level 3 (10,000100,000  cells/mL) or Level 4, cyanoHABs have occurred and an alert has been issued. At Level 4, special management is required owing to the severe cyanoHAB levels. From this perspective, the CNN-LSTM model with lower predictive power in Level 4 than the existing EFDC-NIER model can be considered to be a significant limitation in terms of managing cyanoHABs.
The first cause of this limitation is the overfitting problem. To prevent this overfitting problem, a dropout rate of 0.2 was set in this study (Shah et al. 2018). However, the amount of training data for Level 4 was very inadequate compared with that for the other levels. Consequently, although highly accurate training results were obtained, the accuracy in the prediction interval decreased because of overfitting.
The second cause is that the pattern of cyanobacteria occurrence in 2022 was different from that in the past. In 2022, a severe drought and heat wave occurred in the Nakdong River Basin. In particular, Gyeongsangbuk-do and Gyeongsangnam-do, where the Nakdong River is located, experienced the lowest number of rainy days in the last 10 years, according to the Korea Meteorological Administration’s climate information portal.
As a result, since 2018, the worst cyanoHABs occurred in 2022. In particular, for the first time since monitoring began, Gumi Weir in the upstream area of the Nakdong River had cyanobacteria cell counts of more than 100,000  cell/mL in 2022. This is a substantially different phenomenon from past patterns, in which a large amount of cyanobacteria was not observed in the upper reaches.
The CNN-LSTM is a technique for predicting the future by learning past time-series patterns. Therefore, the predictive power may be lower for future patterns that have not occurred in the past. Deep-learning models, such as the CNN-LSTM, are black box models in which AI autonomously extracts desired information without specifying complex multidimensional data by users (Sengupta et al. 2020). Understanding the learning process of these deep-learning algorithms is difficult, making the identification of the causes that affect uncertainty challenging. By contrast, physics-based models, such as the EFDC-NIER model, can simulate HABs using well-defined equations and mathematical theories.

Applicability of AI-Based Deep Learning Models in the Prediction of Cyanobacteria Cell Counts

Although the CNN-LSTM model has limitations, it demonstrated excellent performance in predicting cyanobacteria cell counts. It achieved results that are comparable to or slightly better than those of the physics-based models, such as the EFDC-NIER model, while significantly reducing the analysis time. In general, cyanobacteria cell counts are predicted by collecting real-time measurement data in the morning and analyzing them; then forecasters make a prediction in the afternoon based on the results. However, the construction of input data for the EFDC-NIER model requires a considerable amount of time, and the analysis takes several hours or more. Moreover, human errors or incorrect model designs can lead to situations in which the results cannot be produced within the deadline. The CNN-LSTM model provides the advantage of having a prediction time of a few minutes. Therefore, even if an error is present in the input data configuration, it can be reanalyzed easily. In addition, CNN-LSTM models have the advantage of being analyzed easily even by nonexperts. The EFDC-NIER and other physics-based models typically rely heavily on the model’s structure and parameters (Jiang et al. 2018; Su et al. 2018). Therefore, building such models and adjusting the parameters require substantial expertise. In contrast, data-driven models, such as CNN-LSTM, can easily construct input data, making them accessible to the general public.

Proposing a Direction for the Research on AI-Based Deep Learning Models in the Prediction of Cyanobacteria Cell Counts

The recent trend of the various developments and advancements in AI algorithms has revealed that the application of deep-learning-based AI technology in the management of cyanoHABs is inevitable. This paper presents both the positive aspects and limitations of deep-learning-based AI technology. Measures that can be taken to overcome the limitations and apply deep-learning-based AI technology to cyanoHABs management are as follows.
Through comparison with the results of the physics-based model, the AI-based deep learning model demonstrated the capability to construct rapid models and predict cyanobacteria cell counts based on data statistics even in situations with limited prior knowledge. In situations in which there are sufficient data, the AI-based deep learning model has shown comparable or better results than the physics-based model, especially in cases with low cyanobacteria cell counts. However, in cases in which data are limited, the AI-based deep learning model demonstrated lower predictive performance for new data, because it may not capture the relationships between input and output variables sufficiently, particularly in cases with high cyanobacteria cell counts. The findings of this study provide evidence that there is a need for the complementary use of the physics-based model and the AI-based deep learning model.
AI-based deep learning models allow for rapid model construction and predictions based on data statistics even in situations with limited prior knowledge. However, they can be challenging to interpret physically, and their reliability may be dependent on the conditions included in the training data, exhibiting a tendency to rely heavily on the provided data (von Stosch et al. 2014). Conversely, physics-based models, grounded in first principles, focus on learning interpretable causal relationships between input and output variables, aiming to understand the physical world. These models significantly advance the understanding of various phenomena in fields such as material balances, fluid dynamics, and reactor kinetics, thereby addressing the limitations of AI-based deep learning models mentioned earlier. Physics-based models offer the advantage of providing a deeper understanding of the physical world, and can complement the drawbacks associated with AI-based deep learning models (Daw et al. 2021). Physics-based models also may face challenges in model construction due to insufficient prior knowledge or complex mechanisms (von Stosch et al. 2014; Jeong et al. 2023). The drawbacks associated with physics-based models can be complemented by AI-based deep learning models. Therefore, AI-based deep learning models and physics-based models possess distinct characteristics and have the potential to mutually complement each other’s limitations, because they offer unique strengths that can address the weaknesses of the other (Aykol et al. 2021).
To overcome the limitations of AI-based deep learning models, as a general solution, collecting and constructing more input data for the model can be effective. This is not an easy task, considering the substantial budget and effort required to collect and observe data. However, by applying the concept of hybridization, combining the strengths of both AI-based deep learning models and physics-based models, it is possible to address these challenges and find solutions. A well-calibrated physics-based model can predict cyanobacteria cell counts accurately at Level 4 because of its internal mechanisms and various parameters, even with limited data. In addition, it can be used to analyze scenarios that did not exist in the past, such as dam and weir operations in rivers, virtual climate scenarios, and water intake in river. If the simulated results are utilized in a AI-based deep learning model, they can complement the shortage of input data and partially solve the problem of overfitting. This approach, which has been proposed widely in recent research, takes advantage of the clear boundaries between AI-based deep learning models and physics-based models (Vo et al. 2022; Jung et al. 2023). As a result, it allows for the application of existing methodologies specific to each model type. This hybrid method harnesses the unique strengths of both approaches, enabling a more versatile and effective solution that can accommodate different modeling requirements and enhance overall predictive capabilities (von Stosch et al. 2014; Aykol et al. 2021). The fusion of these models can lead to a more robust and comprehensive approach, offering improved predictive capabilities and a better understanding of complex systems while overcoming data limitations in certain scenarios.
A direct combination of the two models, not just a simple fusion concept, also can serve as an alternative to overcome limitations. This hybrid model, by integrating both models directly, has the potential to address the drawbacks effectively. Because examples of combining hydrological analysis with deep learning exist in the field of hydrology (Maraun et al. 2017; De Luca et al. 2020), combining the mechanisms of cyanobacterial growth, proliferation, and extinction with deep-learning-based AI algorithms seems possible. In this concept, the hybrid model can incorporate a loss function that reflects the physical laws present in the physics-based model. This enables the AI-based deep learning model’s predictions to be controlled, ensuring that they do not violate the physical laws (Wang et al. 2019). One of the key advantages of this approach is that it allows for the interpretation of predictive results in a physically meaningful way, leveraging the benefits of both models.
However, when applying this hybrid concept, if the accuracy of the predictions from the physics-based model is not sufficiently ensured, using them as inputs for the AI-based deep learning model can lead to increased uncertainty in the results. Therefore, to ensure the accuracy and reliability of the results, further research is needed on the calibration of parameters in the physics-based model. Additionally, efficient deep learning algorithm structures need to be developed to incorporate the mechanisms and processes, such as the physical laws present in the physics-based model, into the algorithms of the AI-based deep learning model. Such efforts are essential to enhance the overall performance and effectiveness of the hybrid approach.

Conclusion

In this study, a deep-learning-based AI technique (CNN-LSTM) that recently has been applied in various fields was used to predict the cyanobacteria cell counts. The results were compared with those obtained from a physics-based model (EFDC-NIER) that commonly is used in cyanobacterial analysis, to evaluate the applicability of deep-learning-based AI techniques in predicting harmful cyanobacteria. Directions for future research on the prediction of harmful cyanobacteria using deep-learning-based AI techniques were suggested.
The conclusions of this study are as follows:
1.
For the period 2012–2021, a CNN-LSTM model was constructed for eight weir sites along the Nakdong River. The cyanobacteria cell counts in 2022 were predicted by using both the CNN-LSTM and EFDC-NIER models. Overall, the prediction results of the CNN-LSTM model had a similar level of prediction accuracy as the EFDC-NIER model.
2.
Although the CNN-LSTM model exhibited excellent prediction performance, it had a limitation in that its predictive power for Level 4 (in which the cyanoHABs are very severe), which had a relatively lesser amount of training data, was low. Therefore, AI-based deep learning models currently are considered to be unable to completely replace physics-based models.
3.
As more data are accumulated and algorithms become more advanced in the future, the accuracy of AI-based deep learning models will be improved further. Currently, water quality and cyanobacteria data are being observed and developed continually, and deep learning algorithms for predicting time-series data, such as water quality and cyanobacteria, are evolving continually. Deep learning algorithms may become a new and effective way for researchers to analyze and predict cyanobacteria. Therefore, the prediction model for cyanobacteria cell counts should evolve into a hybrid concept that combines the advantages of AI-based deep learning models and physics-based models.

Appendix. AI-Based Deep Learning Model Performance Evaluation Metrics

The coefficient of determination, R2, indicates how well the predictive value explains the measured value, and the higher the value of R2, the higher is the prediction accuracy. MAE is the difference between estimated and measured values, and RMSE is an error metric used to assess the difference between the estimated and measured values. The lower the MAE and RMSE values of a prediction model, the higher is the prediction performance of the model
R2=1(SSRSST)
SST=i=1n(yiy¯i)2
SSR=i=1n(yiy^i)2
MAE=i=1n|yiy¯i|
RMSE=(1n)i=1n(yiy^i)2

Data Availability Statement

All data, models, or code that support the findings of this study are available from the corresponding author upon reasonable request.

Acknowledgments

This study was supported by a Grant (NIER-2023-01-01-097) from the National Institute of Environmental Research (NIER), which is funded by the Ministry of Environment (MOE) of the Republic of Korea.

References

Ahn, J. M., B. Kim, J. Jong, G. Nam, L. J. Park, S. Park, T. Kang, J.-K. Lee, and J. Kim. 2021a. “Predicting cyanobacterial blooms using hyperspectral images in a regulated river.” Sensors 21 (2): 530. https://doi.org/10.3390/s21020530.
Ahn, J. M., H. Kim, J. G. Cho, T. Kang, Y.-S. Kim, and J. Kim. 2021b. “Parallelization of a 3-dimensional hydrodynamics model using a hybrid method with MPI and OpenMP.” Processes 9 (9): 1548. https://doi.org/10.3390/pr9091548.
Ahn, J. M., J. Kim, L. J. Park, J. Jeon, J. Jong, J.-H. Min, and T. Kang. 2021c. “Predicting cyanobacterial harmful algal blooms (CyanoHABs) in a regulated river using a revised EFDC model.” Water 13 (4): 439. https://doi.org/10.3390/w13040439.
Akbari Asanjan, A., T. Yang, K. Hsu, S. Sorooshian, J. Lin, and Q. Peng. 2018. “Short-term precipitation forecast based on the PERSIANN system and LSTM recurrent neural networks.” J. Geophys. Res.: Atmos. 123 (22): 12543–12554. https://doi.org/10.1029/2018JD028375.
Akiba, T., S. Sano, T. Yanase, T. Ohta, and M. Koyama. 2019. “Optuna: A next-generation hyperparameter optimization framework.” In Proc., 25th ACM SIGKDD Int. Conf. on Knowledge Discovery and Data Mining, 1–10. New York: Association for Computing Machinery. https://doi.org/10.48550/arXiv.1907.10902.
Akoglu, H. 2018. “User’s guide to correlation coefficients.” Turk. J. Emerg. Med. 18 (3): 91–93. https://doi.org/10.1016/j.tjem.2018.08.001.
Aykol, M., C. B. Gopal, A. Anapolsky, P. K. Herring, B. van Vlijmen, M. D. Berliner, M. Z. Bazant, R. D. Braatz, W. C. Chueh, and B. D. Storey. 2021. “Perspective—Combining physics and machine learning to predict battery lifetime.” J. Electrochem. Soc. 168 (3): 030525. https://doi.org/10.1149/1945-7111/abec55.
Cao, H., L. Han, and L. Li. 2022. “A deep learning method for cyanobacterial harmful algae blooms prediction in Taihu Lake, China.” Harmful Algae 113 (Mar): 102189. https://doi.org/10.1016/j.hal.2022.102189.
Chen, Y., L. Song, Y. Liu, L. Yang, and D. Li. 2020. “A review of the artificial neural network models for water quality prediction.” Atmosphere 10 (17): 5776. https://doi.org/10.3390/app10175776.
Coad, P., B. Cathers, J. E. Ball, and R. Kadluczka. 2014. “Proactive management of estuarine algal blooms using an automated monitoring buoy coupled with an artificial neural network.” Environ. Modell. Software 61 (Nov): 393–409. https://doi.org/10.1016/j.envsoft.2014.07.011.
Daw, A., A. Karpatne, W. Watkins, J. Read, and V. Kumar. 2021. “Physics-guided neural networks (PGNN): An application in lake temperature modeling.” Preprint, submitted October 31, 2017. http://arxiv.org/abs/1710.11431.
De Luca, D. L., A. Petroselli, and L. Galasso. 2020. “A transient stochastic rainfall generator for climate changes analysis at hydrological scales in Central Italy.” Atmosphere 11 (12): 1292. https://doi.org/10.3390/atmos11121292.
Ekundayo, I. 2020. “OPTUNA optimization based CNN-LSTM model for predicting electric power consumption.” Master’s thesis, Master of Science in Data Analytics, National College of Ireland.
Fan, H., M. Jiang, L. Xu, H. Zhu, J. Cheng, and J. Jiang. 2020. “Comparison of long short term memory networks and the hydrological model in runoff simulation.” Water 12 (1): 175. https://doi.org/10.3390/w12010175.
Gholamy, A., V. Kreinovich, and O. Kosheleva. 2018. Why 70/30 or 80/20 relation between training and testing sets: A pedagogical explanation. Rep. No. UTEP-CS-18-09. El Paso, TX: Univ. of Texas at El Paso.
Ha, K., H. W. Kim, and G. J. Joo. 1998. “The phytoplankton succession in the lower part of hypertrophic Nakdong River (Mulgum), South Korea.” Hydrobiologia 369 (Jun): 217–227. https://doi.org/10.1023/A:1017067809089.
Han, H., Y. Li, and X. Zhu. 2019. “Convolutional neural network learning for generic data classification.” Inf. Sci. 477 (Mar): 448–465. https://doi.org/10.1016/j.ins.2018.10.053.
Hill, P. R., A. Kumar, M. Temimi, and D. R. Bull. 2020. “HABNet: Machine learning, remote sensing-based detection of harmful algal blooms.” IEEE J. Sel. Top. Appl. Earth Obs. Remote Sens. 13 (Jun): 3229–3239. https://doi.org/10.1109/JSTARS.2020.3001445.
Hochreiter, S., and J. Schmidhuber. 1997. “Long short-term memory.” Neural Comput. 9 (8): 1735–1780. https://doi.org/10.1162/neco.1997.9.8.1735.
Hu, Z., Y. Zhang, Y. Zhao, M. Xie, J. Zhong, Z. Tu, and J. Liu. 2019. “A water quality prediction method based on the deep LSTM network considering correlation in smart mariculture.” Harmful Algae 81 (6): 59–68. https://doi.org/10.3390/s19061420.
Huisman, J., J. Sharples, J. M. Stroom, P. M. Visser, W. E. A. Kardinaal, J. M. H. Verspagen, and B. Sommeijer. 2004. “Changes in turbulent mixing shift competition for light between phytoplankton species.” Ecology 85 (11): 2960–2970. https://doi.org/10.1890/03-0763.
Hur, M., I. Lee, B. M. Tak, H. J. Lee, J. J. Yu, S. U. Cheon, and B. S. Kim. 2013. “Temporal shifts in cyanobacterial communities at different sites on the Nakdong River in Korea.” Water Res. 47 (19): 6973–6982. https://doi.org/10.1016/j.watres.2013.09.058.
Hwang, C.-H., and K.-W. Shin. 2020. “CNN-LSTM combination method for improving particular matter contamination (PM2.5) prediction accuracy.” J. Korea Inst. Inf. Commun. Eng. 24 (1): 57–64. https://doi.org/10.6109/jkiice.2020.24.1.57.
Jeong, S. R., J. H. Park, J. H. Lee, P. R. Jeon, and C. H. Lee. 2023. “Review of the adsorption equilibria of CO2, CH4, and their mixture on coals and shales at high pressures for enhanced CH4 recovery and CO2 sequestration.” Fluid Phase Equilib. 564 (Jan): 113591. https://doi.org/10.1016/j.fluid.2022.113591.
Jiang, L., Y. Li, X. Zhao, M. Tillotson, W. Wang, S. Zhang, L. Sarpong, Q. Asmaa, and B. Pan. 2018. “Parameter uncertainty and sensitivity analysis of water quality model in Lake Taihu, China.” Ecol. Modell. 375 (May): 1–12. https://doi.org/10.1016/j.ecolmodel.2018.02.014.
Jung, M. Y., J. H. Chang, M. Oh, and C.-H. Lee. 2023. “Dynamic model and deep neural network-based surrogate model to predict dynamic behaviors and steady-state performance of solid propellant combustion.” Combust. Flame 250 (Apr): 112649. https://doi.org/10.1016/j.combustflame.2023.112649.
KEI (Korea Environment Institute). 2020. Development and application of algal bloom using artificial intelligence deep learning. [In Korean.] Sejong, Korea: KEI.
Kim, Y. W., T. Kim, J. Shin, B. Go, M. Lee, J. Lee, J. Koo, K. H. Cho, and Y. Cha. 2021. “Forecasting abrupt depletion of dissolved oxygen in urban streams using discontinuously measured hourly time-series data.” Water Resour. Res. 57 (4): e2020WR029188. https://doi.org/10.1029/2020WR029188.
Korea Meteorological Administration. n.d. “Open MET data portal.” Accessed June 7, 2022. https://data.kma.go.kr.
Kuhn, M., and K. Johnson. 2013. Applied predictive modelling. Berlin: Springer.
LeCun, Y., L. Bottou, Y. Bengio, and P. Haffner. 1998. “Gradient-based learning applied to document recognition.” Proc. IEEE 86 (11): 2278–2324. https://doi.org/10.1109/5.726791.
Lee, S., and D. Lee. 2018. “Improved prediction of harmful algal blooms in four major South Korea’s rivers using deep learning models.” Int. J. Environ. Res. Public Health 15 (Jun): 1322. https://doi.org/10.3390/ijerph15071322.
Lek, S., and Y. S. Park. 2008. “Artificial neural networks.” In Encyclopedia of ecology five-volume set, 237–245. Amsterdam, Netherlands: Elsevier. https://doi.org/10.1016/B978-008045405-4.00173-7.
Li, S., G. Xie, J. Ren, L. Guo, Y. Yang, and X. Xu. 2020. “Urban PM2.5 concentration prediction via attention-based CNN-LSTM.” Harmful Algae 91 (6): 101731. https://doi.org/10.3390/app10061953.
Liang, Z., R. Zou, X. Chen, T. Ren, H. Su, and Y. Liu. 2020. “Simulate the forecast capacity of a complicated water quality model using the long short-term memory approach.” J. Hydrol. 581 (Feb): 124432. https://doi.org/10.1016/j.jhydrol.2019.124432.
Maier, H., G. Dandy, and M. Burch. 1998. “Use of artificial neural networks for modelling cyanobacteria Anabaena spp. in the River Murray, South Australia.” Ecol. Modell. 105 (2–3): 257–272. https://doi.org/10.1016/S0304-3800(97)00161-0.
Maraun, D., et al. 2017. “Towards process-informed bias correction of climate change simulations.” Nature Clim. Change 7 (11): 764–773. https://doi.org/10.1038/nclimate3418.
McAvoy, D., P. Masscheleyn, C. Peng, S. Morrall, A. Casilla, J. Lim, and E. Gregorio. 2003. “Risk assessment approach for untreated wastewater using the QUAL2E water quality model.” Chemosphere 52 (1): 55–66. https://doi.org/10.1016/S0045-6535(03)00270-4.
Ministry of Environment. n.d. “Water environment information system.” Accessed August 15, 2023. https://water.nier.go.kr/web.
Miotto, R., F. Wang, S. Wang, X. Jiang, and J. T. Dudley. 2018. “Deep learning for healthcare: Review, opportunities and challenges.” Brief Bioinf. 19 (6): 1236–1246. https://doi.org/10.1093/bib/bbx044.
Naghdi, K., M. Moradi, M. Rahimzadegan, K. Kabiri, and M. Rowshan Tabari. 2020. “Quantitative modeling of cyanobacterial concentration using MODIS imagery in the Southern Caspian Sea.” J. Great Lakes Res. 46 (Jun): 1251–1261. https://doi.org/10.1016/j.jglr.2020.07.003.
NIER (National Institute of Environmental Research). 2020. Operating manual of harmful algae alert system. [In Korean.] Incheon, Korea: NIER.
Park, H. K., H. J. Lee, J. Heo, J. H. Yun, Y. J. Kim, H. M. Kim, D. G. Hong, and I. J. Lee. 2021. “Deciphering the key factors determining spatio-temporal heterogeneity of cyanobacterial bloom dynamics in the Nakdong River with consecutive large weirs.” Sci. Total Environ. 755 (Feb): 143079. https://doi.org/10.1016/j.scitotenv.2020.143079.
Pavagadhi, S., and R. Balasubramanian. 2013. “Toxicological evaluation of microcystins in aquatic fish species: Current knowledge and future directions.” Aquat. Toxicol. 142–143 (Oct): 1–16. https://doi.org/10.1016/j.aquatox.2013.07.010.
Preece, E. P., F. J. Hardy, B. C. Moore, and M. Bryan. 2017. “A review of microcystin detections in Estuarine and Marine waters: Environmental implications and human health risk.” Harmful Algae 61 (Jan): 31–45. https://doi.org/10.1016/j.hal.2016.11.006.
Pyo, J., L. J. Park, Y. Pachepsky, S. S. Baek, K. Kim, and K. H. Cho. 2020. “Using convolutional neural network for predicting cyanobacteria concentrations in river water.” Water Res. 186 (Nov): 116349. https://doi.org/10.1016/j.watres.2020.116349.
Schmidt, J. R., M. Shaskus, J. F. Estenik, C. Oesch, R. Khidekel, and G. L. Boyer. 2013. “Variations in the microcystin content of different fish species collected from a eutrophic lake.” Toxins 5 (5): 992–1009. https://doi.org/10.3390/toxins5050992.
Sengupta, S., S. Basak, S. Saikia, S. Paul, V. Tsalavoutis, F. D. Atiah, V. Ravi, R. Alan, and P. Ii. 2020. “A review of deep learning with special emphasis on architectures applications and recent trends.” Knowledge-Based Syst. 194 (Apr): 105596. https://doi.org/10.1016/j.knosys.2020.105596.
Shah, D., W. Campbell, and F. H. Zulkernine. 2018. “A comparative study of LSTM and DNN for stock market forecasting.” In Proc., IEEE Int. Conf. on Big Data. New York: IEEE. https://doi.org/10.1109/BigData.2018.8622462.
Shin, J., S. M. Kim, Y. B. Son, K. Kim, and J.-H. Ryu. 2019. “Early prediction of Margalefidinium polykrikoides bloom using a LSTM neural network model in the South Sea of Korea.” J. Coastal Res. 90 (Sep): 236–242. https://doi.org/10.2112/SI90-029.1.
Su, J., X. Du, and X. Li. 2018. “Developing a non-point source P loss indicator in R and its parameter uncertainty assessment using GLUE: A case study in Northern China.” Environ. Sci. Pollut. Res. Int. 25 (Jul): 21070–21085. https://doi.org/10.1007/s11356-018-2113-0.
Velo-Suarez, L., and J. C. Gutierrez-Estrada. 2007. “Artificial neural network approaches to one-step weekly prediction of Dinophysis acuminata blooms in Huelva (Western Andalucía, Spain).” Harmful Algae 6 (3): 361–371. https://doi.org/10.1016/j.hal.2006.11.002.
Vo, N. D., J.-H. Kang, D.-H. Oh, M. Y. Jung, K. Chung, and C.-H. Lee. 2022. “Sensitivity analysis and artificial neural network-based optimization for low-carbon H2 production via a sorption-enhanced steam methane reforming (SESMR) process integrated with separation process.” Int. J. Hydrogen Energy 47 (2): 820–847. https://doi.org/10.1016/j.ijhydene.2021.10.053.
von Stosch, M., R. Oliveira, J. Peres, and S. Feyo de Azevedo. 2014. “Hybrid semi-parametric modeling in process systems engineering: Past, present and future.” Comput. Chem. Eng. 60 (Aug): 86–101. https://doi.org/10.1016/j.compchemeng.2013.08.008.
Wan, H., S. Guo, K. Yin, X. Liang, and Y. Lin. 2020. “CTS-LSTM: LSTM-based neural networks for correlatedtime series prediction.” Knowl.-Based Syst. 191 (Mar): 105239. https://doi.org/10.1016/j.knosys.2019.105239.
Wang, Y., J. M. L. Ribeiro, and P. Tiwary. 2019. “Past–future information bottleneck for sampling molecular reaction coordinate simultaneously with thermodynamics and kinetics.” Nat. Commun. 10 (1): 3573. https://doi.org/10.1038/s41467-019-11405-4.
Xia, T., Y. Song, Y. Zheng, E. Pan, and L. Xi. 2020. “An ensemble framework based on convolutional bi-directional LSTM with multiple time windows for remaining useful life estimation.” Comput. Ind. 115 (Feb): 103182. https://doi.org/10.1016/j.compind.2019.103182.
Xiao, X., J. He, H. Huang, T. Miller, G. Christakos, E. Reichwaldt, A. Ghadouani, S. Lin, X. Xu, and J. Shi. 2017. “A novel single-parameter approach for forecasting algal blooms.” Water Res. 108 (Jan): 222–231. https://doi.org/10.1016/j.watres.2016.10.076.
Yim, I., J. Shin, H. Lee, S. Park, G. Nam, T. Kang, and K. H. Cho. 2019. “Deep learning-based retrieval of cyanobacteria pigment in inland water for in-situ and airborne hyperspectral data.” Ecol. Indic. 110 (Mar): 105879. https://doi.org/10.1016/j.ecolind.2019.105879.
Zhang, J., X. Wang, C. Zhao, W. Bai, J. Shen, Y. Li, Z. Pan, and Y. Duan. 2020. “Application of cost-sensitive LSTM in water level prediction for nuclear reactor pressurizer.” Nucl. Eng. Technol. 52 (7): 1429–1435. https://doi.org/10.1016/j.net.2019.12.025.
Zhang, Y., J. J. Huang, L. Chen, and Q. Lan. 2015. “Eutrophication forecasting and management by artificial neural network: A case study at Yuqiao Reservoir in North China.” J. Hydroinf. 17 (4): 679–695. https://doi.org/10.2166/hydro.2015.115.
Zhao, F., Z. Liang, Q. Zhang, D. Seng, and X. Chen. 2021. “Research on PM2.5 spatiotemporal forecasting model based on LSTM neural network.” Comput. Intell. Neurosci. 2021 (1): 1616806. https://doi.org/10.1155/2021/1616806.
Zheng, L., H. Wang, C. Liu, S. Zhang, A. Ding, E. Xie, J. Li, and S. Wang. 2021. “Prediction of harmful algal blooms in large water bodies using the combined EFDC and LSTM models.” J. Environ. Manage. 295 (Apr): 113060. https://doi.org/10.1016/j.jenvman.2021.113060.

Information & Authors

Information

Published In

Go to Journal of Environmental Engineering
Journal of Environmental Engineering
Volume 150Issue 5May 2024

History

Received: May 3, 2023
Accepted: Oct 1, 2023
Published online: Feb 23, 2024
Published in print: May 1, 2024
Discussion open until: Jul 23, 2024

ASCE Technical Topics:

Authors

Affiliations

Jungwook Kim [email protected]
Researcher, Water Quality Assessment Research Division, Dept. of Water Environment Research, National Institute of Environment Research, Incheon 22689, Korea. Email: [email protected]
Hongtae Kim [email protected]
Senior Researcher, Water Quality Assessment Research Division, Dept. of Water Environment Research, National Institute of Environment Research, Incheon 22689, Korea. Email: [email protected]
Kyunghyun Kim [email protected]
Senior Researcher, Water Quality Assessment Research Division, Dept. of Water Environment Research, National Institute of Environment Research, Incheon 22689, Korea. Email: [email protected]
Jung Min Ahn [email protected]
Senior Researcher, Water Quality Assessment Research Division, Dept. of Water Environment Research, National Institute of Environment Research, Incheon 22689, Korea (corresponding author). Email: [email protected]

Metrics & Citations

Metrics

Citations

Download citation

If you have the appropriate software installed, you can download article citation data to the citation manager of your choice. Simply select your manager software from the list below and click Download.

View Options

Media

Figures

Other

Tables

Share

Share

Copy the content Link

Share with email

Email a colleague

Share