Developing an Integrated Construction Safety Management System for Accident Prevention
Publication: Journal of Management in Engineering
Volume 40, Issue 6
Abstract
The significance of accident prevention in the construction industry has been consistently emphasized. Despite the research into various preventive methodologies, their application in actual construction sites still needs to be improved. Therefore, it is necessary to develop accident prevention methodologies and make improvements so that practitioners can utilize them in actual construction sites. This study sets out to propose methods for accident prevention using construction accident data and to develop a system that construction practitioners can easily utilize. Firstly, a methodology was developed to assess the risk of construction sites by considering site-specific characteristics through actual construction accident data. This led to the identification of five principal risk factors (i.e., construction type, facility type, ordering organization, construction cost, and safety management plan), and the results of risk assessment for different site classifications were derived by combining these factors. Then, machine-learning models were developed to predict accident-causing objects, accident types, and injury-death using four algorithms: random forest, light gradient boosting model, eXtreme gradient boosting (XGBoost), and categorical boosting. As a result, XGBoost demonstrated the most outstanding predictive performance, with averaged F1 scores of 0.839, 0.749, and 0.977, respectively. A web-based prototype was also developed to deploy the proposed methods, confirming the practical utility of the accident prevention strategies outlined in this research. These findings have the potential to improve the efficacy of site management by enabling proactive identification of high-risk areas, thereby promoting more effective accident prevention initiatives.
Introduction
Despite continuous efforts for safety improvement, the construction industry remains characterized by higher levels of hazards compared to other sectors (Hallowell 2012; Kim and Chi 2019; Zhang et al. 2023). Accounting for more than 30% of workplace fatalities worldwide, while employing only 7% of the global workforce, construction accidents present significant risks (KOSIS 2022). These accidents not only burden society but also lead to substantial economic losses (Chen et al. 2022; Fang et al. 2015; Koc and Gurgun 2022).
Regulatory bodies such as the Health and Safety Executive (HSE) in the United Kingdom conduct inspections through the Safer Sites Targeted Inspection program, evaluating safety compliance at construction sites (Health and Safety Executive 2015). Similarly, the Ministry of Land, Infrastructure, and Transport (MOLIT) in Korea annually selects inspection sites. It conducts on-site inspections, mandating risk assessment submissions from designers and clients (Ministry of Land, Infrastructure and Transport 2021, 2022). However, the effectiveness of these on-site inspection systems and risk assessments is hindered by limitations. The need for advanced methodologies for the preemptive identification of high-risk areas poses a notable challenge for prioritizing on-site inspections. Furthermore, the current approach of relying on subjective expert judgments in risk assessments undermines the objectivity and reliability of the evaluation outcomes.
Additional accident prevention initiatives have also been pursued (Hon and Chan 2014; Koc 2023). Government agencies in prominent countries, such as the Occupational Safety and Health Administration (OSHA) in the United States and the Korea Authority of Land and Infrastructure Safety (KALIS) in Korea, have actively collected data on construction projects and conducted investigations into recurring accident types and causes. OSHA’s Directorate of Construction offers investigation reports encompassing collapses and other accidents to aid stakeholders in identifying construction process-related issues (Kang 2018). These reports include expert opinions, insights into root causes, factual data, and investigation findings. KALIS has implemented the Construction Safety Management Integrated Information (CSI) system, which ensures continuous collection and updating of construction accident case data. The CSI system reviews safety management plans uploaded for construction projects and provides standardized data on hazard factors categorized by occupation. Despite these comprehensive efforts, substantial progress in preventing construction accidents has been limited.
In response to this, construction practitioners have emphasized the development of an integrated management and analysis system for construction data as a means to prioritize accident prevention. Numerous studies have tackled this issue, some focusing on risk assessments for construction work types and tasks (Chellappa and Salve 2023; Fung et al. 2010; Jiang et al. 2023; Wuni et al. 2023). These studies were unable to provide a comprehensive assessment of the overall site risk, as their scope was limited to identifying significant risk factors and dangerous tasks. Furthermore, their analysis was confined to single factors, neglecting potential compound effects. Some researchers have developed models to predict potential accident types using the collected data (Bhattacharyya et al. 2021; Cho et al. 2022; Lee et al. 2020; Tixier et al. 2016). Existing studies are, however, limited in that they consider detailed construction accident data, such as activity types, work progress, weather conditions, and safety planning levels when predicting accidents, which are important sources to explain accident-inducing conditions on site. In addition, because the previous studies focus mainly on predicting accident types, such as slips and falls, it is difficult to identify and respond to the accident-causing objects (e.g., heavy equipment and temporary facilities) although these are the key factors leading to accidents.
Existing studies often focus on designated risk factors or dangerous tasks, resulting in fragmented risk assessment. There is a need for research that embraces a comprehensive approach to site risk assessment, taking into account the interaction of various factors and their combined effects on overall site safety. Furthermore, while existing studies have primarily focused on predicting accident types, there is another need for research that identifies the fundamental causes and factors influencing accidents, such as a project’s characteristics and the presence of specific equipment or temporary facilities. To address this research gap, this study develops methodologies for assessing construction site risks based on real project and accident data and a composite predictive model. These methodologies are integrated into a prototype of an integrated construction safety management system to validate their practical applicability in the field. The study has the following objectives: (1) to establish a methodology to proactively identify site risks and derive inspection priority in advance, considering actual site-specific characteristics; (2) to develop a predictive model for high-risk accidents that considers the unique characteristics of the actual construction site; and (3) to propose a prototype of a construction safety management system that is easily accessible for construction practitioners and authorities.
Literature Review
Risk Assessment in Construction Sites
Risk assessment is a common practice involving the identification of potential hazards and analysis of potential scenarios that could lead to their occurrence. In industries, this process involves recognizing industry-specific risk factors and evaluating the likelihood (frequency) and severity (intensity) of injuries or illnesses caused by these factors. Within the construction industry, the risk assessment similarly focuses on evaluating the occurrence likelihood as frequency, the potential financial damage, or the severity of accidents as intensity (Choudhry et al. 2007; Leu and Chang 2013; Mohamed 2002; Perlman et al. 2014). Leading countries adopt such principles to proactively pinpoint risk factors on construction sites and establish guidelines for addressing potential accidents during construction operations (Halabi et al. 2022; Searle 2023; Suh 2021). These guidelines offer a basis for field inspectors to assess potentially hazardous construction sites in advance. However, existing risk assessment practices often need more reliance on actual accident data. Instead, they heavily depend on designers or clients to subjectively evaluate risks or defer to expert opinions. This lack of objective criteria for field inspectors to evaluate potentially hazardous sites in advance can decrease inspection efficiency and impede effective accident prevention.
Against this background, studies employing actual data to assess risk have also been conducted (Forteza et al. 2017; Fung et al. 2012; Jeong and Jeong 2022; Ryu et al. 2021; Zolfagharian et al. 2014). Fung et al. (2010) developed a risk assessment model (RAM) to assess risk levels at different project stages. RAM utilized data from a single local project and assessed the risk levels of project stages based on the number of workers and accident frequencies at each stage. Jiang et al. (2023) developed a risk assessment model using specific road construction data in China to identify key factors influencing road construction risks. Wuni et al. (2023) classified risk factors affecting modular construction through a literature review and analyzed the impact of these risk factors to rank risks. Chellappa and Salve (2023) assessed risk rankings for scaffold work tasks through fall hazard risk assessment. These studies identified major risk factors through data analysis under specific construction conditions.
Regardless of such research benefits, field inspectors still need to evaluate potentially hazardous sites across a range of construction sites with varying characteristics. Unfortunately, a comprehensive risk assessment methodology for diverse construction sites has not been developed. Therefore, the first objective of this study is to devise a methodology for calculating risk levels of construction sites based on accident data from various construction sites. This methodology will allow for a comprehensive risk-level assessment based on site-specific characteristics. By utilizing the developed methodology, the risk levels of construction sites can be identified, and urgent inspection sites can be determined through risk scores.
Accident Prevention Using Construction Accident Data
Research on preventing construction accidents through the analysis of construction accident data has been pursued in various ways. Initial studies mainly focused on statistical methods to identify factors causing construction accidents (Cheng et al. 2010; Chong and Low 2014; Molenaar et al. 2009; Shapira et al. 2009; Wu et al. 2015). These studies used basic statistical analysis to examine accident frequency based on factors such as worker age, contractor size, and the day of the week to determine the main factors influencing accidents. For instance, López Arquillos et al. (2012) found that most accidents occurred on specific days of the week. These simple statistics often prove overly generalized and insufficient for making a substantial contribution to accident prevention. Thus, other studies introduced more detailed statistical analyses. Molenaar et al. (2009) used structural equation modeling (SEM) to suggest guidelines for construction stakeholders to prevent accidents by analyzing the paths from sources to events. Cheng et al. (2012) utilized a classification and regression tree (CART) to identify factors highly correlated with construction accidents, successfully distinguishing accident situations in which falls and trips occur frequently. Although these studies are valuable for identifying critical factors in construction site accidents, they focus primarily on general accident factors. Such a focus is inadequate for the active prevention of accidents at construction sites, which vary widely in characteristics and, therefore, may not be as practical for on-site application by practitioners.
Some other researchers have conducted accident prevention studies by predicting accidents using machine-learning algorithms (Cheng et al. 2020; Poh et al. 2018; Sadeghi et al. 2020). Goh et al. (2018) conducted a survey targeting 80 workers at a tunnel construction site and analyzed the data using the random forest (RF) algorithms. Through this analysis, they revealed that the most significant factor influencing workers’ unsafe behavior is the belief about social norms. The limitation of their study, though, lies in the reliance on survey data from workers rather than actual accident data. Poh et al. (2018) developed a machine-learning model using RF to calculate accident risks using data collected from construction companies in Singapore. Nonetheless, the reliance on data from a single company diminishes the reliability of the results, and the model needs to explain the causes of accidents, making it challenging for practitioners to utilize the outcomes effectively. Xia et al. (2024) aimed to prevent construction accidents through a cost prediction model based on the eXtreme gradient boosting (XGBoost) algorithm, and Choi et al. (2020) developed machine-learning models for predicting fatal accidents using data obtained from construction workers. Kang and Ryu (2019) proposed a RF model to predict the types of accidents likely to occur based on data collected from construction sites. However, they had difficulties in providing safety managers with information about the specific objects that might cause accidents.
To comprehensively prevent accidents on construction sites, it is crucial to analyze not only the objects that act as contributing factors to accidents but also the types of accidents they cause and the severity of those accidents. Construction site managers often receive only partial information on these factors, making accident prevention still challenging. Therefore, this study aims to address these research gaps and enhance accident prevention efforts on construction sites by constructing a model to predict “accident-causing objects,” “accident types,” and “accident severity” as the second specific objective. These two specific objectives are based on the assumption that construction site practitioners will utilize them. Therefore, the third specific objective is to develop a web-based prototype that incorporates these two objectives and validate its practical applicability on construction sites.
Research Process
The research framework is divided into four main parts: (1) data preparation; (2) establishment of a construction site risk assessment methodology; (3) development of a construction accident prediction model; and (4) proposition of a construction safety management system prototype. The breakdown of each step is as follows. First, construction accident data provided by the CSI in Korea is collected. This collected data is processed and refined to serve as input data for the research. Secondly, at the construction site risk assessment phase, the research establishes a method for assessing the risk by construction site characteristics. A sensitivity analysis is employed to identify major risk factors influencing the level of risk, and the level of risk for each combination of these factors is then calculated. Next, in the development phase of the construction accident prediction model, the training and testing datasets were constructed for model learning. The prediction model comprises three submodels, predicting the accident-causing object, the type of accident, and the probability of death or injury. Each model is optimized by comparing the performance of four machine-learning algorithms. Finally, a web-based prototype of a construction accident management system is developed, which can implement the developed risk assessment methods and construction accident prediction model. This system aims to be readily accessible and applicable for practical use.
Data Preparation
Data Collection
The dataset for this research, sourced from the CSI, consists of 13,047 records documenting construction accidents occurring between 2019 and 2022. This dataset is structured as a data frame and is divided into three main segments: scene, worker, and accident information. Scene information comprises 24 variables, including but not limited to the process type, process rate, and number of workers. Worker information, constituting 20 variables, includes aspects such as gender, age, and nationality. Accident details consist of 29 variables, including accident type, accident-causing object, and accident location.
Data Cleaning
A comprehensive data-cleaning process was executed to generate appropriate input data for the study. Initially, columns with 15% or more missing values and variables with 50 or more categories were excluded. Secondly, variables that exhibited high skewness toward a particular category were removed, as they were deemed to provide minimal meaningful insight. For instance, the variable indicating male workers, which constituted 98% of the entire dataset, was removed. Numeric variables, such as construction cost, process rate, and bid rate, were transformed into categorical variables. Lastly, to avoid multicollinearity issues, a correlation analysis was conducted, and variables exhibiting low importance in pairs with Cramer’s V coefficients of 0.5 or higher were removed (McHugh 2012). As a result of these stringent data-cleaning steps, the study effectively obtained 24 variables and 9,671 refined data points from the initial dataset comprising 13,047 entries across 73 variables. The relevance of the derived variables with construction accidents was confirmed through comparison with relevant studies (Oguz Erkal et al. 2021; Sanni-Anibire et al. 2020). The results are summarized in Table 1.
| Category | Variable | Value type |
|---|---|---|
| Scene information (14) | Ordering organization | Categorical |
| Weather | Categorical | |
| Temperature | Numerical | |
| Humidity | Numerical | |
| Facility type | Categorical | |
| Construction type (major) | Categorical | |
| Construction type (minor) | Categorical | |
| Construction cost | Categorical | |
| Process rate | Categorical | |
| Number of workers | Categorical | |
| Work process | Categorical | |
| Location (province) | Categorical | |
| Safety management plan | Categorical | |
| Design safety review status | Categorical | |
| Accident information (10) | Accident number (primary key) | Numerical |
| Accident month | Categorical | |
| Accident day of the week | Categorical | |
| Accident time zone | Categorical | |
| Number of deaths | Numerical | |
| Number of injuries | Numerical | |
| Death/Injury status | Categorical | |
| Accident object (major) | Categorical | |
| Accident object (minor) | Categorical | |
| Accident type | Categorical |
Construction Site Risk Assessment
Defining Risk in Construction Sites
Risk is commonly computed as the product of the severity and probability of an accident (Jannadi and Almishari 2003). Previous studies related to risk assessment in construction sites have defined severity and probability according to their specific objectives (Gurcanli et al. 2015; Marhavilas and Koulouriotis 2008; Pereira et al. 2018). The purpose of this study is to establish a methodology for assessing the risk associated with various types of construction sites, based on historical accident data. Consequently, in this study, the severity of an accident is defined by the number of fatalities and injuries per type of site, while the frequency of accidents defines the probability. To calculate the extent of the damage in terms of the number of deaths and injuries, weights must be assigned to each death and injury. According to the enforcement regulations of the Occupational Safety and Health Act in Korea, the weights for the number of deaths to injuries are set at five (Ministry of Employment and Labor 2021). Therefore, in this study, the extent of damage is calculated using the following formula:
(1)
To calculate the extent of damage and accident frequency, the scale of the site must also be considered. For instance, a site with more than 500 workers naturally has a higher probability of accidents, leading to potentially more deaths and injuries. Therefore, the research standardized the extent of damage and accident frequency by dividing each by the number of workers at the site. The standardized extent of damage and accident frequency are further normalized to values between 0 and 1 using the min–max scaling method. The standardized values for accident frequency and extent of damage per site type are each plotted as coordinates on the X and Y planes, respectively. The distance from the origin to each risk category’s coordinates is defined as the standardized risk magnitude.
Identifying Major Risk Factors
To evaluate the risk according to the type of site, it is also necessary to determine how to classify the type of site based on certain factors. In order to identify the factors that greatly influence the risk of the site, sensitivity analysis is conducted. Sensitivity analysis is performed according to the following procedure. First, the criteria for classifying the type of construction site is set to ‘construction type (minor),’ which can determine the type of construction. The “minor” means the subcategory (e.g., earthmoving, concrete works) of the construction type (e.g., building construction). Afterward, the size of all risks according to the combination with each factor of construction accident data is measured. If there is a large deviation in the risk scores for the combinations of the selected factors, it can be interpreted that the respective factors have a significant impact on the risk. Therefore, in this study, the deviation in risk scores for each variable combination is defined as sensitivity. In addition, since the removal of outliers is necessary, the interquartile range (IQR) is utilized (Wan et al. 2014); the sensitivity to risk is calculated through the difference between the 75th percentile and the 25th percentile of the size of risk for each variable combination. The corresponding formula is as follows:where th percentile of risk; and th percentile of risk.
(2)
It is crucial to strike a balance in selecting key factors for site classification. Having too few factors may compromise representativeness, while an excessive number of factors could lead to an overwhelming array of variable combinations, making data entry challenging for construction practitioners. To address this, the number of main factors to determine the classification of the construction site is set to five, and the top four main risk factors are derived through sensitivity analysis, excluding the standard variable ‘construction type (minor).’
Risk Assessment by On-Site Classification
In the final step, through the four main risk factors by the sensitivity analysis and the standard factor ‘construction type (minor),’ the type of construction site is classified. The standard risk level for each classified construction site type is calculated, and the maximum risk size is adjusted to 100 points to allow construction practitioners to judge the risk by site type intuitively. The 100 means the riskiest condition. Risk is assessed based on accident history, so the risk score for site classifications without any accident history cannot be calculated. This implies that the risk is very low, as it signifies that no accidents have occurred within that site classification. Therefore, in this study, the risk scores of site classifications that are not included in the risk assessment results are all standardized to 0.
Development of the Construction Accident Prediction Model
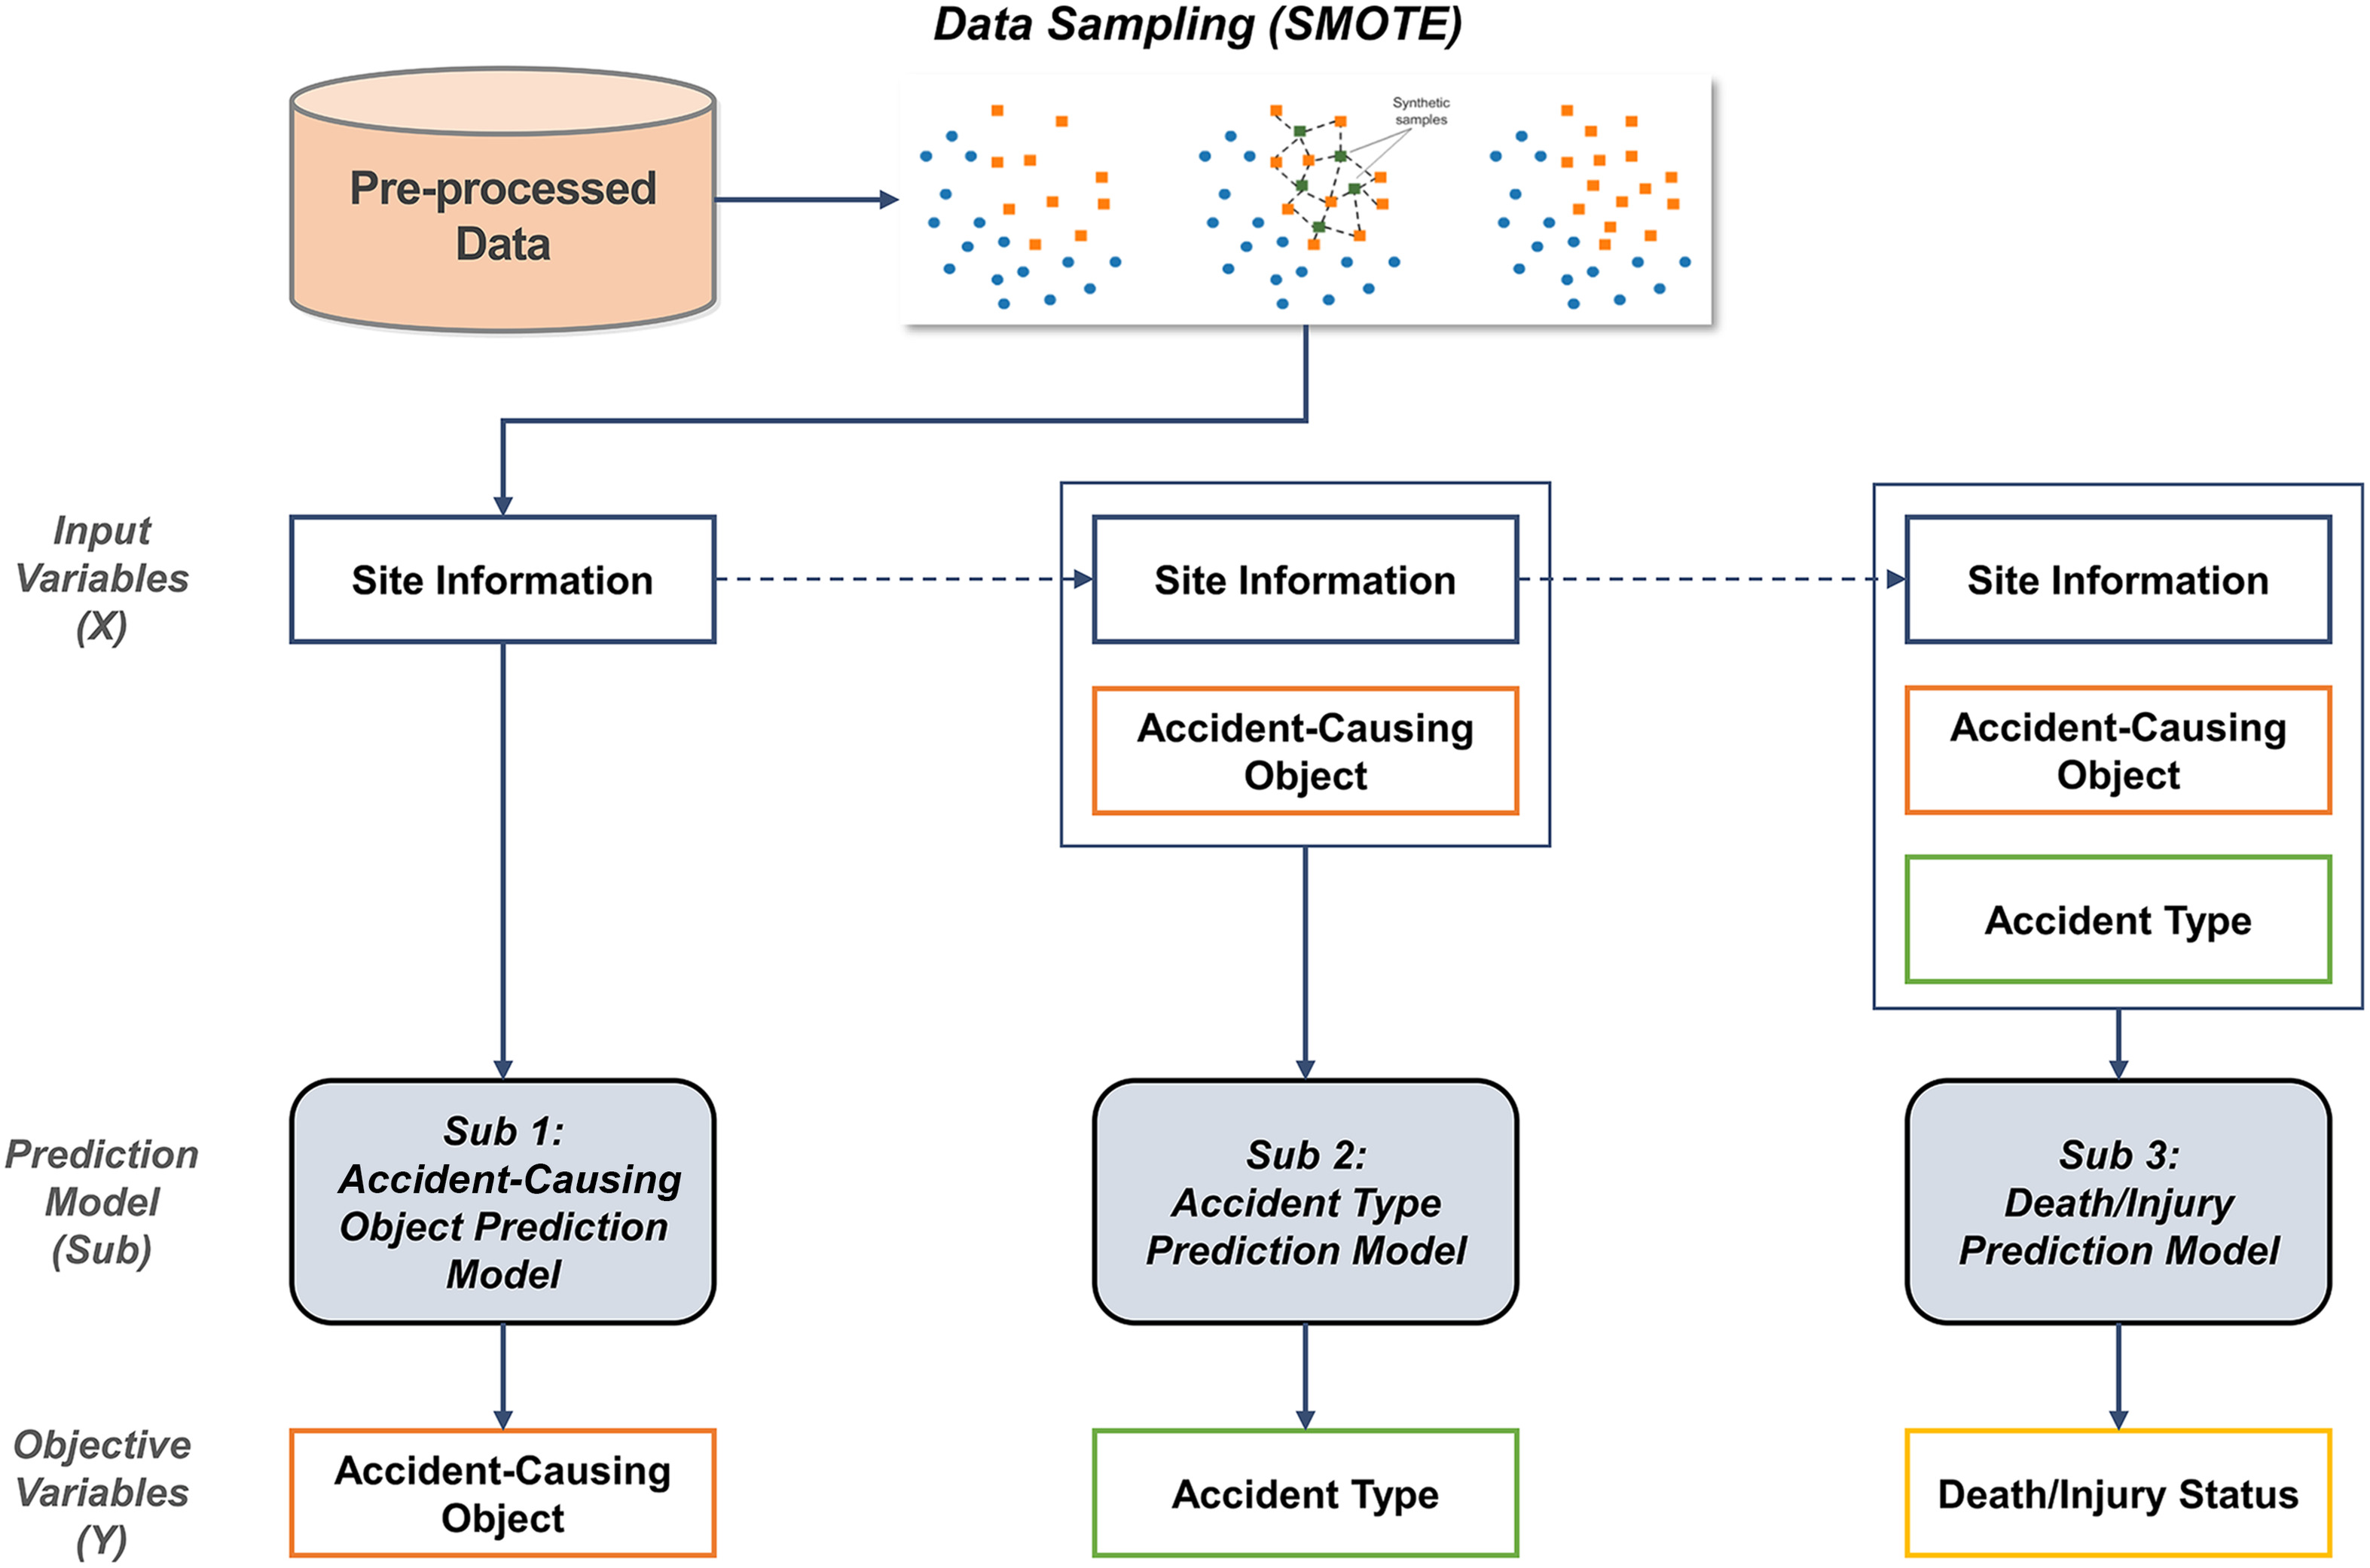
This section develops a construction accident prediction model using construction accident data. The overview of the entire process is shown in Fig. 1. Firstly, the preprocessed data obtained in the section “Data Preparation” are balanced through sampling and constructed into a dataset suitable for model training. This dataset serves as input data for the prediction model. The construction accident prediction model is composed of three submodels: (1) accident-causing object prediction model; (2) accident-type prediction model; and (3) death-injury prediction model. In recent studies, four algorithms have been commonly employed for classification with acceptable prediction performance: random forest (RF), light gradient boosting model (LGBM), eXtreme gradient boosting (XGBoost), and categorical boosting (CatBoost). Previous literature reviews have confirmed the widespread use of RF and XGBoost algorithms in predicting accidents in the construction industry. Furthermore, to ensure diversity in research outcomes, studies on accident prediction in other industries were reviewed. In these studies, in addition to RF and XGBoost algorithms, LGBM and CatBoost were recently utilized, and their performance was practically validated (Ahmed et al. 2023; Hasan et al. 2023; Junhao et al. 2022; Zhao and Deng 2022). Thus, this study utilizes these four outstanding algorithms, and each submodel selects the optimal algorithm through the performance comparison. More detailed information about these algorithms can be found in the previous studies (Chakraborty et al. 2020; Goh et al. 2018; Nasrollahzadeh et al. 2021). The performance of the model is evaluated through four metrics: accuracy, F1 score, precision, and recall.
Data Sampling
Clear definitions are needed for the classes of the accident-causing object and accident-type variables to be utilized as objective variables. In this study, with reference to relevant existing studies, predictive variables are defined with eight classes (temporary facility, materials, tools, machinery, construction member, structure, soil and rock, and others) for accident-causing objects and eight classes (tripped, fell, struck by an object, pinched, slashed, hit, crushed, and others) for accident types (Hwang et al. 2023; Johansen et al. 2023; Kim et al. 2023). However, the preprocessed data output from Section 3.1 exhibit an issue of data imbalance. As can be seen from Table 2, there is a significant disparity in the proportions of data composing each model when comparing the count of predictive variables. This data imbalance could impact the efficacy of the model, making it imperative to achieve data balance.
| Variables | Detailed variables | Number of data |
|---|---|---|
| Accident-causing object | Temporary facility | 3,103 (32%) |
| Materials | 1,839 (19%) | |
| Others | 1,634 (17%) | |
| Tools | 1,087 (11%) | |
| Machinery | 829 (9%) | |
| Construction member | 493 (5%) | |
| Structure | 444 (5%) | |
| Soil and rocks | 242 (3%) | |
| Accident type | Tripped | 2,357 (24%) |
| Fell | 2,089 (22%) | |
| Struck by an object | 1,621 (17%) | |
| Pinched | 1,107 (11%) | |
| Slashed | 884 (9%) | |
| Others | 764 (8%) | |
| Hit | 638 (7%) | |
| Crushed | 211 (2%) | |
| Death-injury | Injury | 9,216 (95%) |
| Death | 455 (5%) |
Oversampling techniques are commonly employed to prevent algorithm degradation (Chang et al. 2023; Shi et al. 2022). This study utilizes the synthetic minority oversampling technique (SMOTE), a prevalent oversampling method designed to solve the problem of overfitting (Douzas and Bacao 2019; Feng et al. 2021; Li et al. 2023). The sampling_strategy parameter, which represents the ratio between the major and minor classes, is set considering the imbalance level of each dataset. For the accident-causing object model and the accident type-model, the sampling_strategy is set to 1.0 to ensure an adequate number of data points for each class. On the other hand, the death-injury model, where the data ratio between the two classes differed by roughly 20 times, has the sampling_strategy set to 0.3 to mitigate overfitting. The data sampling is performed using Python version 3.6.8 and imbalanced-learn library version 0.7.0. Following this, the data is split into training (70%) and testing (30%) datasets. Through this process, a dataset is constructed to be used for the training of each submodel. Table 3 summarizes the results for the training and testing datasets for each submodel.
| Model | Predictive variables | Sampled data |
|---|---|---|
| Accident-causing object | Temporary facility, tool, machinery, structure, construction member, soil and rock, materials, others | Train: 17,376 |
| Test: 7,448 | ||
| Accident type | Crushed, tripped, fell, pinched, struck by an object, hit, slashed, others | Train: 13,199 |
| Test: 5,657 | ||
| Death-injury status | Death, injury | Train: 8,386 |
| Test: 3,594 |
Optimum Model Selection
The construction accident prediction model in this study comprises three submodels. Each represents a distinct classification model, implemented using machine-learning algorithms to produce either categorical or binary outputs. As explained, four algorithms were selected for model development: RF, LGBM, XGBoost, and CatBoost. These algorithms are trained using Scikit-learn version 0.24.2, LightGBM version 3.3.2, XGBoost version 1.4.2, and CatBoost version 1.1, respectively.
The training of each model is performed depending on the type of algorithm. For the LGBM model, a “multiclass” objective function is employed for the tasks of identifying the accident-causing object and classifying the accident type. Conversely, the “binary” objective function is applied for the binary classification task related to death-injury status. For the XGBoost model, different objective functions are similarly structured depending on the submodel. Specifically, the “multi:softprob” objective function is used for multiclass tasks such as identifying the accident-causing object and classifying the accident type. For the binary classification task of predicting death-injury status, the “binary:logistic” objective function is used. On the other hand, due to the inherent constraints of the RF and CatBoost algorithms, which do not permit the modification of the objective function, these models are trained using their default configurations.
The optimal algorithm for each submodel is determined by comparing the performance of various parameter combinations. The research tunes the hyperparameters of the three submodels and the four types of algorithms through a grid search of potential parameter combinations, as presented in Table 4. During the grid search, -fold cross-validation is performed, where the training data are divided into subsets. In each step of the process, subsets are used as training samples, and one subset is used as a validation sample. The optimal combination of hyperparameters is determined by comparing the average accuracy of each algorithm derived from cross-validation. Subsequently, each algorithm is trained using the determined optimal hyperparameter combination. For any parameters not explicitly specified in the table, this study resorts to the default values inherent to each respective algorithm.
| Algorithm | Hyperparameter | Description | Grid-search value |
|---|---|---|---|
| RF | Max_depth | Max. depth of the tree | 7–11 (interval: 1) |
| Min_samples_split | Min. number of samples required to split an internal node | 3–7 (interval: 1) | |
| Min_samples_leaf | Min. number of samples required to be at a leaf node | 3–7 (interval: 2) | |
| n_estimators | Number of trees in the forest | 10–300 (interval: 10) | |
| LGBM | Max_depth | — | 7–11 (interval: 1) |
| Num_leaves | Control the complexity of the tree model | 7–13 (interval: 1) | |
| Learning_rate | How much of the slope value found for each weight should be applied to gradient descent | 0.01–0.1 (interval: 0.01) | |
| n_estimators | — | 10–300 (interval: 10) | |
| XGBoost | Max_depth | — | 7–11 (interval: 1) |
| Min_child_weight | Min. sum of weights of data required in a child | 1–7 (interval: 1) | |
| Colsample_bytree | Ratio of columns (variables) for sampling to construct each tree | 0.25–0.75 (interval: 0.25) | |
| Learning_rate | — | 0.01–0.1 (interval: 0.01) | |
| n_estimators | — | 10–300 (interval: 10) | |
| CatBoost | Max_depth | — | 7–11 (interval: 1) |
| Learning_rate | — | 0.01–0.1 (interval: 0.01) | |
| n_estimators | — | 10–300 (interval: 10) |
Model Evaluation
Generally, machine-learning models are evaluated using a confusion matrix and four metrics: recall, precision, accuracy, and F1 score (Liu et al. 2022; Moon et al. 2022; Zhang et al. 2017). Recall measures the proportion of actual positive instances that the model correctly predicts. It is calculated as the ratio of true positives to the sum of true positives and false negatives. Precision measures the proportion of predicted positive instances that are actually true positive instances. It is calculated as the ratio of true positives to the sum of true positives and false positives. Accuracy measures the overall correctness of the model’s predictions across all classes. It is calculated as the ratio of the number of correct predictions (true positives and true negatives) to the total number of predictions (true positives, true negatives, false positives, and false negatives). While accuracy provides an overall assessment of the model’s performance, it may not be suitable for imbalanced datasets where one class dominates over the others. F1 score is the harmonic mean of precision and recall, providing a balance between the two metrics. F1 score considers both false positives and false negatives and is particularly useful when dealing with imbalanced datasets, where precision and recall may vary significantly. Descriptions of the confusion matrix and each performance metric are shown in Tables 5 and 6.
| Confusion matrix | Predicted positive | Predicted negative |
|---|---|---|
| Actual positive | True positives (TP) | False negatives (FN) |
| Actual negative | False positives (FP) | True negatives (TN) |
| Metrics | Formula |
|---|---|
| Accuracy | |
| Precision | |
| Recall | |
| score |
To select the optimal algorithm via model performance, the F1 score has been widely adopted in the literature. However, support which represents the number of actual instances of a class in the dataset is not considered in conventional F1 score calculation (Zhang et al. 2019). Therefore, the optimal algorithm for each submodel is specifically determined using the weighted average F1 score. The weighted average F1 score is calculated as the mean of all per-class F1 scores, considering the support for each class (Sarkar et al. 2020). The weighted average F1 score is computed using Eq. (3):
(3)
The confusion matrix of each model is analyzed to facilitate a detailed discussion of prediction results. Specifically, by comparing the recall values of individual variables within each submodel, the combinations of variables susceptible to confusion are identified. Insights gained from these analyses inform discussions on inherent issues within the data and potential strategies for model enhancement.
Results and Discussion
Result and Discussion of Construction Site Risk Assessment
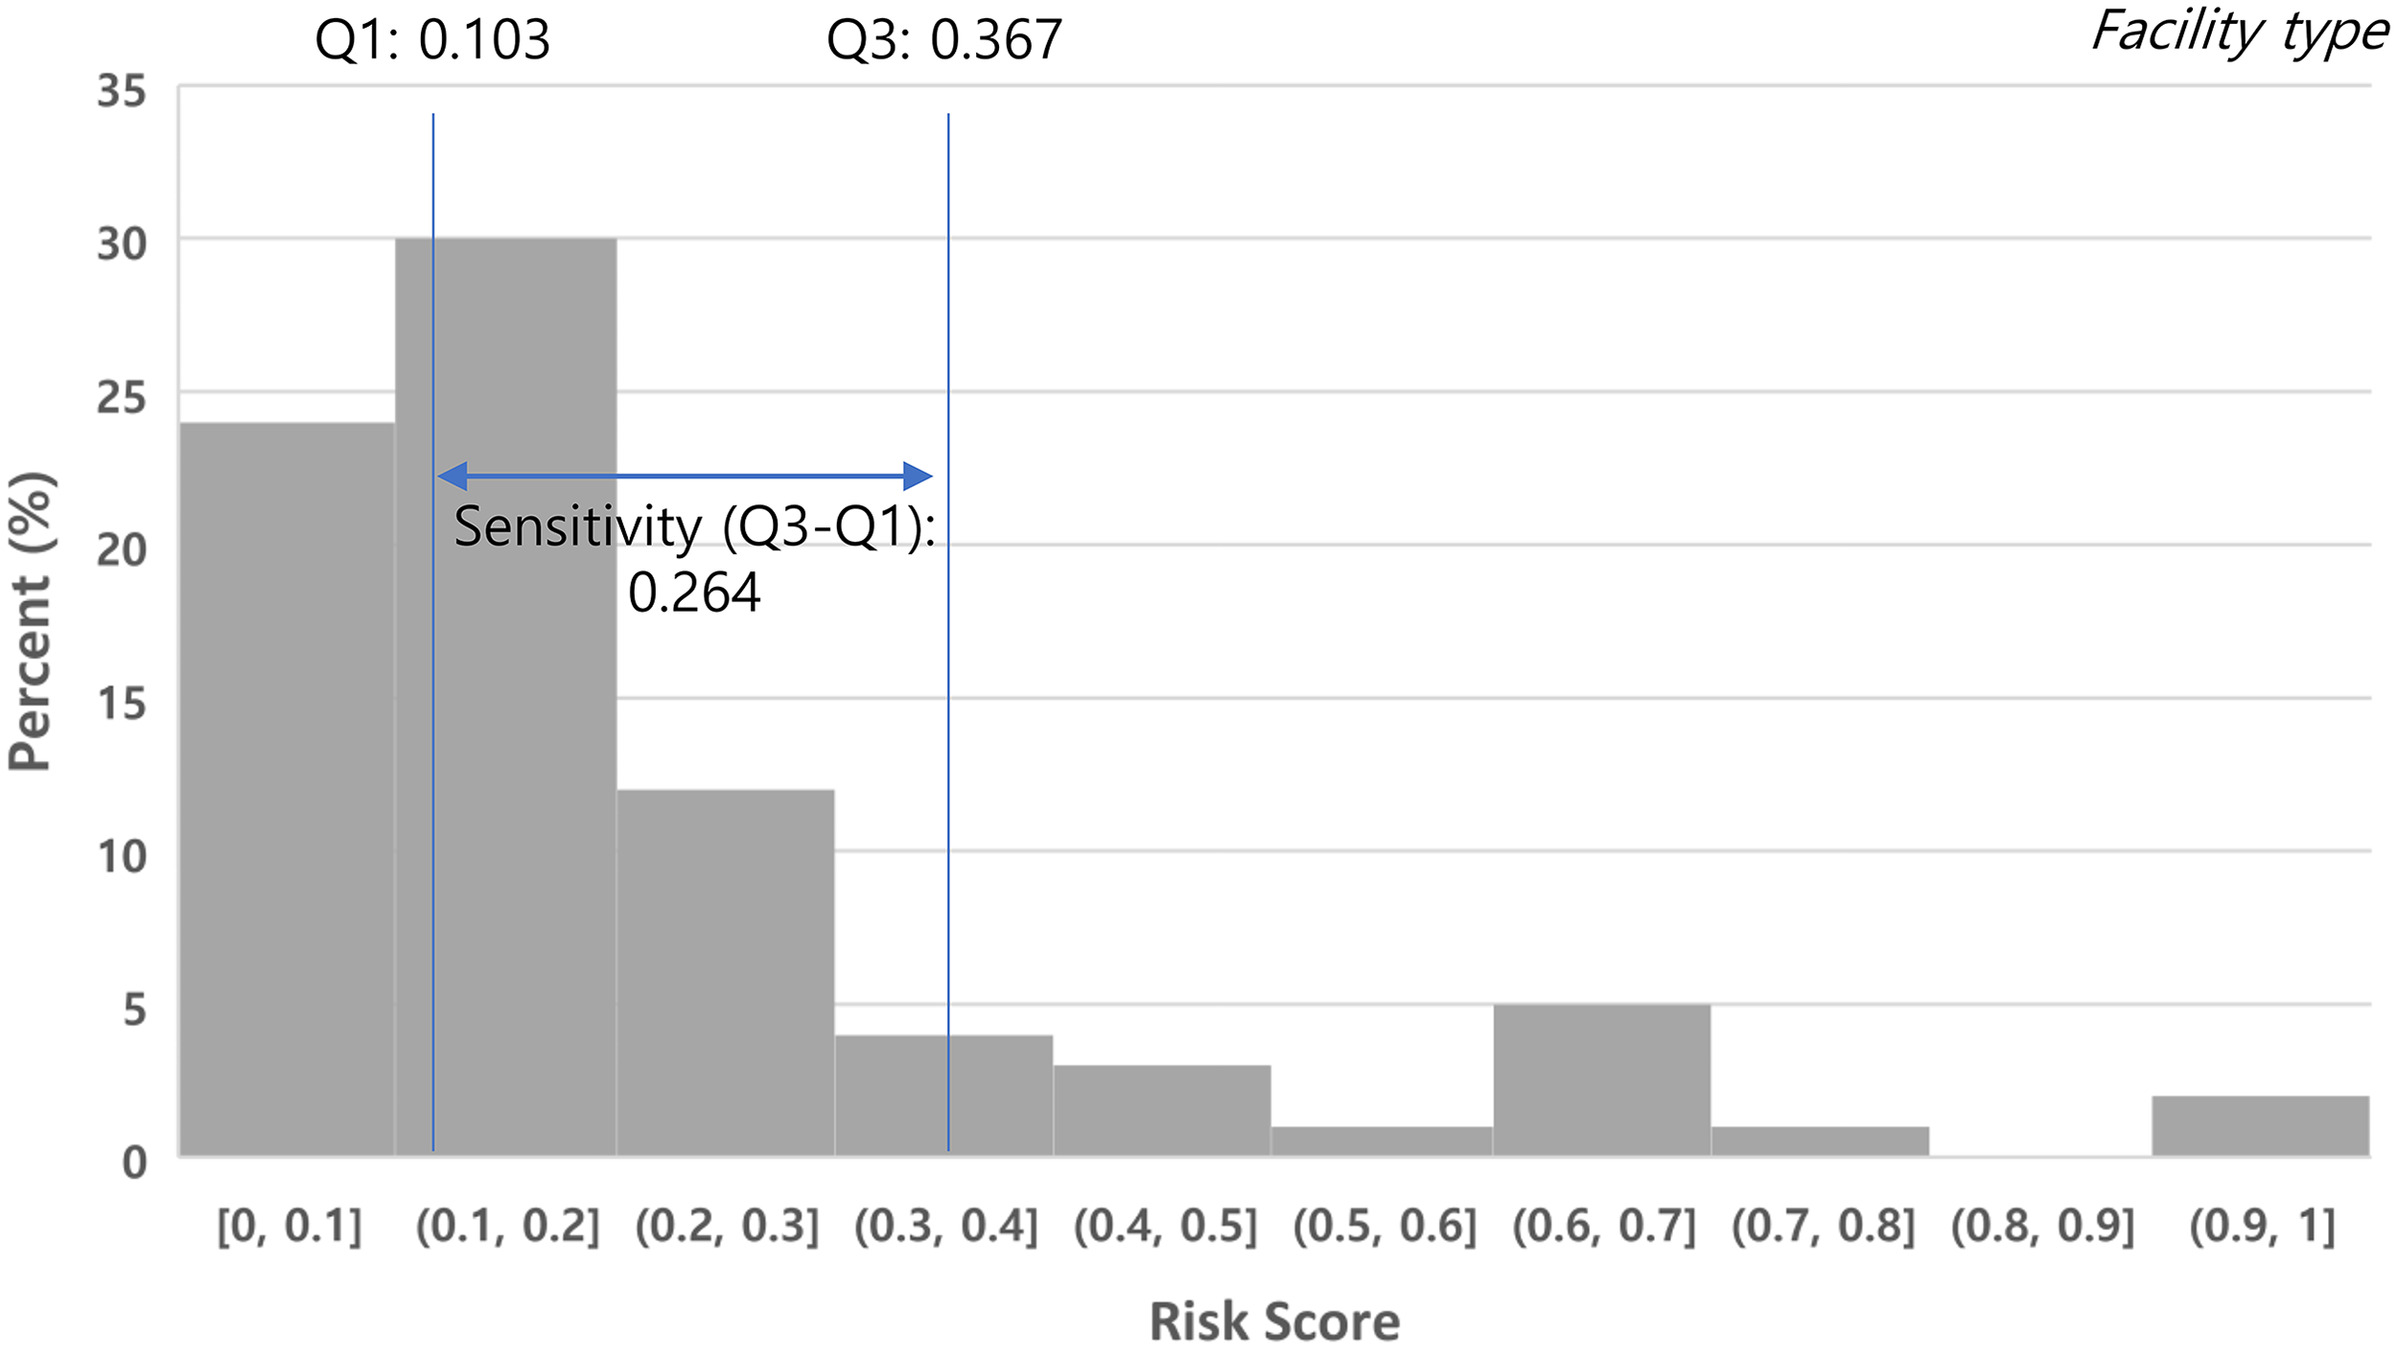
The results of the sensitivity analysis for the selection of major risk factors are shown in Table 7, and, according to this, the sensitivity ranks for each factor were derived. For example, the sensitivity analysis for ‘facility type’ initially calculated the standard risk scores for all combinations with ‘construction type (minor).’ Subsequently, the calculated standard risk scores were sorted in ascending order, as shown in Fig. 2, from which and were obtained, and the sensitivity was calculated. In conclusion, excluding the benchmark variable ‘construction type (minor),’ the major risk factors selected with high sensitivity were ‘facility type’ at 0.264, ‘ordering organization’ at 0.246, ‘construction cost’ at 0.238, and ‘safety management plan’ at 0.220. Therefore, in this study, these five variables were decided as the main risk factors for determining the site’s classification. The site types were categorized into a total of 1,429 with the combinations of the major risk factors.
| Rank | Risk factor | (25th percentile) | (75th percentile) | Sensitivity () |
|---|---|---|---|---|
| Criteria | Construction type (minor) | — | — | — |
| 1 | Facility type | 0.103 | 0.367 | 0.264 |
| 2 | Ordering organization | 0.104 | 0.350 | 0.246 |
| 3 | Construction cost | 0.121 | 0.359 | 0.238 |
| 4 | Safety management plan | 0.089 | 0.309 | 0.220 |
| 5 | Number of workers | 0.084 | 0.285 | 0.201 |
| 6 | Process rate | 0.090 | 0.221 | 0.131 |
| 7 | Weather | 0.120 | 0.243 | 0.123 |
| 8 | Accident day of the week | 0.123 | 0.239 | 0.116 |
| 9 | Accident time zone | 0.101 | 0.209 | 0.108 |
| 10 | Location (Province) | 0.021 | 0.098 | 0.077 |
Risk scores for each site classification were determined according to the combination of five variables, as shown in Table 8. The analysis results of the top 100 site classifications in terms of risk scores for each risk factor are as follows. In the case of ‘construction type (minor),’ ‘reinforced concrete’ accounted for the largest proportion at 19%, followed by ‘temporary facility’ at 13%, and ‘dismantling and demolition’ at 9%. For ‘facility type,’ ‘building’ occupied 60% of the ratio, and ‘civil’ was in second place at 35%. In the ‘safety management plan,’ ‘nontarget’ was 58%, and ‘target’ showed a slight difference at 42%. In the ‘construction cost,’ the range from ‘$1 million to $5 million’ accounted for 26%, ‘$100,000 to $500,000’ was 21%, and ‘$500,000 to $1 million’ was 11%. Finally, for the case of the ‘ordering organization,’ ‘private construction’ was 54%, and ‘public construction’ was 46%.
| Rank | Risk factor (classification) | Standard frequency (X) | Standard damage (Y) | Risk score | ||||
|---|---|---|---|---|---|---|---|---|
| Construction type (minor) | Ordering organization | Facility type | Safety management plan | Construction cost ($) | ||||
| 1 | Reinforced concrete () | Private | Building | Nontarget | 1M–5M | 1.000 | 0.060 | 100 |
| 2 | Others | Public | Civil | Target | Over 100M | 0.012 | 1.000 | 99.83 |
| 3 | Public | Building | Target | 1M–5M | 0.827 | 0.054 | 82.72 | |
| 4 | Public | Building | Non-target | 1M–5M | 0.642 | 0.065 | 64.41 | |
| 5 | Private | Building | Non-target | 0.5M–1M | 0.512 | 0.093 | 51.96 | |
| 6 | Private | Building | Non-target | 0.1M–0.5M | 0.482 | 0.070 | 48.62 | |
| 7 | Steel frame | Private | Building | Non-target | 1M–5M | 0.441 | 0.157 | 46.64 |
| 8 | Dams/levees | Public | Civil | Non-target | 0.5M–1M | 0.012 | 0.467 | 46.55 |
| 9 | Private | Building | Target | Over 100M | 0.456 | 0.006 | 45.50 | |
| 10 | Private | Building | Target | 1M–5M | 0.432 | 0.058 | 43.49 | |
| 11 | Temporary facility | Private | Building | Non-target | 1M–5M | 0.413 | 0.063 | 41.68 |
| 12 | Public | Building | Target | 5M–10M | 0.411 | 0.032 | 41.17 | |
| 13 | Windows/glass | Private | Building | Target | 1M–5M | 0.012 | 0.400 | 39.90 |
| 14 | Pipe | Private | Civil | Non-target | 10M–20M | 0.012 | 0.400 | 39.90 |
| 15 | Public | Civil | Non-target | 1M–5M | 0.350 | 0.074 | 35.69 | |
| 16 | Pipe | Public | Civil | Non-target | 1M–5M | 0.314 | 0.119 | 33.51 |
| 17 | Dismantling/demolition | Public | Industrialutility | Non-target | Under 0.1M | 0.012 | 0.333 | 33.24 |
| 18 | Ground improvement | Private | Civil | Target | Over 100M | 0.012 | 0.333 | 33.24 |
| 19 | Waterproof | Public | Industrial utility | Non-target | 10M–20M | 0.012 | 0.333 | 33.24 |
| 20 | Waterproof | Private | Building | Target | 0.5M–1M | 0.012 | 0.333 | 33.24 |
The top three ‘construction types (minor)’—reinforced concrete construction, temporary construction, and dismantling and demolition construction—are indeed categorized as hazardous tasks at actual construction sites (Hong et al. 2019; Park et al. 2015). Furthermore, in practice, the size of a site is typically classified by construction cost, and it is known that smaller sites, which lack a sufficient number of site managers and are challenging to supervise, have a higher accident occurrence rate (Lim et al. 2018; Sodangi 2023). The analysis results also showed that small-scale sites with a construction cost of fewer than $5 million have high-risk levels, demonstrating that the risk analysis results of this study accurately reflect the actual situation on site.
In summary, the sensitivity analysis conducted in this study identified key risk factors influencing site safety, with ‘construction type,’ ‘facility type,’ ‘ordering organization,’ ‘construction cost,’ and ‘safety management plan’ emerging as major determinants. The subsequent classification of site types based on these risk factors further enhanced our understanding of site-specific risk profiles. Moreover, the analysis of risk scores for each site classification revealed insights into the distribution of risk factors across different construction contexts. Overall, these findings will provide valuable insights for construction management practitioners and safety managers in developing proactive risk mitigation strategies customized to specific site characteristics.
Result and Discussion of Construction Accident Prediction Model
The optimal hyperparameters for each of the four algorithms of each submodel are presented in Table 9. The optimal hyperparameters for submodels were identified as follows. In the accident-object prediction model, the XGBoost algorithm showed optimum performance with a maximum depth of 9, minimum child weight of 3.0, colsample by tree of 0.75, and 200 estimators. CatBoost performed best with a maximum depth of 11, a learning rate of 0.08, and 250 estimators. LGBM achieved optimum results with a maximum depth of 9, 13 leaves, a learning rate of 0.04, and 200 estimators. At the same time, the RF showed the best performance with a minimum sample split of 3, minimum sample leaf of 3, and 300 estimators. For the accident-type prediction model, the XGBoost achieved optimal results with a maximum depth of 11, minimum child weight of 1.0, colsample by tree of 0.75, and 300 estimators. CatBoost had optimal performance with a maximum depth of 11, a learning rate of 0.03, and 250 estimators. The LGBM model showed optimum results with a maximum depth of 11, 13 leaves, learning rate of 0.05, and 200 estimators, while the RF performed best with a minimum sample split of 3, minimum samples leaf of 3, and 300 estimators. Finally, for the death-injury model, the optimal hyperparameters were a maximum depth of 7, minimum child weight of 2.0, colsample by tree of 0.75, and 300 estimators for XGBoost; a maximum depth of 7, learning rate of 0.03, and 200 estimators for CatBoost; a maximum depth of 9, 11 leaves, learning rate of 0.1, and 200 estimators for LGBM; and a minimum sample split of 3, minimum samples leaf of 3, and 200 estimators for RF.
| Model | Algorithm | Optimum hyperparameter | Weighted average F1 score |
|---|---|---|---|
| Accident-causing object | XGBoost | Max_depth: 9, Min_child_weight: 3, colsample_bytree: 0.75, n_estimators: 200 | 0.839 |
| CatBoost | Max_depth: 11, learning_rate: 0.08, n_estimators: 250 | 0.831 | |
| LGBM | Max_depth: 9, Num_leaves: 13, learning_rate: 0.04, n_estimators: 200 | 0.825 | |
| RF | Min_samples_split: 3, Min_samples_leaf: 3, n_estimators: 300 | 0.829 | |
| Accident type | XGBoost | Max_depth: 11, Min_child_weight: 1, colsample_bytree: 0.75, n_estimators: 300 | 0.749 |
| CatBoost | Max_depth: 11, learning_rate: 0.03, n_estimators: 250 | 0.742 | |
| LGBM | Max_depth: 11, Num_leaves: 13, learning_rate: 0.05, n_estimators: 200 | 0.745 | |
| RF | Min_samples_split: 3, Min_samples_leaf: 3, n_estimators: 300 | 0.736 | |
| Death-injury | XGBoost | Max_depth: 7, Min_child_weight: 2, colsample_bytree: 0.75, n_estimators: 300 | 0.977 |
| CatBoost | Max_depth: 7, learning_rate: 0.03, n_estimators: 200 | 0.968 | |
| LGBM | Max_depth: 9, Num_leaves: 11, learning_rate: 0.1, n_estimators: 200 | 0.962 | |
| RF | Min_samples_split: 3, Min_samples_leaf: 3, n_estimators: 200 | 0.963 |
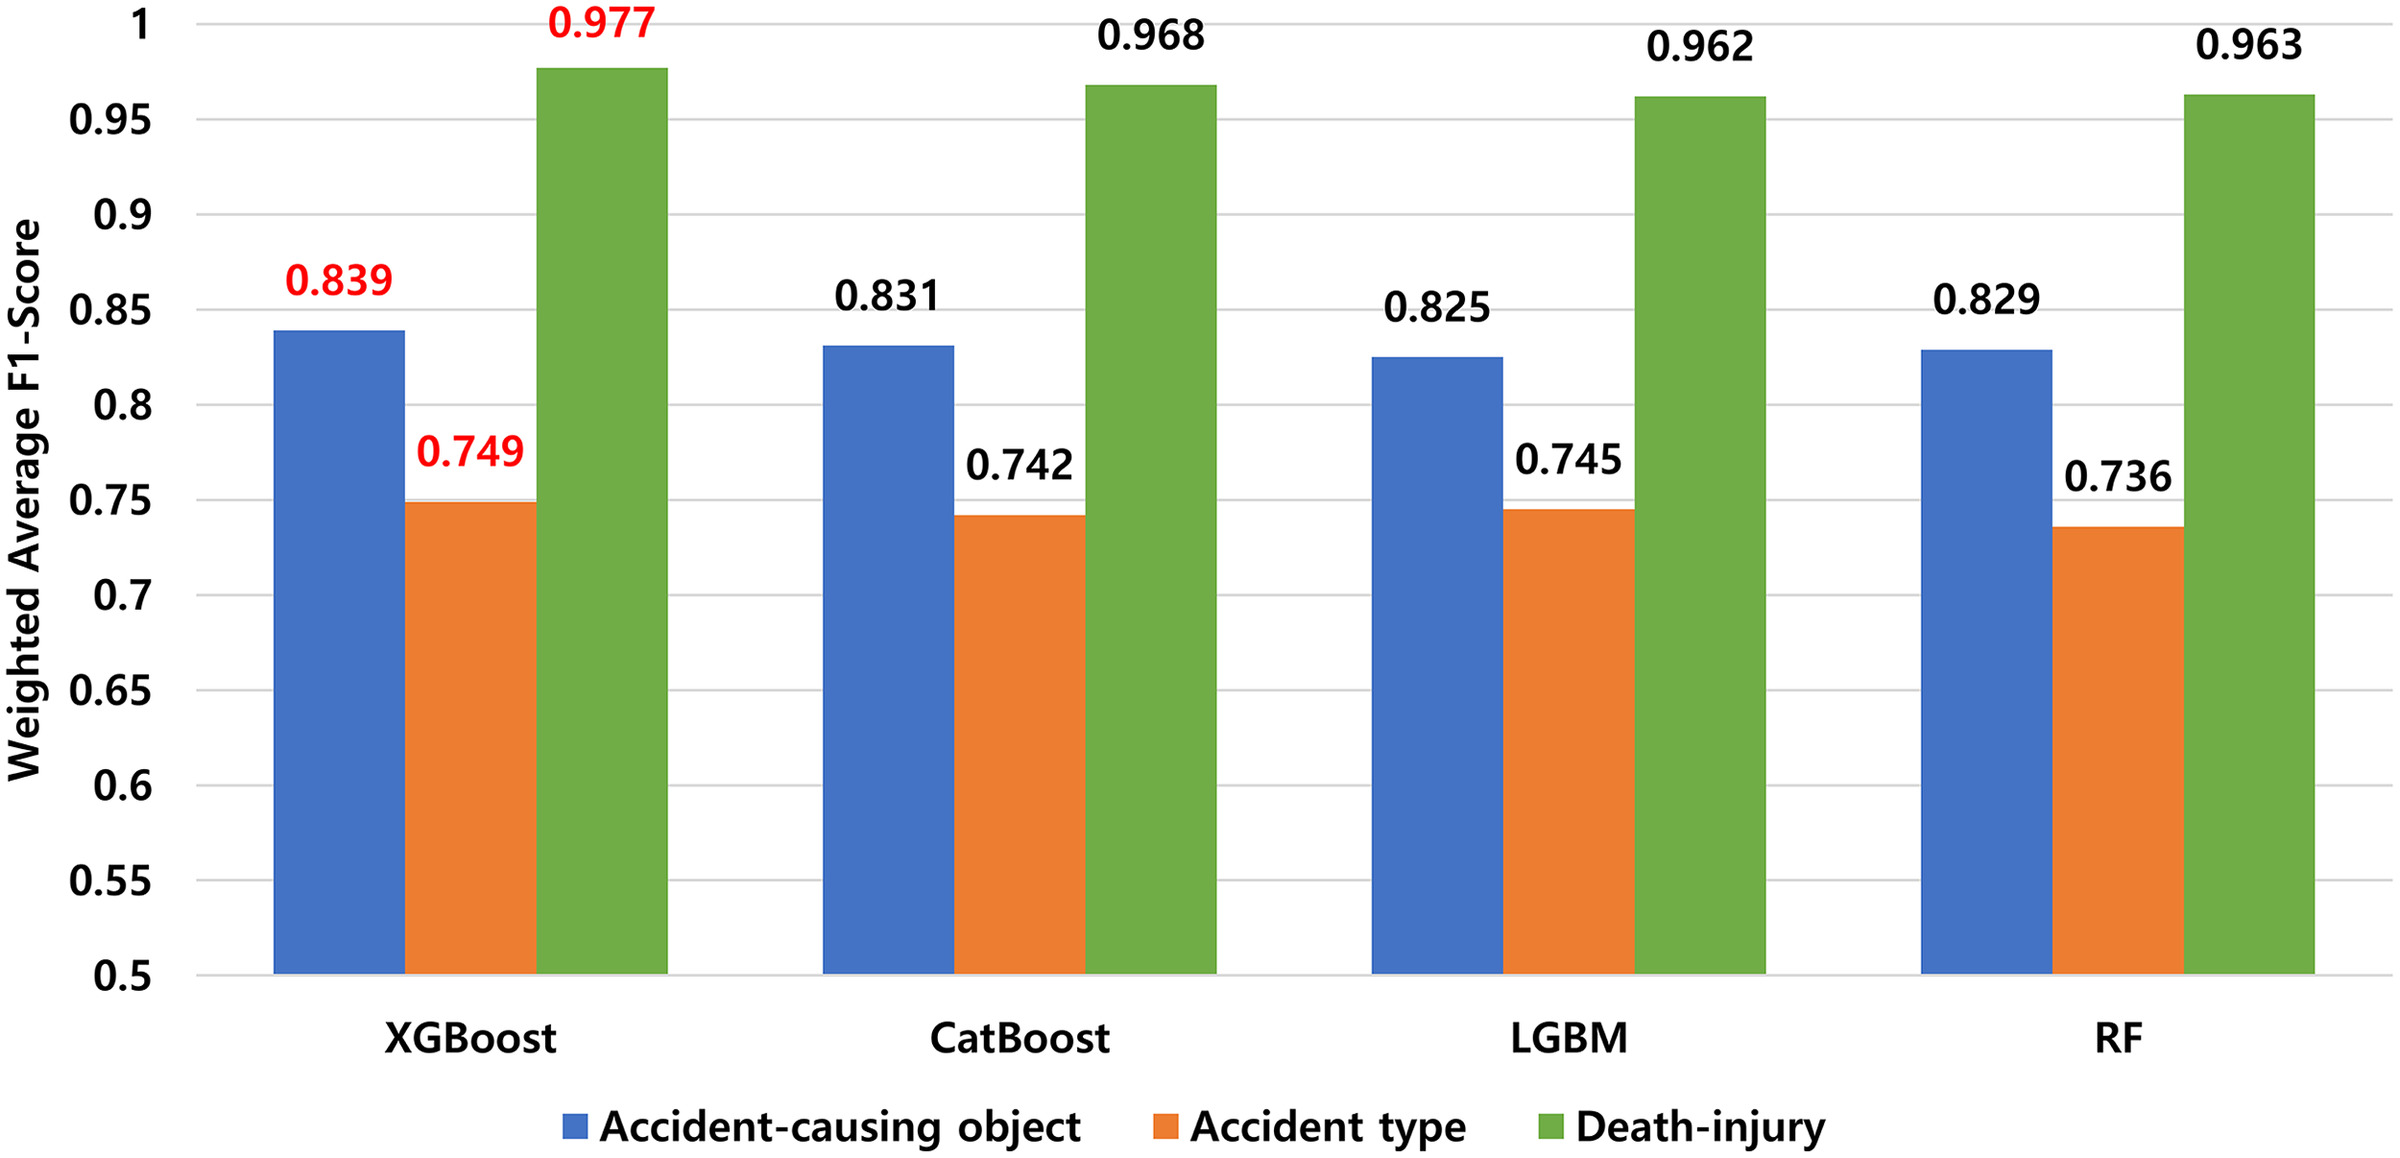
Subsequently, the submodels were trained with the optimal hyperparameters, and the weighted average F1 score was calculated. In the accident-causing object model, XGBoost exhibited the best performance with an F1 score of 0.839, followed by CatBoost with 0.831, RF with 0.829, and LGBM with 0.825. In the accident-type model, XGBoost showed the highest performance with an F1 score of 0.749, followed by LGBM with 0.745, CatBoost with 0.742, and RF with 0.736. Finally, in the binary classification model, death-injury, XGBoost performed best with an F1 score of 0.977, followed by CatBoost with 0.968, RF with 0.963, and LGBM with 0.962. The results are summarized in Table 10 and Fig. 3.
| Confusion matrix | Predicted | Others | ||||||
|---|---|---|---|---|---|---|---|---|
| Temporary facility | Tool | Machinery | Materials | Construction member | Structure | Soil and rock | ||
| Actual | ||||||||
| Temporary facility | 522 | 80 | 48 | 144 | 41 | 29 | 7 | 97 |
| Tool | 36 | 823 | 2 | 23 | 2 | 7 | 1 | 17 |
| Machinery | 20 | 0 | 899 | 11 | 4 | 5 | 2 | 12 |
| Materials | 119 | 54 | 27 | 609 | 21 | 11 | 4 | 68 |
| Construction member | 3 | 1 | 3 | 1 | 913 | 0 | 0 | 0 |
| Structure | 3 | 15 | 0 | 3 | 0 | 888 | 0 | 5 |
| Soil and rock | 3 | 15 | 0 | 3 | 0 | 888 | 0 | 5 |
| Others | 69 | 40 | 28 | 76 | 6 | 19 | 7 | 692 |
| Metrics | ||||||||
| Accuracy | 0.84 | |||||||
| Precision | 0.68 | 0.81 | 0.89 | 0.70 | 0.93 | 0.93 | 0.98 | 0.78 |
| Recall | 0.54 | 0.90 | 0.94 | 0.67 | 0.99 | 0.97 | 0.99 | 0.74 |
| F1 score | 0.60 | 0.86 | 0.92 | 0.68 | 0.96 | 0.95 | 0.99 | 0.76 |
The confusion matrix and performance of the accident-causing object model are shown in Table 10. While it generally showed high performance, the recall values for ‘temporary facility’ and ‘materials’ were notably low, at 0.54 and 0.67, respectively. These two variables often get confused with each other, even by humans, affecting prediction performance. Of the actual accidents caused by ‘temporary facility,’ 144 cases were predicted as ‘materials,’ and of the actual accidents caused by ‘materials,’ 119 cases were predicted as ‘temporary facility.’ Additionally, 97 actual accidents caused by ‘temporary facility’ were incorrectly predicted as ‘others.’ For example, there was an accident where a worker fell from the system scaffolding while trying to avoid a falling Euroform during the scaffolding dismantling process. This accident was incorrectly recorded as being caused by a ‘temporary facility,’ but, in reality, it was an accident caused by the ‘materials,’ which is the Euroform. There was also the case where accidents caused by ‘tools’ were inaccurately predicted as those attributed to ‘temporary facilities.’ To illustrate, during a scaffold clamp-cutting operation, a worker’s finger was severed by a hand grinder. Even though this was clearly an accident caused by a tool, it was predicted as an accident by a temporary facility. This could be because multiple factors can influence a single accident, making it harder for the model to predict the main cause accurately.
In the accident-type prediction model, three accident types—’tripped,’ ‘fell,’ and ‘struck by object’—showed low recall values of 0.45, 0.52, and 0.59, respectively, as presented in Table 11. Unlike other variables, these three often got confused with each other due to the similarities in the accidents they represent. For instance, an accident where a worker trips over an object on the floor and falls off a building could involve both ‘tripped’ and ‘fell’ accident types. An accident where a worker trips and injures an ankle after being struck by a collapsed structure was reported as ‘struck by object,’ despite also involving the ‘tripped’ accident type. Another accident where a worker, who was not wearing a safety belt, fell to the ground while installing a system scaffold involved both ‘tripped’ and ‘fell’ accident types but was only entered as ‘fell.’ These problems arise because the accident data entry system only allows one accident type to be selected. This highlights a need for improvements in the data entry system. Possible solutions could be to unify the confusing variables into one or establish guidelines that clearly specify the accident type for each accident.
| Confusion matrix | Predicted | Others | ||||||
|---|---|---|---|---|---|---|---|---|
| Crushed | Pinched | Tripped | Fell | Struck by object | Hit | Slashed | ||
| Actual | ||||||||
| Crushed | 723 | 0 | 0 | 0 | 5 | 3 | 2 | 0 |
| Pinched | 0 | 546 | 37 | 23 | 38 | 21 | 20 | 14 |
| Tripped | 8 | 47 | 305 | 143 | 76 | 34 | 23 | 36 |
| Fell | 4 | 46 | 124 | 370 | 81 | 27 | 38 | 19 |
| Struck by object | 5 | 43 | 77 | 82 | 428 | 27 | 31 | 32 |
| Hit | 2 | 9 | 25 | 15 | 11 | 663 | 2 | 0 |
| Slashed | 0 | 13 | 19 | 16 | 18 | 3 | 652 | 2 |
| Others | 5 | 13 | 34 | 13 | 14 | 2 | 12 | 586 |
| Metrics | ||||||||
| Accuracy | 0.76 | |||||||
| Precision | 0.97 | 0.76 | 0.49 | 0.56 | 0.64 | 0.85 | 0.84 | 0.85 |
| Recall | 0.99 | 0.78 | 0.45 | 0.52 | 0.59 | 0.91 | 0.90 | 0.86 |
| F1 score | 0.98 | 0.77 | 0.47 | 0.54 | 0.62 | 0.88 | 0.87 | 0.86 |
Finally, the death-injury prediction model performed well, as shown in Table 12. However, given the approximately 20-fold difference in the number of instances for two variables in the original data, it is difficult to eliminate the problem of overfitting completely, even after performing sampling to address this imbalance and achieving very high F1 score. Nonetheless, considering that construction accident history data started to be collected from 2019, the number of data points is relatively limited at this point. With the expectation of collecting more data in the future, this issue is anticipated to be naturally resolved.
| Confusion matrix | Predicted | |
|---|---|---|
| Injury | Death | |
| Actual | ||
| Injury | 2,711 | 60 |
| Death | 1 | 822 |
| Metrics | ||
| Accuracy | 0.98 | |
| Precision | 1.00 | 0.93 |
| Recall | 0.98 | 1.00 |
| F1 score | 0.99 | 0.96 |
In summary, three submodels exhibited excellent performance, yet several issues need to be resolved. Both accident-causing object and accident-type models had ambiguities in the prediction of certain variables. Notably, in the accident-type prediction model, considerable confusion was observed with some variables, which highlighted problems in the data entry process. Thus, there is a need to improve the data entry process for the construction accident data being collected. It is also essential to provide better data entry guidelines to accident reporters to improve the quality of the data. In the death-injury model, one downside that was identified was the short data collection period, which led to an insufficient amount of data. This issue can be resolved as the data volume increases with more collection over time.
Construction Safety Management System Prototype
To validate and ensure the practical utility of the initial design and functionalities of the construction safety management system, feedback was collected from construction practitioners. Most practitioners were very positive about the potential on-site application of the system proposed in this study. However, they emphasized that there were areas needing improvement for actual site implementation. The key opinions and requirements derived from the interviews to enhance the system’s usability on-site are as follows: (1) a feature that allows for an overall view of the data utilized by the system is needed; (2) a ‘filtering’ feature that enables users to select and input variables is necessary since manually typing in data is inconvenient for practitioners; and (3) visualization of prediction results is needed to check the outcomes of the accident prediction model easily. Therefore, reflecting the practitioners’ feedback, a user interface (UI) and user experience (UX) for a web-based prototype of the safety management system were developed. The prototype was created via Tomcat, an open-sourced web application framework based on Java. To make it easy for construction site workers to use, the prototype offers several features developed based on research, with key features including accident data exploration, construction site risk assessment, and onsite accident prediction. The functionalities of the developed system prototype were introduced, and to verify the suitability of each function in real-world settings, comparisons and validations were conducted between the results obtained through variable inputs and actual data.
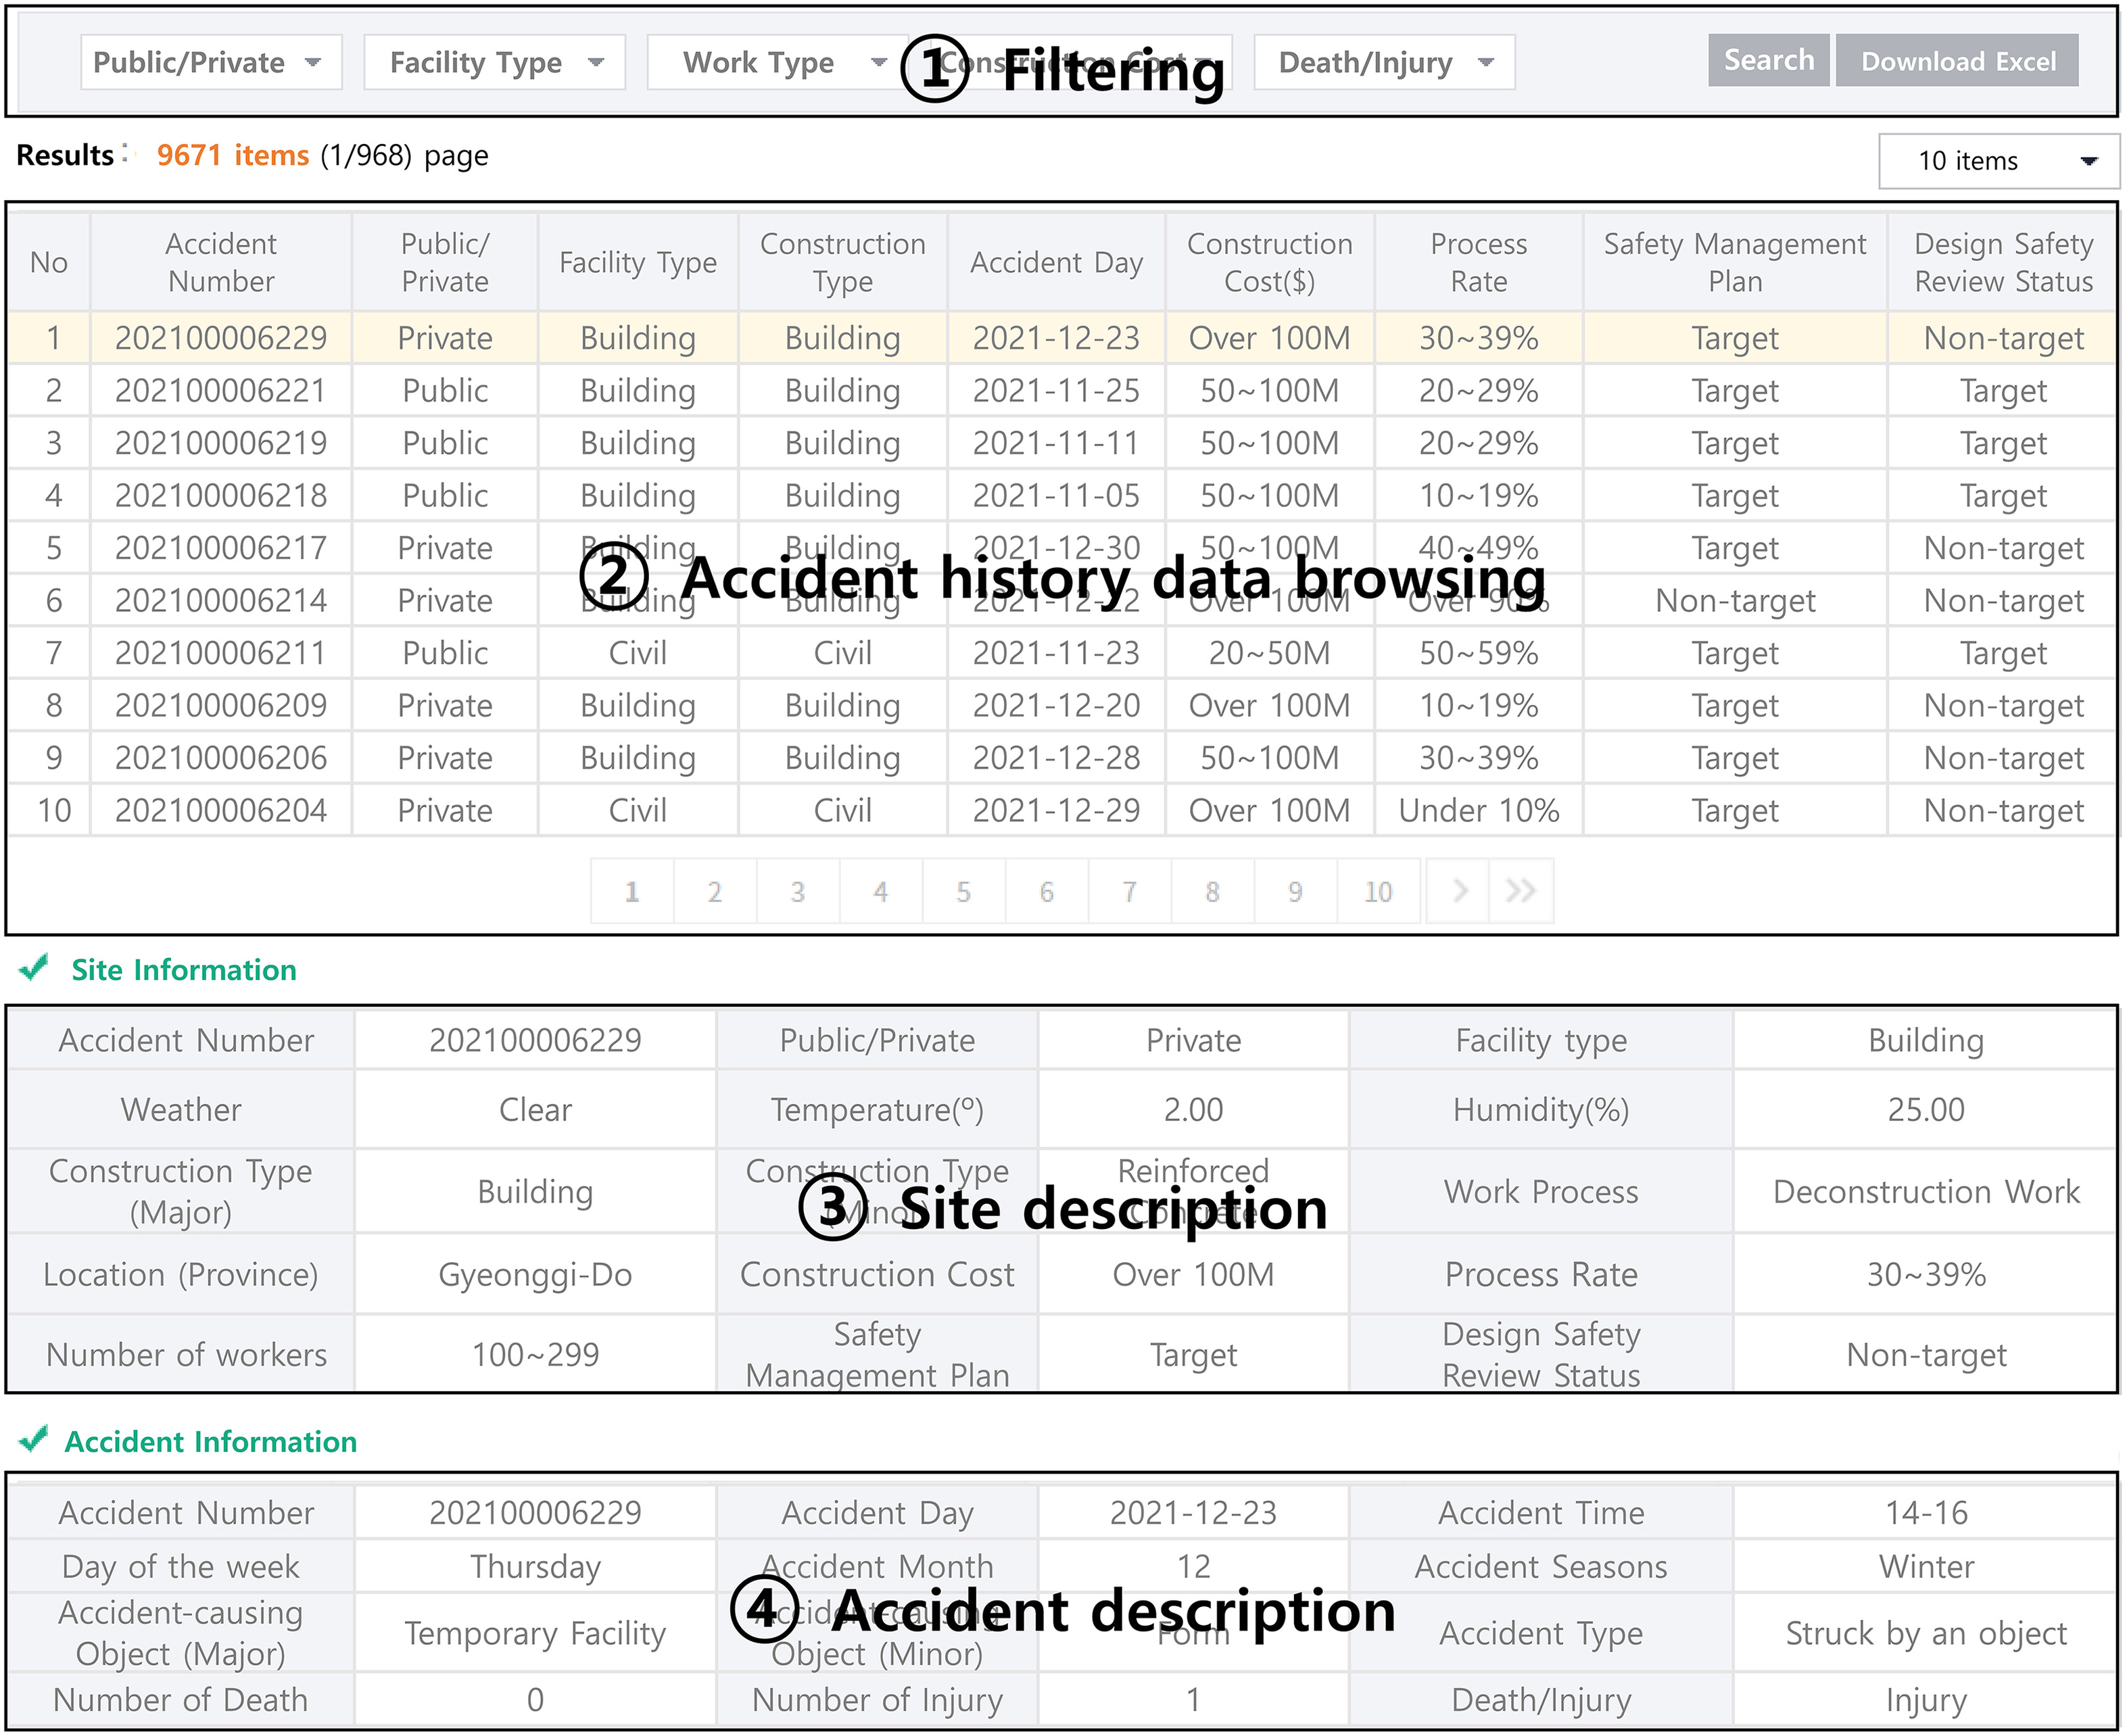
The accident data exploration interface displays the CSI accident history data collected up to the present in an accessible manner, as shown in Fig. 4. The “(1) filtering” function is designed to allow users to select variables directly, enabling them to search for the data they want. The “(2) accident history data browsing” function presents the accident history corresponding to the category selected by the user. As the data comprises a plethora of variables, the design is such that only representative variables are shown to enhance user convenience. The “(3) site description” function enables users to view detailed information about the site where the accident occurred when they select data marked in yellow in the data browsing function. Details include the ordering organization, facility type, construction type, location, and number of workers. The “(4) accident description” function allows users to view detailed information about the accident. Details include the date of the accident, time of the accident, object causing the accident, type of accident, number of fatalities, and number of injuries.
The construction site risk assessment interface displays the results of a risk analysis based on user input, as seen in Fig. 5. In the “(1) input variable selection,” users can choose the detailed categories of the site they are interested in, with the variables composed of the five major risk factors identified in this study. The “(2) risk assessment result” displays the risk analysis results for the site categories selected by the user. The risk analysis results provide a score based on the overall site and indicate its rank out of 1,429 site categories. Additionally, suppose the site in question falls into the category of small-scale sites with low construction costs. In that case, the system also provides its ranking among site categories with construction costs of less than $5 million. This design allows construction practitioners to more easily determine the risk of the site. The “(3) top 20 risk categories” provide information on the top 20 risk categories in terms of risk score. This feature can be used as a supplementary tool to support safety inspections at actual construction sites. For instance, if there are 10 sites requiring inspection, the risk rankings of these sites can be calculated by inputting their site classifications, helping to prioritize urgent inspections. This can enhance the efficiency of site inspection practitioners and contribute to effective accident prevention.
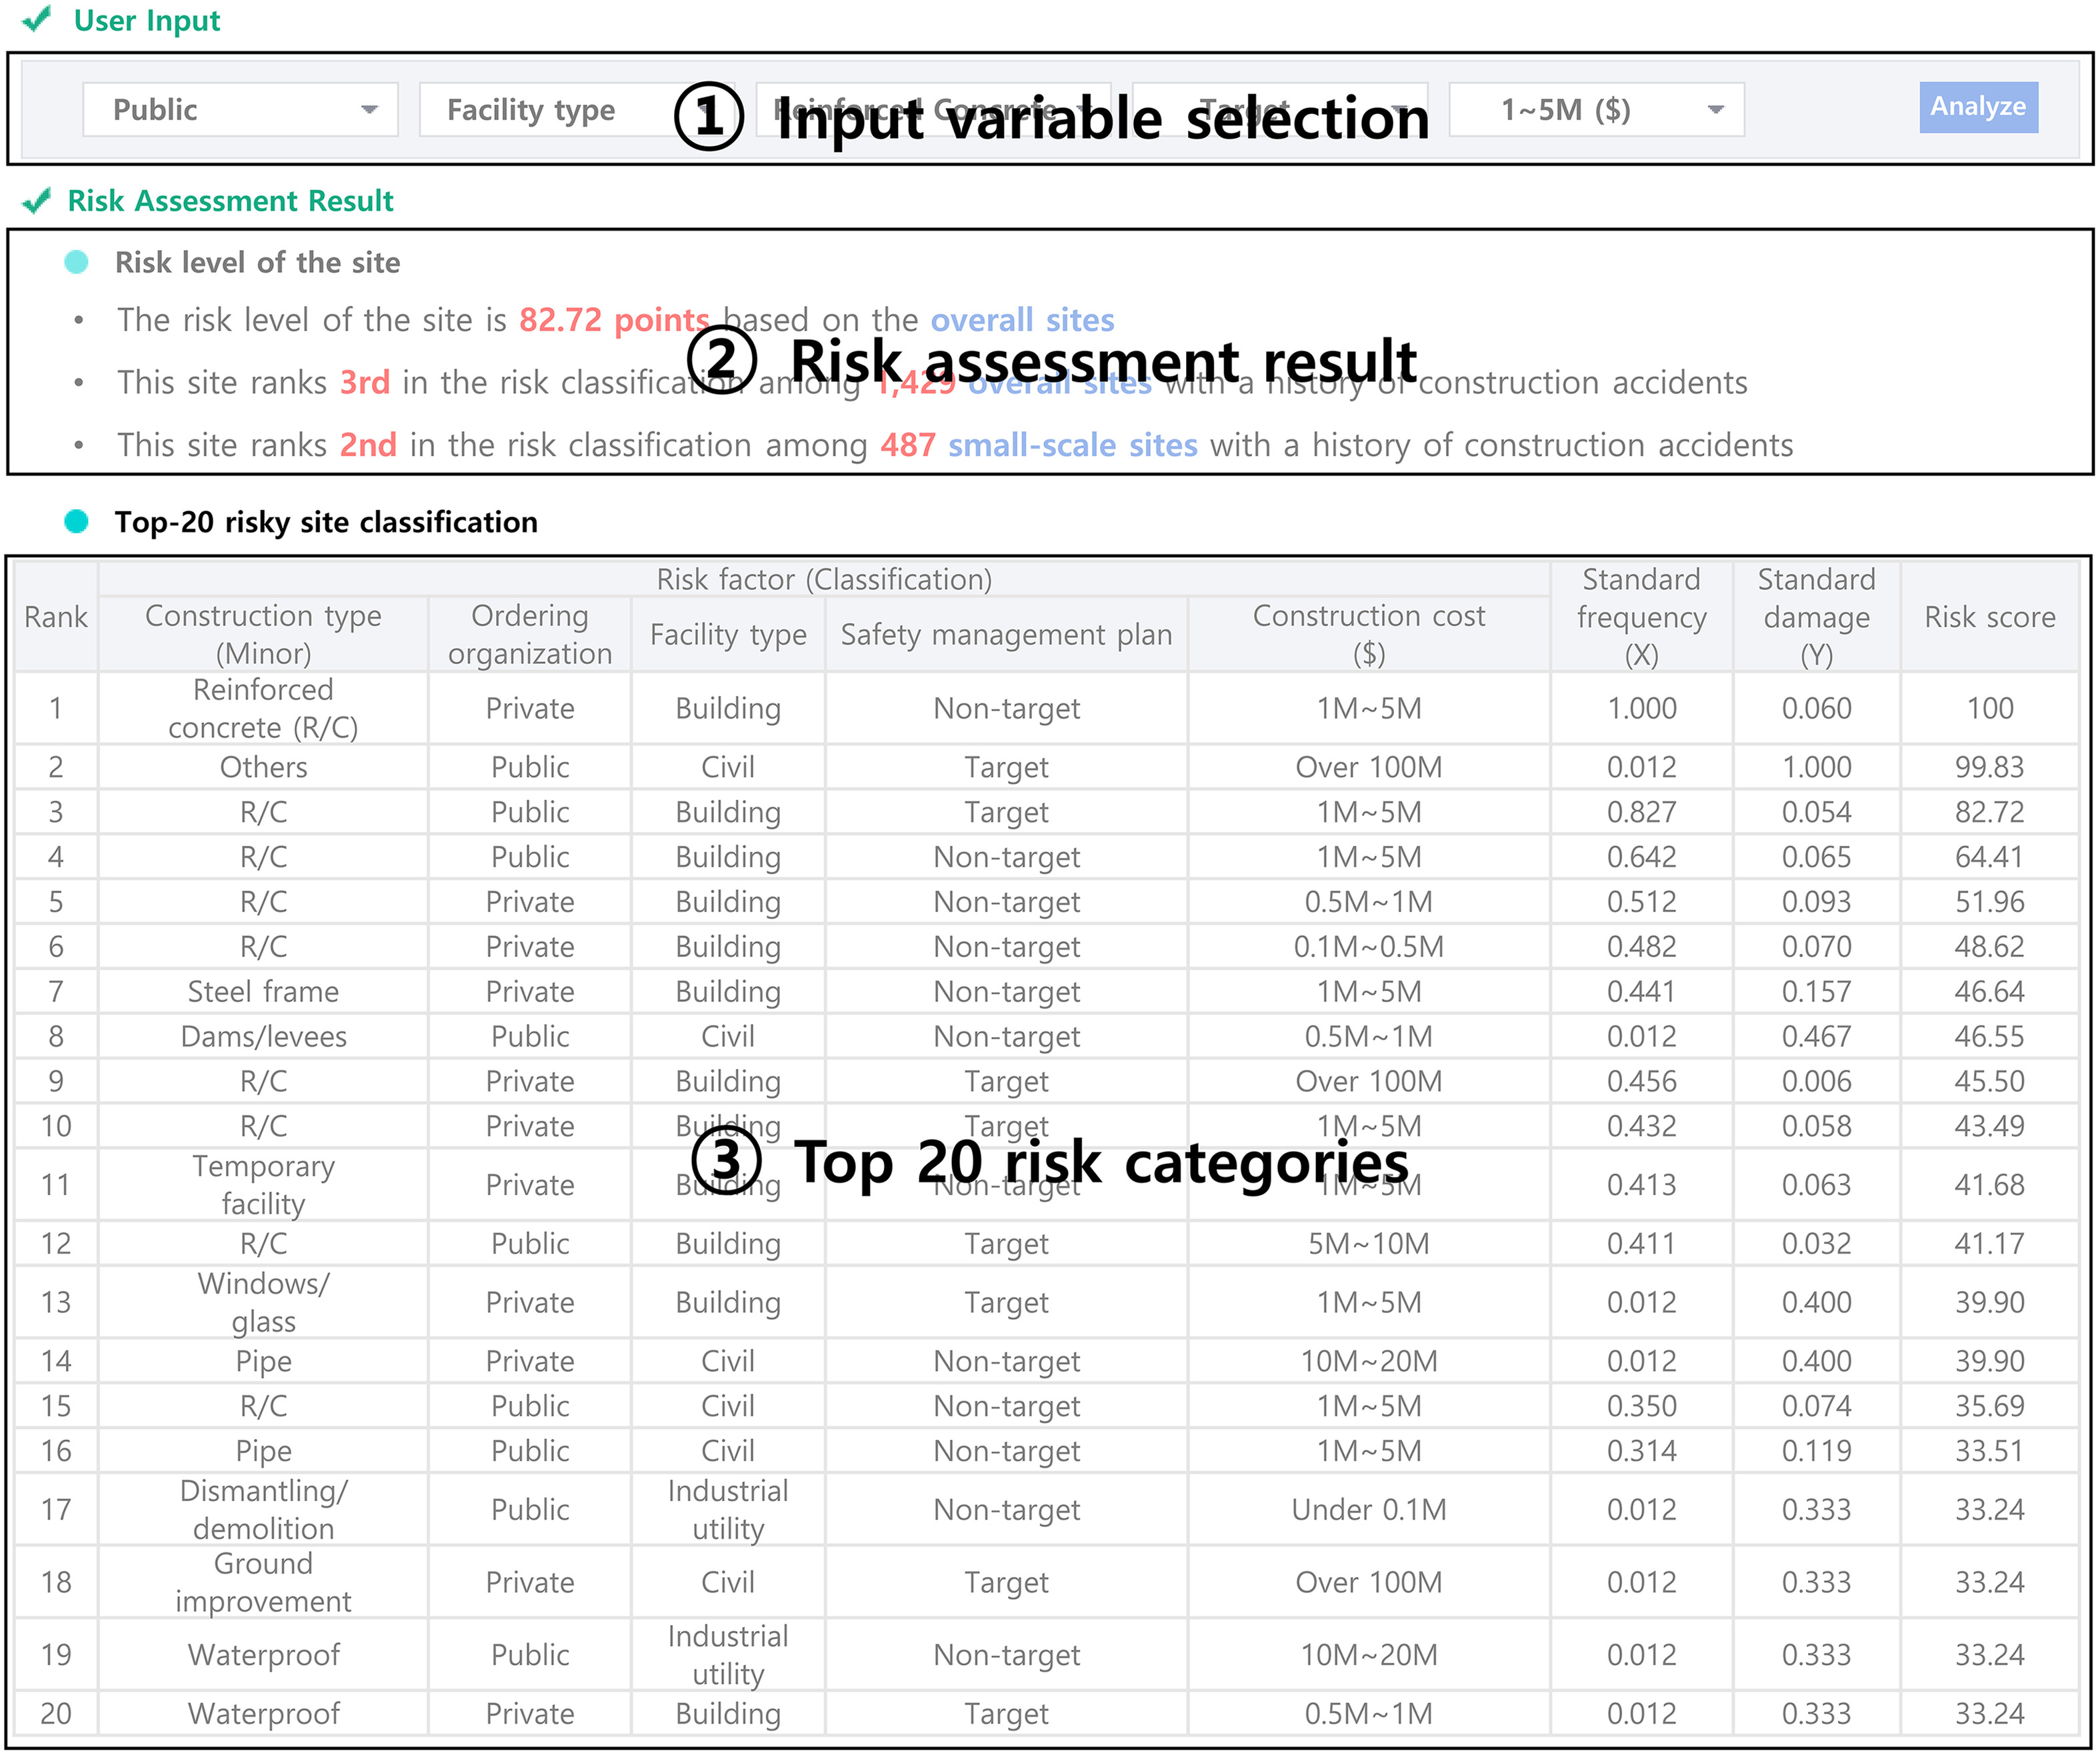
For comparison and verification with actual data, accidents corresponding to the same site category as shown in Fig. 5 (ordering organization = private; facility type = building; safety management plan = nontarget; construction ; construction type (minor) = reinforced concrete) were sorted. Out of a total of 9,671 accident cases, there were 91 cases classified under this category, involving one fatality and 90 injuries. Considering a total of 1,429 site categories, 91 cases represent a very high frequency. However, considering that there was only one fatality out of 91 accidents, it indicates a relatively low severity of accidents. This aligns with the results of the analysis in the system prototype (standard ; standard ). These findings support the reliability of the developed construction site risk assessment functionality, along with its suitability for real construction sites. Such practicality helps aid construction practitioners in making informed decisions about site safety. From academic perspectives, the interface incorporates a risk assessment methodology to generate risk scores and rankings for various site categories while allowing quantitative assessments of safety on specific site conditions. This supports facilitating comparative analyses and benchmarking studies across difference construction contexts.
The construction site accident prediction interface displays construction accident prediction results based on user input, as depicted in Fig. 6. In the “(1) input variable selection,” users can enter detailed information about the construction site, which is organized around variables used in model training. Given the abundance of variables, it could be more inefficient for users to type in the variables manually. Therefore, the interface was designed to categorize these detailed variables, facilitating an easier selection process for the users. “(2) Accident prediction result” provides the probability of an accident occurring in accordance with the three submodels developed in this study: accident-causing object, accident type, and death-injury. In construction sites, identifying multiple risk factors in advance can significantly influence accident prevention. Thus, the system determines the accident-causing object and accident type, providing predictive probabilities for each accident cause. This approach provides a total of four accident scenarios and the corresponding probabilities of death and injury for each scenario. Additionally, the right side of the screen explains detailed results through statistical analysis of the predicted risk objects. For instance, if the prediction result were ‘construction materials,’ then the interface would illustrate statistical rankings for the detailed objects belonging to the subcategory of construction materials, such as rebar, pins, and deck plates. In the “(3) result visualization,” the previous prediction results are visualized in the form of a graph. Through this feature, practitioners can check the risky objects, accident types, and the probabilities of death and injury and can predetermine the risk of an accident. Additionally, because the input of variables is flexible, it is possible to identify in detail the hazardous objects and types of accidents for various tasks within a single site. This allows site managers to conduct customized training for workers involved in each task.
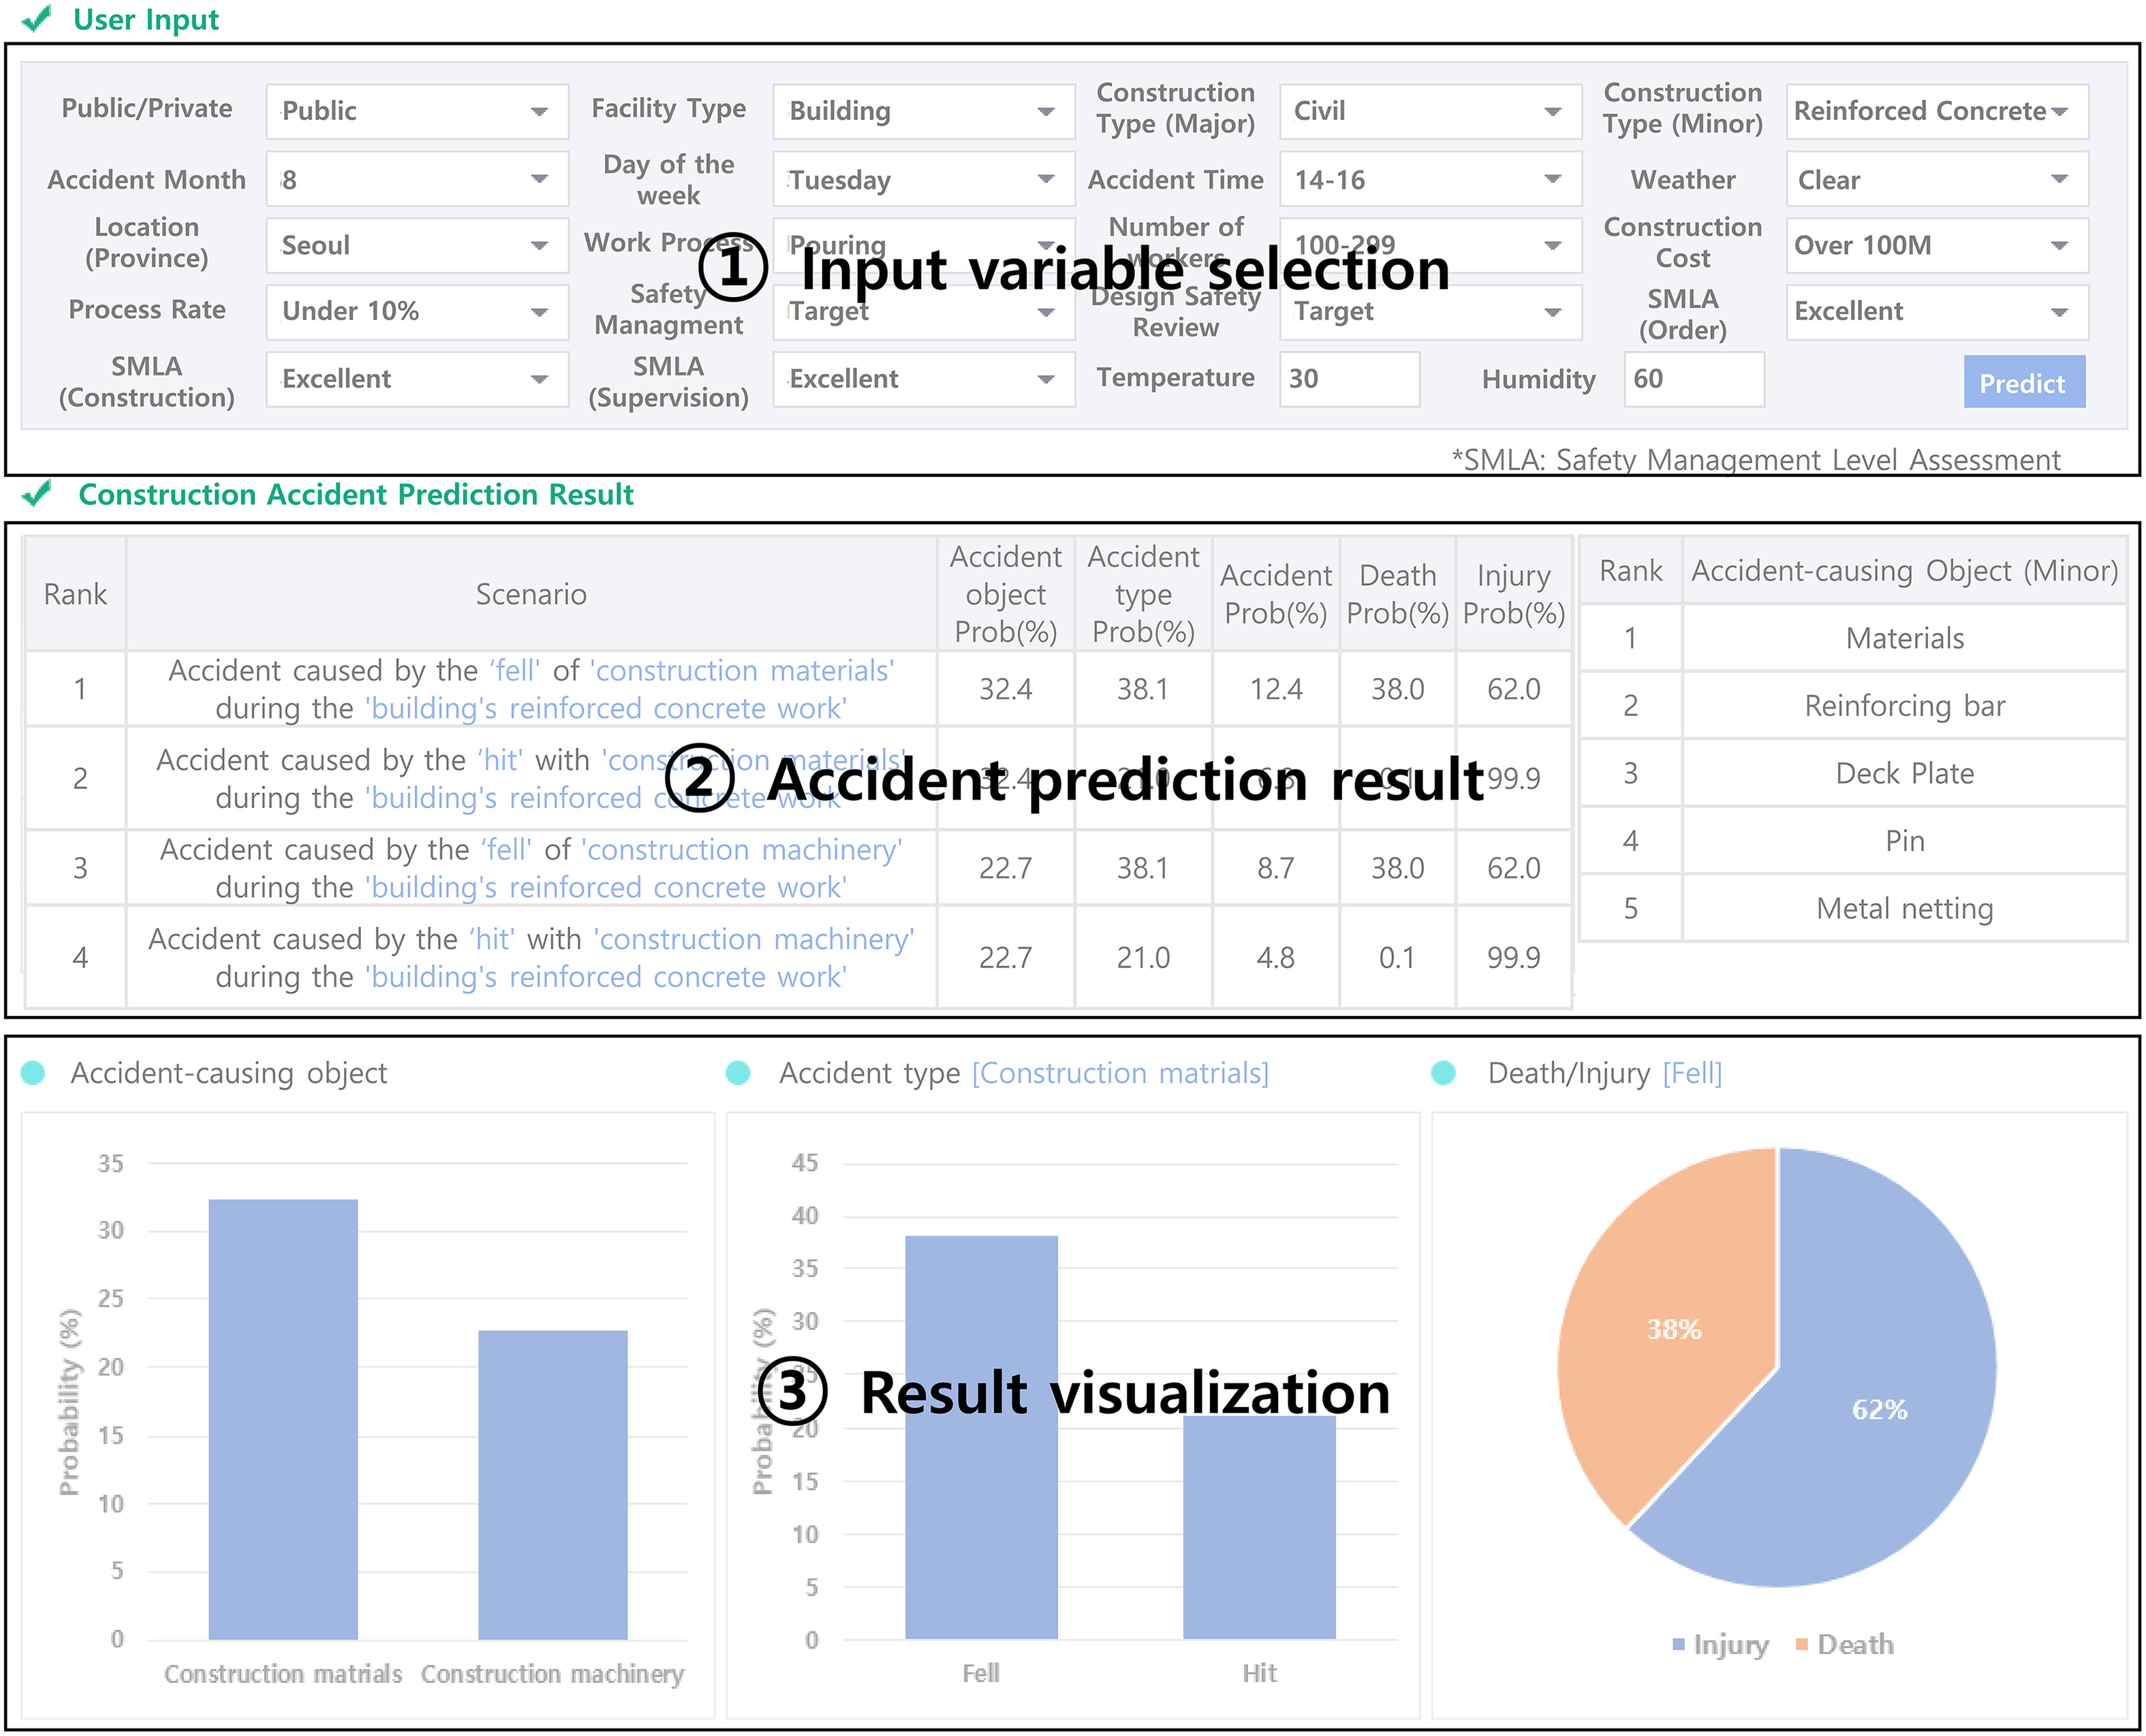
The practical usefulness of the construction site accident prediction feature was validated by testing it with random variables, as direct comparison with actual data is not feasible due to its predictive nature. A total of 100 tests were conducted, resulting in an average response time of 2.32 s. Generally, website users do not experience discomfort with response times below 2.5 s (Equation Research 2011). Therefore, the construction site accident prediction feature meets the acceptable standard. Considering that a predictive model is embedded, this also indicates that the developed prototype demonstrates good usability. Additionally, there was no instance of malfunction or incorrect output, and the visualization results for each scenario were accurately displayed. Through this process, the utility of the feature in real-world scenarios was validated.
The development and implementation of the accident prediction interface not only offer practical benefits for construction management but also make significant academic contributions to the field of construction safety research. The interface’s user-friendly design, with categorized input variables and intuitive visualization features, improves a better understanding of the underlying mechanisms of accidents in construction sites. Researchers can leverage the interface to conduct in-depth analyses of accident patterns and trends, leading to the development of more effective safety management strategies and policies. Furthermore, the interface’s practical usefulness through rigorous testing and performance evaluation contributes to the validation of predictive modeling techniques in real-world construction scenarios. Overall, the findings of this study serve as a valuable tool for both practitioners and researchers, offering insights, solutions, and opportunities for advancing knowledge and practices in construction safety management.
Conclusion
Along with the improvement of methods for preventing accidents on construction sites, this study aimed to develop accident prevention methodologies that construction practitioners can easily utilize. The research pursued three specific objectives. First, a methodology was developed to assess the risk of construction sites by considering site-specific characteristics through actual construction data. This led to the identification of five key influencing factors (i.e., construction type, facility type, ordering organization, construction cost, and safety management plan) on the risk of construction sites, and the results of risk assessment based on the combination of these factors for different site classifications were derived. Next, a construction accident prediction model was developed consisting of three submodels: accident-causing object, accident type, and death-injury. The optimal algorithm for each prediction model was determined by comparing the performances of four algorithms: RF, LGBM, XGBoost, and CatBoost. As a result, the XGBoost algorithm was selected as the optimal algorithm for all three submodels, and the accident-causing object model achieved an F1 score of 0.839, the accident-type model scored 0.749, and the death-injury model demonstrated excellent performance with a score of 0.977. Finally, the developed risk assessment methodology and construction accident prediction model were designed and developed into a web-based system prototype, focusing on UI and UX to ensure easy utilization by construction practitioners.
The findings of this study offer significant contributions to several key aspects of construction safety management. Firstly, the proposed risk assessment methodology for site classification provides a valuable tool for enhancing safety inspections. By identifying sites that require urgent inspection in advance, the methodology improves the efficiency and contributes to accident prevention by enabling early intervention in high-risk areas. Secondly, the developed construction accident prediction model equips practitioners with valuable insights into potential accident scenarios, including the identification of accident-causing objects, types, and magnitudes. This proactive approach allows for better preparation and mitigation strategies to be implemented on construction sites, reducing the likelihood and severity of accidents. Lastly, the proposed methodology and system demonstrate potential applicability beyond the construction industry. For instance, in the manufacturing sector, the risk assessment methodology can be adapted to identify factories in need of urgent inspections, while the accident prediction model can serve as benchmarking data for developing industry-specific accident prevention methodologies. Overall, this study contributes to advancing safety management practices in construction and related industries by providing practical tools and insights for proactive risk assessment and accident prevention.
This study also presents various opportunities for future research. Firstly, as a prototype of a construction site safety management system was proposed, analyzing its real-world impact within the construction industry is necessary. Subsequent research can analyze the effectiveness of accident prevention through system utilization and identify areas for improvement. Secondly, this study was based on construction accident data from South Korea. Therefore, utilizing construction accident data specific to different countries or regions can lead to the customization of accident prevention methodologies tailored to those areas. Lastly, the system developed in this study has expandability to various types of data. Besides the construction accident data, it can be linked to data such as facility maintenance records and contractor information. Future research can leverage this to develop more diverse and effective accident prevention methodologies than the current state.
Data Availability Statement
All data, models, or code that support the findings of this study are available from the corresponding author upon reasonable request.
Acknowledgments
This work was supported by the National Research Foundation of Korea (NRF) grant funded by the Korea government (MSIT) (No. RS-2023-00241758) and the “National R&D Project for Smart Construction Technology (No. 23SMIP-A158708-04)” funded by the Korea Agency for Infrastructure Technology Advancement under the Ministry of Land, Infrastructure, and Transport. The authors sincerely acknowledge the construction accident data support from the Korea Authority of Land and Infrastructure Safety (KALIS).
References
Ahmed, S., M. A. Hossain, S. K. Ray, M. M. I. Bhuiyan, and S. R. Sabuj. 2023. “A study on road accident prediction and contributing factors using explainable machine learning models: Analysis and performance.” Transp. Res. Interdiscip. Perspect. 19 (May): 100814. https://doi.org/10.1016/j.trip.2023.100814.
Bhattacharyya, A., S. Yoon, T. J. Weidner, and M. Hastak. 2021. “Purdue index for construction analytics: Prediction and forecasting model development.” J. Manage. Eng. 37 (5): 04021052. https://doi.org/10.1061/(ASCE)ME.1943-5479.0000944.
Chakraborty, D., H. Elhegazy, H. Elzarka, and L. Gutierrez. 2020. “A novel construction cost prediction model using hybrid natural and light gradient boosting.” Adv. Eng. Inf. 46 (Oct): 101201. https://doi.org/10.1016/j.aei.2020.101201.
Chang, T., G. Lee, and S. Chi. 2023. “Development of an optimized condition estimation model for bridge components using data-driven approaches.” J. Perform. Constr. Facil. 37 (3): 04023013. https://doi.org/10.1061/JPCFEV.CFENG-4359.
Chellappa, V., and U. R. Salve. 2023. “Fall risk assessment for vertical formwork activities in construction.” ASCE-ASME J. Risk Uncertainty Eng. Syst. Part A: Civ. Eng. 9 (4): 04023027. https://doi.org/10.1061/AJRUA6.RUENG-958.
Chen, C., X. Li, W. Yao, Z. Wang, and H. Zhu. 2022. “Analysis of the impact of construction robots on workers’ health.” Build Environ. 225 (Nov): 109595. https://doi.org/10.1016/j.buildenv.2022.109595.
Cheng, C. W., S. Sen Leu, Y. M. Cheng, T. C. Wu, and C. C. Lin. 2012. “Applying data mining techniques to explore factors contributing to occupational injuries in Taiwan’s construction industry.” Accid. Anal. Prev. 48 (Sep): 214–222. https://doi.org/10.1016/j.aap.2011.04.014.
Cheng, C. W., S. Sen Leu, C. C. Lin, and C. Fan. 2010. “Characteristic analysis of occupational accidents at small construction enterprises.” Saf. Sci. 48 (6): 698–707. https://doi.org/10.1016/j.ssci.2010.02.001.
Cheng, M. Y., D. Kusoemo, and R. A. Gosno. 2020. “Text mining-based construction site accident classification using hybrid supervised machine learning.” Autom. Constr. 118 (Oct): 103265. https://doi.org/10.1016/j.autcon.2020.103265.
Cho, M., D. Lee, J. Park, and S. Park. 2022. “Development of machine learning-based construction accident prediction model using structured and unstructured data of construction sites.” J. Civ. Environ. Eng. Res. 42 (1): 127–134. https://doi.org/10.12652/Ksce.2022.42.1.0127.
Choi, J., B. Gu, S. Chin, and J. S. Lee. 2020. “Machine learning predictive model based on national data for fatal accidents of construction workers.” Autom. Constr. 110 (Feb): 102974. https://doi.org/10.1016/j.autcon.2019.102974.
Chong, H. Y., and T. S. Low. 2014. “Accidents in Malaysian construction industry: Statistical data and court cases.” Int. J. Occup. Saf. Ergon. 20 (3): 503–513. https://doi.org/10.1080/10803548.2014.11077064.
Choudhry, R. M., D. Fang, and S. Mohamed. 2007. “Developing a model of construction safety culture.” J. Manage. Eng. 23 (4): 207–212. https://doi.org/10.1061/(ASCE)0742-597X(2007)23:4(207).
Douzas, G., and F. Bacao. 2019. “Geometric SMOTE a geometrically enhanced drop-in replacement for SMOTE.” Inf. Sci. 501 (Apr): 118–135. https://doi.org/10.1016/j.ins.2019.06.007.
Equation Research. 2011. How long are you willing to wait for a single webpage to load on your mobile phone before leaving the site? Hamburg, Germany: Statista Research Department.
Fang, D., C. Wu, and H. Wu. 2015. “Impact of the supervisor on worker safety behavior in construction projects.” J. Manage. Eng. 31 (6): 04015001. https://doi.org/10.1061/(ASCE)ME.1943-5479.0000355.
Feng, S., J. Keung, X. Yu, Y. Xiao, and M. Zhang. 2021. “Investigation on the stability of SMOTE-based oversampling techniques in software defect prediction.” Inf. Software Technol. 139 (Nov): 106662. https://doi.org/10.1016/j.infsof.2021.106662.
Forteza, F. J., J. M. Carretero-Gómez, and A. Sesé. 2017. “Occupational risks, accidents on sites and economic performance of construction firms.” Saf. Sci. 94 (Apr): 61–76. https://doi.org/10.1016/j.ssci.2017.01.003.
Fung, I. W. H., T. Y. Lo, and K. C. F. Tung. 2012. “Towards a better reliability of risk assessment: Development of a qualitative & quantitative risk evaluation model (Q 2REM) for different trades of construction works in Hong Kong.” Accid. Anal. Prev. 48 (Sep): 167–184. https://doi.org/10.1016/j.aap.2011.05.011.
Fung, I. W. H., V. W. Y. Tam, T. Y. Lo, and L. L. H. Lu. 2010. “Developing a risk assessment model for construction safety.” Int. J. Project Manage. 28 (6): 593–600. https://doi.org/10.1016/j.ijproman.2009.09.006.
Goh, Y. M., C. U. Ubeynarayana, K. L. X. Wong, and B. H. W. Guo. 2018. “Factors influencing unsafe behaviors: A supervised learning approach.” Accid. Anal. Prev. 118 (Sep): 77–85. https://doi.org/10.1016/j.aap.2018.06.002.
Gurcanli, G. E., S. Bilir, and M. Sevim. 2015. “Activity based risk assessment and safety cost estimation for residential building construction projects.” Saf. Sci. 80 (Dec): 1–12. https://doi.org/10.1016/j.ssci.2015.07.002.
Halabi, Y., H. Xu, D. Long, Y. Chen, Z. Yu, F. Alhaek, and W. Alhaddad. 2022. “Causal factors and risk assessment of fall accidents in the U.S. construction industry: A comprehensive data analysis (2000–2020).” Saf. Sci. 146 (Feb): 105537. https://doi.org/10.1016/j.ssci.2021.105537.
Hallowell, M. R. 2012. “Safety-knowledge management in American construction organizations.” J. Manage. Eng. 28 (2): 203–211. https://doi.org/10.1061/(ASCE)ME.1943-5479.0000067.
Hasan, A. S., M. Jalayer, S. Das, and M. Asif Bin Kabir. 2023. “Application of machine learning models and SHAP to examine crashes involving young drivers in New Jersey.” Int. J. Transp. Sci. Technol. 14 (Jun): 156–170. https://doi.org/10.1016/j.ijtst.2023.04.005.
Health and Safety Executive. 2015. Managing health and safety in construction: Construction (design and management) regulations 2015: Guidance on regulations, 1–90. Merseyside, UK: Health and Safety Executive.
Hon, C. K. H., and A. P. C. Chan. 2014. “Safety management in repair, maintenance, minor alteration, and addition works: Knowledge management perspective.” J. Manage. Eng. 30 (6): 04014026. https://doi.org/10.1061/(ASCE)ME.1943-5479.0000233.
Hong, Y., A. W. A. Hammad, and A. Akbarnezhad. 2019. “Impact of organization size and project type on BIM adoption in the Chinese construction market.” Construct. Manage. Econ. 37 (11): 675–691. https://doi.org/10.1080/01446193.2019.1575515.
Hwang, J. M., J. H. Won, H. J. Jeong, and S. H. Shin. 2023. “Identifying critical factors and trends leading to fatal accidents in small-scale construction sites in Korea.” Buildings 13 (10): 2472. https://doi.org/10.3390/buildings13102472.
Jannadi, O. A., and S. Almishari. 2003. “Risk assessment in construction.” J. Constr. Eng. Manage. 129 (5): 492–500. https://doi.org/10.1061/(ASCE)0733-9364(2003)129:5(492).
Jeong, J., and J. Jeong. 2022. “Quantitative risk evaluation of fatal incidents in construction based on frequency and probability analysis.” J. Manage. Eng. 38 (2): 04021089. https://doi.org/10.1061/(ASCE)ME.1943-5479.0000998.
Jiang, J., F. Wang, Y. Wang, W. Jiang, Y. Qiao, W. Bai, and X. Zheng. 2023. “An urban road risk assessment framework based on convolutional neural networks.” Int. J. Disaster Risk Sci. 14 (3): 475–487. https://doi.org/10.1007/s13753-023-00498-7.
Johansen, K. W., C. Schultz, and J. Teizer. 2023. “Hazard ontology and 4D benchmark model for facilitation of automated construction safety requirement analysis.” Comput.-Aided Civ. Infrastruct. Eng. 38 (15): 2128–2144. https://doi.org/10.1111/mice.12988.
Junhao, W., Y. Miyazaki, K. Kitamura, and F. Sato. 2022. “Construction of collision-type prediction models based on pre-crash data for advanced driver assistance systems.” Int. J. Autom. Eng. 13 (4): 163–168. https://doi.org/10.20485/jsaeijae.13.4_163.
Kang, K., and H. Ryu. 2019. “Predicting types of occupational accidents at construction sites in Korea using random forest model.” Saf. Sci. 120 (Jun): 226–236. https://doi.org/10.1016/j.ssci.2019.06.034.
Kang, Y. 2018. “Use of fall protection in the US construction industry.” J. Manage. Eng. 34 (6): 04018045. https://doi.org/10.1061/(ASCE)ME.1943-5479.0000655.
Kim, K. N., T. H. Kim, and M. J. Lee. 2023. “Analysis of building construction jobsite accident scenarios based on big data association analysis.” Buildings 13 (8): 2120. https://doi.org/10.3390/buildings13082120.
Kim, T., and S. Chi. 2019. “Accident case retrieval and analyses: Using natural language processing in the construction industry.” J. Constr. Eng. Manage. 145 (3): 04019004. https://doi.org/10.1061/(ASCE)CO.1943-7862.0001625.
Koc, K. 2023. “Role of national conditions in occupational fatal accidents in the construction industry using interpretable machine learning approach.” J. Manage. Eng. 39 (6): 04023037. https://doi.org/10.1061/JMENEA.MEENG-5516.
Koc, K., and A. P. Gurgun. 2022. “Scenario-based automated data preprocessing to predict severity of construction accidents.” Autom. Constr. 140 (Aug): 104351. https://doi.org/10.1016/j.autcon.2022.104351.
KOSIS (Korean Statistical Information Service). 2022. Disaster statistics and analytics by industry. Beijing: KOSIS.
Lee, J. Y., Y. G. Yoon, T. K. Oh, S. Park, and S. Il Ryu. 2020. “A study on data pre-processing and accident prediction modelling for occupational accident analysis in the construction industry.” Appl. Sci. 10 (21): 1–23. https://doi.org/10.3390/app10217949.
Leu, S. S., and C. M. Chang. 2013. “Bayesian-network-based safety risk assessment for steel construction projects.” Accid. Anal. Prev. 54 (May): 122–133. https://doi.org/10.1016/j.aap.2013.02.019.
Li, D., C. Fu, T. Sayed, and W. Wang. 2023. “An integrated approach of machine learning and Bayesian spatial Poisson model for large-scale real-time traffic conflict prediction.” Accid. Anal. Prev. 192 (Nov): 107286. https://doi.org/10.1016/j.aap.2023.107286.
Lim, S., A.-R. Oh, J.-H. Won, and J.-J. Chon. 2018. “Improvement of inspection system for reduction of small-scale construction site accident in Korea.” Ind. Health 56 (6): 466–474. https://doi.org/10.2486/indhealth.2018-0033.
Liu, C., S. M. E. Sepasgozar, S. Shirowzhan, and G. Mohammadi. 2022. “Applications of object detection in modular construction based on a comparative evaluation of deep learning algorithms.” Constr. Innov. 22 (1): 141–159. https://doi.org/10.1108/CI-02-2020-0017.
López Arquillos, A., J. C. Rubio Romero, and A. Gibb. 2012. “Analysis of construction accidents in Spain, 2003-2008.” J. Saf. Res. 43 (5–6): 381–388. https://doi.org/10.1016/j.jsr.2012.07.005.
Marhavilas, P. K., and D. E. Koulouriotis. 2008. “A risk-estimation methodological framework using quantitative assessment techniques and real accidents’ data: Application in an aluminum extrusion industry.” J. Loss Prev. Process Ind. 21 (6): 596–603. https://doi.org/10.1016/j.jlp.2008.04.009.
McHugh, M. L. 2012. “The Chi-square test of independence.” Biochem. Med. 23 (2): 143–149. https://doi.org/10.11613/BM.2013.018.
Ministry of Employment and Labor. 2021. “Occupational safety and health act.” Accessed July 15, 2024. https://elaw.klri.re.kr/eng_service/lawView.do?hseq=43289&lang=ENG.
Ministry of Land, Infrastructure, and Transport. 2021. Risk profile management system manual, 1–16. Tokyo: Ministry of Land, Infrastructure, and Transport.
Ministry of Land, Infrastructure, and Transport. 2022. Safety inspection and construction site inspection management system manual, 1–38. Tokyo: Ministry of Land, Infrastructure, and Transport.
Mohamed, S. 2002. “Safety climate in construction site environments.” J. Constr. Eng. Manage. 128 (5): 375–384. https://doi.org/10.1061/(ASCE)0733-9364(2002)128:5(375).
Molenaar, K. R., J.-I. Park, and S. Washington. 2009. “Framework for measuring corporate safety culture and its impact on construction safety performance.” J. Constr. Eng. Manage. 135 (6): 488–496. https://doi.org/10.1061/(ASCE)0733-9364(2009)135:6(488).
Moon, S., S. Chi, and S. B. Im. 2022. “Automated detection of contractual risk clauses from construction specifications using bidirectional encoder representations from transformers (BERT).” Autom. Constr. 142 (Oct): 104465. https://doi.org/10.1016/j.autcon.2022.104465.
Nasrollahzadeh, A. A., A. R. Sofi, and B. Ravani. 2021. “Identifying factors associated with roadside work zone collisions using machine learning techniques.” Accid. Anal. Prev. 158 (Aug): 106203. https://doi.org/10.1016/j.aap.2021.106203.
Oguz Erkal, E. D., M. R. Hallowell, and S. Bhandari. 2021. “Practical assessment of potential predictors of serious injuries and fatalities in construction.” J. Constr. Eng. Manage. 147 (10): 04021129. https://doi.org/10.1061/(ASCE)CO.1943-7862.0002146.
Park, J., S. Park, and T. Oh. 2015. “The development of a web-based construction safety management information system to improve risk assessment.” KSCE J. Civ. Eng. 19 (3): 528–537. https://doi.org/10.1007/s12205-014-0664-2.
Pereira, E., S. Ahn, S. Han, and S. Abourizk. 2018. “Identification and association of high-priority safety management system factors and accident precursors for proactive safety assessment and control.” J. Manage. Eng. 34 (1): 04017041. https://doi.org/10.1061/(ASCE)ME.1943-5479.0000562.
Perlman, A., R. Sacks, and R. Barak. 2014. “Hazard recognition and risk perception in construction.” Saf. Sci. 64 (Apr): 22–31. https://doi.org/10.1016/j.ssci.2013.11.019.
Poh, C. Q. X., C. U. Ubeynarayana, and Y. M. Goh. 2018. “Safety leading indicators for construction sites: A machine learning approach.” Autom. Constr. 93 (Sep): 375–386. https://doi.org/10.1016/j.autcon.2018.03.022.
Ryu, H., S. Ha, K. Son, and S. Son. 2021. “Development of a quantification model for human accidents on construction sites in South Korea.” J. Asian Archit. Build. Eng. 20 (6): 760–767. https://doi.org/10.1080/13467581.2020.1816472.
Sadeghi, H., S. R. Mohandes, M. R. Hosseini, S. Banihashemi, A. Mahdiyar, and A. Abdullah. 2020. “Developing an ensemble predictive safety risk assessment model: Case of Malaysian construction projects.” Int. J. Environ. Res. Public Health 17 (22): 8395. https://doi.org/10.3390/ijerph17228395.
Sanni-Anibire, M. O., A. S. Mahmoud, M. A. Hassanain, and B. A. Salami. 2020. “A risk assessment approach for enhancing construction safety performance.” Saf. Sci. 121 (Jan): 15–29. https://doi.org/10.1016/j.ssci.2019.08.044.
Sarkar, S., A. Pramanik, J. Maiti, and G. Reniers. 2020. “Predicting and analyzing injury severity: A machine learning-based approach using class-imbalanced proactive and reactive data.” Saf. Sci. 125 (May): 104616. https://doi.org/10.1016/j.ssci.2020.104616.
Searle, D. 2023. “The effect of formalising worker involvement in the risk assessment process on the accident rate within UK higher education.” Soc. Sci. Humanit. Open 8 (1): 100572. https://doi.org/10.1016/j.ssaho.2023.100572.
Shapira, A., F. Asce, and B. Lyachin. 2009. “Identification and analysis of factors affecting safety on construction sites with tower cranes.” J. Constr. Eng. Manage. 135 (1): 24–33. https://doi.org/10.1061/(ASCE)0733-9364(2009)135:1(24).
Shi, L., C. Qian, and F. Guo. 2022. “Real-time driving risk assessment using deep learning with XGBoost.” Accid. Anal. Prev. 178 (Dec): 106836. https://doi.org/10.1016/j.aap.2022.106836.
Sodangi, M. 2023. “Safety risk factors for tower cranes used by small and medium-scale contractors on construction sites.” Int. J. Adv. Sci. Eng. Inf. Technol. 13 (Mar): 2. https://doi.org/10.18517/ijaseit.13.2.17266.
Suh, Y. 2021. “Sectoral patterns of accident process for occupational safety using narrative texts of OSHA database.” Saf. Sci. 142 (Oct): 105363. https://doi.org/10.1016/j.ssci.2021.105363.
Tixier, A. J. P., M. R. Hallowell, B. Rajagopalan, and D. Bowman. 2016. “Application of machine learning to construction injury prediction.” Autom. Constr. 69 (Sep): 102–114. https://doi.org/10.1016/j.autcon.2016.05.016.
Wan, X., W. Wang, J. Liu, and T. Tong. 2014. “Estimating the sample mean and standard deviation from the sample size, median, range and/or interquartile range.” BMC Med. Res. Methodol. 14 (Dec): 1–13. https://doi.org/10.1186/1471-2288-14-135.
Wu, X., Q. Liu, L. Zhang, M. J. Skibniewski, and Y. Wang. 2015. “Prospective safety performance evaluation on construction sites.” Accid. Anal. Prev. 78 (Apr): 58–72. https://doi.org/10.1016/j.aap.2015.02.003.
Wuni, I. Y., G. Q. Shen, and A. B. Saka. 2023. “Computing the severities of critical onsite assembly risk factors for modular integrated construction projects.” Eng. Constr. Archit. Manage. 30 (5): 1864–1882. https://doi.org/10.1108/ECAM-07-2021-0630.
Xia, X., P. Xiang, S. Khanmohammadi, T. Gao, and M. Arashpour. 2024. “Predicting safety accident costs in construction projects using ensemble data-driven models.” J. Constr. Eng. Manage. 150 (7): 04024054. https://doi.org/10.1061/JCEMD4.COENG-14397.
Zhang, A., K. C. P. Wang, B. Li, E. Yang, X. Dai, Y. Peng, Y. Fei, Y. Liu, J. Q. Li, and C. Chen. 2017. “Automated pixel-level pavement crack detection on 3D asphalt surfaces using a deep-learning network.” Comput.-Aided Civ. Infrastruct. Eng. 32 (10): 805–819. https://doi.org/10.1111/mice.12297.
Zhang, F., H. Fleyeh, X. Wang, and M. Lu. 2019. “Construction site accident analysis using text mining and natural language processing techniques.” Autom. Constr. 99 (Jun): 238–248. https://doi.org/10.1016/j.autcon.2018.12.016.
Zhang, Z., H. Guo, P. Gao, Y. Wang, and Y. Fang. 2023. “Impact of owners’ safety management behavior on construction workers’ unsafe behavior.” Saf. Sci. 158 (Feb): 105944. https://doi.org/10.1016/j.ssci.2022.105944.
Zhao, Y., and W. Deng. 2022. “Prediction in traffic accident duration based on heterogeneous ensemble learning.” Appl. Artif. Intell. 36 (1): 2018643. https://doi.org/10.1080/08839514.2021.2018643.
Zolfagharian, S., J. Irizarry, A. Ressang, M. Nourbakhsh, and M. Gheisari. 2014. “Automated safety planning approach for residential construction sites in Malaysia.” Int. J. Constr. Manage. 14 (3): 134–147. https://doi.org/10.1080/15623599.2014.926190.
Information & Authors
Information
Published In

Journal of Management in Engineering
Volume 40 • Issue 6 • November 2024
Copyright
This work is made available under the terms of the Creative Commons Attribution 4.0 International license, https://creativecommons.org/licenses/by/4.0/.
History
Received: Dec 7, 2023
Accepted: May 20, 2024
Published online: Aug 2, 2024
Published in print: Nov 1, 2024
Discussion open until: Jan 2, 2025
ASCE Technical Topics:
- Accidents
- Business management
- Construction engineering
- Construction management
- Construction methods
- Construction sites
- Disaster risk management
- Engineering fundamentals
- Occupational safety
- Practice and Profession
- Public administration
- Public health and safety
- Risk management
- Safety
- Systems engineering
- Systems management
Authors
Metrics & Citations
Metrics
Citations
Download citation
If you have the appropriate software installed, you can download article citation data to the citation manager of your choice. Simply select your manager software from the list below and click Download.