Midsummer Deficit Irrigation of Alfalfa for Water Conservation in the San Joaquin Valley of California
Publication: Journal of Irrigation and Drainage Engineering
Volume 150, Issue 6
Abstract
A four-year research experiment was conducted on sandy loam soil at the University of California Kearney Agricultural Research and Extension Center in Parlier, California, to investigate the effect of midsummer deficit irrigation on alfalfa yield, irrigation water productivity (IWP), and crop water productivity (CWP). The experiment was a randomized block design with two treatments: full and deficit irrigations with three replications. Applied irrigation water was measured using flow meters and soil matric potentials were monitored using watermark soil moisture sensors. Actual evapotranspiration () values were estimated from Tule Technologies stations. The deficit irrigation treatments resulted in 454, 706, 625, and 815 mm of irrigation water savings as compared to the full irrigation treatments in 2019, 2020, 2021, and 2022, respectively. These values represent 30.3%, 40.9%, 37.0%, and 49.1% of the applied water savings. Alfalfa yield in the deficit treatments was reduced by 3.94, 2.04, 1.25, and ; the equivalent of 18.1%, 11.1%, 7.1%, and 3.0% of the yield for the full irrigation treatment for the four years: with an average reduction of 10.7%. IWP was higher when deficit irrigation was implemented and resulted in 17.09, 16.11, 15.40, and , in 2019, 2020, 2021, and 2022, respectively. The production function using applied irrigation water (IW, mm) was: and for the full and deficit irrigation treatments, respectively. CWP was 18.6, 16.4, 14.9, and for fully irrigated treatments, and 15.2, 14.9, 14.3, and for the deficit irrigation treatments, for 2019, 2020, 2021, and 2022, respectively. Results from this work provide growers with viable deficit irrigation practices that could be implemented during drought periods.
Introduction
Alfalfa is one of the major field crops in California with relatively high water use due to its long growing season (UC Davis 2023). Alfalfa is an important forage legume crop in many parts of the world for dairy and cattle feeding industries. Alfalfa is an integral part of the dairy industry in the state and contributed $1.1 billion to California’s economy in 2021, making it the state’s 13th most valuable crop. Alfalfa has been one of the valuable inputs to California’s dairy industry, which is California’s leading agricultural commodity in cash receipts valued at $7.6 billion in 2021 (CDFA 2022). Alfalfa seasonal applied water ranges from 490,000 to 677,000 ha-m per year (Hanson et al. 2007) due to its relatively long growing season in California. Alfalfa in general has a relatively high water use efficiency (WUE) and deep root system. Irrigating alfalfa in California is important for maintaining a high marketable yield and quality. Practical irrigation and water conservation strategies are needed to increase the WUE of alfalfa, especially during dry years (Alam et al. 2002; Hanson et al. 2007). Underirrigated alfalfa can often cause a significant yield loss (Shewmaker et al. 2011; Anower et al. 2015), while overirrigation causes loss of alfalfa stands (Bai and Li 2003; Putnam et al. 2017a), and it can lead to root waterlogging that decreases growth and yield (Barta and Sulc 2002).
The impact of the recent drought in California and declining groundwater levels could be partially mitigated by implementing water conservation practices such as deficit irrigation on alfalfa. Deficit irrigation is a water application practice that applies less water than full-crop evapotranspiration (Fereres and Soriano 2007). Intentional reduction in crop water use through deficit irrigation practices is an efficient practice for conserving water resources if it is economically managed (Perez-Blanco et al. 2020). Alfalfa is a drought-tolerant crop and a good candidate for the implementation of deficit irrigation practices. Midsummer deficit irrigation could be an option to conserve water during drought years or to transfer water to other water shortage regions (Hanson et al. 2007; Lindenmayer et al. 2011; Ottman and Putnam 2017).
Deficit irrigation affects alfalfa yield and possibly alfalfa feed quality, and it is important to have a balance between them. Deficit irrigation may improve alfalfa hay quality and save a significant amount of water that could offset the reductions in yield (Lindenmayer et al. 2011; Ismail and Almarshadi 2013). The primary factors that typically affect feed quality are plant maturity at harvest, weed management, temperature, and harvesting methodology. Secondary factors include variety, soil type, fertility, irrigation management, and insect and disease damage. In addition, biotechnological traits may have impacts on quality as well. Harvest scheduling is the single most important practice impacting alfalfa hay quality. Quality should never be considered in isolation from yield goals due to the tradeoff between yield and quality that is observed in forage crops (Putnam and Orloff 2016).
Alfalfa yield and crop evapotranspiration relationships vary by growing region due to different climates (Hanson et al. 2007). Different relationships between yield and applied irrigation amount were previously documented by various researchers. A linear relationship was found between alfalfa yield and the amount of applied irrigation in several studies (Shewmaker et al. 2011; Klocke et al. 2013; Rogers et al. 2016; Li and Su 2017). Djaman et al. (2020) found a curvilinear relationship between yield and applied irrigation amount, while a third-order polynomial relationship was reported by Yang et al. (2019). Slama et al. (2011) highlighted the importance of utilizing deficit irrigation in alfalfa for water conservation. Over a two-year experiment conducted in the San Joaquin Valley, California, alfalfa yield decreased by 65% to 71% in the early-summer deficit treatment where there was no irrigation after June until the following spring, compared with the fully irrigated treatment (Frate et al. 1991). Alfalfa yield was reduced to 46% under midsummer deficit irrigation as compared to those of fully irrigated treatments in the Palo Verde Valley of southern California (Putnam et al. 2000).
Alfalfa is planted on approximately 235,000 ha in California, and the eight SJV counties had more than 99,000 ha of alfalfa valued at $445 million in 2021 (CDFA 2022). The total water use on alfalfa in the SJV in 2021 was (DWR 2023). The SJV’s 1.82 million ha of cropland needed about of applied water (AW) in 2018. Tree and vine crops took 69% of the AW, 11% of the AW went to alfalfa and pastures, 7% to corn and other silage crops, 8% to other field and grain crops, and 5% went to vegetables and nontree fruits (Escriva-Bou et al. 2023).
Few studies have been done on midsummer deficit irrigation in the San Joaquin Valley. The objective of this study was to evaluate and document the impact of the midsummer deficit irrigation on alfalfa yield and productivity. Profitable and sustainable alfalfa forage production systems with high IWP are needed for conserving water resources in the San Joaquin Valley of California and in many water-short semiarid and arid regions of the western US. Results of this study will provide growers in the region with tools to employ midsummer deficit irrigation practices to address challenges related to drought and limited water supplies in California and other similar production regions.
Material and Method
Study Area and Experiment Design
The study was conducted at a research field located at the University of California, Kearney Agricultural Research and Extension Center (KARE), Parlier, California (36°36′13.1′′N, 119°30′39.1′′W), between 2019 and 2022 [Fig. 1(a)]. The soil at the location is Hanford sandy loam (coarse-loamy, mixed, superactive, nonacid, thermic Typic Xerorthents), a well-drained soil, (Web Soil Survey, Web Soil Survey, n.d.) (Table 1). The alfalfa cultivar AmeriStand 835NTS RR (Fall Dormancy 8) was planted in October 2018 at a rate of . Preplant monoammonium phosphate fertilizer (11-52-0) was applied at a rate of . A potassium sulfate fertilizer was also applied at a rate of . These dosages are consistent with the common alfalfa fertilization used in the region (CDFA 2024). Sprinkler irrigation was used for germination, and then surface irrigation was used during the entire experiment. The 1.53 ha field was divided into 12 border strips with a 1.5 m border at 250 mm height between strips, each strip was 16.5 m wide and 85 m long except strips 11 and 12 that were only 8.25 m wide (just to keep the same number of replicates for each irrigation treatment) [Fig. 1(b)].

| Soil layer (m) | Soil texture | Organic matter (%) | pH | Available water () | Bulk density () | ||
|---|---|---|---|---|---|---|---|
| Clay (%) | Sand (%) | Silt (%) | |||||
| 0–0.3 | 12.5 | 68 | 19.5 | 0.75 | 7.6 | 0.13 | 1.47 |
| 0.3–1.5 | 12.5 | 68 | 19.5 | 0.33 | 7.7 | 0.13 | 1.45 |
The experiment was randomized block design with three replications where two irrigation treatments were implemented: full irrigation treatment (two surface irrigation events per cutting over the growing season), and deficit irrigation (two surface irrigation events per cutting until the 5th cut, early August, in the season; then, no IW was applied after the early August cutting). This is one of the two common practices implemented on alfalfa by California growers to achieve water savings. The other practice is complete land fallowing for a year or more. Both of these practices are used to generate conserved water for transfer to urban areas or to other crops that cannot survive with deficit irrigation. Since surface irrigation is the common method of irrigation on alfalfa, it is not practical to deficit irrigate during the growing season. Deficit irrigation during the season could be implemented if pressurized irrigation systems are used. Irrigation scheduling was conducted using the standard commercial growing practices for alfalfa production on relatively light soils. Two irrigations per cutting were scheduled based on ETa estimates from Tule Technologies, soil moisture conditions in the field, and the required cutting intervals to mimic standard practices in the region. Water was delivered to the border strips from gated aluminum pipes, and the water volume was determined using McCrometer propeller flow meters in a 6-inch pipe (McCrometer 2023). Flowmeters were last calibrated in January 2021 and had an accuracy level of 1.5%. Water applied to each check was metered during the growing season.
Climate Data
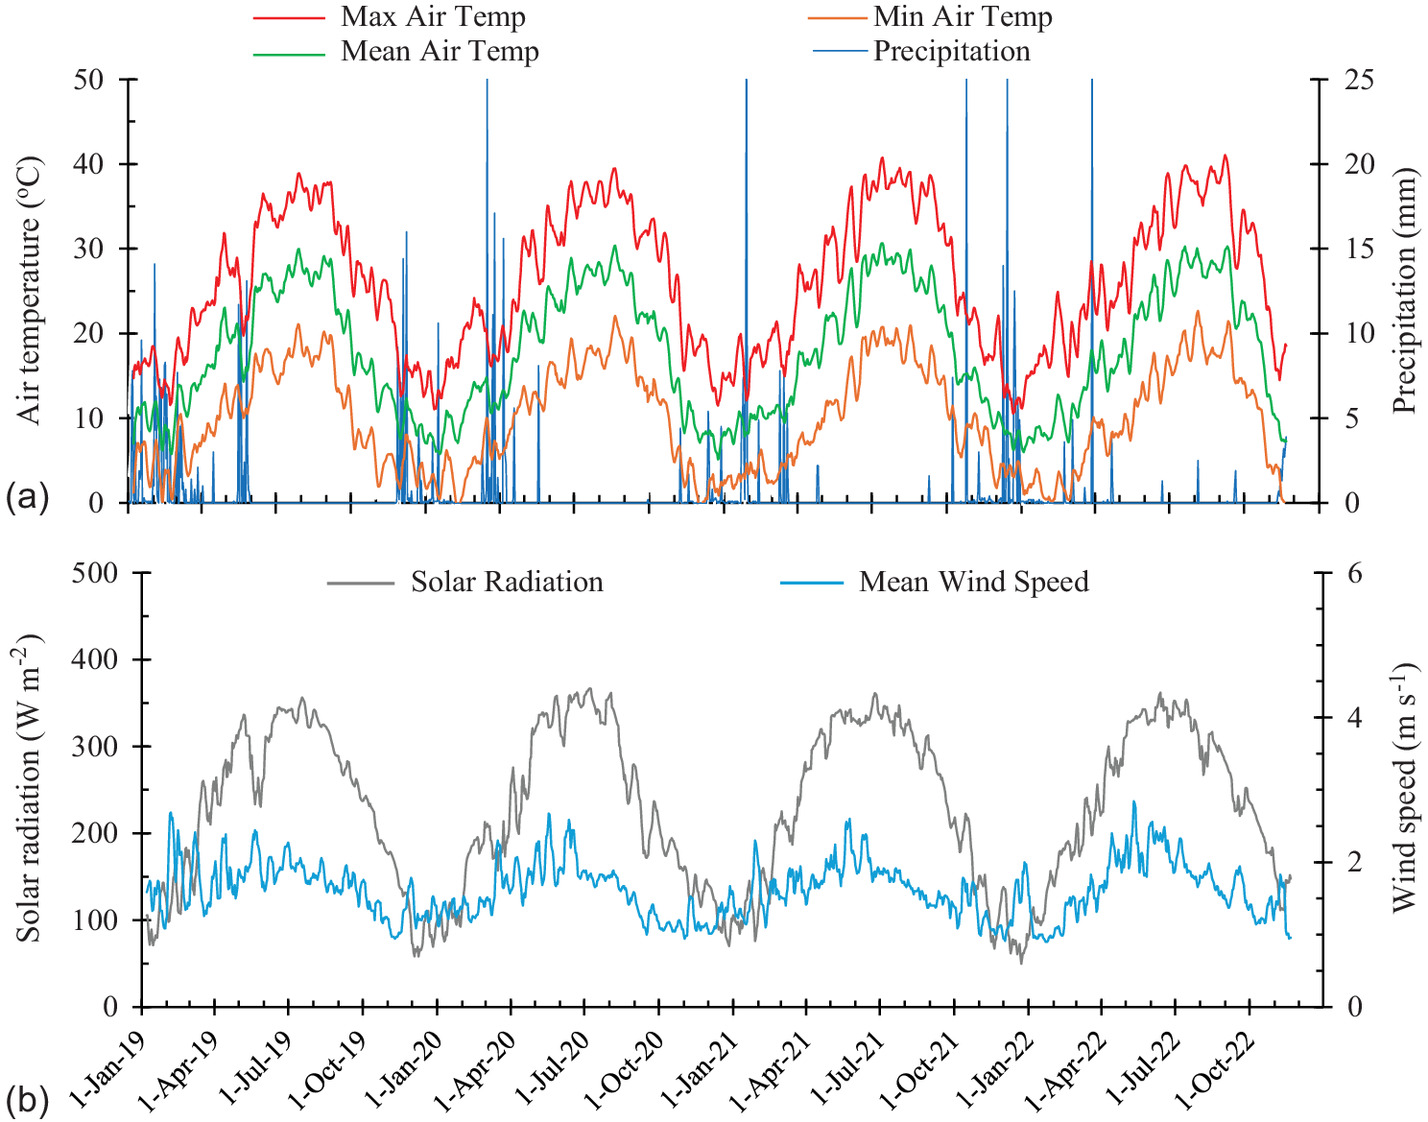
Daily meteorological data were collected from the California Irrigation Management Information System (CIMIS, weather station No. 39, Parlier/Fresno County) located at the research center (State of California, n.d.). These data for solar radiation, air temperature, average relative humidity, wind speed, and soil temperature were used to calculate the reference evapotranspiration via the Penman–Monteith equation. The actual evapotranspiration was recorded by the surface renewal method (Tule Sensors 2024), and the crop coefficient (Kc) was calculated and subsequently compared with the values in Table 12 of FAO 56. equals 0.40, 1.20, and 1.15 for alfalfa representing immediately following cutting, at full cover, and immediately before cutting, respectively, where the growing season is described as a series of individual cutting cycles. The area has a Mediterranean climate with an average annual precipitation of about . The total annual precipitation, all in the form of rainfall, was 268, 149, 231, and 131 mm in 2019, 2020, 2021, and 2022, respectively. Similar trends of daily air temperature, solar radiation, and average daily wind speed were observed over the four years of study (Fig. 2). The daily average temperature ranged from 3.3 to 33°C over the study period. Wind speed was lower than . A monthly average metrological data for the study period is shown in Table 2.
| Year | Month | Total, (mm) | Precipitation (mm) | Average air temperature (°C) | Average wind speed () | Average dew point (°C) | Average solar radiation () |
|---|---|---|---|---|---|---|---|
| 2019 | January | 37.6 | 37.7 | 9.8 | 1.4 | 7.7 | 105 |
| February | 48.7 | 79.7 | 8.8 | 2.0 | 5.7 | 143 | |
| March | 97.2 | 26.1 | 12.9 | 1.7 | 7.9 | 216 | |
| April | 147.6 | 4.0 | 18.3 | 1.8 | 10.2 | 276 | |
| May | 154.9 | 54.2 | 18.2 | 2.0 | 10.6 | 283 | |
| June | 211.8 | 0.0 | 25.6 | 2.0 | 13.2 | 332 | |
| July | 220.8 | 0.0 | 27.2 | 1.9 | 13.9 | 338 | |
| August | 202.4 | 0.0 | 27.2 | 1.7 | 15.3 | 313 | |
| September | 149.5 | 0.0 | 22.8 | 1.7 | 12 | 260 | |
| October | 102.7 | 0.0 | 15.5 | 1.3 | 6.4 | 207 | |
| November | 60.1 | 13.4 | 11.5 | 1.3 | 5.2 | 135 | |
| December | 28.8 | 53.0 | 9.4 | 1.3 | 7.3 | 83 | |
| 2020 | January | 36.7 | 16.3 | 8.2 | 1.3 | 5.7 | 100 |
| February | 73.5 | 0.2 | 10.8 | 1.4 | 4.0 | 187 | |
| March | 87.6 | 69.0 | 12.5 | 1.7 | 7.0 | 194 | |
| April | 130.5 | 29.8 | 16.9 | 1.9 | 10.1 | 261 | |
| May | 197.8 | 8.3 | 21.5 | 2.1 | 9.9 | 335 | |
| June | 212.1 | 0.0 | 24.9 | 2.1 | 11.9 | 345 | |
| July | 222.2 | 0.0 | 27.1 | 1.8 | 13.4 | 348 | |
| August | 189.5 | 0.0 | 27.6 | 1.6 | 15.8 | 287 | |
| September | 121.6 | 0.2 | 23.2 | 1.2 | 14.5 | 211 | |
| October | 93.8 | 0.0 | 18.5 | 1.1 | 10.8 | 177 | |
| November | 53.7 | 6.9 | 10.3 | 1.2 | 5.4 | 135 | |
| December | 34.0 | 18.1 | 7.5 | 1.3 | 1.0 | 100 | |
| 2021 | January | 46.2 | 62.0 | 8.8 | 1.5 | 4.4 | 107 |
| February | 63.9 | 5.2 | 10.6 | 1.5 | 5.2 | 174 | |
| March | 103.3 | 22.7 | 12 | 1.7 | 4.9 | 230 | |
| April | 157.4 | 4.4 | 17.3 | 1.8 | 6.7 | 301 | |
| May | 205.8 | 0.0 | 21.5 | 2.1 | 7.6 | 335 | |
| June | 216.2 | 0.0 | 26.3 | 2.0 | 12.1 | 337 | |
| July | 224.1 | 0.0 | 29.1 | 1.8 | 14.1 | 331 | |
| August | 197.4 | 0.0 | 27.2 | 1.6 | 14.1 | 303 | |
| September | 146.6 | 1.6 | 23.9 | 1.5 | 12.7 | 248 | |
| October | 88.8 | 35.4 | 15.9 | 1.4 | 8.5 | 178 | |
| November | 40.1 | 6.9 | 11.8 | 1.1 | 9.9 | 112 | |
| December | 22.1 | 92.9 | 8.1 | 1.5 | 6.9 | 73 | |
| 2022 | January | 40.8 | 2.2 | 7.8 | 1.0 | 6.2 | 120 |
| February | 67.5 | 3.8 | 9.6 | 1.3 | 2.2 | 182 | |
| March | 103.4 | 34.9 | 13.7 | 1.6 | 6.3 | 215 | |
| April | 146.8 | 5.4 | 16.3 | 2.0 | 6.3 | 286 | |
| May | 201.3 | 0.0 | 20.1 | 2.3 | 7.1 | 334 | |
| June | 217.9 | 1.3 | 25.4 | 2.2 | 10.3 | 342 | |
| July | 222.8 | 0.0 | 27.7 | 1.9 | 13.0 | 327 | |
| August | 197.8 | 2.5 | 27.8 | 1.7 | 13.9 | 295 | |
| September | 147.7 | 3.1 | 25.1 | 1.6 | 13.7 | 242 | |
| October | 102.7 | 0.0 | 18.3 | 1.3 | 10.3 | 194 | |
| November | 49.8 | 4.1 | 8.2 | 1.3 | 4.0 | 133 | |
| December | 19.8 | 74.2 | 7.2 | 1.5 | 5.7 | 67 |
Source: Data from the State of California (n.d.).
Soil Matric Potential Measurements
Watermark soil moisture sensors (Irrometer, Riverside, California Irrometer, n.d.) were used to monitor soil water status by measuring soil matric potential (in kPa) throughout the soil profile at different depths (locations are shown in Fig. 1). The moisture sensors were installed in all strips for each of the two irrigation treatments (Full/Deficit) at four depths: 30, 60, 90, and 120 cm to cover the active root zone (depth of maximum root intensity) and account for soil water distribution. Soil moisture data were recorded hourly using a Watermark 900M monitor with 8 sensor capacity. Data were downloaded using a 900DS data shuttle or laptop and then converted to the daily averaged matric potential.
Forage Yield, Irrigation Water Productivity, and Crop Water Productivity
The impact of deficit irrigation on alfalfa field quality was considered in this study. Three alfalfa samples were collected from each plot during cuttings for the entire duration of the study. In the Central Valley of California, alfalfa is typically cut 7 or 8 times per season. Alfalfa was harvested every 28–30 days with a total of seven cuts in the first year (2019) and eight cuts for each of 2020, 2021, and 2022. A plot harvesting machine (Carter, Brookstone, Indiana) was used to cut the alfalfa perpendicular to the strips’ length in three locations per strip, with 0.9 m wide by 5.4 m long samples collected for yield assessment. Yield per unit area was calculated based on total fresh weight multiplied by dry matter concentration.
Two Tule Technologies systems (Tule Technologies Inc., Davis, California) (which is a proprietary commercialized version of surface renewal methods, currently only available in California) were used to determine the alfalfa actual evapotranspiration () (Tule Sensors 2024). The Tule system is a commercial version of the surface renewal method based on the Ph.D. thesis of Dr. Tom Shapland who conducted his work at UC Davis and resulted in a patented approach to estimate based on the surface renewal method without the need to calibrate with Eddy covariance. Daniele Zaccaria of UC Davis compared this method to the standard Eddy covariance measurement on alfalfa and the Tule Technologies system results were within 95% confidence level. As far as the fetch, since the Tule system is relatively short (about 0.6–0.75 m above the ground), Tule Technologies has a quality assurance protocol that determined that the plot dimensions in this study were within the confidence level that they have.
The Tule Technology estimates based on the principles of the surface renewal (SR) method (Shapland et al. 2014). The SR is a biometeorological method that uses high-frequency air temperature measurements above the plant canopy to estimate sensible heat flux. The sensible heat flux is then used, along with net radiation and soil heat fluxes, to estimate latent heat flux as the residual in the surface energy balance equation. The Tule Technologies patented system eliminates the need for calibration of SR against other methods such as Eddy covariance to obtain estimates of sensible heat flux, and this need for calibration limited the use of SR to research applications (Shapland et al. 2014). Therefore, irrigation decisions during this study were based on the crop water requirements as estimated by Tule Technologies stations. Additional information about this relatively new commercial application of the SR method for measuring actual evapotranspiration can be found on the Tule Technologies website (Tule Sensors 2024).
Irrigation water productivity (IWP in ) was calculated for each treatment as the ratio of alfalfa hay yield () to applied irrigation water (mm) (Howell et al. 1990) [Eq. (1)]. IWP is used in this study as a generalized measure of alfalfa biomass produced per unit amount of water applied. The parameter encompasses the irrigation and scheduling method and soil conditions, among many factors that could affect plant growth. However, the imposed differences in irrigation amounts were the only known controlled variables that could be directly related to IWP. Crop water productivity (CWP) for each harvest period was calculated as the ratio of yield () to the (mm) [Eq. (2)]where yield is in , and irrigation AW and actual evapotranspiration, , is in mm.
(1)
(2)
Statistical Analysis
Statistical analyses were performed using IBM SPSS statistical software (IBM, n.d.) to analyze and compare the difference in alfalfa yield between the full irrigation and deficit irrigation treatments. The statistical analysis was performed as follows: (1) a single sample T-test was executed for yield among cuts for each treatment, and each year separately (two-tailed hypothesis, ) to explore the difference in yield among cuts, (2) one-way ANOVA test was performed for the two independent treatments (full, and deficit) for each year to compare the means of yield between the full and deficit irrigation treatments for each year of the experiment, and (3) run ANOVA test between years (as repeated measures) for the full and deficit treatments to identify if the yield (for full and deficit treatments) was significantly reduced throughout years. Additionally, a regression analysis was performed to develop relationships between yield (for each year) and AW (for full and deficit treatments) and between the cumulative yield of each cutting and cumulative evapotranspiration, where the coefficient of determination, , was utilized to judge the goodness of fit of these relationships.
Results and Discussions
Actual Evapotranspiration
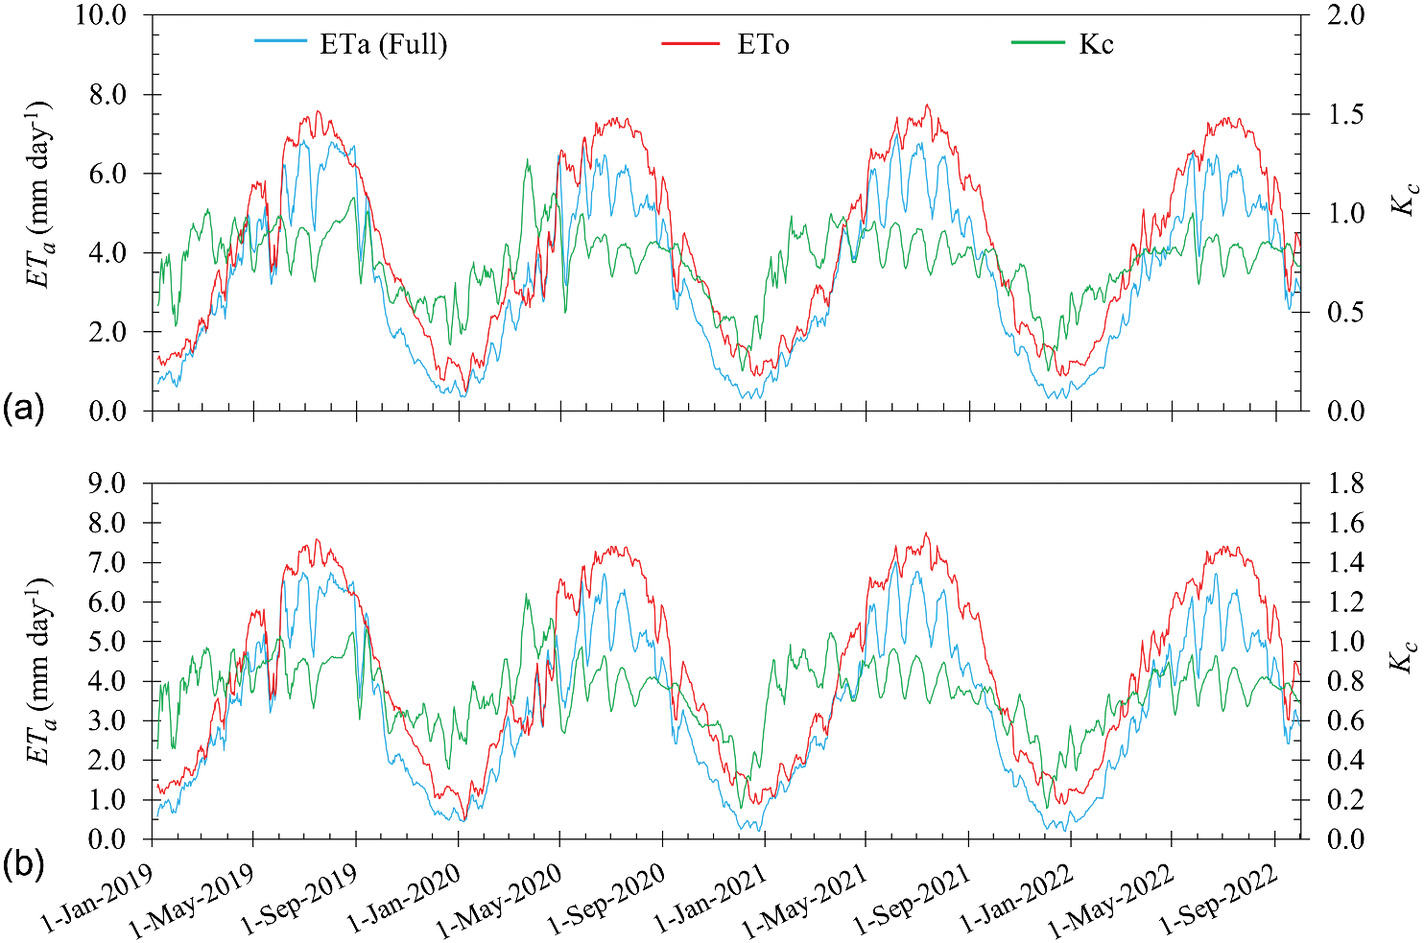
The actual evapotranspiration () of each cutting is presented in (Table 3). The and exhibited a similar trend for both fully and deficit-irrigated treatments (Fig. 3). increased to its maximum values () by the end of June followed by a decrease toward the end of the season. values were obtained by dividing the by . The average observed values for the full irrigation treatment, excluding values before the first cut and after the last harvest, were 0.77, 0.73, 0.75, and 0.76 for 2019, 2020, 2021, and 2022, respectively. The values for the midsummer deficit irrigation treatment were 0.77, 0.72, 0.74, and 0.72, for 2019, 2020, 2021, and 2022, respectively, which was smaller than the reported value of 0.99 by Hanson et al. (2007) for the Sacramento Valley. A small difference was found in values between the full and deficit irrigation treatments. This may be explained by the deep root system of alfalfa and the availability of water in the soil profile (Bai and Li 2003).
| No. | Cycle | AW (mm) | Rainfall (mm) | (mm) | Water savings (mm) | Water savings (%) | |||
|---|---|---|---|---|---|---|---|---|---|
| Start | End | Full | Deficit | Full | Deficit | ||||
| 2019 | |||||||||
| 1st | 1st January | 6th May | 0 | 0 | 147 | 298 | 291 | 454 | 30.3 |
| 2nd | 6th May | 3rd June | 175 | 232 | 54 | 125 | 127 | ||
| 3rd | 3rd June | 2nd July | 278 | 279 | 0 | 173 | 174 | ||
| 4th | 2nd July | 1st August | 275 | 267 | 0 | 180 | 180 | ||
| 5th | 1st August | 29th August | 268 | 264 | 0 | 185 | 180 | ||
| 6th | 29th August | 2nd October | 247 | 0 | 0 | 136 | 144 | ||
| 7th | 2nd October | 14th November | 253 | 0 | 0 | 75 | 79 | ||
| Summation | 1,496 | 1,042 | 201 | 1,172 | 1,175 | ||||
| 2020 | |||||||||
| 1st | 1st January | 24th April | 0 | 0 | 114 | 259 | 267 | 706 | 40.9 |
| 2nd | 24th April | 26th May | 113 | 147 | 8 | 163 | 145 | ||
| 3rd | 26th May | 24th June | 333 | 284 | 0 | 172 | 168 | ||
| 4th | 24th June | 22nd July | 312 | 297 | 0 | 160 | 158 | ||
| 5th | 22nd July | 18th August | 288 | 291 | 0 | 140 | 136 | ||
| 6th | 18th August | 14th September | 248 | 0 | 0 | 110 | 104 | ||
| 7th | 14th September | 13th October | 231 | 0 | 0 | 80 | 76 | ||
| 8th | 13th October | 16th November | 200 | 0 | 5 | 44 | 49 | ||
| Summation | 1,725 | 1,019 | 127 | 1,128 | 1,103 | ||||
| 2021 | |||||||||
| 1st | 1st January | 7th April | 0 | 0 | 88 | 213 | 210 | 625 | 37.0 |
| 2nd | 7th April | 5th May | 238 | 317 | 5 | 129 | 122 | ||
| 3rd | 5th May | 8th June | 224 | 273 | 0 | 199 | 198 | ||
| 4th | 8th June | 7th July | 238 | 237 | 0 | 178 | 176 | ||
| 5th | 7th July | 4th August | 248 | 237 | 0 | 163 | 160 | ||
| 6th | 4th August | 1st September | 246 | 0 | 0 | 136 | 128 | ||
| 7th | 1st September | 29th September | 275 | 0 | 2 | 107 | 101 | ||
| 8th | 29th September | 28th October | 220 | 0 | 43 | 59 | 53 | ||
| Summation | 1,689 | 1,064 | 138 | 1,184 | 1,148 | ||||
| 2022 | |||||||||
| 1st | 1st January | 7th April | 0 | 0 | 41 | 191 | 182 | 815 | 49.1 |
| 2nd | 7th April | 25th May | 293 | 297 | 5 | 231 | 226 | ||
| 3rd | 25th May | 22nd June | 301 | 295 | 1 | 156 | 150 | ||
| 4th | 22nd June | 20th July | 269 | 253 | 0 | 155 | 155 | ||
| 5th | 20th July | 17th August | 239 | 0 | 3 | 136 | 129 | ||
| 6th | 17th August | 15th September | 244 | 0 | 0 | 116 | 103 | ||
| 7th | 15th September | 12th October | 220 | 0 | 3 | 76 | 64 | ||
| 8th | 12th October | 10th November | 94 | 0 | 0 | 39 | 35 | ||
| Summation | 1,660 | 845 | 53 | 1,100 | 1,044 | ||||
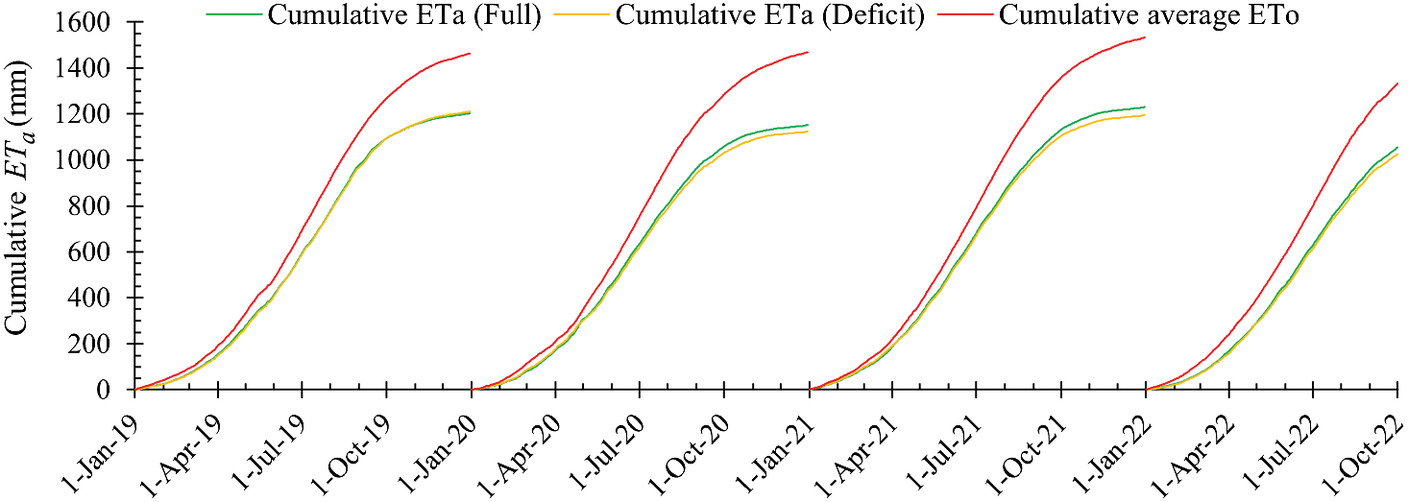
The cumulative for the fully irrigated treatment was 1,172, 1,128, 1,184, and 1,100 mm; and the cumulative for the deficit-irrigated treatment was 1,175, 1,103, 1,148, and 1,044 mm in 2019, 2020, 2021, and 2022, respectively (Fig. 4). This small difference in between fully and deficit-irrigated treatments demonstrates that cannot be a reliable approach to calculate the amount of water saved to transfer to the low water availability areas as it is a site-specific response. The cumulative for the fully irrigated treatments was lower than the AW, meaning that the fully irrigated plots were overirrigated throughout the study period where surface irrigation of deep-rooted crops can be very efficient in the SJV. Seasonal AW exceeded by 324, 597, 505, and 560 mm for 2019, 2020, 2021, and 2022, respectively, for the fully irrigated treatment. Seasonal AW for the midsummer deficit treatment was lower than the crop water requirements where the difference between and the AW during deficit were 133, 84, 84, and 199 mm. Cumulative of alfalfa is almost the same for full and deficit treatments as alfalfa roots developed over time and a substantial percentage of total can come from deeper soil where moisture is relatively high or from groundwater contribution (3 m-depth) Lindenmayer et al. (2011).
Soil Water Potential
Soil matric potential values (in kPa) for full and deficit irrigation treatments were averaged daily and shown in Figs. 5(a and b). The data clearly showed the irrigation events for the full/deficit treatments throughout the entire experiment, where soil matric potential was suddenly increased after water applications and gradually decreased until the sequent irrigation event. The minimum soil matric potential values were kept in the range between and (for both treatments) for alfalfa growing in sandy loam soil, as recommended by Orloff et al. (2005). Soil matric potential values were approximately before harvest and increased to approximately after applying irrigation.
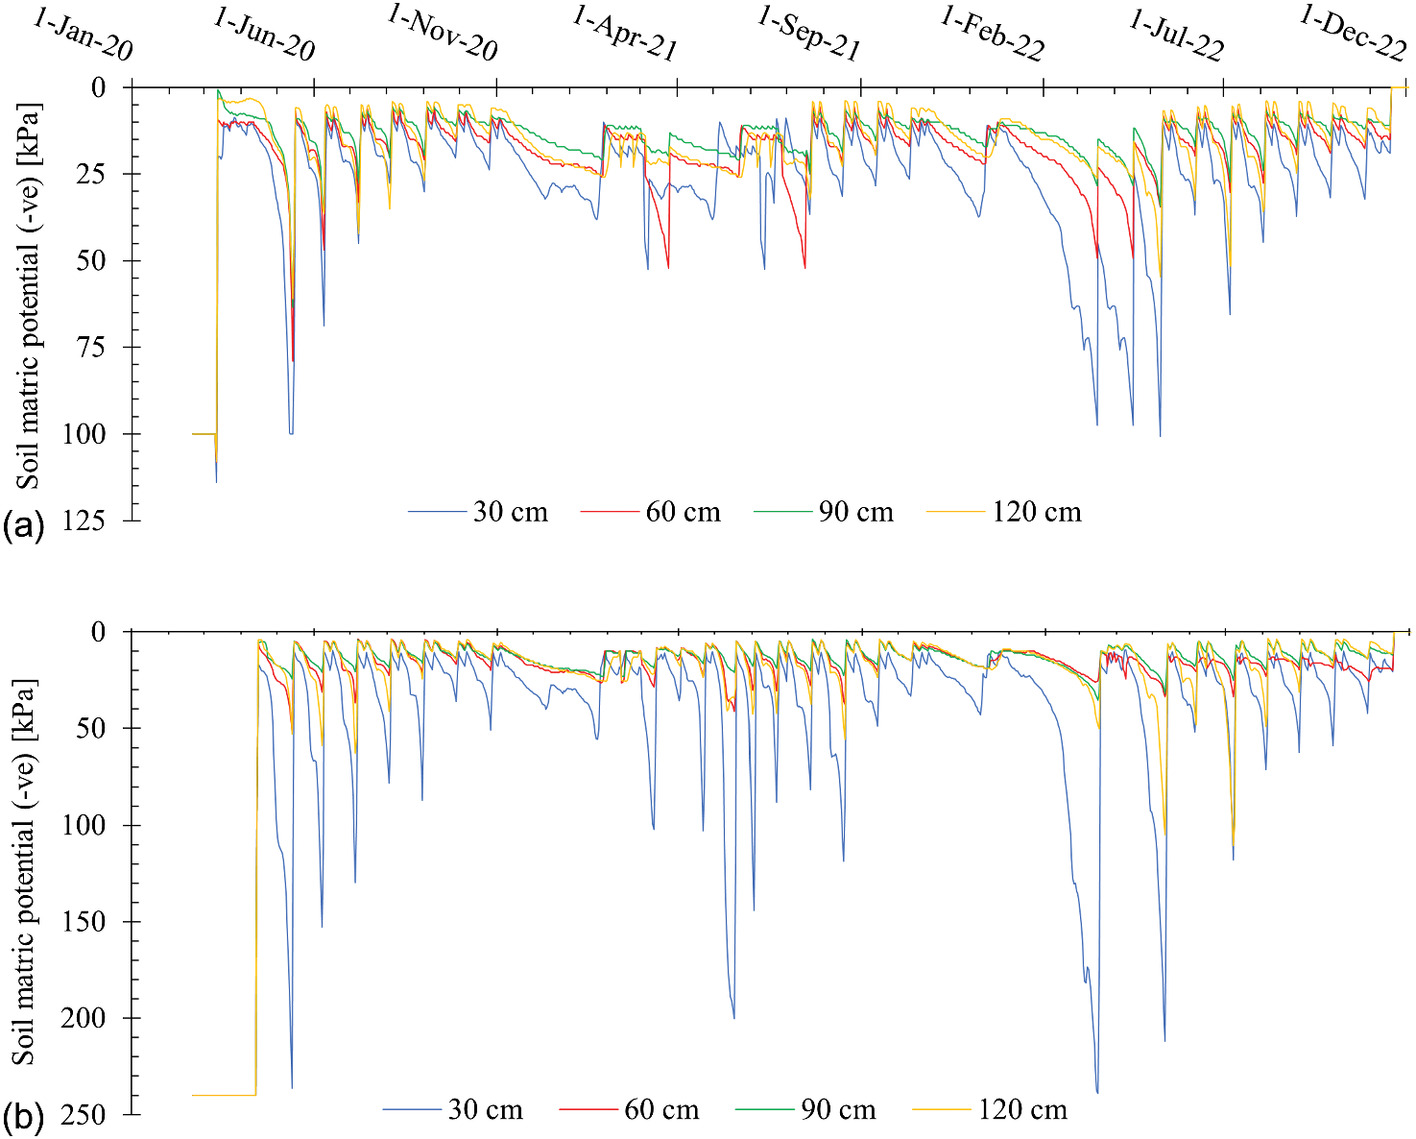
The soil matric potential readings remained relatively high between the consecutive irrigation events in each harvest period. Soil matric potential was high (high water content) in the deeper soil profile, while soil matric potential in the top 30 cm layer fluctuated between dry and wet, which was greatly affected by irrigation treatments. The shallow layer potential is relatively low (shown in the blue line) where the soil is dry for the deficit treatment [Fig. 5(b)] as compared to the full irrigation treatment [Fig. 5(a)]. This is consistent with the other findings from irrigated alfalfa studies (Mundy et al. 2006; Huang et al. 2018; Wang et al. 2021). Soil matric potential reached its highest value () gradually after imposing deficit irrigation in late August, indicating that little water was available through the soil profile to the alfalfa which is similar to the finding of Pembleton et al. (2011). The greatest observed changes in soil water potential were in the layers 0–30 cm and 30–60 cm as those layers dried faster than the deeper layers. However, there were some responses to soil matric potential in the other layers as well.
Applied Irrigation Water
For the year preceding this research experiment (2018), an equal amount of irrigation was applied across all the plots. Two irrigation events were applied between each cutting during the following four years of the study (2019 to 2022). The deficit irrigation treatments were implemented on 14th August, 31st August, 17th August, and 1st August of years 2019, 2020, 2021, and 2022, respectively. The total amount of applied IW for the fully irrigated treatment was 1,496, 1,725, 1,689, and 1,660 mm in 2019, 2020, 2021, and 2022, respectively, while it was 1,042, 1,019, 1,064, and 845 mm during 2019, 2020, 2021, and 2022, respectively, for the deficit-irrigated treatment (Fig. 6).
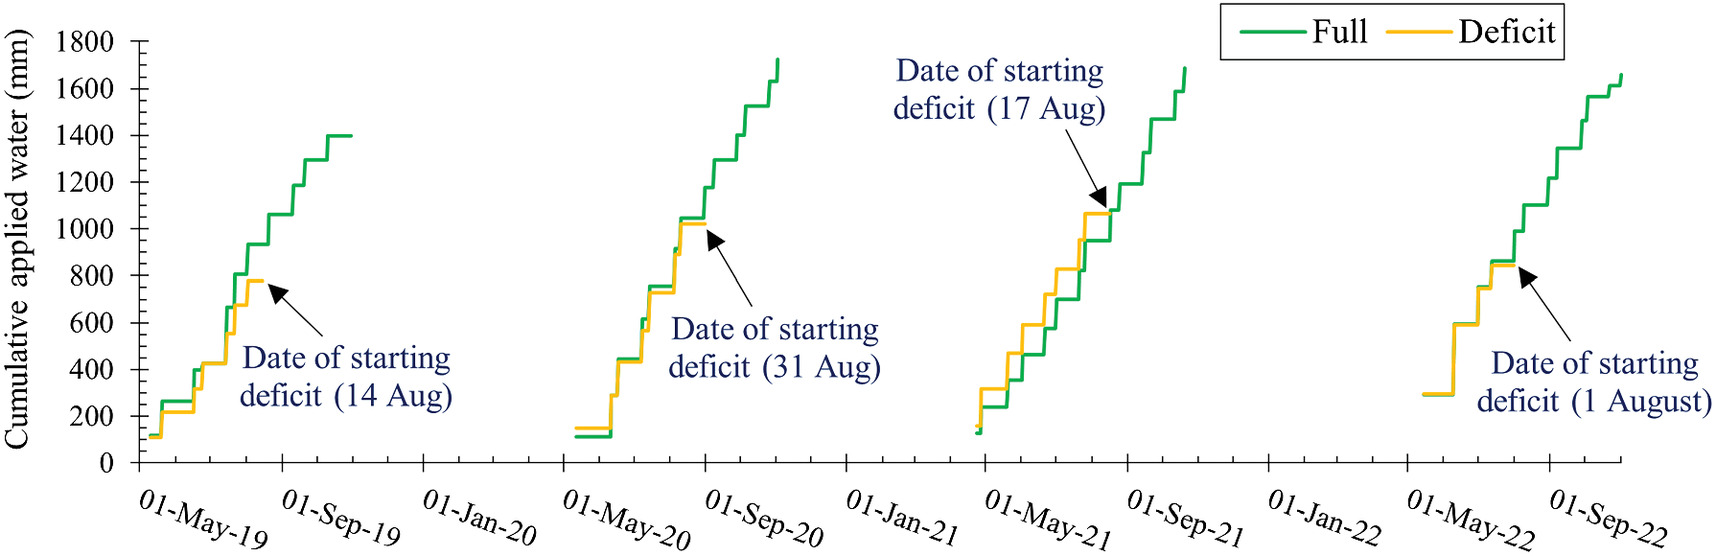
IW savings due to deficit treatments were 30.3%, 40.9%, 37.0%, and 49.1%; while the reductions in the AW between full and deficit treatments were 454, 706, 625, and 815 mm in 2019, 2020, and 2021, respectively (Table 3), which is of a great benefit during drought years. This highlights the importance of midsummer deficit irrigation in water conservation that can be made available to transfer to areas of water shortage, a water conservation practice that was recommended by Orloff et al. (2014). The amount of rainfall during the seasons of 2019, 2020, 2021, and 2022 for alfalfa in the SJV were 201, 127, 138, and 53 mm, respectively. Leaching was not considered during these study periods and the average salinity of IW was which was well below the soil salinity threshold (ECe) of alfalfa (Leinfelder-Miles 2013). The salinity of the soil profile was below during the entire experiment. The groundwater that is used as the source for irrigation in the region is recharged by the Kings River water which is only 3 Km to the east of the experimental site and fed by runoff from snowmelt from the Sierra Nevada mountains with relatively low salinity. The overall irrigation efficiency during this study period is comparable to the application efficiency of alfalfa grown in the region (Hanson and Putnam 2004). The overall efficiency in 2019 was 78% (/AW or ), 65% in 2020, 70% in 2021, and 66% in 2022 (Table 3). These efficiency numbers are comparable to application efficiencies in commercial fields with relatively light soil (Hanford sandy loam).
Hay Quality and Dry Matter Yield
There were no significant differences in most hay quality parameters within any of the years between 2019 and 2022. The deficit irrigation treatments resulted in a small but not significant decline or improvement in hay quality parameters and had no impact on hay quality classification. The overall impact of deficit irrigation on most individual hay quality parameters was negligible and, in some cases, improved one or more of the quality parameters [for example Neutral detergent fibers (NDF) in 2019, 2020, and 2021].
The quality of the hay for all irrigation treatments for all years was good and classified as premium, premium-good, or supreme with excellent retail price (Table 4). The premium hay classification is given to alfalfa that is cut prebud, bud, or early bloom with low fiber, soft stems, high energy and intake potential, and good leaf attachments (Putnam and Orloff 2016). Premium alfalfa is also mostly free of grasses and weeds, no noxious weeds, no mold, and well cured.
| Year | Treatment | NDF | CP | ADF | Lignin | Hay quality classification |
|---|---|---|---|---|---|---|
| 2019 | Full | 348 | 245 | 289 | 55 | Premium |
| Deficit | 341 | 236 | 278 | 54 | Premium | |
| 2020 | Full | 332 | 256 | 281 | 54 | Premium |
| Deficit | 329 | 257 | 276 | 54 | Premium | |
| 2021 | Full | 380 | 261 | 297 | 73 | Premium-Good |
| Deficit | 377 | 259 | 294 | 72 | Premium-Good | |
| 2022 | Full | 311 | 260 | 262 | 57 | Supreme |
| Deficit | 311 | 251 | 258 | 58 | Supreme | |
Note: NDF (neutral detergent fibers), CP (crude Protein), and ADF (acid detergent fibers).
Yield responses to irrigation treatments of each harvest cycle for the four years of the study are presented in Table 5 and the contribution as a percentage of each cut’s yield to the total yield is presented in Figs. 7(a and b) for the full and deficit treatments, respectively. Previous studies found that the dry matter (DM) yield of alfalfa was affected by irrigation treatment (Qiu et al. 2021) and how much water was applied relative to (Putnam et al. 2017b). Analysis of these yield results showed that there was no significant difference between yields for full and deficit treatments for the first five cuttings, while the deficit treatment had significantly lower yields for later cuttings among all four years [Figs. 8(a–d)]. Also, a significant difference was obtained between the yearly cumulative yield for the two treatments (T-test, at a significance ) (Fig. 9).
| Cuts | 1st | 2nd | 3rd | 4th | 5th | 6th | 7th | 8th | Total STD () | Yield reduction () |
|---|---|---|---|---|---|---|---|---|---|---|
| 2019 | ||||||||||
| Harvest date | 6th May | 3rd June | 2nd July | 1st August | 29th August | 2nd October | 14th November | — | — | — |
| Full | 3.22 | 4.14 | 3.50 | 3.43 | 3.11 | 2.05 | 2.29 | — | 3.94 | |
| Deficit | 3.25 | 3.72 | 3.27 | 3.20 | 3.11 | 0.80 | 0.45 | — | ||
| 2020 | ||||||||||
| Harvest date | 24th April | 26th May | 24th June | 22nd August | 18th August | 14th September | 13th October | 16th November | — | — |
| Full | 3.62 | 2.77 | 3.34 | 3.22 | 1.96 | 1.23 | 1.31 | 1.01 | 2.04 | |
| Deficit | 3.58 | 2.42 | 3.18 | 3.35 | 1.88 | 0.79 | 0.94 | 0.28 | ||
| 2021 | ||||||||||
| Harvest date | 7th April | 5th May | 8th June | 7th July | 4th August | 1st September | 29th September | 28th October | — | — |
| Full | 3.24 | 2.41 | 3.03 | 3.11 | 2.11 | 1.50 | 1.55 | 0.68 | 1.25 | |
| Deficit | 3.17 | 2.35 | 3.35 | 3.34 | 2.18 | 1.13 | 0.64 | 0.24 | ||
| 2022 | ||||||||||
| Harvest date | 7th April | 25th May | 22nd June | 20th July | 17th August | 15th September | 12th October | 10th November | — | — |
| Full | 2.37 | 1.84 | 2.22 | 2.79 | 1.53 | 1.41 | 1.00 | 0.34 | 0.40 | |
| Deficit | 2.85 | 2.28 | 2.70 | 3.31 | 1.25 | 0.42 | 0.12 | 0.18 | ||
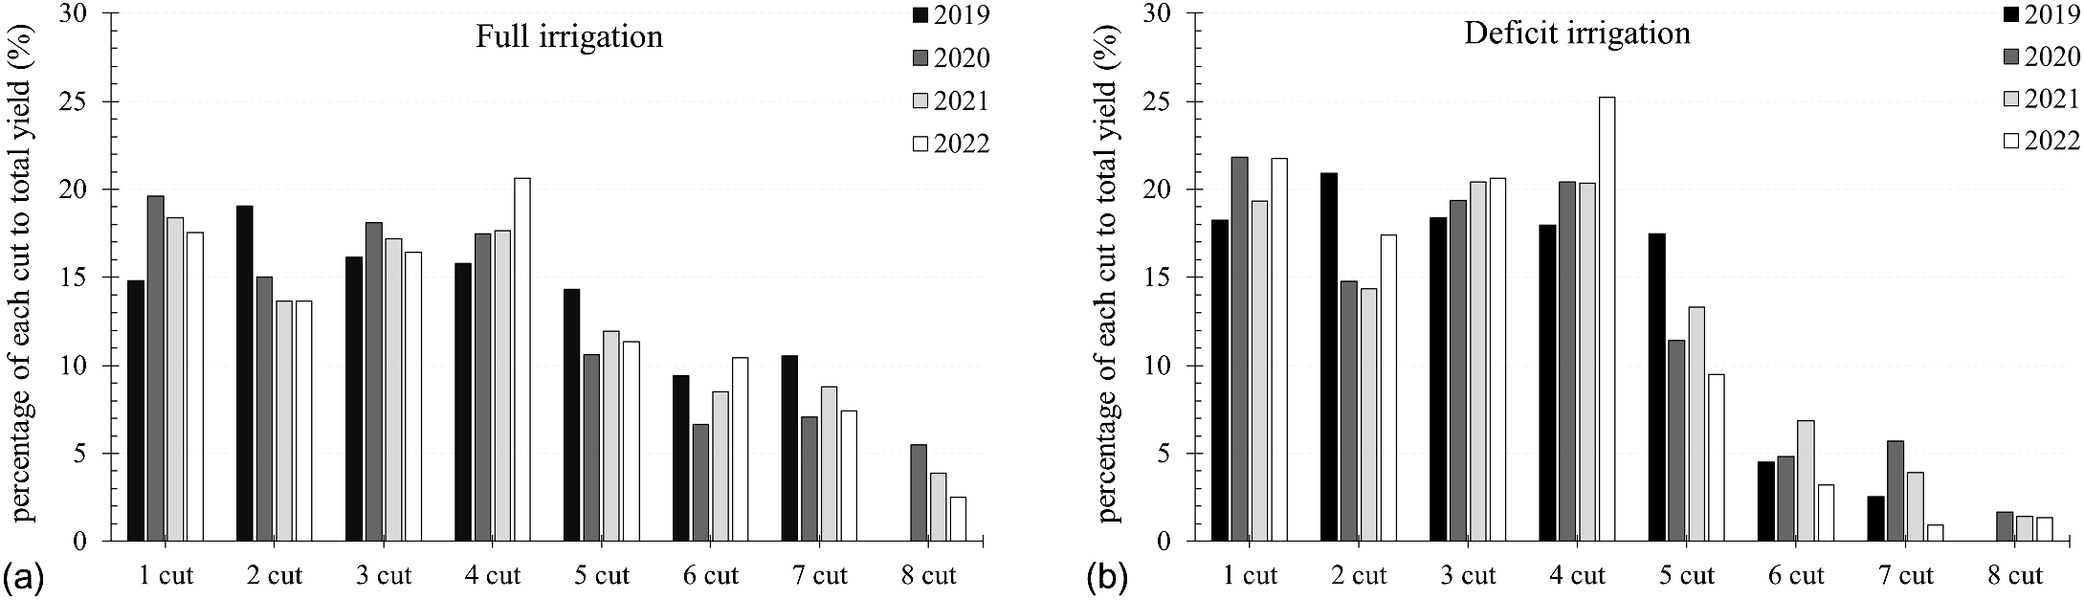
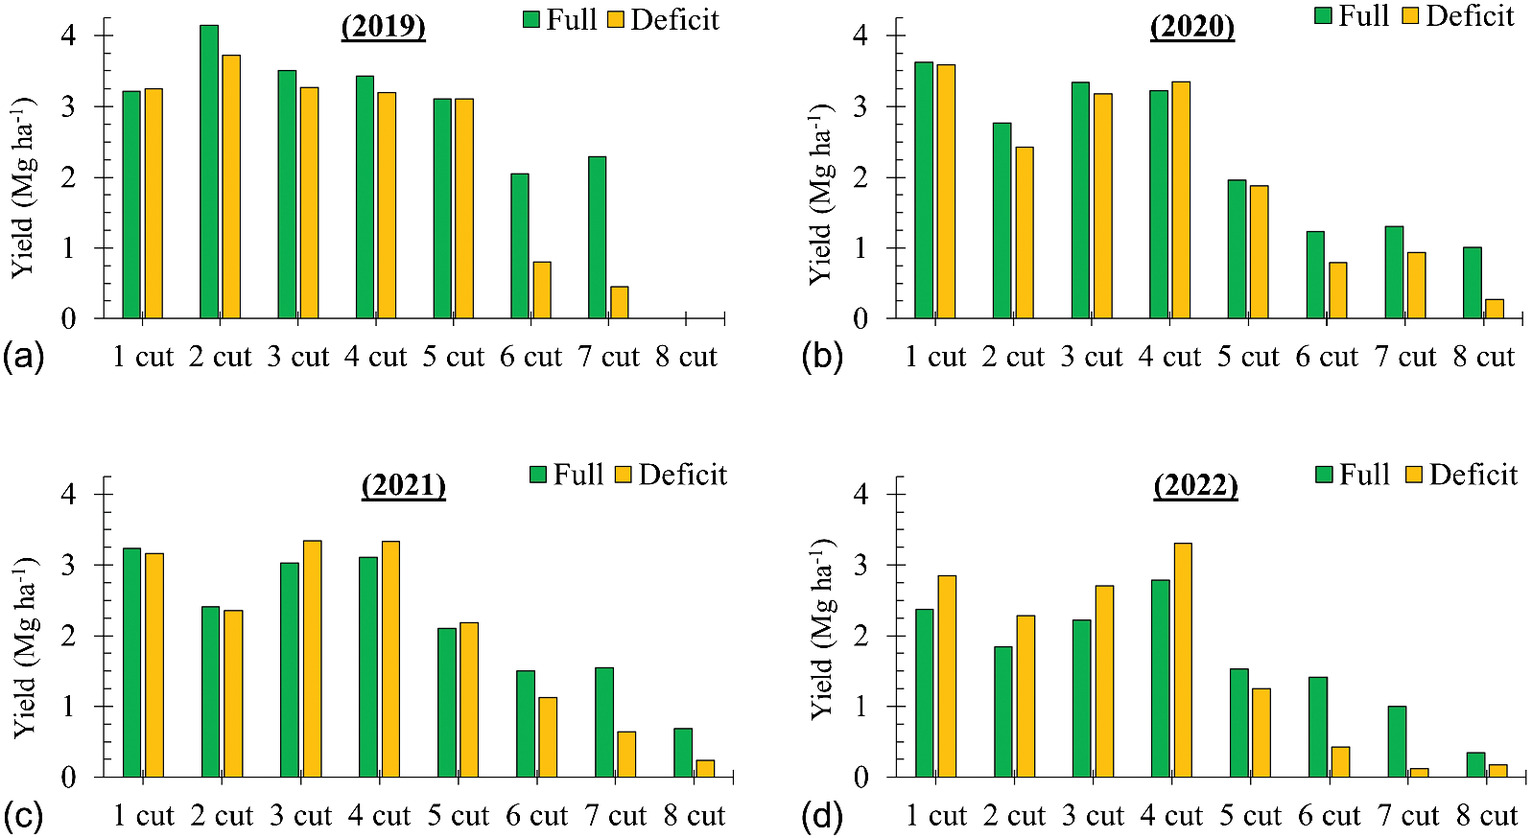
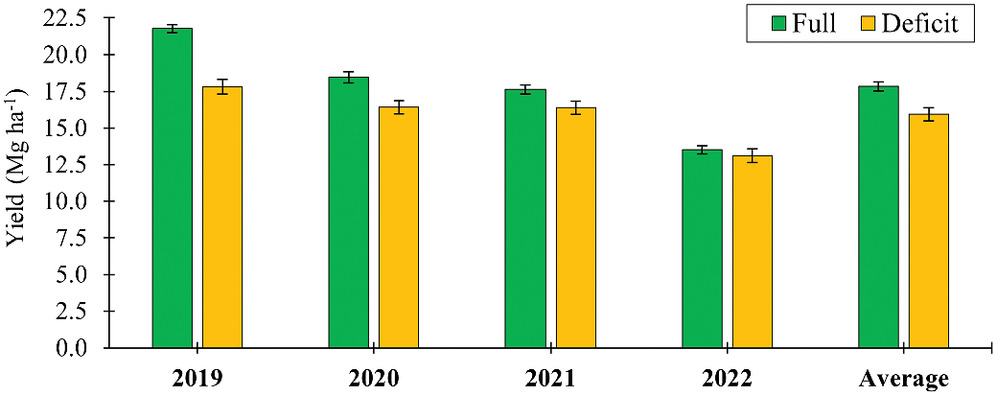
Table 6 summarizes the statistical results for the single T-test among cuttings of each treatment for each year. There was no significant difference in yield among cuts, either for fully irrigated treatments or deficit irrigation for the four years. Statistical analysis also revealed that there is no significant difference between the yield of the fully irrigated treatments and the yield of the deficit-irrigated treatments for any year (-values are summarized in Table 6). However, a significant difference in yield over the years (as four repeated measures) was obtained for the fully irrigated and deficit-irrigated treatments where , 0.0129, respectively.
| Year | Single T-test | ANOVA test (between full and deficit) | ANOVA test (between years) for full and deficit | ||||||
|---|---|---|---|---|---|---|---|---|---|
| Mean | Median | -value | -value | -ratio | -value | (Full irrigation) | (Deficit irrigation) | ||
| 2019 (7 cuts) | Full | 3.11 | 3.22 | 0.4939 | 0.9706 | 0.3439 | |||
| Deficit | 2.54 | 3.20 | 0.0057 | 0.4978 | |||||
| 2020 (8 cuts) | Full | 2.31 | 2.37 | 0.0201 | 0.4923 | 0.1894 | 0.6701 | * | * |
| Deficit | 2.05 | 2.15 | 0.0055 | 0.4979 | |||||
| 2021 (8 cuts) | Full | 2.20 | 2.26 | 0.0116 | 0.4956 | 0.0793 | 0.7824 | ||
| Deficit | 2.05 | 2.27 | 0.4564 | ||||||
| 2022 (8 cuts) | Full | 1.69 | 1.69 | 0.4966 | 0.0082 | 0.9292 | |||
| Deficit | 1.64 | 1.77 | 0.4989 | ||||||
Note: (*) means that the difference is significant at .
The average yearly alfalfa DM yields differed over the years. It was highest in the first year of production (2019), achieving 21.75 and for fully and deficit-irrigated treatments, respectively. These values of the DM yields coincide with the study of Mengistu et al. (2022) who reported that the mean value of DM for four alfalfa cultivars during two cuts in 2016 and three cuts in 2017 at Masha Highland was 6.3 and 5.9 ( 12.2 in-total), respectively. Feng et al. (2022) also found similar results where the average DM yield of alfalfa was . Alfalfa during 2019 was cut seven times with an 18% reduction in yield for deficit irrigation compared to the fully irrigated treatment. 2019 had a greater reduction in yield for the deficit-irrigated treatment, than the other sequent three years.
Yields were 21.75, 18.47, 17.63, and for fully irrigated treatments and 17.81, 16.43, 16.38, and for the deficit irrigation for 2019, 2020, 2021, and 2022, respectively. Alfalfa can be maintained for four to five years, sometimes longer (for disease-resistant varieties) depending on cutting management. The yield still tends to decline after the second production year due to damage from wheel traffic (causing topsoil compaction), winter diseases in older stands, and long-term soil moisture depletion (Beckman 2022). Thus, results clearly indicate that planning shorter rotations or replanting alfalfa after the third year in production rather than keeping a low-yielding field is strongly recommended, in terms of profitability, which is similar to the observations of Capstaff and Miller (2018). These results concur with Undersander who reported that the alfalfa trials have been highest in the first and second production years and then began to decline with 15% as an average in the third production year and almost 30% in the fourth production year (Undersander 2001).
Irrigation Water Productivity and Crop Water Productivity
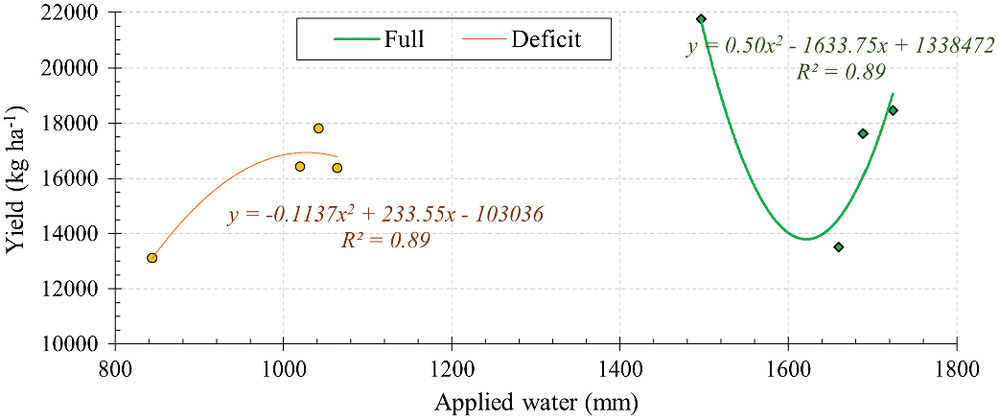
The relationship between the applied IW and yield was analyzed for four years for the full and deficit irrigation treatments (Fig. 10). The generated relationship between AW and yield is the IW production function based on four-year experimental research of alfalfa. 2nd-order polynomial functions were correlated with the relationship between alfalfa yield and applied IW for both full and deficit irrigation treatments. A similar trend was observed by Djaman et al. (2020) where alfalfa forage yield was significantly affected by the irrigation regimes and showed a third-order polynomial relationship with the applied irrigation amount. The coefficient of correlation, is 0.89 for the two equations for both treatments.
IWP and CWP values are summarized in Table 7. The deficit-irrigated treatments have a considerably higher IWP as compared to the fully irrigated treatments. IWP was 14.54, 10.71, 10.44, and for the fully irrigated treatment and was 17.09, 16.11, 15.40, and for the deficit treatment for 2019, 2020, 2021, and 2022, respectively. This is because the applied IW for deficit treatment is much lower than the irrigation AW for the full irrigation treatment. Our finding shows that alfalfa has higher IWP and is more tolerant to deficit irrigation than many perennial forage crops (Kelly et al. 2006; Neal et al. 2011). Since the first cutting cycle (of each year) did not receive water from irrigation where the crop was dependent only on rainfall, IWP for this cycle is the highest among all cutting cycles; however, results for IWP as well as CWP are presented as average for the whole year. CWP was compared between the full irrigation and deficit treatment for the four years of study where it resulted in 18.59, 16.37, 14.91, for full irrigation and 15.17, 14.91, 14.27, and for deficit treatment for 2019, 2020, 2021, and 2022, respectively. The summary of the database (68 manuscripts) for alfalfa water productivity and DM yield is summarized in Table 1 of Fink et al. (2022).
| No. | Cycle | Yield () | IWP () | CWP () | ||||
|---|---|---|---|---|---|---|---|---|
| Start | End | Full | Deficit | Full | Deficit | Full | Deficit | |
| 2019 | ||||||||
| 1st | 1st January | 6th May | 3,220 | 3,250 | 14.54 | 17.09 | 18.59 | 15.17 |
| 2nd | 6th May | 3rd June | 4,143 | 3,722 | ||||
| 3rd | 3rd June | 2nd July | 3,508 | 3,272 | ||||
| 4th | 2nd July | 1st August | 3,430 | 3,197 | ||||
| 5th | 1st August | 29th August | 3,110 | 3,110 | ||||
| 6th | 29th August | 2nd October | 2,049 | 801 | ||||
| 7th | 2nd October | 14th November | 2,292 | 454 | ||||
| Summation | 21,752 | 17,806 | ||||||
| 2020 | ||||||||
| 1st | 1st January | 24th April | 3,622 | 3,584 | 10.71 | 16.11 | 16.37 | 14.91 |
| 2nd | 24th April | 26th May | 2,771 | 2,424 | ||||
| 3rd | 26th May | 24th June | 3,342 | 3,179 | ||||
| 4th | 24th June | 22nd July | 3,223 | 3,355 | ||||
| 5th | 22nd July | 18th August | 1,960 | 1,876 | ||||
| 6th | 18th August | 14th September | 1,229 | 794 | ||||
| 7th | 14th September | 13th October | 1,308 | 938 | ||||
| 8th | 13th October | 16th November | 1,012 | 276 | ||||
| Summation | 18,466 | 16,427 | ||||||
| 2021 | ||||||||
| 1st | 1st January | 7th April | 3,238 | 3,165 | 10.44 | 15.40 | 14.91 | 14.27 |
| 2nd | 7th April | 5th May | 2,407 | 2,351 | ||||
| 3rd | 5th May | 8th June | 3,031 | 3,345 | ||||
| 4th | 8th June | 7th July | 3,113 | 3,337 | ||||
| 5th | 7th July | 4th August | 2,106 | 2,183 | ||||
| 6th | 4th August | 1st September | 1,503 | 1,126 | ||||
| 7th | 1st September | 29th September | 1,549 | 641 | ||||
| 8th | 29th September | 28th October | 683 | 235 | ||||
| Summation | 17,630 | 16,384 | ||||||
| 2022 | ||||||||
| 1st | 1st January | 7th April | 2,372 | 2,852 | 8.14 | 15.54 | 12.28 | 12.56 |
| 2nd | 7th April | 25th May | 1,844 | 2,283 | ||||
| 3rd | 25th May | 22nd June | 2,219 | 2,704 | ||||
| 4th | 22nd June | 20th July | 2,790 | 3,307 | ||||
| 5th | 20th July | 17th August | 1,533 | 1,247 | ||||
| 6th | 17th August | 15th September | 1,413 | 422 | ||||
| 7th | 15th September | 12th October | 1,001 | 121 | ||||
| 8th | 12th October | 10th November | 341 | 177 | ||||
| Summation | 13,513 | 13,113 | ||||||
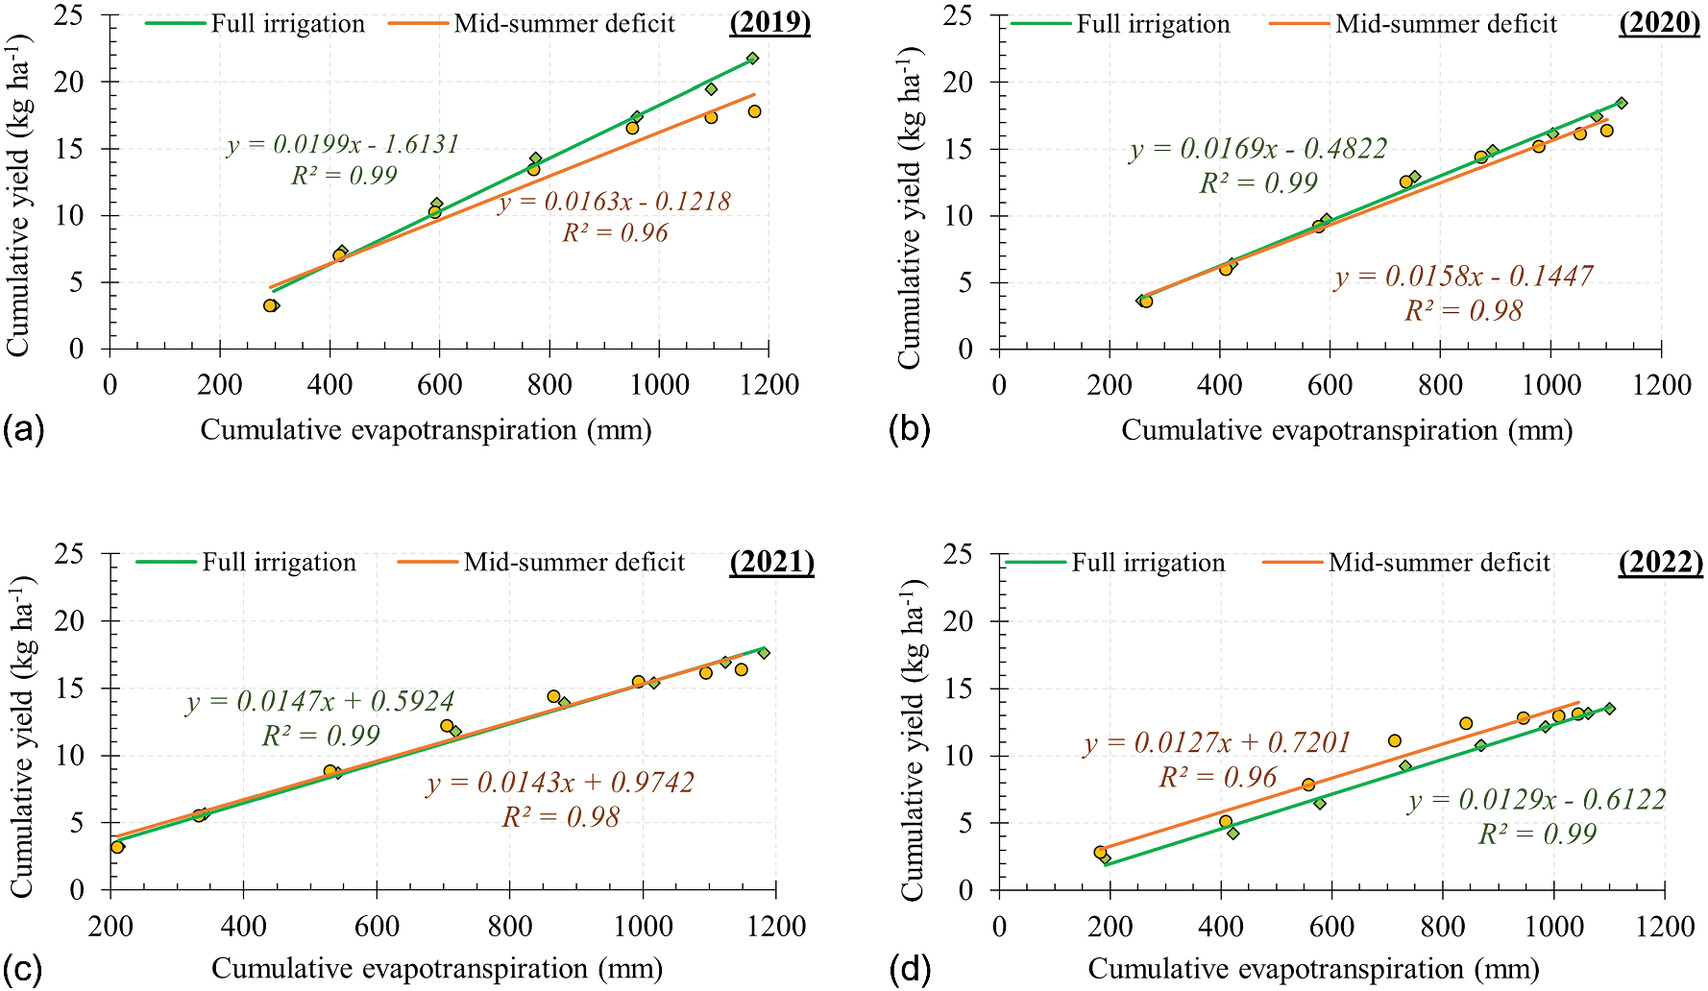
The relationship between the cumulative evapotranspiration (mm) and cumulative yield () for the two irrigation treatments (full irrigation, and the midsummer deficit irrigation) throughout the four years is shown in Figs. 11(a–d). Cumulative evapotranspiration is similar for the four years and within irrigation treatments (full and deficit). A linear relationship between cumulative yield and cumulative evapotranspiration (for the midsummer deficit irrigation treatment) was found with a good correlation where was 0.96, 0.98, 0.98, and 0.99 for 2019, 2020, 2021, and 2022, respectively.
Conclusions
Generally, when water resources are limited and drought conditions limit water availability for irrigation, efficient irrigation management practices are essential for achieving water conservation. Alfalfa is the major field crop in California, and midsummer deficit irrigation could be used to generate a significant amount of water to alleviate the impact of drought. This study documented the impact of midsummer deficit irrigation (for four years) on IWP and crop water productivity (CWP) as compared to normal irrigation practices (full irrigation).
Alfalfa yield was higher in the first year and significantly declined over time. There was no significant difference in yield between full and deficit treatment for the four years. The net IW savings were 454, 706, 625, and 815 mm in 2019, 2020, 2021, and 2022 that represented 30.3%, 40.9%, 37.0%, and 49.1% of the AW. In the San Joaquin Valley of California, midsummer deficit-irrigated treatments had a higher IWP than those fully irrigated treatments.
CWP for the full and deficit treatment was almost the same for each year since crop evapotranspiration and yield were almost the same as well. These results suggest that IWP may be more “precise,” but it is not more useful, as water conservation depends upon consumed water (). Seasonal IWP is a more precise tool than seasonal CWP to study the plant-water relationship. Additionally, crop production function was identified using applied IW. Our finding revealed that midsummer deficit irrigation practices could be implemented and considered by alfalfa growers during dry years when the availability of IW is limited. Further work is needed to evaluate the cost-benefit and the tradeoff between yield loss and water savings including energy and labor costs.
Data Availability Statement
Some or all data, models, or code generated or used during the study are available from the corresponding author by request (CIMIS, TULE, and yield data).
Acknowledgments
This work was supported by UC Kearney Agricultural Research and Extension Center and USDA-Agricultural Research Service (ARS) Collaborative Agreement No. 58-2034-8-038. This research was also supported by USDA Natural Resources Conservation Agreement NR183A750023C005.
References
Alam, M., T. P. Trooien, T. J. Dumler, and D. H. Rogers. 2002. “Using subsurface drip irrigation for alfalfa 1.” JAWRA J. Am. Water Resour. Assoc. 38 (6): 1715–1721. https://doi.org/10.1111/j.1752-1688.2002.tb04376.x.
Anower, M. R., A. Boe, D. Auger, I. W. Mott, M. D. Peel, L. Xu, P. Kanchupati, and Y. Wu. 2015. “Comparative drought response in eleven diverse alfalfa accessions.” J. Agron. Crop Sci. 203 (1): 1–13. https://doi.org/10.1111/jac.12156.
Bai, W.-M., and L.-H. Li. 2003. “Effect of irrigation methods and quota on root water uptake and biomass of alfalfa in the Wulanbuhe sandy region of China.” Agric. Water Manage. 62 (2): 139–148. https://doi.org/10.1016/S0378-3774(03)00075-1.
Barta, A. L., and R. M. Sulc. 2002. “Interaction between waterlogging injury and irradiance level in alfalfa.” Crop Sci. 42 (5): 1529–1534. https://doi.org/10.2135/cropsci2002.1529.
Beckman, B. 2022. Pasture and forage minute: Improving alfalfa yields, nutritional quality. Lincoln, NE: Univ. of Nebraska–Lincoln.
Capstaff, N. M., and A. J. Miller. 2018. “Improving the yield and nutritional quality of forage crops.” Front. Plant Sci. 9 (Apr): 535. https://doi.org/10.3389/fpls.2018.00535.
CDFA (California Department of Food and Agriculture). 2022. “California Agricultural Statistics Review 2021-2022.” Accessed December 1, 2022. https://www.cdfa.ca.gov/Statistics/PDFs/2022_Ag_Stats_Review.pdf.
CDFA (California Department of Food and Agriculture). 2024. “Alfalfa.” Accessed December 1, 2022. https://www.cdfa.ca.gov/is/ffldrs/frep/FertilizationGuidelines/Alfalfa.html.
Djaman, K., D. Smeal, K. Koudahe, and S. Allen. 2020. “Hay yield and water use efficiency of alfalfa under different irrigation and fungicide regimes in a semiarid climate.” Water 12 (6): 1721. https://doi.org/10.3390/w12061721.
DWR (California Department of Water Resources). 2023. 2023 California water plan updates-2023 agricultural water use data. Sacramento, CA: DWR.
Escriva-Bou, A., E. Hanak, S. Cole, and J. Medellín-Azuara. 2023. “The future of agriculture in the San Joaquin Valley.” Accessed November 20, 2022. https://www.ppic.org/publication/policy-brief-the-future-of-agriculture-in-the-san-joaquin-vall.
Feng, Y., et al. 2022. “Yield and quality properties of alfalfa (Medicago sativa L.) and their influencing factors in China.” Eur. J. Agron. 141 (Nov): 126637. https://doi.org/10.1016/j.eja.2022.126637.
Fereres, E., and M. A. Soriano. 2007. “Deficit irrigation for reducing agricultural water use.” J. Exp. Bot. 58 (2): 147–159. https://doi.org/10.1093/jxb/erl165.
Fink, K. P., P. Grassini, A. Rocateli, L. M. Bastos, J. Kastens, L. P. Ryan, X. Lin, A. Patrignani, and R. P. Lollato. 2022. “Alfalfa water productivity and yield gaps in the U.S. central Great Plains.” Field Crops Res. 289 (Dec): 108728. https://doi.org/10.1016/j.fcr.2022.108728.
Frate, C., B. Roberts, and V. Marble. 1991. “Imposed drought stress has no long-term effect on established alfalfa.” California Agric. 45 (3): 33–36. https://doi.org/10.3733/ca.v045n03p33.
Hanson, B., and D. Putnam. 2004. “Flood irrigation of Alfalfa: How does it behave?” In Proc., National Alfalfa Symp. San Diego: UC Cooperative Extension.
Hanson, B., D. Putnam, and R. Snyder. 2007. “Deficit irrigation of alfalfa as a strategy for providing water for water-short areas.” Agric. Water Manage. 93 (1–2): 73–80. https://doi.org/10.1016/j.agwat.2007.06.009.
Howell, T. A., R. H. Cuenca, and K. H. Solomon. 1990. “Crop yield response.” In Management of farm irrigation systems, edited by G. J. Hoffman, T. A. Howell, and K. H. Solomon, 93–122. St. Joseph, MI: American Society of Agricultural Engineers.
Huang, Z., Y. Liu, Z. Cui, Y. Fang, H. He, B.-R. Liu, and G.-L. Wu. 2018. “Soil water storage deficit of alfalfa (Medicago sativa) grasslands along ages in arid area (China).” Field Crops Res. 221 (May): 1–6. https://doi.org/10.1016/j.fcr.2018.02.013.
IBM (International Business Machines Corporation). n.d. “IBM SPSS statistics.” Accessed November 20, 2022. https://www.ibm.com/products/spss-statistics.
Irrometer. n.d. “Watermark soil moisture sensors.” Accessed November 20, 2022. https://www.irrometer.com/sensors.html.
Ismail, S. M., and M. H. Almarshadi. 2013. “Maximizing productivity and water use efficiency of alfalfa under precise subsurface drip irrigation in arid regions.” Irrig. Drain. 62 (1): 57–66. https://doi.org/10.1002/ird.1705.
Kelly, K. B., C. R. Stockdale, and W. K. Mason. 2006. “The productivity of irrigated legumes in northern Victoria. 1. Effect of irrigation interval.” Aust. J. Exp. Agric. 45 (12): 1567–1576. https://doi.org/10.1071/EA03212.
Klocke, N. L., R. S. Currie, and J. D. Holman. 2013. “Alfalfa response to irrigation from limited water supplies.” Trans. ASABE 56 (5): 1759–1768. https://doi.org/10.13031/trans.56.10166.
Leinfelder-Miles, M. 2013. “Alfalfa, Salinity, and Soil Leaching. Alfalfa & Forage News, News and information from UC Cooperative Extension about alfalfa and forage production.” Accessed November 20, 2022. https://ucanr.edu/blogs/blogcore/postdetail.cfm?postnum=9529.
Li, Y., and D. Su. 2017. “Alfalfa water use and yield under different sprinkler irrigation regimes in north arid regions of China.” Sustainability 9 (8): 1380. https://doi.org/10.3390/su9081380.
Lindenmayer, R. B., N. C. Hansen, J. Brummer, and J. G. Pritchett. 2011. “Deficit irrigation of alfalfa for water-savings in the Great Plains and Intermountain West: A review and analysis of the literature.” Agron. J. 103 (1): 45–50. https://doi.org/10.2134/agronj2010.0224.
McCrometer. 2023. “McPropeller.” Accessed May 1, 2023. https://www.mccrometer.com/mcpropeller/product?id=52003823659.
Mengistu, G., M. Aleme, A. Bogale, D. Tulu, M. Faji, G. Terefe, and K. Mohammed. 2022. “Dry matter yield and nutritive quality of alfalfa (Medicago sativa L.) cultivars grown in sub-humid areas in Ethiopia.” Food Sci. Technol. 8 (1): 2154854. https://doi.org/10.1080/23311932.2022.2154854.
Mundy, G. N., K. L. Greenwood, K. B. Kelly, S. M. Austin, and K. E. Dellow. 2006. “Improved soil and irrigation management for forage production 3. Plant–soil–water relationships.” Aust. J. Exp. Agric. 46 (3): 327–335. https://doi.org/10.1071/EA04097.
Neal, J. S., W. J. Fulkerson, and B. G. Sutton. 2011. “Differences in water-use efficiency among perennial forages used by the dairy industry under optimum and deficit irrigation.” Irrig. Sci. 29 (May): 213–232. https://doi.org/10.1007/s00271-010-0229-1.
Orloff, S., K. Bali, and D. Putnam. 2014. “Deficit irrigation of alfalfa and grasses: What are the impacts/options.” In Proc., California Alfalfa and Grains Symp., Long Beach, CA, 10–12 December 2014. Davis, CA: Univ. of California.
Orloff, S., D. Putnam, B. Hanson, and H. Carlson. 2005. “Implications of deficit irrigation management of alfalfa.” In Proc., California Alfalfa and Forage Symp., 12–14 December 2005, Visalia, CA. Davis, CA: Univ. of California.
Ottman, M. J., and D. H. Putnam. 2017. “Deficit irrigation with alfalfa: What are the economics?” In Proc., 2017 Western Alfalfa & Forage Symp., Reno, NV, 28–30 November 2017. Davis, CA: Univ. of California.
Pembleton, K. G., R. P. Rawnsley, and D. J. Donaghy. 2011. “Yield and water-use efficiency of contrasting lucerne genotypes grown in a cool temperate environment.” Crop Pasture Sci. 62 (7): 610–623. https://doi.org/10.1071/CP11094.
Perez-Blanco, C. D., A. Hrast-Essenfelder, and C. Perry. 2020. “Irrigation technology and water conservation: A review of the theory and evidence.” Rev. Environ. Econ. Policy 14 (2): 216–239. https://doi.org/10.1093/reep/reaa004.
Putnam, D. H., U. Gull, B. Perez, M. Leinfelder-Miles, and R. F. Long. 2017a. Flooding and water-logging damage in alfalfa–What to do? Davis, CA: Univ. of California, Agricultural and Natural Resources.
Putnam, D. H., and S. Orloff. 2016. “Agronomic factors affecting forage quality in Alfalfa.” In Proc., 2016 California Alfalfa and Forage Symp., Reno, NV, November 29–December 1, 2016 Davis, CA: UC Cooperative Extension, Dept. of Plant Sciences, Univ. of California, Davis.
Putnam, D. H., J. Radawich, D. Zaccaria, and A. Montazar. 2017b. Partial-season alfalfa irrigation: An effective strategy for a future of variable water supplies. Davis, CA: Univ. of California Cooperative Extension Service.
Putnam, D. H., E. Takele, R. Kallenback, and W. Graves. 2000. Irrigating alfalfa in the Low Desert: Can summer dry-down be effective for saving water in alfalfa? Report submitted to the Bureau of Reclamation (USDI). Yuma, AZ: Bureau of Reclamation.
Qiu, Y., Y. Fan, Y. Chen, X. Hao, S. Li, and S. Kang. 2021. “Response of dry matter and water use efficiency of alfalfa to water and salinity stress in arid and semiarid regions of Northwest China.” Agric. Water Manage. 254 (Aug): 106934. https://doi.org/10.1016/j.agwat.2021.106934.
Rogers, M. E., A. R. Lawson, and K. B. Kelly. 2016. “Lucerne yield, water productivity, and persistence under variable and restricted irrigation strategies.” Crop Pasture Sci. 67 (5): 563–573. https://doi.org/10.1071/CP15159.
Shapland, T. M., R. L. Snyder, and A. J. McElrone. 2014. “Thermocouple frequency response compensation leads to convergence of the surface renewal alpha calibration.” Agric. For. Meteorol. 189 (Jun): 36–47. https://doi.org/10.1016/j.agrformet.2014.01.008.
Shewmaker, G. E., R. G. Allen, and W. H. Neibling. 2011. Alfalfa irrigation and drought. Moscow, ID: College of Agricultural and Life Sciences, Univ. of Idaho.
Slama, I., S. Tayachi, A. Jdey, A. Rouached, and C. Abdelly. 2011. “Differential response to water deficit stress in alfalfa (Medicago sativa) cultivars: Growth, water relations, osmolyte accumulation, and lipid peroxidation.” Afr. J. Biotechnol. 10 (72): 16250–16259. https://doi.org/10.5897/AJB11.1202.
State of California. n.d. “CIMIS station.” Accessed May 1, 2023. https://cimis.water.ca.gov/Stations.aspx.
Tule Sensors. 2024. “The benefits of tule sensors.” Accessed November 20, 2022. https://tule.ag/sensors/.
UC Davis. 2023. “Agricultural irrigation water management.” Accessed May 1, 2023. https://ucmanagedrought.ucdavis.edu/Agriculture/Crop_Irrigation_Strategies/Alfalfa/.
Undersander, D. 2001. “Alfalfa yield and stand.” Accessed May 2, 2023. https://fyi.extension.wisc.edu/forage/alfalfa-yield-and-stand/.
Wang, Y., C. Liu, P. Cui, and D. Su. 2021. “Effects of partial root-zone drying on alfalfa growth, yield, and quality under subsurface drip irrigation.” Agric. Water Manage. 245 (Feb): 106608. https://doi.org/10.1016/j.agwat.2020.106608.
Web Soil Survey. n.d. “Web soil survey map.” Accessed November 20, 2022. https://websoilsurvey.sc.egov.usda.gov/App/WebSoilSurvey.aspx.
Yang, H., F. An, F. Yang, and Z. Wang. 2019. “The impact of irrigation on yield of alfalfa and soil chemical properties of saline-sodic soils.” PeerJ 7 (8): e7148. https://doi.org/10.7717/peerj.7148.
Information & Authors
Information
Published In

Journal of Irrigation and Drainage Engineering
Volume 150 • Issue 6 • December 2024
Copyright
This work is made available under the terms of the Creative Commons Attribution 4.0 International license, https://creativecommons.org/licenses/by/4.0/.
History
Received: Jun 1, 2023
Accepted: May 8, 2024
Published online: Sep 24, 2024
Published in print: Dec 1, 2024
Discussion open until: Feb 24, 2025
ASCE Technical Topics:
Authors
Metrics & Citations
Metrics
Citations
Download citation
If you have the appropriate software installed, you can download article citation data to the citation manager of your choice. Simply select your manager software from the list below and click Download.