Regime Channel Bedload Transport Equation
Publication: Journal of Hydraulic Engineering
Volume 149, Issue 3
Abstract
Numerous theories have been presented over the years for quantifying bedload transport in streams and rivers. These theories have been derived using physical processes, statistical methods, and semiempirical and empirical methods and rely on a variety of hydraulic, boundary, and bed material properties. Most of these equations represent instantaneous bedload transport related to temporal hydraulic and bed conditions and are not well-suited to estimate long-term average bedload over a broad range of channels. Using a pure empirical analysis, the author has developed a dimensionally homogeneous regime channel bedload transport equation not requiring bedload measurements for calibration or verification. The new equation was developed using 45 data sets and verified using 29 additional data sets encompassing a very broad range of channel conditions and was found to rely solely on stream power and bank-full stream power or, for practical applications, flow and bank-full flow. Statistical metrics indicated better performance by the new equation than by other bedload transport equations evaluated using the same source data and statistical methods.
Introduction
In his seminal 1966 paper An Approach to the Sediment Transport Problem from General Physics, author R. A. Bagnold (1966) stated, with regard to clarity of an understanding between sediment transport rate and flow quantity, “Indeed, the outlook is obscured by the very number of published theories.” Bagnold also stated, “There can be no reasonable doubt that the transport rate is related primarily to the available power, as in all other modes of transport.” Subsequent to Bagnold’s paper, many more theories have been developed; however, the field of study is still without a dimensionally homogeneous relationship characterizing long-term average bedload transport over a broad range of channels or a consensus on an appropriate relationship to consider for a broad range of channels. Relationships have been developed using theoretical, empirical, and semiempirical approaches relying on shear stress, energy, and statistical analysis (Gray and Simões 2007). Most of these bedload transport equations are applicable over a limited range of channel and bed conditions (Ashworth and Ferguson 1989; Gomez and Church 1989; Van der Scheer et al. 2001; Wong and Parker 2006). This concern is also reflected in the ASCE Manual on Engineering Practice No. 110 (Garcia 2007).
Results of this study indicate that regime channel bedload transport is directly related to stream power and bank-full stream power; hence, it is appropriate to resolve the results of this study with prior studies considering the same factors. Bagnold (1966) developed a sediment transport relationship based on stream power to estimate suspended load and bedload. The relationship was developed from physical understandings of bed materials and boundary layer hydraulic conditions in terms of stream power and empirically derived efficiencies addressing ambiguous factors. The physical theory was vetted by comparison with flume studies of sediment transport and field measurements of transport in sand-bed rivers at a time when bedload measurements were not available.
Troendle et al. (2001) set out to characterize bedload transport by Rosgen stream type. The research team investigated the relationship between bedload transport divided by bank-full bedload transport and stream flow divided by bank-full streamflow to avoid potential dimensional problems in a pure empirical analysis. Although they found that there was no relationship between bedload transport and Rosgen stream type, they did find a tight “reference” relationship between and for all channels. Using this relationship, one only needs to know the bedload transport rate near bank-full flow to estimate bedload at any flow. The reference relationship is employed in Rosgen’s popular FLOWSED program (a module of the RIVERMorph software program).
Recent efforts to define a bedload transport relationship applicable over a broad range of channels have included work by Hinton et al. (2018) and Barry et al. (2004). Hinton et al. (2018) evaluated the application of seven selected bedload transport equations over a broad range of channel and bed conditions. Barry et al. (2004) developed a new empirical power equation using 24 data sets from gravel bed rivers. Among the most popular bedload transport relationships is the Reference Sediment Transport Relationship developed by Troendle and embodied in FLOWSED.
Data and Study Approach
Measurement of instantaneous bedload transport can vary considerably due to a variety of local influences. Bedload transport equations developed from measurements in a stream (stream equations) are often used to estimate average bedload transport; however, their use is limited to the stream. If a general bedload transport relationship is desired to represent average bedload transport for many channels, the relationship must consider reach scale data as a basis of the relationship rather than individual measurements. Consequently, this study relies on stream equations characterizing bedload transport for each data set rather than relying on individual bedload measurements.
The coefficients and exponents of stream power equations representing bedload were derived from a database of 484 data sets containing over 15,000 measurements maintained by Brigham Young University [BYU data set (Hinton et al. 2017)]. From this database, 74 data sets with a total of 5,634 measurements were identified to have adequate data necessary for this study. These data sets were then randomly divided into analysis and verification data sets. Analysis data consisted of 45 data sets comprising of 3,237 measurements and verification data consisted of 29 data sets comprising 2,397 measurements. The ranges of hydraulic and sediment parameter values represented by the data sets are given in Table 1.
| Parameter | Units | Analysis data set | Verification data set | ||
|---|---|---|---|---|---|
| Minimum | Maximum | Minimum | Maximum | ||
| Bank-full flow, | 0.30 | 2,600 | 0.62 | 2,200 | |
| Slope, | — | 0.0005 | 0.055 | 0.0003 | 0.05 |
| Bank-full width, | m | 2.0 | 188 | 2.7 | 145 |
| Bank-full depth, | m | 0.17 | 5.12 | 0.22 | 5.72 |
| Surface, | mm | 0.05 | 80 | 1.0 | 45 |
| Surface, | mm | 8.0 | 190 | 16 | 204 |
| Surface, | mm | 25 | 450 | 70 | 600 |
| Aspect ratio, | — | 0.020 | 0.100 | 0.021 | 0.080 |
| Bed roughness, | — | 0.011 | 0.435 | 0.013 | 0.384 |
| Bed particle diversity, | — | 0.011 | 0.500 | 0.007 | 0.178 |
The stream equations reasonably represent regime channel bedload power for each data set and encompass a large range of coefficients and a relatively narrow range of exponents. For dimensional consistency, best-fit coefficients were computed for all reaches, given the average exponent of the analysis data sets (normalized stream equations). The normalized stream equation coefficients were then plotted and compared with a variety of sediment and channel characteristics in an attempt to find a relationship suitable for representing the coefficients. After identifying a relationship between coefficients of normalized stream equations and hydraulic characteristics yielding a regime channel bedload transport equation, the equation was vetted using the verification data sets, statistical metrics, comparison with the performance of Troendle’s reference relationship, and comparison with the performance of bedload equations evaluated by Hinton et al. (2018).
Stream Equations
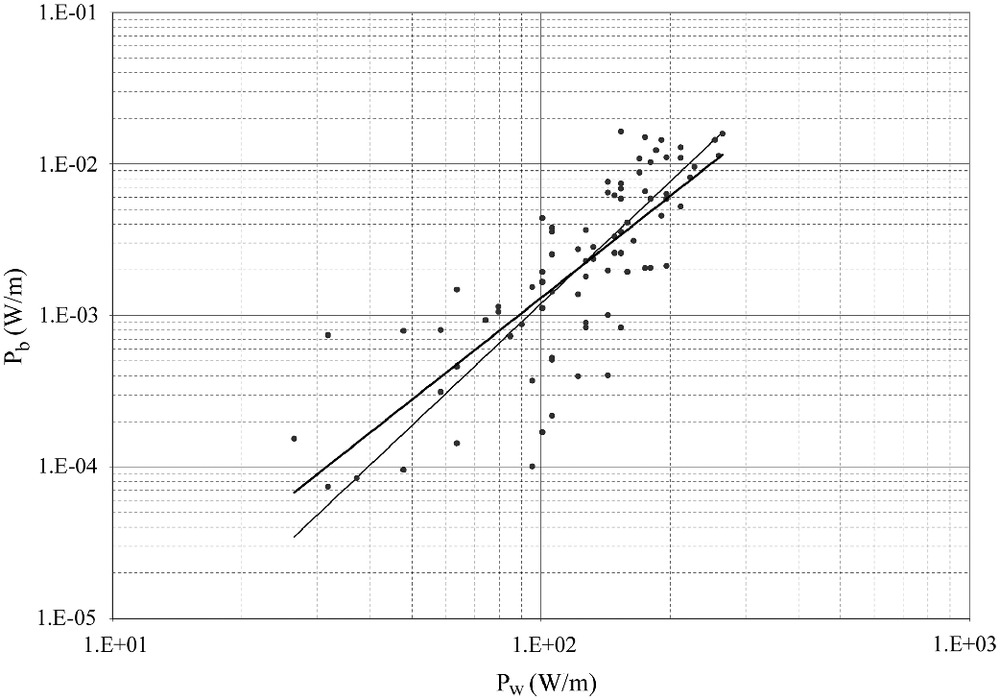
For each of the 45 analysis data sets, the power associated with bedload transport, computed in watts per meter length of channel represented by Eq. (1), was plotted against the power associated with the flow of water in watts per meter represented by Eq. (2) on a log-log scale. Lines of best fit using least squares were identified along with the coefficients and exponents of stream equations ( and , respectively) in the form of Eq. (3)where = unit bedload power (W/m); = unit water power (W/m); = bedload transport (); = slope, = gravitational acceleration (); = density of water (); = flow (); and = dimensional multiplicative factor of constant value having units of that are referred to here as a coefficient. Given the variability associated with bedload measurements, has been assumed equal to throughout this study. Stream equation coefficients were found to range in value from to . Exponents ranged from 0.87 to 6.1 with an average of 2.67 (standard ), and exponents for all but three data sets fell within the range of 1.4 to 3.9. For dimensional consistency, the average exponent of 2.67 was used as a constant exponent for recalculating normalized stream equation coefficients. Fig. 1 presents an example plot of bedload unit power against water unit power for the Fool Creek data set, along with the line of best fit (stream equation) and the line of best fit given the constant exponent of 2.67 (normalized stream equation). Normalized stream equation coefficients () were found to range in value from to . Table 2 identifies the coefficients, exponents, and coefficient of determination for the least-squares best fit and the coefficients for normalized stream equations.
(1)
(2)
(3)
| Site No. | Data set | Best fit | Best-fit coefficient for | ||
|---|---|---|---|---|---|
| 1 | East St. Louis Creek | 2.678 | 0.609 | ||
| 2 | Fool Creek | 2.229 | 0.700 | ||
| 3 | St. Louis Creek Site 1 | 2.133 | 0.821 | ||
| 4 | St. Louis Creek Site 3 | 2.836 | 0.877 | ||
| 5 | Little Granite Creek | 2.935 | 0.860 | ||
| 6 | Fivemile Creek | 2.845 | 0.788 | ||
| 7 | North Fork Sprague River | 2.459 | 0.616 | ||
| 8 | Paradise Creek | 3.498 | 0.776 | ||
| 9 | South Fork Sprague River | 2.579 | 0.942 | ||
| 10 | Annie Creek | 2.016 | 0.838 | ||
| 11 | Cherry Creek | 1.595 | 0.723 | ||
| 12 | Spencer Creek | 0.868 | 0.330 | ||
| 13 | Big Wood River near Ketchum | 3.540 | 0.915 | ||
| 14 | Blackmare Creek | 1.986 | 0.729 | ||
| 15 | Johnson Creek | 2.819 | 0.924 | ||
| 16 | Main Fork Red River | 2.088 | 0.765 | ||
| 17 | Middle Fork Salmon River | 5.749 | 0.865 | ||
| 18 | Salmon River below Yankee Fork | 3.851 | 0.828 | ||
| 19 | Salmon River near Shoup | 3.884 | 0.773 | ||
| 20 | South Fork Payette River | 2.020 | 0.782 | ||
| 21 | Dollar Creek | 2.304 | 0.797 | ||
| 22 | Fourth of July Creek | 2.733 | 0.859 | ||
| 23 | Hawley Creek | 1.590 | 0.319 | ||
| 24 | Herd Creek | 2.459 | 0.908 | ||
| 25 | Lolo Creek Data | 1.490 | 0.557 | ||
| 26 | Rapid River | 2.233 | 0.823 | ||
| 27 | Thompson Creek | 3.275 | 0.929 | ||
| 28 | Trapper Creek | 1.704 | 0.728 | ||
| 29 | Valley Creek | 2.808 | 0.689 | ||
| 30 | North Fork Clearwater River | 3.862 | 0.969 | ||
| 31 | Fall Creek | 2.036 | 0.745 | ||
| 32 | Wolf Creek at bridge | 1.982 | 0.649 | ||
| 33 | Goose Creek #2 | 2.908 | 0.659 | ||
| 34 | Goose Creek #4 | 1.752 | 0.365 | ||
| 35 | Left Hand Creek | 6.089 | 0.913 | ||
| 36 | Little Beaver Creek | 2.774 | 0.751 | ||
| 37 | Lower Trap Creek | 3.684 | 0.903 | ||
| 38 | East Fork River | 1.608 | 0.622 | ||
| 39 | Battle Creek | 3.158 | 0.795 | ||
| 40 | East Fork Savory Creek | 2.748 | 0.811 | ||
| 41 | Big Sandstone Creek | 2.363 | 0.847 | ||
| 42 | Sagehen Creek | 1.797 | 0.366 | ||
| 43 | Jacoby Creek | 2.778 | 0.890 | ||
| 44 | Little Granite Creek | 3.101 | 0.667 | ||
| 45 | Snake River | 2.529 | 0.546 | ||
Regime Channel Bedload Transport Equation Analysis
It is clear from the stream equations that unit bedload power can be reasonably represented by unit water power using power equations having a wide range of coefficients and a narrow range of exponents averaging 2.67. The next step of this study investigates whether there is some relationship between the normalized stream equation coefficients and hydraulic and/or sediment parameters sufficient to produce an equation of the form in Eq. (4)where = expression to be determined from hydraulic and channel characteristics in the form of Eq. (5)
(4)
(5)
The normalized stream equation coefficients were plotted against a variety of hydraulic and sediment parameters including slope, bank-full depth (m), bank-full width (m), bank-full velocity (), the 15th, 50th, and 85th percentile bed particle sizes (mm), dimensionless combinations of these parameters representing channel aspect ratio , relative roughness , and diversity of bed particles in an effort to identify hydraulic or sediment parameters that may be useful for defining an equation capable of characterizing normalized stream equation coefficients.
Based on coefficients of determination, fair to moderate trends were found between the normalized stream equation coefficients and bank-full width, bank-full depth, bank-full velocity, and bed material size metrics. Bed material sizes, however, are a result of sorting related to bank-full stream power and are therefore not independent of bank-full hydraulic characteristics. Weak to fair relationships were found between normalized stream equation coefficients and slope, channel aspect ratio, relative roughness, and diversity of bed material particles. A strong power equation relationship was found between bank-full flow and the normalized stream equation coefficients.
A second tier of evaluation was conducted to determine if parameters indicating a weak or fair relationship with normalized stream coefficients would complement the strong direct relationship with bank-full flow. Inclusion of slope with bank-full flow, a measure of stream power, produced a very strong relationship with an increase in coefficient of determination from 0.82 to 0.92. Subsequent evaluation of other parameters failed to identify any other parameters that would yield an improved relationship. The independent parameter producing the strongest relationship constituting a measure of bank-full stream power is also the parameter necessary for expression of a stream power–based equation, Eq. (4), to be dimensionally homogeneous. Coefficients of determination of the tested parameters and combinations of parameters are identified in Table 3. Eq. (6) identifies the least-squares best-fit equation relating normalized stream equation coefficients to bank-full unit stream powerwhere = density of water (); = bank-full flow (); = slope, = gravitational acceleration (); and = unit bank-full water power (W/m). In order for the relationship in the form of Eq. (4) to be dimensionally homogeneous, expression must have an exponent of , leaving one whole unit of power. Therefore, a minor exponential rotation was employed, changing the exponent in the power equation defining expression to , and the expression coefficient was recomputed to be , resulting in Eq. (7)
(6)
(7)
| Tier | Parameter | Relationship strength/notes | |
|---|---|---|---|
| Direct | Bank-full width, | 0.75 | Moderate |
| Bank-full depth, | 0.75 | Moderate | |
| Bank-full velocity, | 0.63 | Fair | |
| Slope, | 0.59 | Weak | |
| 15th percentile bed particle, | 0.72 | Moderate, not independent | |
| 50th percentile bed particle, | 0.72 | Moderate, not independent | |
| 85th percentile bed particle, | 0.75 | Moderate, not independent | |
| Channel aspect ratio, | 0.62 | Fair | |
| Relative roughness, | 0.58 | Weak | |
| Bed material size diversity, | 0.65 | Fair | |
| Bank-full flow, | 0.82 | Strong | |
| 2nd tier | Bank-full flow × slope, | 0.92 | Very strong, substantial improvement |
| Bank-full stream power × | 0.90 | No improvement | |
| Bank-full stream power × | 0.93 | No significant improvement | |
| Bank-full stream power × | 0.93 | No significant improvement | |
| Bank-full stream power × | 0.89 | No improvement | |
| Bank-full stream power × | 0.82 | No improvement | |
| Bank-full stream power × | 0.89 | No improvement |
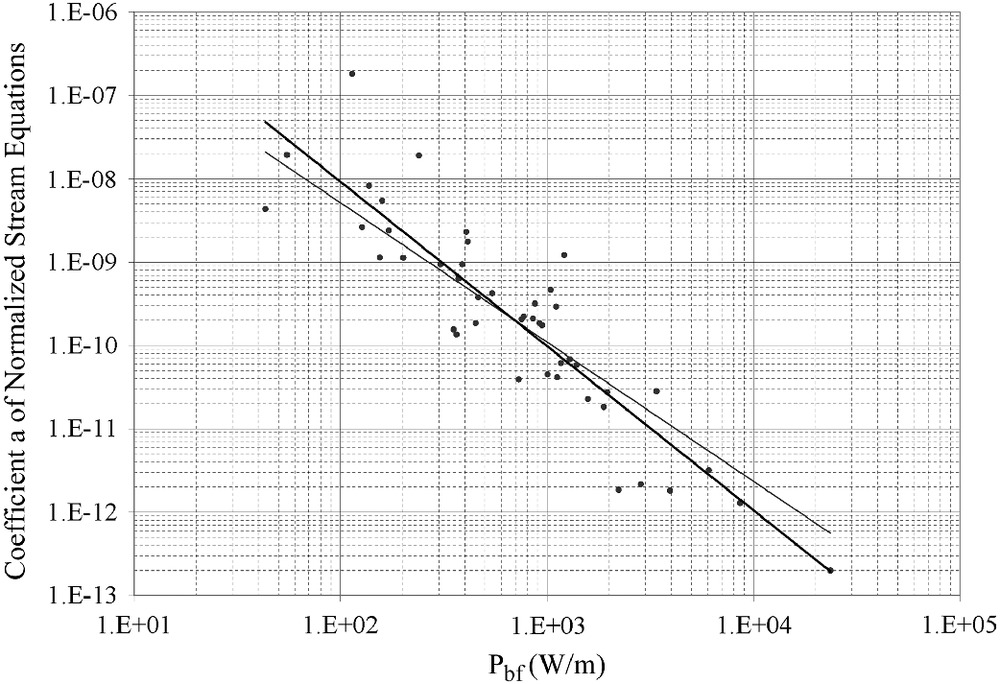
Fig. 2 presents a plot of normalized stream coefficients against bank-full stream power for each analysis data set, along with the line of best fit [Eq. (6)], and the line representing expression of the regime channel bedload transport equation [Eq. (7)]. The coefficients of determination for the lines are 0.924 and 0.915, respectively. Replacing in Eq. (4) with Eq. (7) yields the regime channel bedload transport equation [Eq. (8)]where = unit bedload power (W/m); = unit water power (W/m); and = unit bank-full water power (W/m).
(8)
For rivers having a constant slope, and assuming the slope of the riverbed is equal to the slope of the hydraulic gradient over the range of flows, substituting Eqs. (1) and (2) for , , and into Eq. (8) and simplifying yields an equation based solely on flow and bank-full flow as follows:where = bedload transport (); = stream flow ; and = bank-full flow .
(9)
Results
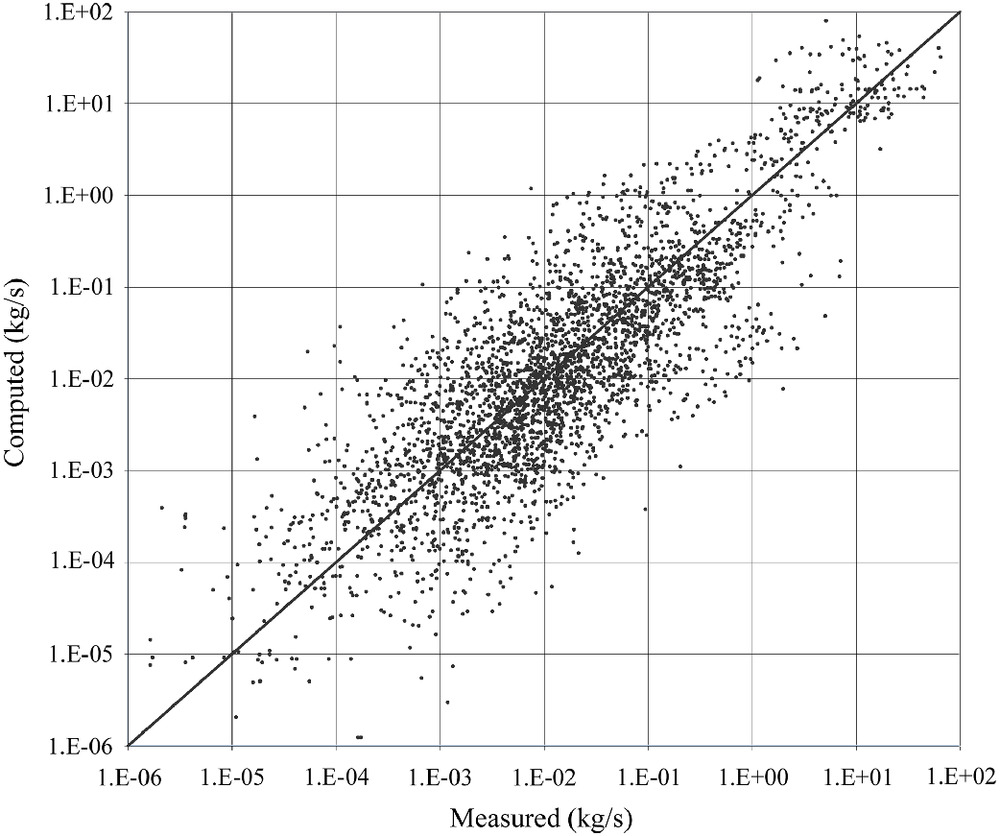
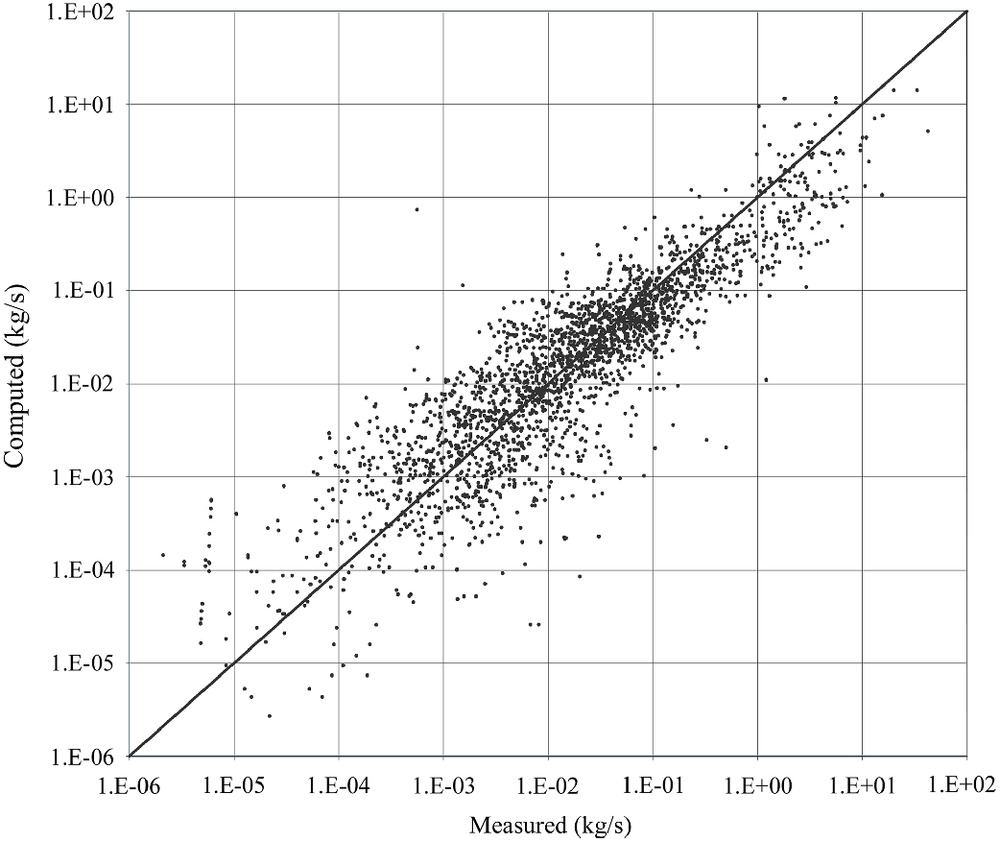
The ultimate test of the regime channel bedload transport equation is its ability to represent bedload measurements over the full range of channels investigated. Bedload transport rates for the 3,237 analysis data set measurements and 2,397 verification data set measurements were computed using Eq. (8). Fig. 3 shows the point cloud produced by comparing computed bedload transport with original measurements for the analysis data set, along with a line of perfect agreement. Fig. 4 shows the same comparison for the verification data set. Given the line of perfect agreement being well-centered within the point cloud over the entire range of measurements, the equation reasonably represents regime channel bedload transport over the range of channels investigated.
Statistical Metrics
Sufficiency of the equations to predict bedload transport was also evaluated using the root-mean square error of logarithmic values (RMSEL) in the form of Eq. (10), and relative mean error (RME) in the form of Eq. (11). Both equations were developed to reduce bias associated with high discharges when using a root-mean square error equation. The RME equation has some bias toward equations that underpredict bedload transport, which is of concern when comparing results of this analysis with other equations that may underpredict or overpredict bedload transportwhere = computed bedload; = measured bedload; and = number of comparisons. RMSEL and RME values were determined for the regime channel bedload transport equation compared with measured values of bedload transport. RMSEL and RME values were also determined for bedload transport rates computed by Troendle’s relative relationship versus measured bedload transport rates. Table 4 presents the computed RMSEL [Eq. (10)] and RME [Eq. (11)] values along with RMSEL and RME values determined by Hinton et al. (2018) for the Meyer-Peter-Muller, Wilcock two-fraction, Parker calibrated, Parker uncalibrated, Elhakeem and Imran, Barry, Pagosa, and Recking equations. Low values of RMSEL and RME for the regime channel bedload transport equation indicate that the equation reasonably represents regime channel bedload transport rates. The regime channel bedload transport equation provides a better estimate of bedload transport rates over a wide range of channels than Troendle’s relative relationship and by the equations evaluated by Hinton et al. (2018).
(10)
(11)
| Equation | Data set | RMSEL | RME |
|---|---|---|---|
| Stream equations, best fit | Analysis (45 sets) | 0.09 | 1.71 |
| Regime channel bedload transport equation [Eq. (9)] | Analysis | 0.12 | 3.44 |
| Verification (29 sets) | 0.10 | 7.73 | |
| Hinton et al. (2018) (31 sets) | 0.07 | 2.77 | |
| Hinton less Idaho, Rosgen (17 sets) | 0.04 | 1.66 | |
| Troendle relative relationship, besta | Analysis | 0.10 | 30.7 |
| Troendle relative relationship, superiorb | Analysis | 0.16 | 45.5 |
| Meyer-Peter-Muller | Hinton et al. (2018) | 0.85 | |
| Wilcock two-fraction | Hinton | 0.24 | 8.54 |
| Parker, calibrated | Hinton | 0.20 | 621 |
| Parker, uncalibrated | Hinton | 0.86 | |
| Elhakeem and Imran | Hinton | 0.10 | 5.60 |
| Barryc | Hinton less Idaho, Rosgen | 0.02 | 4.61 |
| Pagosac | Hinton less Idaho, Rosgen | 0.02 | 1.62 |
| Reckingc | Hinton less Idaho, Rosgen | 0.10 | 13.2 |
a
Best possible outcome, estimated from normalized stream equation.
b
Superior outcome, estimated from measurement in large data set closest to reported .
c
Empirical analysis without dimensional continuity.
Relationship to Results of Prior Studies
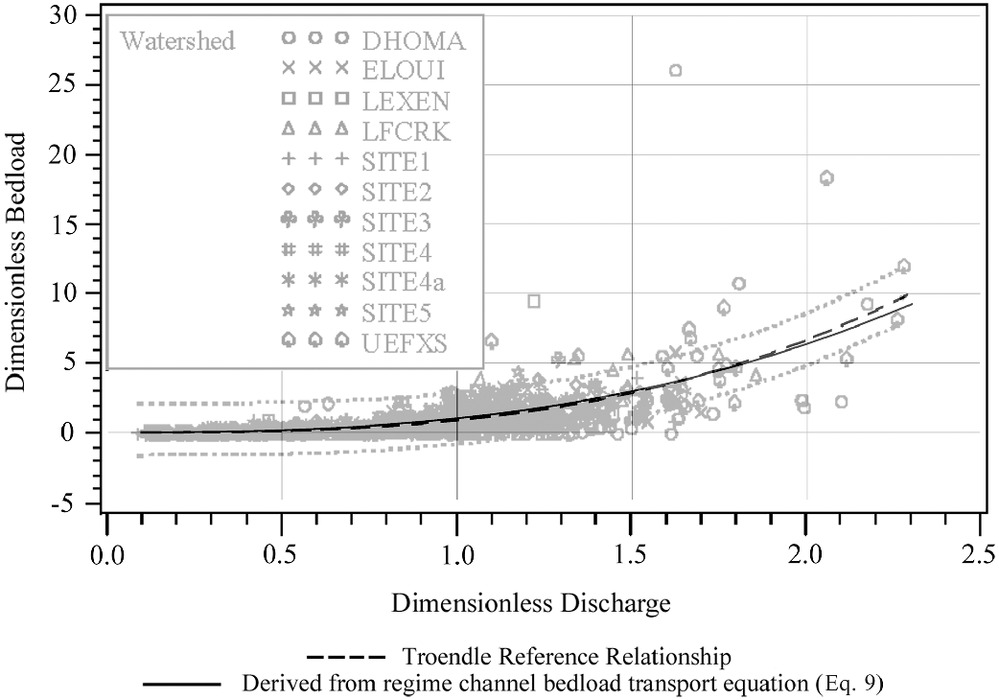
A reasonable representation of Troendle’s reference relationship line is easily derived from the regime channel bedload transport equation by substituting bank-full flow for streamflow in the simplified equation [Eq. (9)] to obtain an equation for bank-full bedload transport, then dividing the regime channel bedload transport equation by the bank-full bedload transport equation. Eq. (12) is the reference relationship derived from the regime channel bedload transport equationwhere = bank-full bedload transport (). Fig. 5 presents Troendle’s reference relationship line with Eq. (12) superimposed.
(12)
Bagnold’s work was for sand bed channels and therefore cannot be compared with the regime channel bedload transport equation.
Limitations
Use of the regime channel bedload transport equation is limited to regime and near-regime channels. The equation is not applicable for unstable channels or channels conveying a rapid transient bedload due to landslides, postfire surface ravel, or exceptional bank erosion. Where bedload transport estimates are desired for streams or rivers having overbank floodplains, only the flow within the confines of the active channel should be used for estimating the bedload transport rate.
The regime channel bedload transport equation provides estimates of average bedload transport on the reach scale, a length of channel comprising of two or more planform cycles, and over a period of time comprised of several to many years. Bed forms and unobservable variations in local hydraulic conditions can result in local bedload transport rates within a reach being an order of magnitude different from that predicted by the regime channel bedload transport equation at any point in time.
Application
In addition to providing an estimate of bedload transport at any given flow, by integrating the regime channel bedload transport equation with flow-duration curves, the equation may be used to estimate effective flow of a stream or river, total annual bedload, and average annual bedload. The regime channel bedload transport equation may be used to assess channel stability by comparing measured bedload transport rates with computed regime channel bedload transport rates. If multiple measurements consistently fall approximately one order of magnitude above or below the computed regime channel bedload transport rate, the channel is likely unstable or is undergoing geologic change.
Conclusions
This study has identified an equation capable of estimating regime channel bedload transport rates over a very broad range of stream and river channels with greater precision than estimated by Troendle’s relative relationship or by equations evaluated by Hinton et al. (2018) for a similar application. Unlike other equations, calibration and bed material characteristics are not required. The equation establishes that although instantaneous bedload transport is governed by physical processes at the boundary, regime channel bedload transport is related to stream power and not directly related to the availability of sediment or the character of bed material. Of note is the fact that at bank-full flow, bedload power represents only of a percent of water power, and this level of bedload power is responsible for establishing the geometry of the channel.
Notation
The following symbols are used in this paper:
- expression representing normalized stream coefficients in the regime channel bedload transport equation;
- dimensional multiplicative factor of constant value and referred to as the coefficient of stream equations;
- dimensional multiplicative factor of constant value and referred to as the coefficient of normalized stream equations;
- exponent of stream equations and normalized stream equations;
- bank-full depth (m);
- diameter of 15th percentile bed surface particle (mm);
- diameter of 50th percentile bed surface particle (mm);
- diameter of 85th percentile bed surface particle (mm);
- gravitational acceleration ();
- unit bedload power over a 1-m length of channel (W/m);
- unit water power at bank-full flow (W/m);
- unit water power over a 1-m length of channel (W/m);
- flow ();
- bank-full flow ();
- maximum measured water flow in a data set ();
- bedload transport ();
- bedload transport at bank-full flow ();
- bedload transport (), computed;
- bedload transport (), measured;
- 1.5-year flood flow () used as surrogate for ;
- 2-year flood flow ();
- coefficient of determination;
- slope;
- bank-full velocity (), computed as ;
- bank-full width (m); and
- density of water ().
Data Availability Statement
All data and spreadsheets that support the findings of this study are available from the corresponding author upon reasonable request:
•
Excel spreadsheets.
Acknowledgments
This analysis would not have been possible without the countless hours of effort by prior researchers involved in field measurements, analysis, database preparation, and publishing papers. The author would like to thank these prior researchers for their efforts and the reviewers for their insightful comments.
References
Ashworth, P. J., and R. I. Ferguson. 1989. “Size-selective entrainment of bed load in gravel bed streams.” Water Resour. Res. 25 (4): 627–634. https://doi.org/10.1029/WR025i004p00627.
Bagnold, R. A. 1966. An approach to the sediment transport problem from general physics. Washington, DC: US Government Printing Office.
Barry, J. J., J. M. Buffington, and J. G. King. 2004. “A general power equation for predicting bed load transport rates in gravel bed rivers.” Water Resour. Res. 40 (10): 118017. https://doi.org/10.1029/2004WR003190.
Garcia, M. H. 2007. Sedimentation engineering, processes, measurements, modeling, and practice. Reston, VA: ASCE. https://doi.org/10.1061/9780784408148.
Gomez, B., and M. Church. 1989. “An assessment of bedload sediment transport formulae for gravel bed rivers.” Water Resour. Res. 25 (6): 1161–1186. https://doi.org/10.1029/WR025i006p01161.
Gray, J. R., and F. J. M. Simões. 2007. “Sedimentation engineering, Appendix D, ‘estimating sediment discharge’.” In ASCE manual 110, edited by M. H. Garcia, 1067–1088. Reston, VA: ASCE.
Hinton, D., R. Hotchkiss, and D. P. Ames. 2017. “Comprehensive and quality controlled bedload transport database.” J. Hydraul. Eng. 143 (2): 06016024. https://doi.org/10.1061/(ASCE)HY.1943-7900.0001221.
Hinton, D., R. Hotchkiss, and D. P. Cope. 2018. “Comparison of calibrated empirical and semi-empirical methods for bedload transport rate prediction in gravel bed streams.” J. Hydraul. Eng. 144 (7): 04018038. https://doi.org/10.1061/(ASCE)HY.1943-7900.0001474.
Troendle, C. A., D. L. Rosgen, S. E. Ryan, L. S. Porth, and J. M. Nankervis. 2001. “Developing a ‘reference’ sediment transport relationship.” In Proc., 7th Federal Interagency Sedimentation Conf. Reno, NV: Subcommittee on Sedimentation.
Van der Scheer, P., A. Blom, and J. S. Ribberrink. 2001. Transport formulas for graded sediment. Behavior of transport formulas and verification with experimental data. Enschede, Netherlands: Univ. of Twente.
Wong, M., and G. Parker. 2006. “Reanalysis and correction of bedload relation of Meyer-Peter and Mueller using their own database.” J. Hydraul. Eng. 132 (11): 1159–1168. https://doi.org/10.1061/(ASCE)0733-9429(2006)132:11(1159).
Information & Authors
Information
Published In

Journal of Hydraulic Engineering
Volume 149 • Issue 3 • March 2023
Copyright
This work is made available under the terms of the Creative Commons Attribution 4.0 International license, https://creativecommons.org/licenses/by/4.0/.
History
Received: Jul 12, 2021
Accepted: Sep 12, 2022
Published online: Dec 29, 2022
Published in print: Mar 1, 2023
Discussion open until: May 29, 2023
Authors
Metrics & Citations
Metrics
Citations
Download citation
If you have the appropriate software installed, you can download article citation data to the citation manager of your choice. Simply select your manager software from the list below and click Download.