Geotechnical Properties from Portable Free Fall Penetrometer Measurements in Coastal Environments
Publication: Journal of Geotechnical and Geoenvironmental Engineering
Volume 149, Issue 12
Abstract
Coastal environments are characterized by a variety of sediment deposits with highly diverse geotechnical properties. Particularly in energetic coastal environments, sediment type and properties may vary on small spatiotemporal scales, limited previous information may be available, and sediment coring may be difficult. This study proposes a single data analysis framework to estimate geotechnical strength parameters in the uppermost layers of the seabed surface for a wide variety of sediment types from portable free fall penetrometer (PFFP) measurements without need for previous or complementary data. The framework builds on existing approaches and modifies and integrates them toward one universal analysis procedure. Target results are to distinguish sediment type, estimate relative density and critical friction angle for coarse-grained sediments, and undrained shear strength for fine-grained sediments. Data sets and sediment samples collected from seven different sites across the US served the validation and assessment of the framework. It was found that for the PFFP used a penetration depth less than 20 cm indicated coarse-grained sediments with a certainty of 96%, whereas a penetration depth greater than 25 cm was associated with fine-grained sediments with a certainty of 100%. Friction angles yielded a favorable match with laboratory triaxial and direct shear testing for the sand within and undrained shear strength values resulted in mismatches of minivane shear results for most fine-grained sediments using cone factor of 10 for two groups of sediment strength-depth profiles. Higher mismatches observed for the third type of distinct profiles (up to 48%) suggested lower cone factors, likely related to a change in sediment properties.
Practical Applications
This paper proposes a single framework that builds on and evaluates existing approaches to estimate geotechnical sediment properties in coastal environments using a portable free fall penetrometer. The framework identifies different soil types (coarse-grained versus fine-grained) and proceeds with data analysis toward strength parameters. Relative density and friction angle are estimated for coarse-grained sediments, and undrained shear strength is estimated for fine-grained sediments. Results of the framework were validated and assessed with laboratory testing based on a data set collected from over seven different sites across the US. The good agreement between field and lab results supports the feasibility for one data analysis framework for the use of portable free fall penetrometers for a rapid and preliminary seabed surface characterization, especially in areas with difficult access or under extreme conditions. This makes this method accessible to a broad group of users in the geotechnical and coastal engineering community.
Introduction
Coastal and estuarine environments can be characterized by a wide range of sediment deposits in response to local sediment dynamics, diverse mechanisms of sediment supply, and other processes. Many coastal environments are dominated by either coarse-grained or fine-grained deposits and are therefore classified as either non-cohesive or cohesive sites (Van Ledden et al. 2004). However, a considerable number of sites are characterized by mixed sediments, which could represent vertical layering of different sediment types, spatial variability, or mixed sediments, or combinations of all of those factors. The detailed characterization of coastal and estuarine sediments is important to identify and predict erosional and depositional processes, civil design, contribute to data collection for the conservation of ecosystems, scour problems, and many other engineering actions (Jain and Kothyari 2009; Grabowski et al. 2011). Data analysis frameworks and models developed for coarse- or fine-grained sediments require initial knowledge of sediment type, which can lead to uncertainties in the case of limited availability of previous data or areas of active sediment dynamics. Thus, there is a need for universal data analysis frameworks that can be applied to a wide range of seabed sediments and conditions, particularly to improve early site investigation and investigate coastal environments with complex sediment deposits (Winterwerp 1989).
Portable free fall penetrometers (PFFPs) have been identified as an effective and rapid tool to estimate uppermost seafloor surface strength properties, including undrained shear strength, friction angle, and cohesion, in dynamic subaquatic environments (Aubeny and Shi 2006; DeJong and Randolph 2012; Chow et al. 2014; Stark et al. 2012; Randolph 2016). White et al. (2018) proposed a framework to adjust the PFFP resistance to match that expected from cone penetration testing (CPT) in sands by paying special attention to drainage conditions in PFFP deployments. Aubeny and Shi (2006) and later Chow et al. (2014, 2017) evaluated approaches to estimate the undrained shear strength from penetrometer measurements in fine-grained sediments, and Chow et al. (2018) captured the rate dependency of sand using a simple harmonic backbone curve based on centrifuge piezocone tests. Albatal et al. (2020) established a correlation between PFFP decelerations and relative density and explored different approaches to estimate critical friction angles for coarse-grained sediments.
However, most of these frameworks require some degree of knowledge if the sediments are predominantly cohesive or noncohesive sediments, and their performance is questionable in the presence of mixed sediments. A number of these frameworks also require input parameters that can only be determined from colocated soil sampling or need to be estimated, with the latter potentially leading to the increase of uncertainty in the results, particularly in dynamic environments where such estimates may lead to significant bias.
The different data analysis methods listed in the previous paragraphs have found so far limited application and validation in actual field studies, and rarely, in dynamic coastal environments with significant sediment dynamics. This study aims to develop and assess a framework for PFFP data analysis that integrates concepts suggested in previous literature toward one universal data analysis procedure that does not need significant additional laboratory testing or prior knowledge of the site, accounts for the possibility of sediment mixtures, and leads to estimates of strength parameters such as friction angles and undrained shear strength. The data set used represents several field surveys collected over the last 4 years from seven different areas across the US with colocated sediment sampling for geotechnical laboratory testing. This paper focuses on three research questions:
•
What existing data analysis frameworks allow to estimate geotechnical sediment strength parameters from PFFP for coarse-grained and fine-grained sediments, and how do they perform in a highly dynamic coastal environment?
•
Can mixed sediments be detected and characterized from PFFP measurements?
•
Can a generalized data analysis framework for PFFP estimate sediment strength parameters with acceptable reliability and accuracy for wide range of surficial seabed sediments?
Finally, an outlook is provided for future applications particularly toward the geotechnical investigation of sediment dynamics.
Data Collection
The data sets cover different types of estuarine and coastal sediments ranging from coarse-grained over mixed sediments to fine-grained, as well as different environmental conditions. A map is provided in the Supplemental Materials (Fig. S1 ). The surveying techniques and strategies varied at the different sites depending on the specific surveying goals; however, all of them included PFFP measurements and physical sediment samples.
PFFP and Initial Data Processing
The PFFP Bluedrop (BlueC Designs-Halifax, Nova Scotia, Canada) ( in weight, in length, and cm diameter) used in this study measures decelerations at a rate of 2 kHz using five accelerometers ranging from to (with being the gravitational acceleration). The probe was chosen because it has been applied for early and rapid seabed site characterization for a variety of soil types (e.g., Albatal and Stark 2017). Although other free fall penetrometers may be advantageous for specific soil and site conditions, this device can accommodate a wide range of conditions, including energetic hydrodynamics and active sediment dynamics. It free falls through the water column, and then impacts and penetrates the sediment bed until resistance forces stop it. Important for the investigation of subaquatic sites of active sediment dynamics, PFFP collect data at a vertical resolution of mostly better than 1 cm in the upper 10–100 cm of the seabed surface and can be deployed under energetic hydrodynamics and active sediment dynamics (Stark et al. 2012; Albatal et al. 2020).
The measured deceleration is used to deduce velocity and penetration depth through single or double integration with respect to time. The force opposing the penetration of the PFFP is then calculated based on Newton’s second law and divided by the surface area subjected to load to represent the maximum load before failure of any penetrated soil layer (here from now on referred to as ultimate bearing capacity, ). The area used in the analysis for the top of the PFFP (which corresponds to the cone tip) reflects the increase in load area with insertion of the cone, and the area is kept constant for penetration depths beyond the cone length.
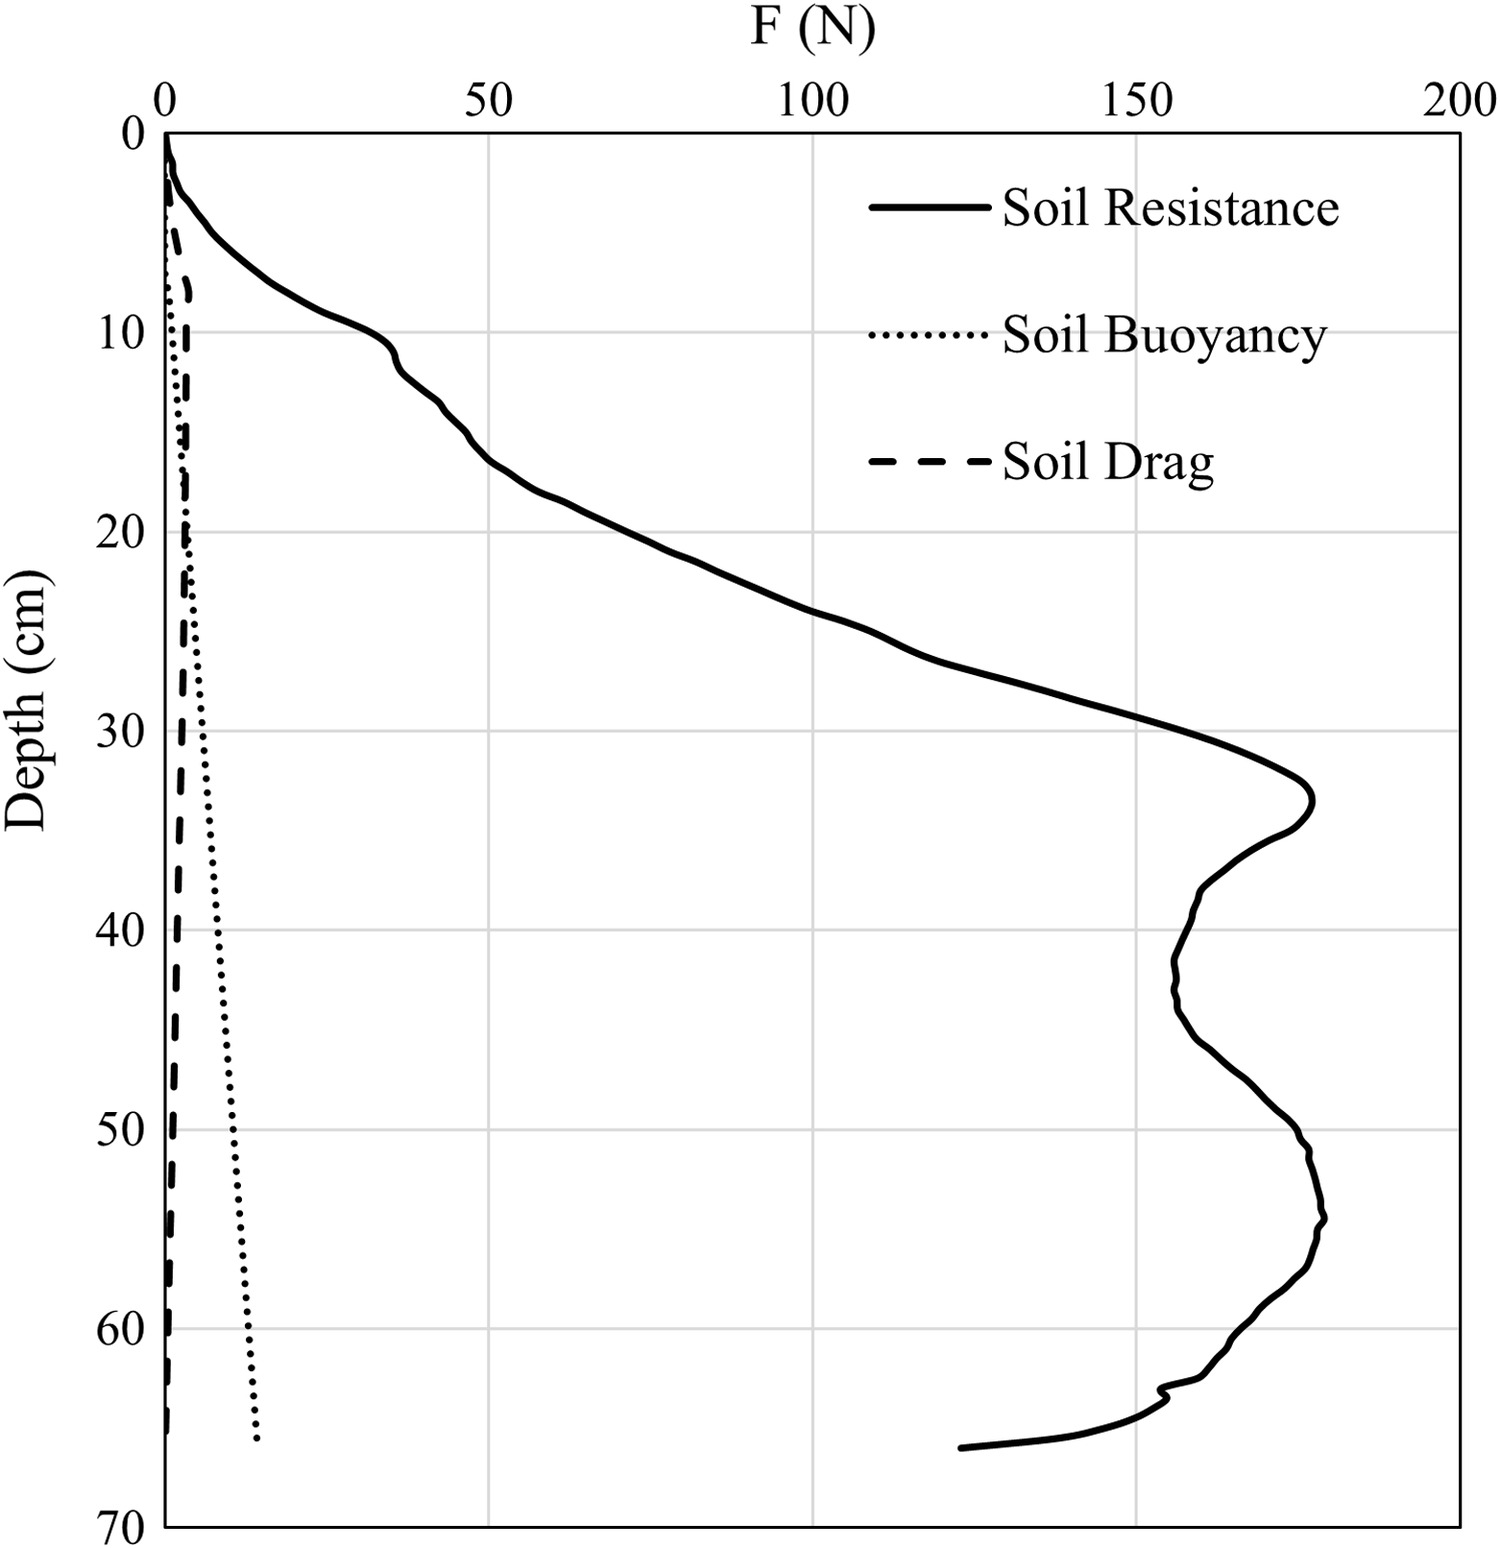
Resisting forces include sediment tip resistance in addition to drag and buoyancy (Aubeny and Shi 2006; Stark and Kopf 2011). The contribution of buoyancy and drag to the total resisting force have been addressed in the literature (Aubeny and Shi 2006; Chow et al. 2017; Mumtaz et al. 2018; Bilici et al. 2019). Soil drag and soil buoyancy were found to make negligible contributions to the resisting forces during seabed penetration and after consideration of drag and buoyancy in the water column for this specific PFFP, due to the limited penetration depth and the penetrometer shape (Stark et al. 2017; Stark and Ziotopoulou 2017; Bilici et al. 2019). This observation was revisited in this study, and aforementioned results were confirmed for penetration depths of interest in this study.
An example is shown in Fig. 1, showing a representative deployment from Delaware Bay. The contribution from soil drag was . The contribution from soil buoyancy increased with depth until full embedment; however, its maximum contribution was at a depth of . Impacts in sand would be even smaller (Bilici et al. 2019). Based on these results, it was decided to neglect soil drag and buoyancy in the data analysis further in the interest of avoiding the need to estimate or measure unit weight from soil samples, representing a key goal of the presented framework for rapid site investigation. For a more detailed analysis, it is recommended to include this simple calculation following, e.g., Bilici et al. (2019).
The subsequent processing steps investigated here are described in the “Data Analysis Framework: Estimating Geotechnical Sediment Properties” section. In the interest of developing a simplified framework that requires limited to no prior knowledge of soil properties or additional testing, the presented results ignore effects of cone diameter for the strain rate correction and test the sensitivity of using previously suggested empirical soil parameters over backfitting soil-dependent parameters from testing of soil samples.
Sediment Sampling and Laboratory Testing
A 7 kg ponar grab sampler or similar device was used at most sites to collect disturbed samples for grain size analysis and Atterberg limits tests per ASTM D6913 (ASTM 2009) and ASTM D4318 (ASTM 2018), respectively. Furthermore, core samples were retrieved using gravity coring for miniature lab vane shear testing and one-dimensional consolidation testing per ASTM D4648 (ASTM 2016) and ASTM D2435 (ASTM 2011) for fine-grained material. Core samples were obtained using vibrocoring for some of the sandy locations for subsequent vacuum triaxial tests for coarse-grained material in addition to direct shear testing per ASTM D3080 (ASTM 2012). More details on the setup and testing of the former have been described by Albatal et al. (2020).
Data Analysis Framework: Estimating Geotechnical Sediment Properties
Two frameworks were tested and validated: one for coarse-grained sediments and one for fine-grained sediments. They were then merged by an initial sediment classification approach similar to methods suggested by Akal and Stoll (1995) or Stark and Wever (2009). The sensitivity to parameters requiring additional knowledge of the soil was tested. The purpose is to offer a streamlined approach for rapid sediment classification for rapid site characterization, including when limited to no prior knowledge and additional soil testing is available. This way, sediment types were classified first into three main groups, namely, sand, clay, and mixed, based on penetration depth and fines content. Then, existing approaches were applied based on the initial sediment classification to estimate geotechnical sediment properties. The results were validated against geotechnical sediment properties derived from testing of the sediment samples. A flowchart is presented subsequently summarizing the resulting recommended procedure.
Sand Framework
The framework applied for coarse-grained materials represents a combination of the approaches developed by White et al. (2018) and Albatal et al. (2020). The approach proposed by White et al. (2018) estimates the net dynamic bearing resistance of the PFFP (kPa) using the drained bearing resistance, (kPa) and undrained bearing resistance, (kPa), contributions to the total resistance. In addition, the impact and penetration velocity of the PFFP is considered because it governs the drainage conditions using the backbone curve equation [Eq. (1)]. The terms of Eq. (1) are calculated based on a series of equations presented by White et al. (2018); some of these equations [Eqs. (1)–(7)] will be demonstrated herein to highlight the main parameters involved
(1)
The effect of the penetration velocity is incorporated through the dimensionless velocity [Eq. (2)], where is the dimensionless velocity corresponding to 50% consolidation. There is no agreement on a best-fit value for , and published data suggest a spread between 0.3 and 8 (DeJong and Randolph 2012). However, based on the most common value suggested in literature from piezocone testing following Randolph and Hope (2004), DeJong and Randolph (2012), and Giusti (2019), a value of 1 is taken here. The dimensionless velocity can be defined as follows:where penetration velocity (m/s); = penetrometer diameter (m); and = coefficient of consolidation .
(2)
The contribution of depends primarily on the relative density of the sand, , and the mean effective stress, (kPa), and a set of dimensionless coefficients , , and , where , , and [Eq. (3)] following Jamiolkowski et al. (2003)
(3)
The relative density is estimated based on a crushing strength parameter, [usually taken as 10 (White et al. 2018)], with a relative dilatancy, , equal to zero at undrained failure conditions [Eq. (4)]; represents the effective stress level, taken as to represent mean stress at failure and calculated as shown in Eq. (5)
(4)
(5)
The contribution of is calculated using the undrained shear strength (kPa) and a cone factor taken as 12 (Mayne and Peuchen 2018; White et al. 2018) [Eq. (6)]. The undrained shear strength is estimated from the critical state friction angle ranging between 31° and 33° (Randolph 2004; Rousé 2018) and mean stress at failure (kPa) [Eq. (7)]
(6)
(7)
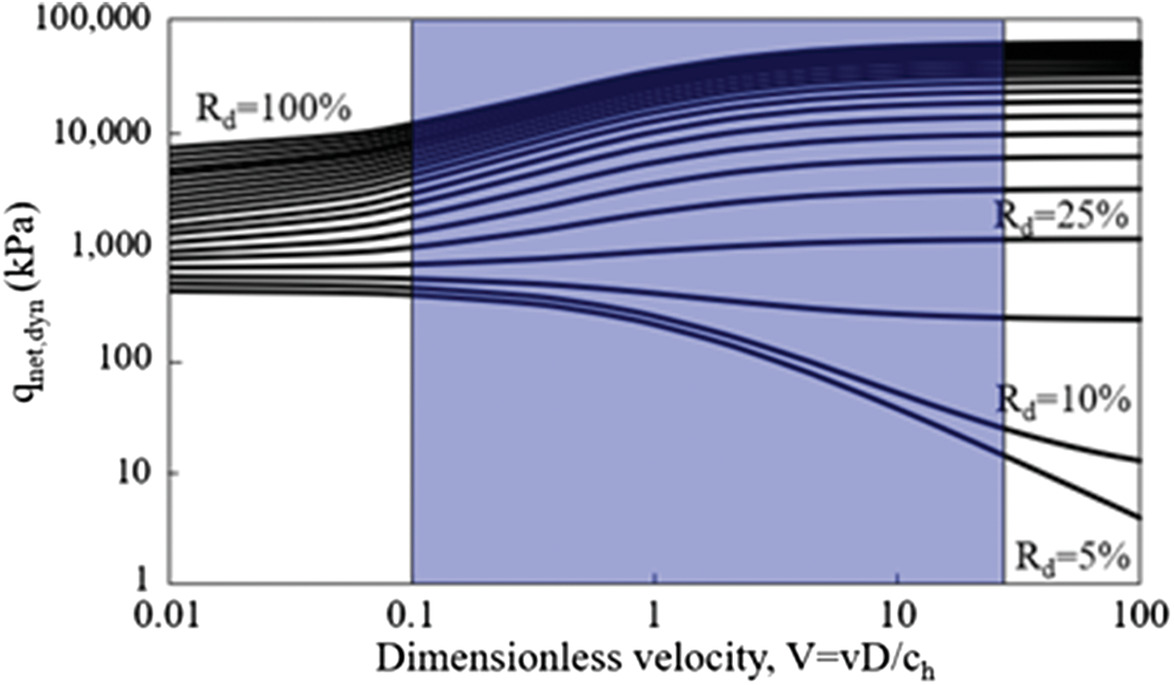
Based on these equations, a set of backbone curves is shown in Fig. 2, demonstrating the variation of as a function of the dimensionless velocity for soils with ranging from 5% to 100%. It has been reported that drained conditions exist for , whereas undrained conditions exist for , and a transitional zone (blue area) exits in between for partial drainage (Colreavy et al. 2016). Chow et al. (2018), however, observed a drained behavior from to 1 and reported a transition between drained to partially drained behavior at . The shape and behavior of the profiles is unique for every and . For loose sediments [ (Meyerhoff 1956)], tends to decrease as conditions change from partially to fully undrained, whereas the opposite is true for dense sediments [ (Meyerhoff 1956)]. This agrees with the expected soil behavior of sediments, where effective stresses increase in loose sediments under drained conditions due to the dissipation of pore pressure yielding an increase in the total soil resistance, whereas dense sediments tend to dilate and increase in strength under undrained conditions.
By varying the set of parameters used to construct the backbone curves, it appears that three main parameters have a significant effect on the results: , , and . To test the sensitivity to each of these parameters, was estimated along the sediment depth based on White et al. (2018), varying one of the three parameters at a time (Fig. S2 ). The values used were based on typical ranges assumed for these parameters, as will be described subsequently. The need for such assumptions is expected given the challenges and high level of uncertainties associated with estimating soil properties such as consolidation coefficient (Rowe 1972; Huang et al. 2010).
Albatal et al. (2020) calculated the friction angle of sandy sediments based on different methods. One method, the density method developed by Duncan et al. (2014), represents a correlation to estimate the friction angle using of the soil and the confining stress [Eq. (8)]where = effective normal stress (kPa); = atmospheric pressure (kPa); and , , , and = constants reported by Duncan et al. (2014) as 34, 10, 3, and 2, respectively, for poorly graded sand. Albatal et al. (2020) modified these parameters as 34, 10, 2, and 5, respectively, to better fit with the site location investigated (i.e., a sandy nearshore environment), resulting in a correlation coefficient with the measured friction angles. Duncan et al. (2014)’s parameters will be adopted here, considering a larger breadth of environmental conditions.
(8)
Here, we propose to merge the approaches by White et al. (2018) and Albatal et al. (2020) by using the former to estimate the relative density and the latter to derive an estimate of the friction angle from the relative density. Consequently, the sand framework adopted here can be summarized as follows:
1.
Using PFFP deployment analysis, is calculated at each site along the penetration depth of the penetrometer as described in the PFFP section.
2.
3.
For a set of ranges for and is back-calculated using the White et al. (2018) approach along the sediment depth.
4.
Using the approach of Albatal et al. (2020), the friction angle of sandy sediments can then be estimated based on from Step 3.
Clay Framework
The clay framework estimates the undrained shear strength (kPa) [Eq. (9)] using the PFFP derived quasi-static bearing capacity, qsbc (kPa), aided by an appropriate choice of a cone factor (Lunne et al. 1997; Aubeny and Shi 2006; Stark and Ziotopoulou 2017) as follows:where qsbc is based on the measured by the PFFP and corrected by a strain rate factor to account for the high penetration speed of the penetrometer
(9)
(10)
The strain rate factor can be estimated based on different strain rate correction methods. Two of the most widely used methods are the logarithmic and power-law expressions shown in Eqs. (11) and (12), respectivelywhere = soil-dependent strain rate multiplier factor; = penetration velocity of the PFFP; and = reference velocity, taken as adopted from CPTwhere = soil-dependent strain rate parameter. The penetrometer diameter was not considered in these strain rate factor expressions in the interest of simplicity and because the penetrometer tested here is close to common cone penetrometer diameters.
(11)
(12)
Typical values of and vary based on soil type. Both corrections methods were studied here, and will be tested between 0.1 and 0.15 and between 0.035 and 0.085 (Chow et al. 2017; Steiner et al. 2014; Young et al. 2011; Randolph and Hope 2004). Cone factors depend on soil type and other factors such as the penetrometer testing method. Although they have been extensively studied for CPT (Lunne et al. 1997; Robertson and Cabal 2015; Mayne and Peuchen 2018), cone factors have still been found to be inconsistent, particularly in very soft soil, and few studies have been carried out to calibrate cone factors for PFFPs. Values reported in the CPT literature for fine-grained soils ranged between 4 and 20 (Lunne et al. 1997; Kim et al. 2006) with an average of 15 (Robertson and Cabal 2015), and in soft/sensitive/normally consolidated soils, an average value of 10 or less has been used (Lunne et al. 1997; Kim et al. 2006). Typical values reported for PFFP ranged between 10 and15 (Stegmann 2007; Chow et al. 2014; Steiner et al. 2014; Stark and Ziotopoulou 2017). Mayne and Peuchen (2018) found that values ranged between 8 and 25 for clays of different types (ranging from sensitive to over consolidated fissured clays), based on a database of 62 clays.
In this study, a cone factor of 12.3 and 10 for offshore normally consolidated clays and sensitive clays, respectively, will be applied based on the values suggested for CPT by Mayne and Peuchen (2018). The applicability of these values without site-specific backfitting from laboratory testing was explored by comparison with miniature laboratory vane shear testing. Site-specific backfitting of cone factors is expected to improve results, but also requires testing of quality samples, which may not be available due to site conditions or during early site investigation. The results of estimated profiles will be compared with measured values at different depths using vane shear tests. Here, was corrected based on Bjerrum (1972), which accounts for strain rate and anisotropy effects, multiplying by a specific factor depending on the plasticity index. Based on this comparison, the choice of strain rate correction method will be assessed, and best-fit strain rate parameters and cone factors will be validated.
A single value recommendation may not fully capable to capture the variation in soil behavior encountered. Therefore, the deceleration profiles were also grouped into distinct categories based on deceleration profile shape, and the performance of cone factor and strain rate correction are assessed for each sediment group, representing a PFFP result based on fitting of cone factors as a compromise between applying a standard parameter and backfitting from lab testing.
The process of the clay framework adopted here is briefly summarized in the following steps:
1.
Sediment groups are classified based on deceleration-depth profiles.
2.
depth profiles are calculated from PFFP deployments.
3.
versus depth profiles are calculated based on first estimates of strain rate and cone factors.
4.
Using the measured from vane shear tests, best-fit , β, and are determined for each group.
5.
Based on deceleration profiles solely, of fine-grained soils can then be estimated for any site based on PFFP measurements and sediment group.
Results
Sensitivity Analysis of , , and in White et al. (2018)’s Sand Framework
A sandy site from Delaware Bay (DB-7, with a median grain size of 0.225 mm) was used to demonstrate how the parameters , , and affect the results of White et al. (2018)’s approach (Fig. S2 ). The impact of and became more evident at deeper depths (below 10 cm), where the measured increased and the sediment appeared stronger. For instance, a change of only 10% in at 16-cm sediment depth can cause a change of more than 100 kPa in the estimated . The results also showed a significant impact of . In fact, overestimates significantly. Even a change between of 9 and 10 can cause more than twofold increase. The different profiles based on the range of used provided reasonable results generally, with the maximum ranging between 50 and 150 kPa corresponding to the lowest and highest , respectively.
Classification of Sediment Type
A criterion to classify the sediment type needs to be established if no reliable information is previously available. Therefore, sediment types were classified into two categories based primarily on the maximum penetration depths (PD) recorded by the PFFP. PD is determined from the second integration of the profiles measured by the PFFP. The classification results are based on 55 sites surveyed over seven different locations across the US (Fig. S1 and Table S1 ). Two groups of PD stood out regarding their relation to content of fines: and (Fig. 3). Almost all deployments (96%) penetrating less than 20 cm corresponded to sandy sediments with less than 20% fines, whereas all deployments (100%) penetrating deeper than 25 cm corresponded to sediments with more than 20% fines (Fig. 3).
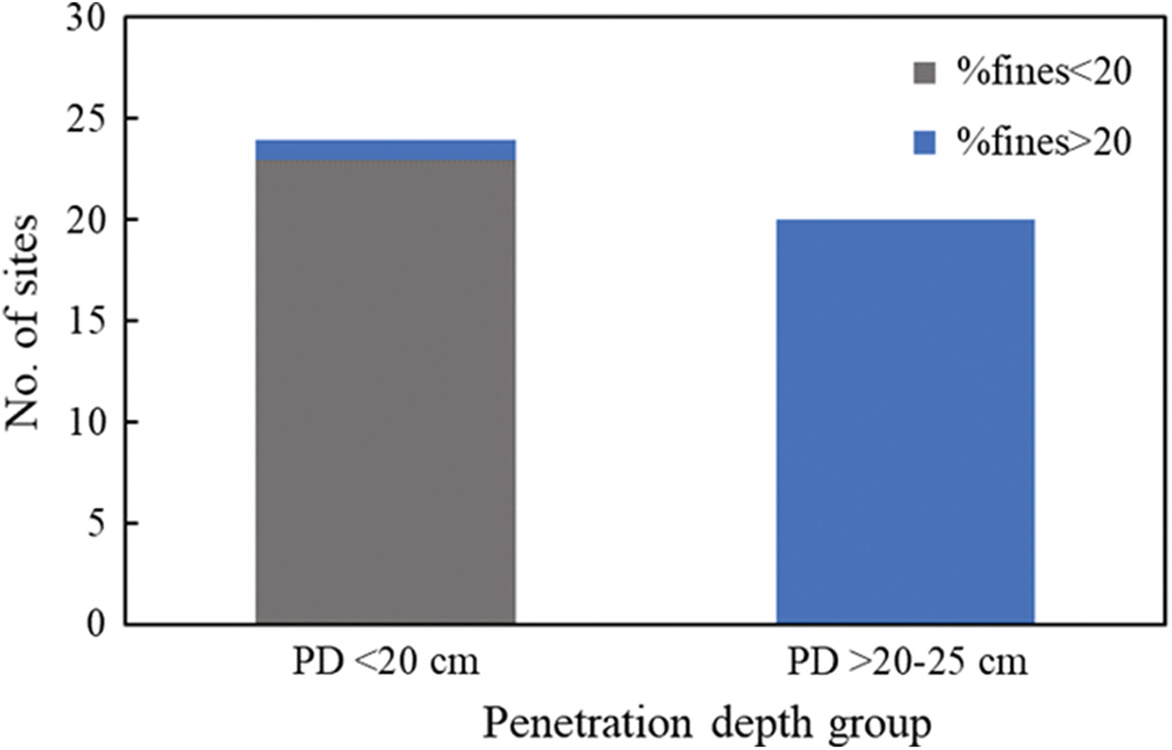
Sediments that fell in the range of 20–25-cm penetration depth could suggest a mixed sediment type, specifically given that 90% of these deployments had more than 20% fines. The 20% fines cutoff agrees with literature findings on the transitional fines content relevant for cohesive versus non-cohesive behavior reported for different soil mixtures. Yang et al. (2006) calculated the fines content for transitional zone to be between 19% and 36%. Following this observation, it is suggested to treat deployments with as sand, and treat deployments with as clay for the purpose of further data processing. These specific thresholds should be considered instrument-specific, but it is expected that similar thresholds can be developed for other PFFP.
Sands (PD < 20 cm and Fines Content < 20%)
Sediments with less than 20% fines and less than 20-cm penetration depth were then further processed using the sand framework. For example, YR-1 in the York River was characterized by of sand content. For sandy soils, was suggested to range between and (White et al. 2018). Although is typically taken as 10 (Randolph 2004, White et al. 2018), other literature reported lower values of (as low as six) specifically under low mean effective stresses, as is the case for shallow sediment depth (Salgado et al. 2000; Chakraborty and Salgado 2010). This issue also became apparent from the sensitivity study results shown in Fig. S2 . Therefore, a range of was tested.
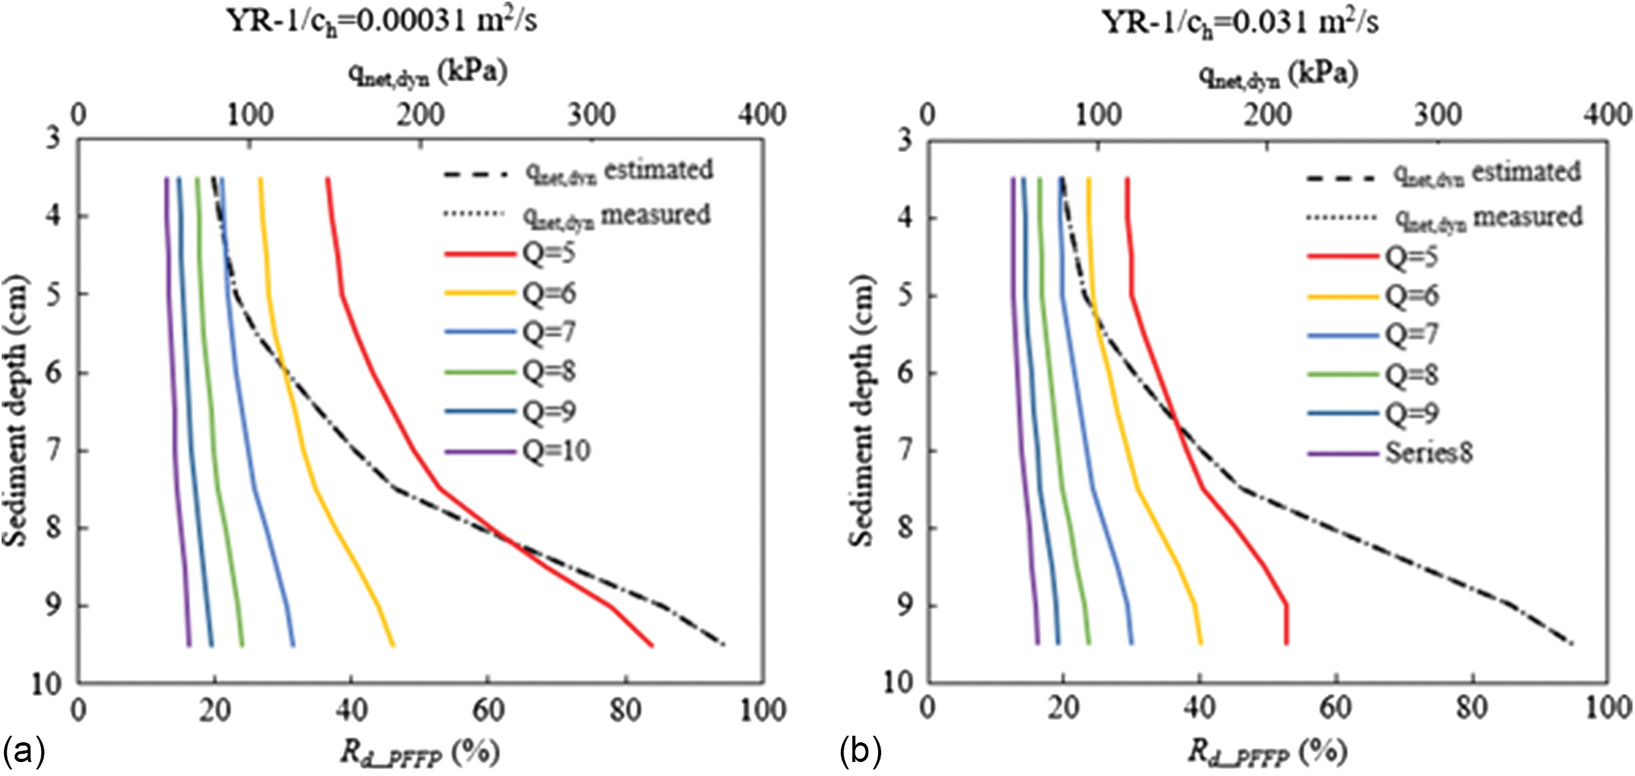
Fig. S3 shows calculated from the PFFP, hereafter referred to as (colored solid lines) for the range of and values given previously (with only minimum and maximum shown) to achieve a perfect match between the estimated and measured (black dashed and dotted lines, respectively). For all combinations of and , increased with depth. As increased, decreased significantly at low values, up to at maximum . This decrease seems much less significant at high values (), with a maximum decrease of .
The average maximum values for several deployments with different combinations were then compared with the from sample testing () based on the water content () and and values (Fig. 4). The uncertainty level determined by Haldar and Tang (1979) for direct measurements of from CPTs or SPTs was reported as a coefficient of variation of 0.36. This yielded a standard deviation of 13.3%, described with the gray shaded region around the (Fig. 5). It can be noted from Figs. 6 and 7 that the values associated with seem too high at shallow sediment depths of ; the results of will therefore be excluded from further calculations. Different combinations yielded a match with , considering expected uncertainties mentioned previously.
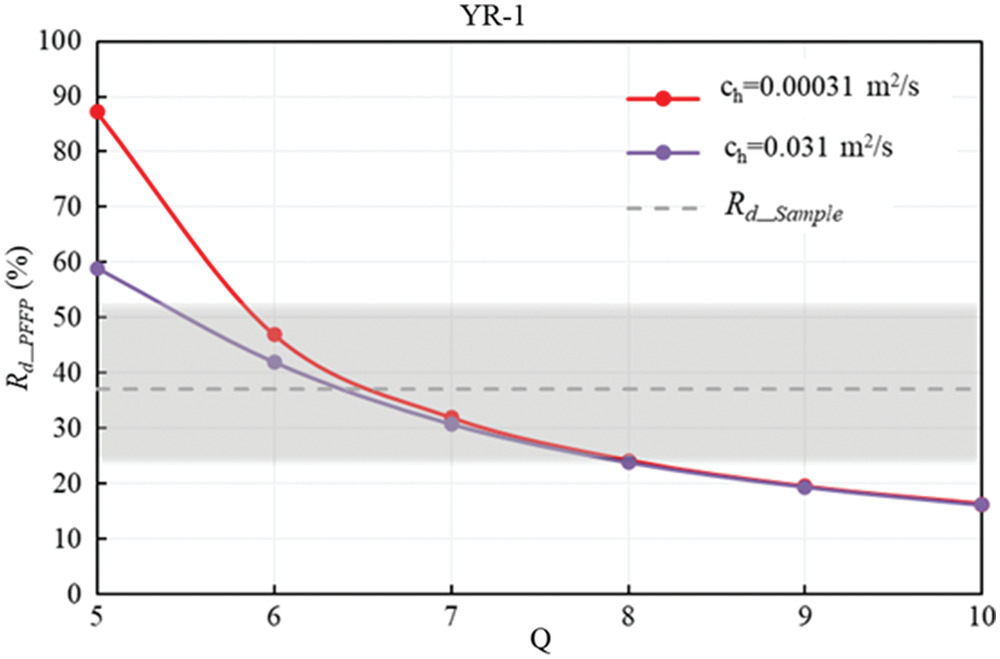
Despite utmost care during sample extraction and recovery, the loss of some small amount of water cannot be excluded. This means realistically, water contents are possibly slightly higher than reported, and thus, is expected to be at or under the lower boundary, which suggests that at (as suggested by White et al. 2018) would yield an acceptable match. Also, as increased, the effect of seemed to decrease, and at (Fig. 4), effects of appeared negligible, and one value of can be reported. Therefore, for (Fig. 4 purple line and Fig. 5) will be adopted for estimating the friction angle. Although this suggests very loose sands, this is feasible considering that the sediment depth is limited to 10 cm and the site represents an area of frequent sand remobilization and deposition. It follows that as suggested previously in the literature for marine predominantly quartz sands (White et al. 2018, Salgado et al. 2000) represents a good first estimate without the need for further determination of or testing of . However, the applicability to other mineralogies, e.g., carbonate sands, has not been tested here.
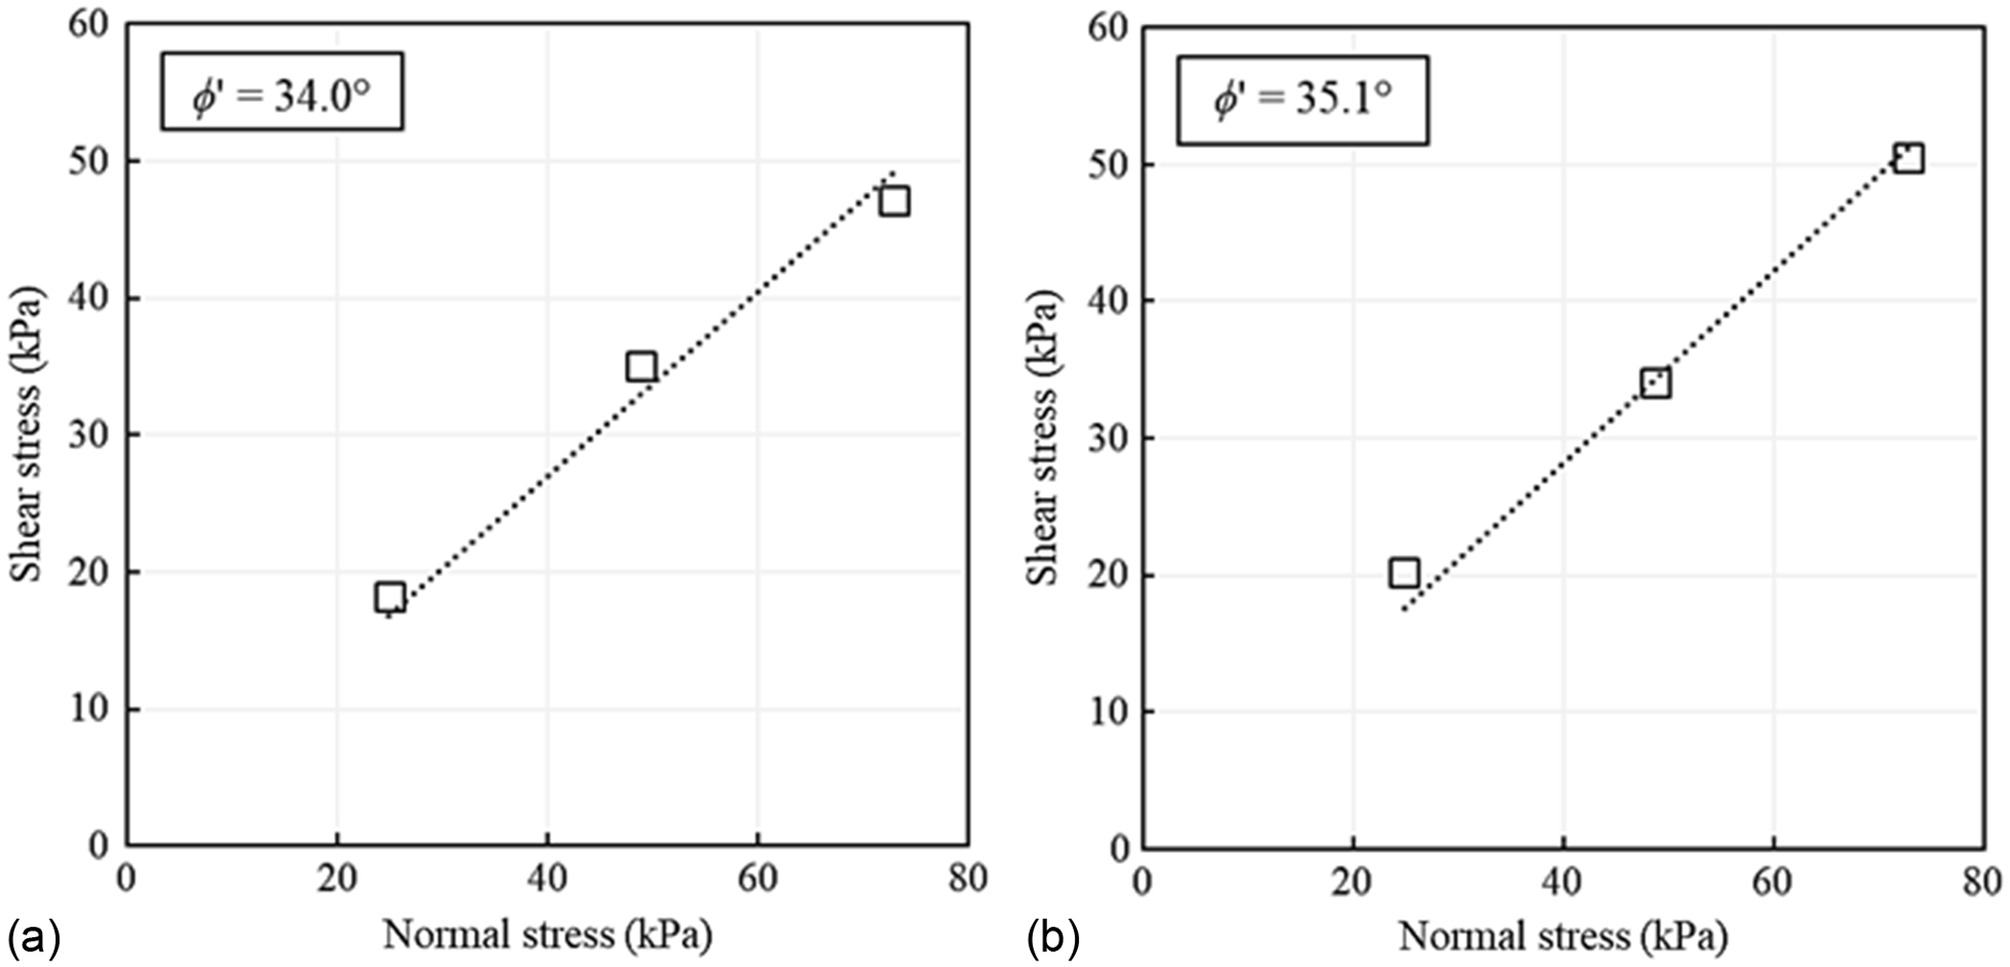
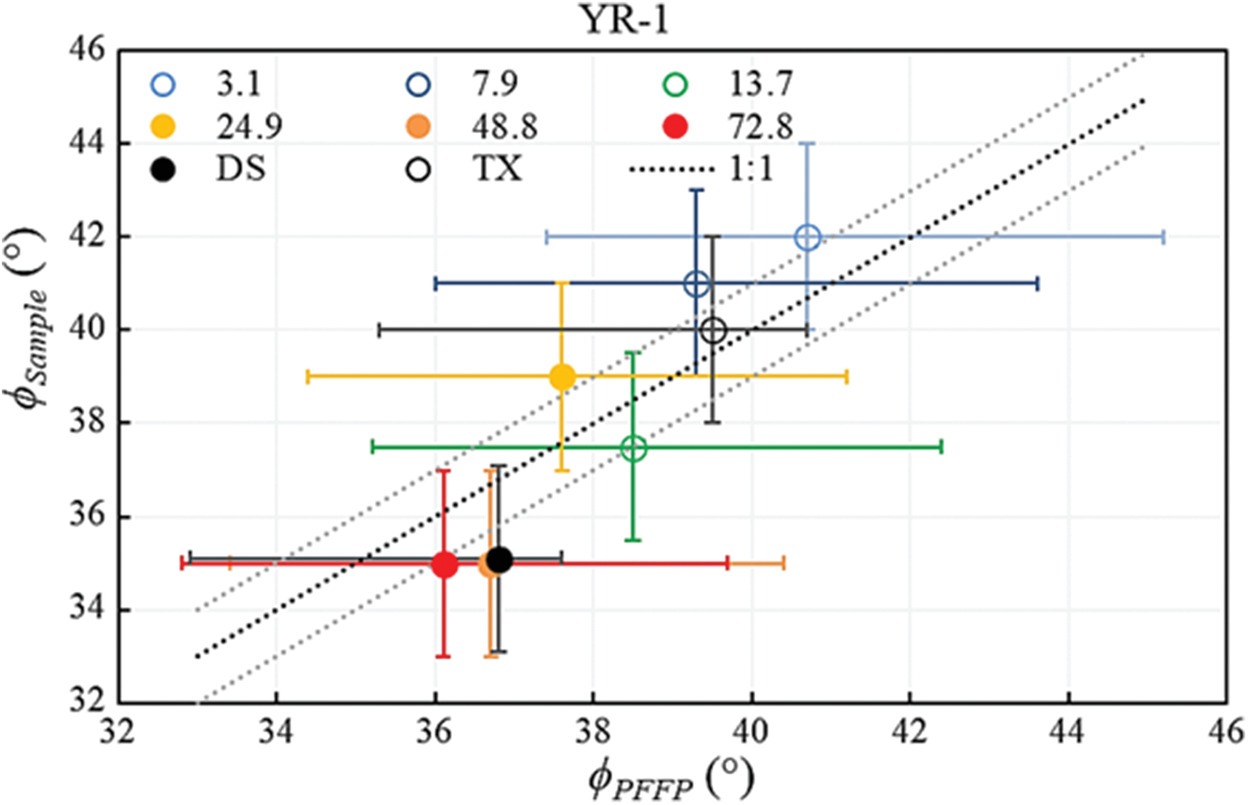
The friction angles were measured using vacuum triaxial tests on dry samples, which allowed testing at low stresses (3.1, 7.9, and 13.7 kPa) and using direct shear testing. However, the normal stresses used for the direct shear tests were higher (24.8, 48.8, and 72.8 kPa), limited by the capability of the direct shear instrument. To quantify the difference between shear strength of dry and saturated samples, direct shear tests were done on both samples. Using the Mohr’s-Coulomb failure criterion, the friction angle of the YR-1 saturated samples (34°) was smaller than that of dry samples (35.1°) by 1.1° (Fig. 6).
Because the effect of saturation was limited to , results of direct shear tests and vacuum triaxial tests on dry samples () were used to confirm the results estimated by PFFP () based on Duncan’s correlation [Eq. (9)] using for and Duncan’s constants (34, 10, 3, and 2) (Duncan et al. 2014). The results are shown in Fig. 7, where the colored circles represent the secant friction angle for each normal stress of the vacuum triaxial (circles) and the direct shear (dots) and the black circles represent the secant friction angle for the three stresses. The vertical error bars reflect the uncertainty associated with the laboratory testing, as a result of sample collection, handling, testing errors and others. This is expected to generate a margin of error of (Edil et al. 2007; Nguyen 2013). Similarly, the horizontal error bars reflect the uncertainty associated with estimating friction angle using for different values (6, 7, 8, and 9), which always resulted in higher friction angles, and thus, the error bar to the right ranging between 3.6° and 4.5°. However, such uncertainty is unlikely given that larger values of are expected. Duncan et al. (2014) also reported an 84% probability of overestimating the actual friction angle using their correlation by one standard deviation (3.2°). Therefore, an error bar of 3.2° was added to the left side.
The results of seem to fall closely within the results with the largest difference being 1.7° (without accounting for the uncertainties), well within the margin of uncertainty considered also for laboratory testing of field samples. Matching or close results are achievable if the probability of overestimating using Duncan’s correlation is considered (left error bars) regardless of the different combinations, and without the need to adjust Duncan’s constants as reported by Albatal et al. (2020), Duncan et al. (2014).
Clays (PD > 20 cm and Fines Content > 20%)
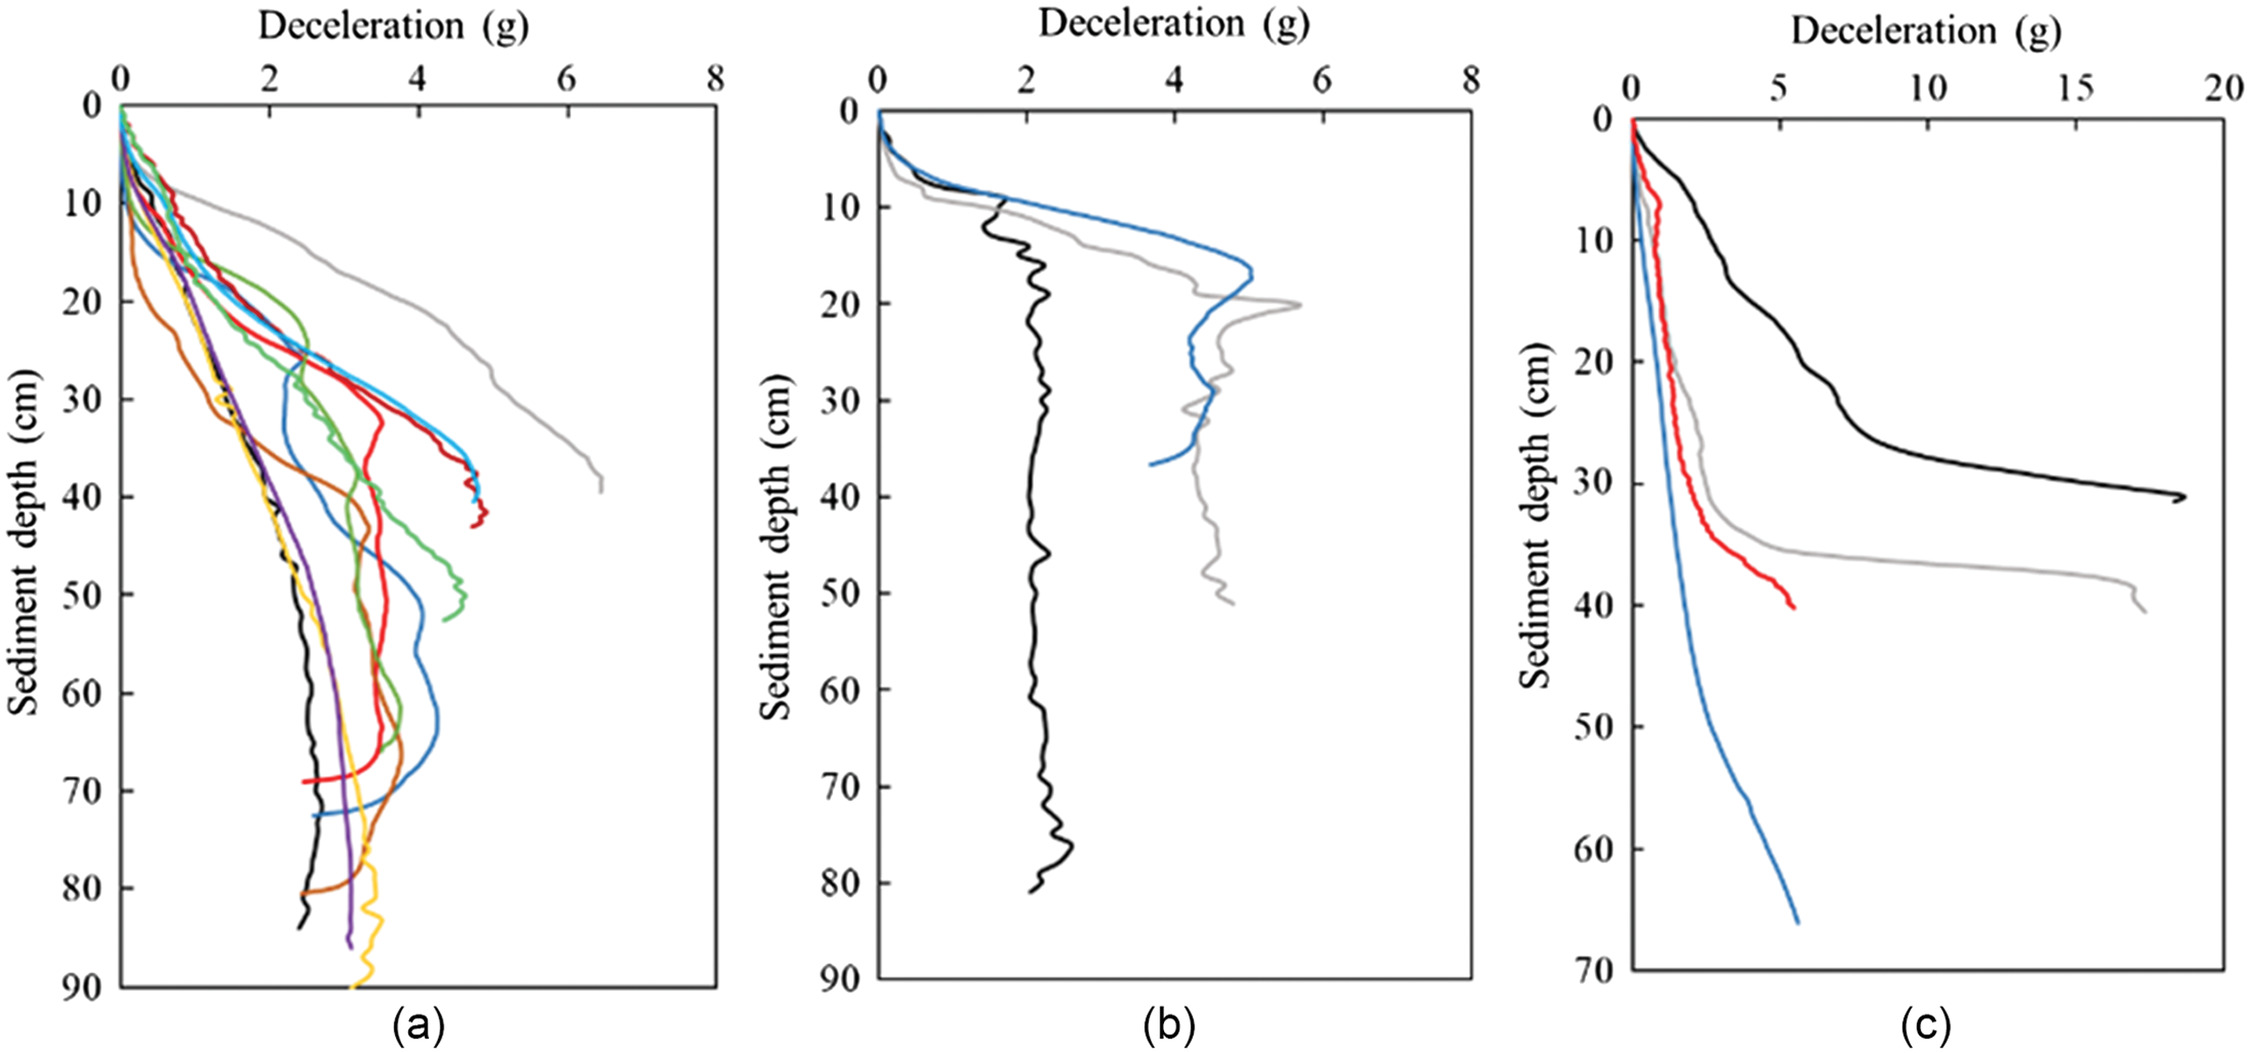
Sediments recording more than 20 cm of penetration depth contained more than 20% fines and were processed under the clay framework, but the specific PFFP recordings for such sediments can vary significantly. Fig. 8 shows representative deceleration profiles grouped and divided into three groups: Group 1 is characterized by an approximately linear increase in deceleration with depth, Group 2 is characterized by a similar increase up to 10–20 cm in depth, followed by an almost-constant deceleration as sediment depth increases, and Group 3 is characterized by an approximately linear increase in deceleration up to depth, followed by a steep increase in deceleration with sediment depth. Group 3 profiles suggest two different soil layers, where the top layer () matches Group 1 deceleration profiles, followed by a stiffer layer underneath. To understand the variations behind the different deceleration profiles, certain geotechnical properties of each group were measured and compared.
Grouping by deceleration profile has been explored as a possible pathway of estimating empirical soil-dependent factors such as the cone factor based on similarities in the PFFP deceleration record as a possible improvement over applying literature values and when backfitting from testing of quality soil samples is unavailable. Fig. 9 displays the variation in these properties within each group. Fines, and specifically clay (%) were highest among Group 1 sediments with an average of and , respectively; plasticity index (PI) was close between the three groups ranging between 35 and 43; plastic limit (PL) was highest for Group 3 sediments but did not vary much either among the three groups; as well as organics (%). The water content varied considerably between Groups 2 and 3.
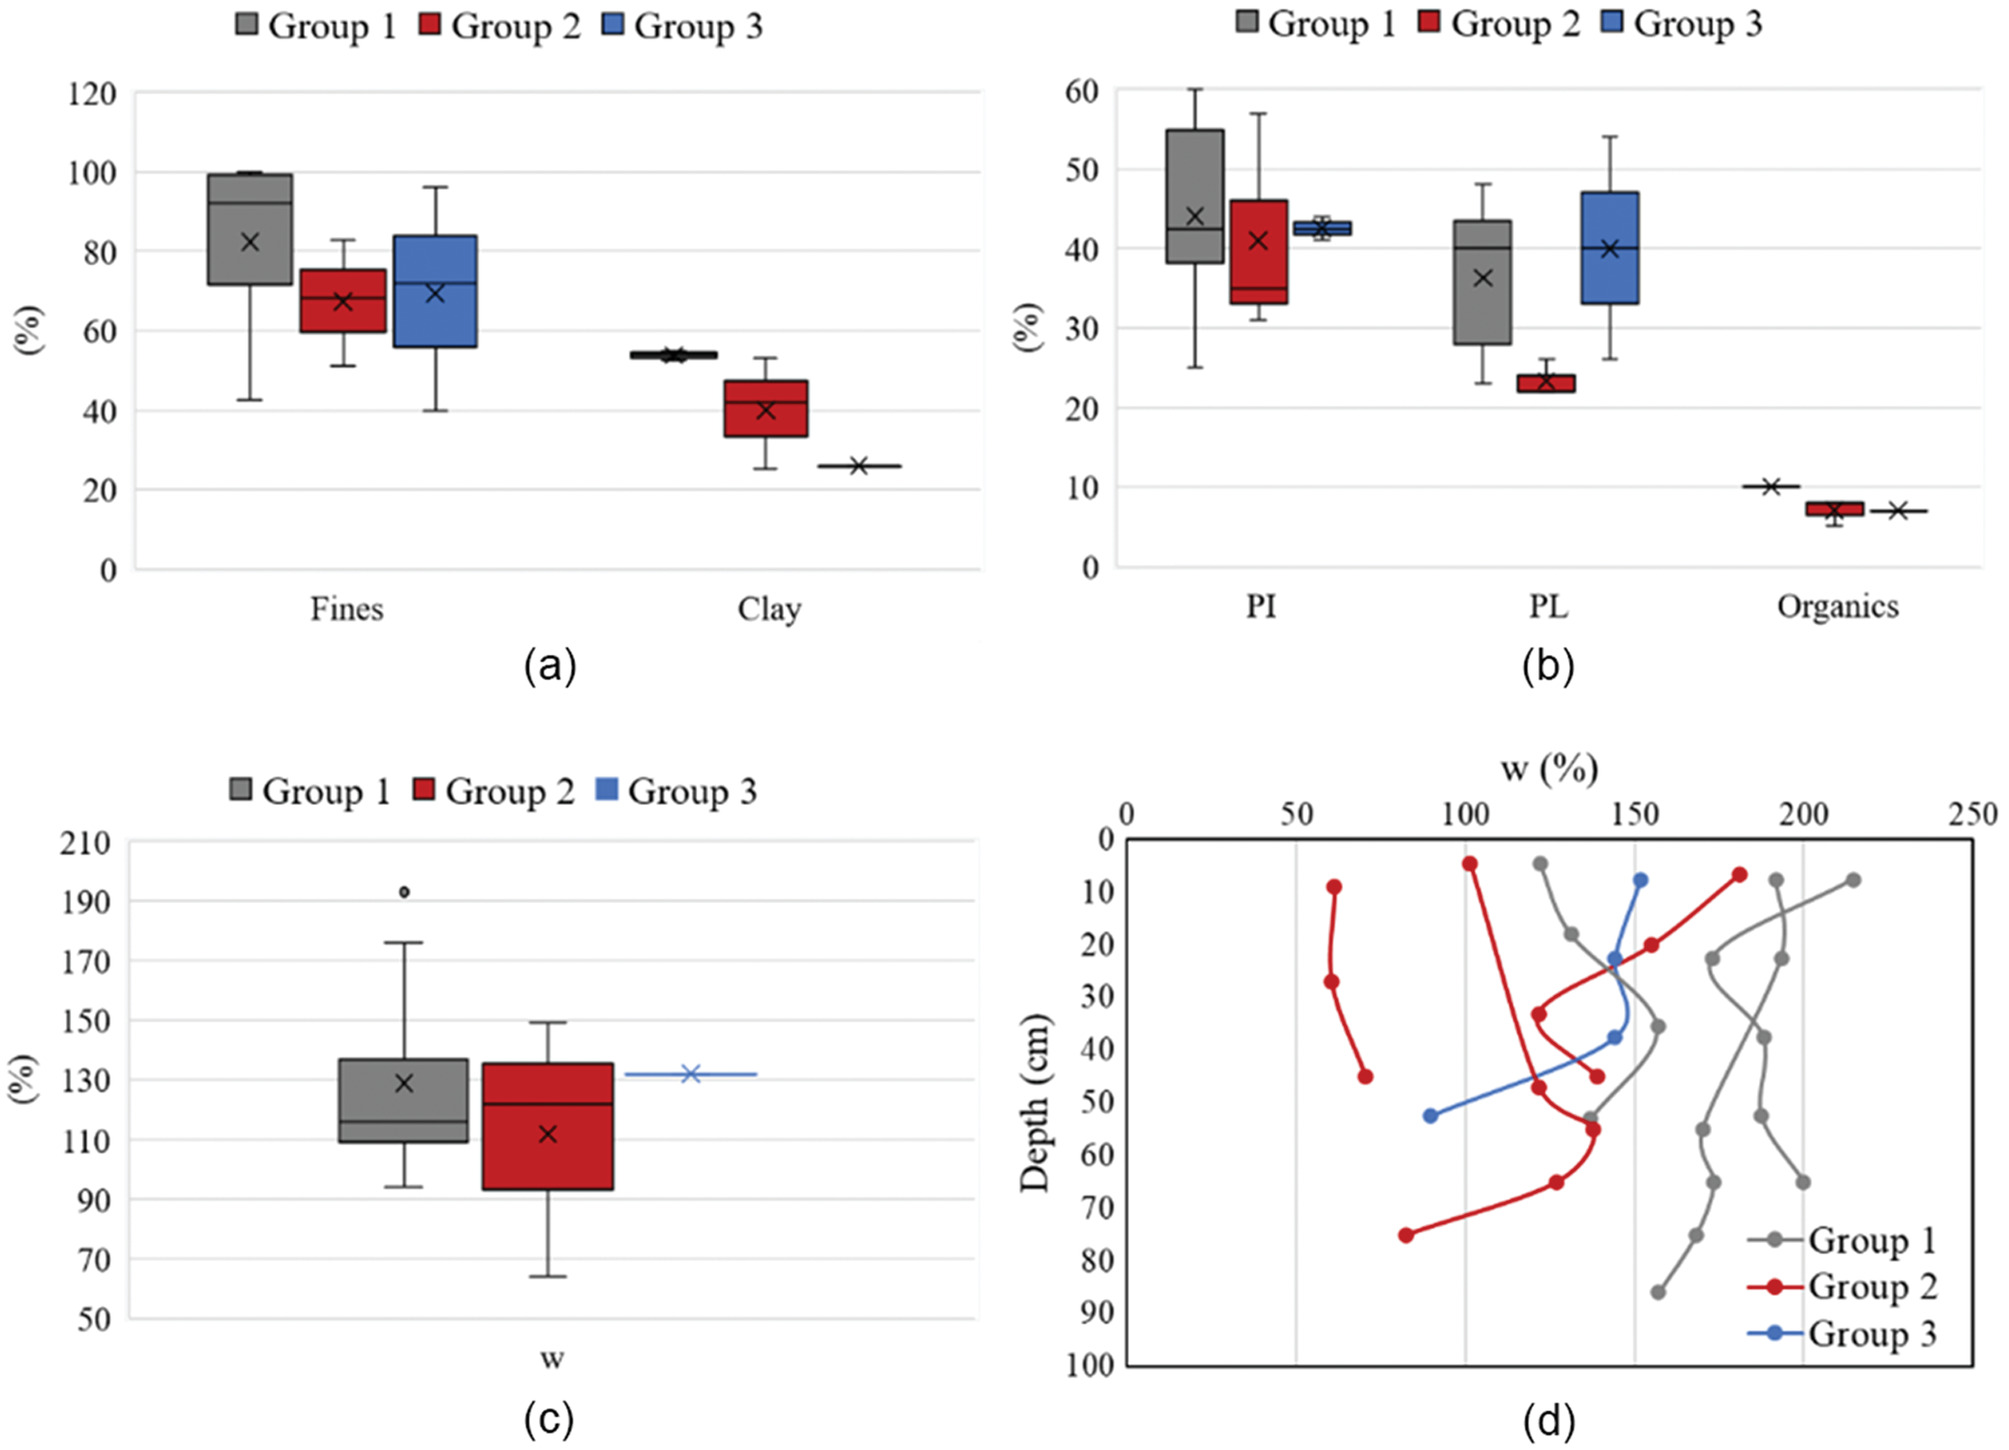
The difference between the average reported for Groups 1 and 3 seems subtle, and further examination of the (%) variation with depth [Fig. 9(d)] confirmed these findings up to a depth of , where the (%) reported for Group 3 fell within the range of (%) reported for Group 1. However, this seems to change below a depth of , where (%) reported for Group 3 was lower than for Group 1, dropping to 89% at a depth of compared with an average of 165% for Group 1 at a similar depth. Such findings seem to also confirm the two distinct soil layers suggested by the deceleration profiles [Fig. 8(c)]: the upper layer characteristics of Group 3 matched Group 1 characteristics, likely demonstrating recent sediment deposition with higher (%) and lower deceleration values, and a deeper established layer with lower (%) and higher deceleration values (up to ) at deeper depths (below 30–40 cm). This supports the classification of three different groups, which were fitted based on observation in this study and will also be further investigated through numerical analysis.
For each of the three distinct groups identified, an example of a profile for each group with different strain rate correction factors (0.1–0.15) and (0.035–0.085) and using are shown in Fig. 10, respectively (results for are shown in Fig. S4 ). The profiles with no strain rate correction (black solid line) are also displayed, and results from laboratory minivane shear results are shown for the obtained sample depths for comparison and assessment of the use of literature-based empirical factors. A 10% uncertainty was considered as error bars to account for mishandling during sample collection, storing, and testing.
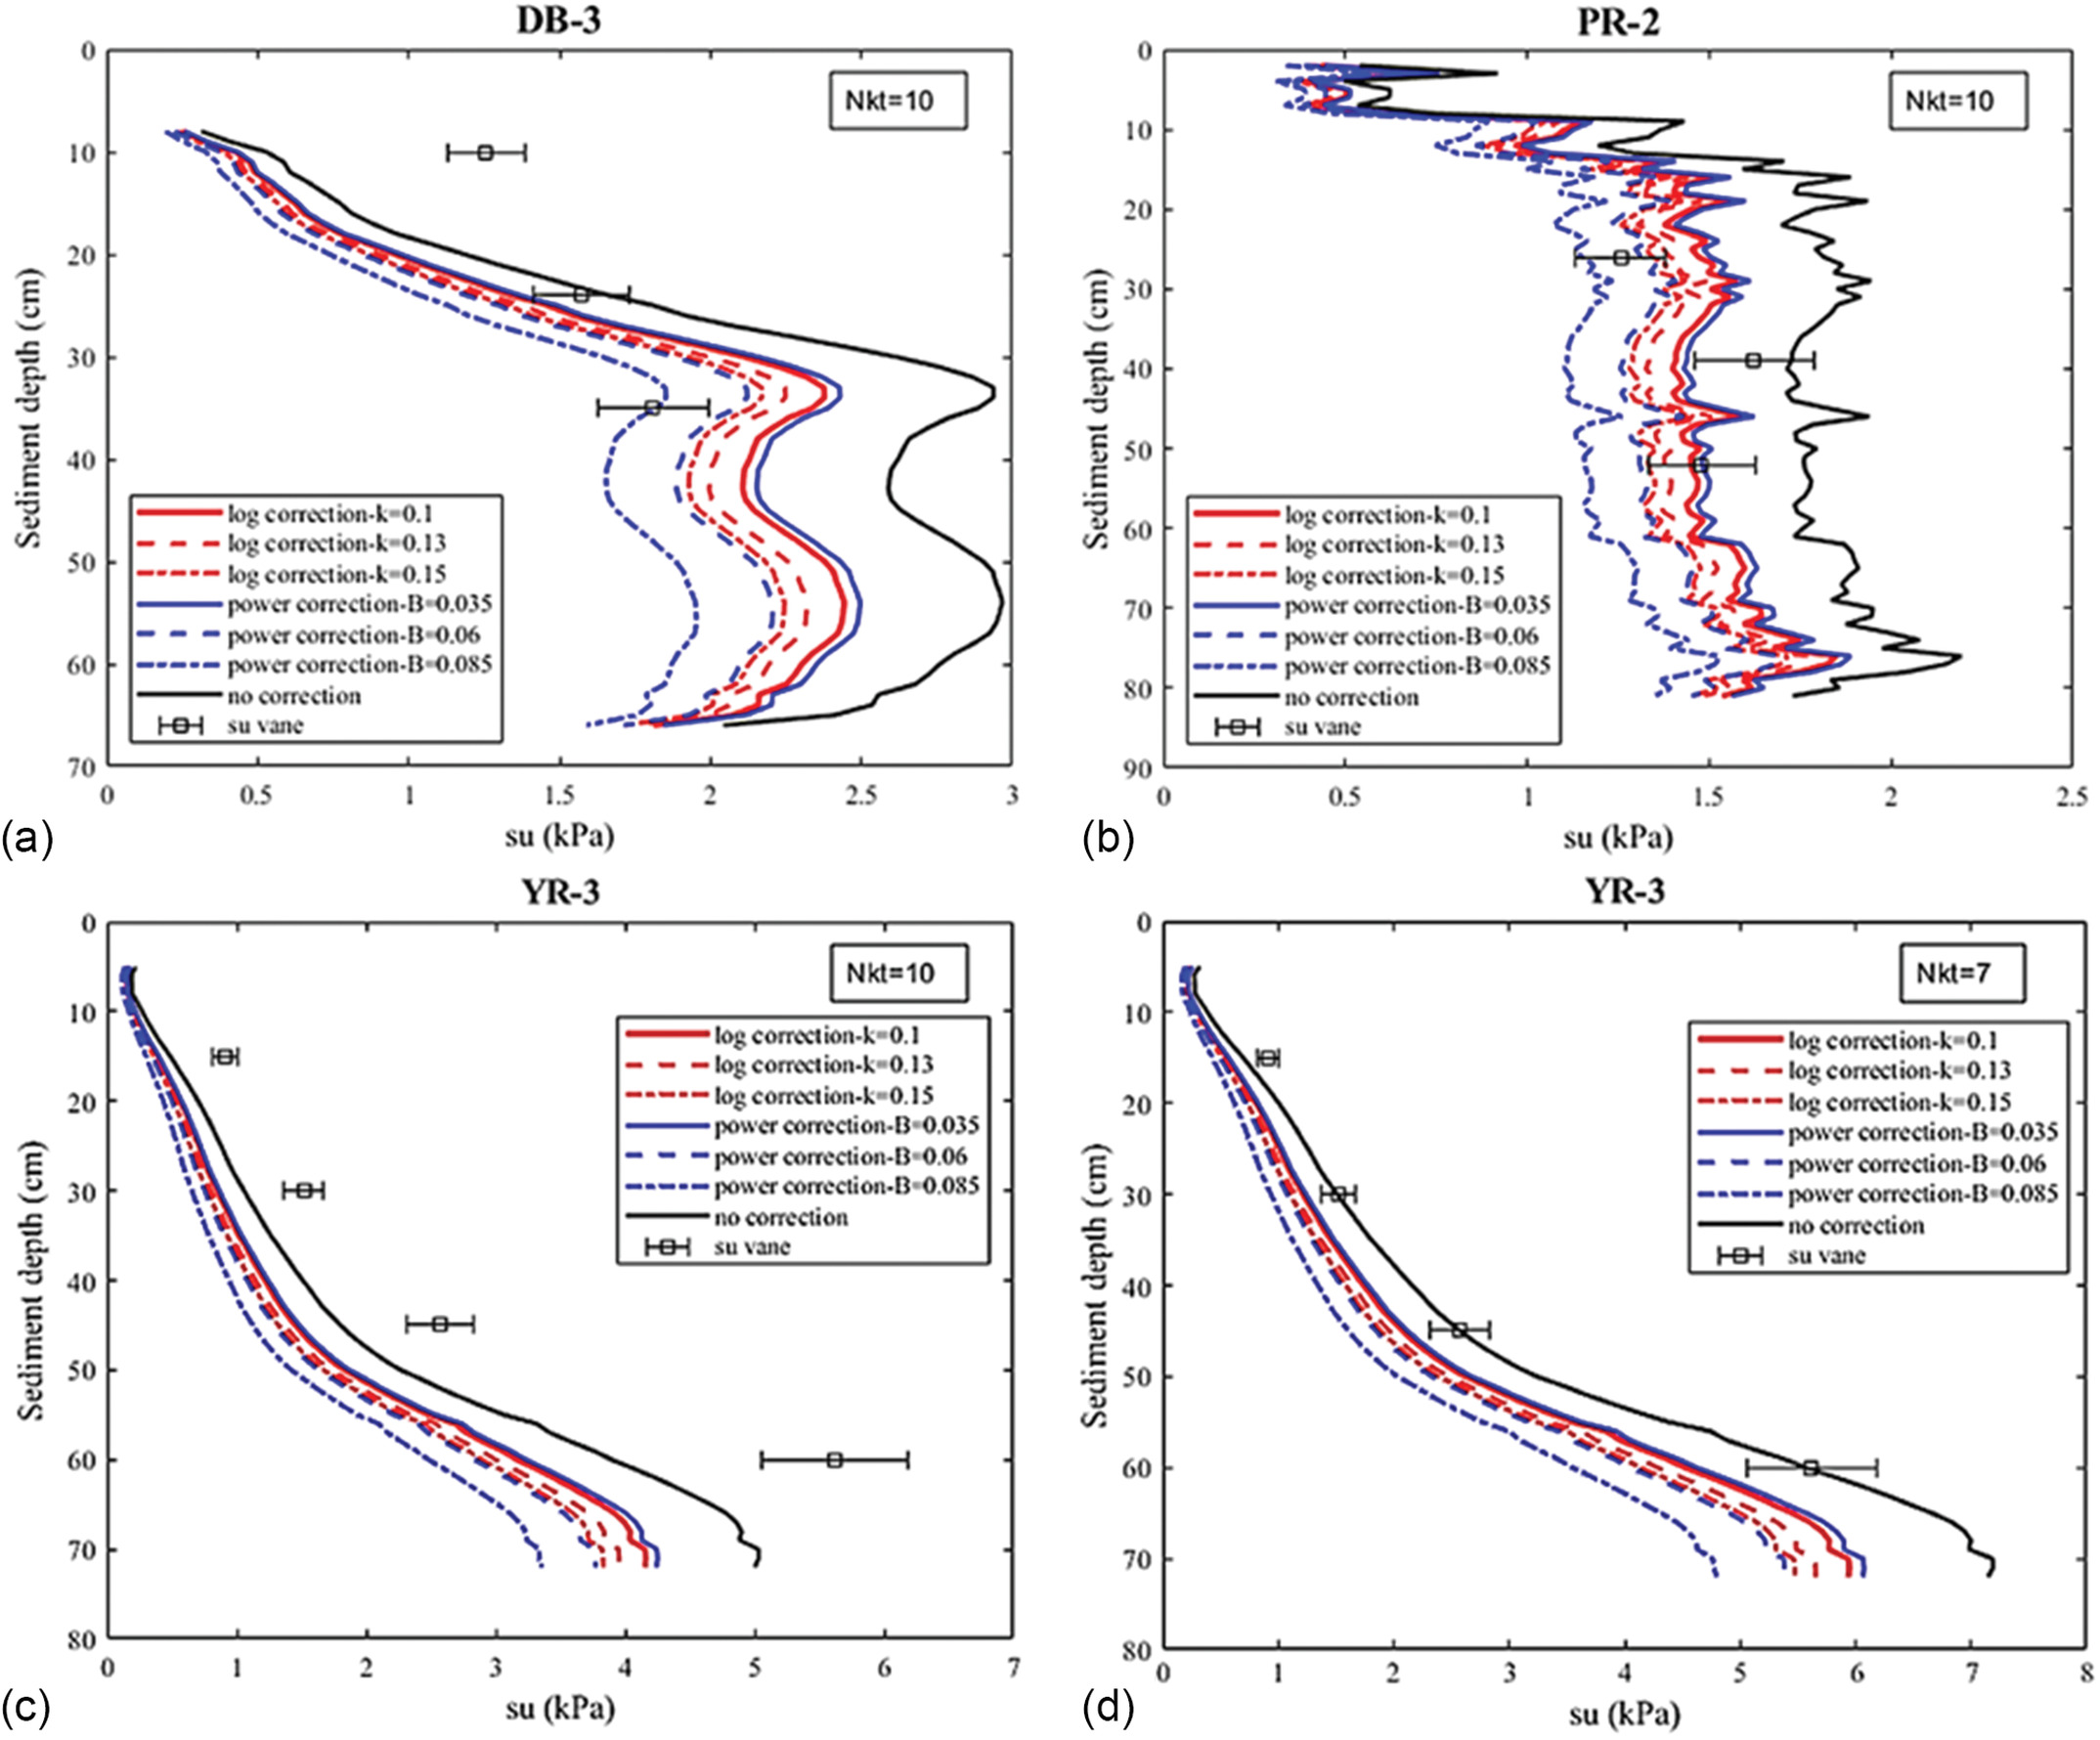
Vane shear results matched for Groups 1 and 2 at penetration depths . At shallower penetration depths and where , applied. For Group 3, was apparent. The mismatch observed in Groups 1 and the upper layer of Group 3 is likely related to limitations of seabed sampling, sample recovery, and preservation, and possibly vane shear testing of estuarine muds with high water contents and low strength. For the stronger and deeper layer of Group 3, an adjustment of the cone factor to of 7 yielded a closer match [Fig. 10(d)]. Because the PFFP underpredicted the undrained shear strength over the vane shear results, an insufficient strain rate correction can be excluded as reason for this observation.
Discussion
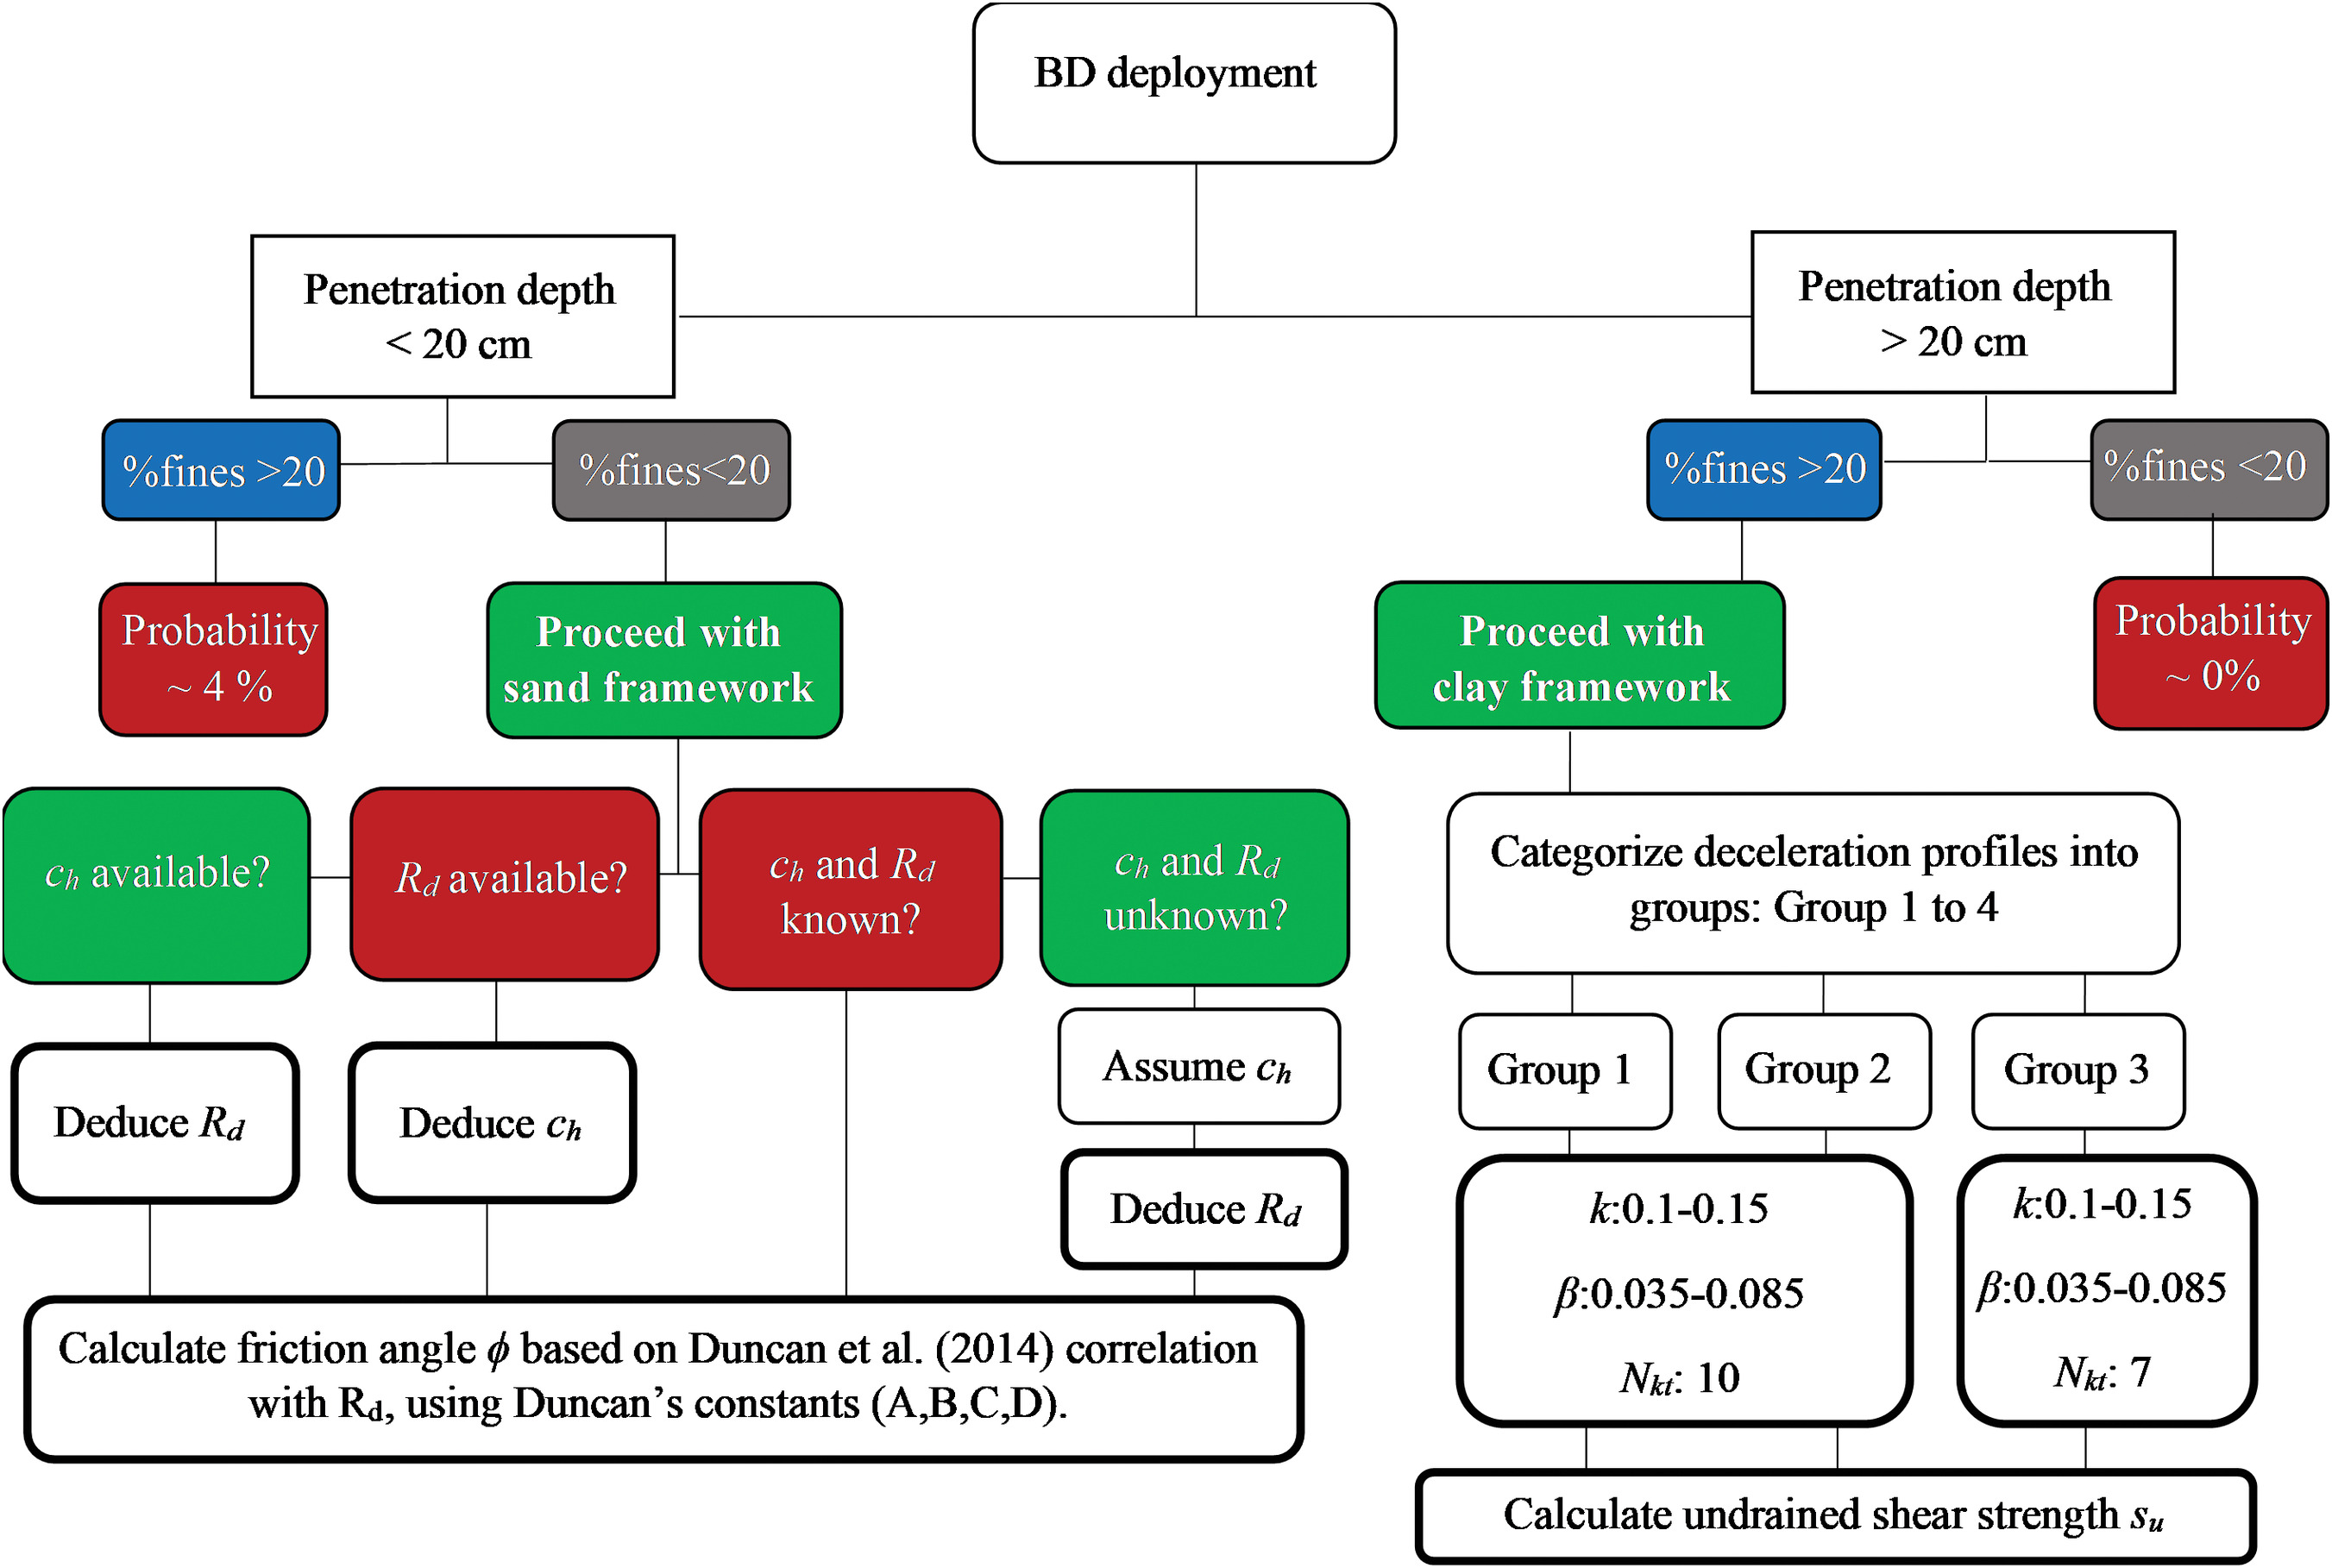
Sandy sediments, defined here as fines, were identified in most cases (96%) by a penetration depth of of the lightweight PFFP used in this study (). The application of the sand framework as outlined in the “Sands” section and summarized in Fig. 11 was applied to this group of deployments. However, this approach typically requires knowledge or estimates of the relative density , the coefficient of horizontal consolidation , and/or the crushing parameter . For most of the applications of PFFP, these parameters will not be available for the specific site but need to be estimated as demonstrated here.
Focusing on , its effect had less significance on the friction angle results, showing that a variation of between 6 and 10 was associated with up to 3° variation in friction angle, despite its strong effect on . The sands included in this study were predominantly composed of quartz, and thus, is agreement with the literature for quartz and feldspar (Salgado et al. 2000; Randolph and Hope 2004; White et al. 2018), being well in line with observed results demonstrated on Site YR-1 (Fig. 5). For such (), the effect of becomes conveniently negligible regarding its impacts on relative density and friction angle (Fig. 7). For sites with other dominant sand mineralogy (e.g., carbonate sands, basaltic sands), it is recommended to follow a similar procedure to the one demonstrated here to determine and validate proper input parameters. With an agreeable estimate of relative density, friction angles were calculated using Duncan’s formula and parameters [Eq. (8)] (Duncan et al. 2014). Laboratory results showed that this procedure provided agreeable results with mismatch, i.e., falling well within expected ranges of uncertainty, without the need for further calibration.
PFFP penetration depths of were exclusively observed for sediments with fines contents of . For the clay framework, PFFP deceleration profiles were further categorized into three groups based on different profiles and sediment properties. Group 1 had the highest fines and clay contents (%) and high water contents (%). The top layer of Group 3 () matched Group 1 sediment characteristics with a similar (%) range. However, the deeper layer of Group 3 () reflected stiffer sediments with lower (%). Cone factors were adopted from the literature (Stegmann 2007; Chow et al. 2014; Steiner et al. 2014; Stark and Ziotopoulou 2017) and specifically from Mayne and Peuchen (2018), who concluded a best-fit for soft-firm offshore sediment and of 10 for sensitive clays.
Different strain rate correction methods and parameters were tested and compared with values measured with laboratory vane shear test. Results showed a good match for Group 1 (except at shallow depth) and Group 2; however, mismatches were observed for Group 3. Mismatches observed in the top sediment layers for Groups 1 and 3, where values measured by the vane shear were higher than those estimated using PFFP, are likely attributable to sample disturbance and consolidation during sampling and between sampling and testing, which is particularly evident in very soft samples (Morgenstern and Thomson 1971). However, the mismatches observed in Group 3 at deeper depths (characterized by the steep increase in deceleration profiles and lower water content) are associated with a stiffer, more consolidated layer that requires the use of , slightly lower than the cone factors suggested by Mayne and Peuchen (2018), but within the range of values reported for the fine-grained soils for CPT (4–20) with an average of 10 or less (Robertson and Cabal 2015).
Deployments with penetration depths of 20–25 cm represented mostly (91%) sediments with fines contents but contained in some cases still a significant amount of coarse fractions. Although no clear guideline has yet been established on the threshold of fines that transition sediments into cohesive behavior, ranges reported in the literature varied from as low as 3% up to 20% (Van Ledden et al. 2004), and even higher (Yang et al. 2006). The sand framework proved not applicable for these deployments. Given the fact that here, most mixed sediments were characterized by fines contents >20% and the application of the clay framework yielded acceptable results, this supports the hypothesis that cohesion might dominate the behavior of these sediments. In that context and given the limited data available on mixed sediments, the clay framework is suggested as being more suitable to capture the mechanics of sediments with fines contents as low as 20%. However, more data are needed to reach a decisive classification and recommendation for such sediments. The threshold of penetration depth should be considered instrument-specific, but it is expected that similar thresholds can be developed for other PFFP. The use of pore pressure measurements for initial as well as detailed soil characterization is promising (e.g., Lucking et al. 2017; Mumtaz et al. 2018) and is currently being further explored. Eventually, this may complement or even replace the use of probe-specific penetration depth thresholds.
A unified procedure to derive geotechnical properties from PFFP deceleration measurements for sandy to clayey sediment has been presented by merging and assessing existing approaches with a sediment type discrimination based on penetration depth (Fig. 11). This method represents an important step toward integrating geotechnical in situ data collected in energetic subaquatic environments into quantitative studies of local sediment dynamics and erodibility because the availability of quality samples for complementary soil characterization and even often a detailed knowledge of soil type is not available in such environments. It is envisioned that the friction angle for sandy sediments and undrained shear strength for fine-grained and mixed sediments can be integrated into models to estimate, e.g., the critical shear stress to initiate sediment transport or even erosion rate in the future. Initial examples by Bagnold (1966), Kirchner et al. (1990), or Van Rijn (2007) have set the pathway to quantify erosion parameters with geotechnical properties.
Conclusion
This study presented and assessed a universal data analysis framework for the processing of deceleration-depth data collected using portable free fall penetrometers to estimate geotechnical strength parameters in the uppermost layers of the seabed surface. The proposed framework integrates and advances previous methodologies presented in the literature, which were limited to certain sediment types and/or the availability of complementary geotechnical sediment information, and offers solutions how to address the lack of complementary data that is common in energetic coastal environments. PFFP data from over 50 deployments distributed over seven different areas with a wide variety of sediment distributions were used for the development, calibration, and validation of the integrated framework.
Based on PFFP penetration depth, sites could be discriminated into sediment categories of more or less than 20% fines content. Then, two pathways were proposed to process data associated with predominantly noncohesive soil behavior and with predominantly cohesive soil behavior, respectively. For the former, the relative density and friction angle were estimated, and for the latter, undrained shear strength was derived. Results were validated by laboratory testing, yielding favorable estimates with careful consideration of the importance of , , strain rate factors and , and cone factor , where specific values/ranges were tested and recommended.
Most sediments tested fell well into the proposed data analysis pathways. Friction angle results for the sand framework were within ±1° of the measured values from laboratory testing. Within the sediment with >20% fines content following the clay framework, three site observation groups could be distinguished by trends along the deceleration-sediment depth profiles related to varying fines (%) and water content (%), where Group 1 had the highest fines (%) and water content (%). Undrained shear strength values at different depth matched vane shear testing using cone factors of 10 and 12, except for Group 3, which required a lower cone factor of 7 to match the vane shear results. The study showed that a streamlined data analysis procedure for PFFP and for coastal areas with little to no other soil data can be performed to derive geotechnical parameters of surficial seabed sediments relevant for the investigation of active sediment dynamics.
Supplemental Materials
File (supplemental_materials_jggefk.gteng-11013_jaber.pdf)
- Download
- 783.61 KB
Data Availability Statement
Some or all data, models, or code that support the findings of this study are available at Design Safe and Virginia Tech data repositories; other data may be available from the corresponding author upon reasonable request (this includes portable free fall penetrometer data, laboratory testing data, and MATLAB codes to generate results).
Acknowledgments
The authors would like to acknowledge the National Sciences Foundation through Grant No. CMMI-1751463, the Naval Research Lab through Grant No. N00173-19-1-G018, and the Strategic Environmental Research and Development Program of the Department of Defense through Grant No. MR18-1233 for funding the research and work presented. The authors would also like to thank Dr. Carter DuVal and Dr. Joe Calantoni, both from the Naval Research Lab, Dr. Art Trembanis, from the University of Delaware, Anna Wargula, Lilian Velasquez Montoya from the United States Naval Academy, Elizabeth Sciaudone from NC State University, Grace Massey, Cristin Wright, and Carl Friedrichs from the Virginia Institute of Marine Sciences, and Dennis Kiptoo for assistance in data collection and testing.
References
Akal, T., and R. D. Stoll. 1995. “An expendable penetrometer for rapid assessment of seafloor parameters.” In Proc., OCEANS’95 MTS/IEEE Challenges of Our Changing Global Environment, 1822–1826. New York: IEEE.
Albatal, A., and N. Stark. 2017. “Rapid sediment mapping and in situ geotechnical characterization in challenging aquatic areas.” Limnol. Oceanogr.: Methods 15 (8): 690–705.
Albatal, A., N. Stark, and B. Castellanos. 2020. “Estimating in situ relative density and friction angle of nearshore sand from portable free-fall penetrometer tests.” Can. Geotech. J. 57 (1): 17–31. https://doi.org/10.1139/cgj-2018-0267.
ASTM. 2009. Standard test methods for particle-size distribution (gradation) of soils using sieve analysis. ASTM D6913. West Conshohocken, PA: ASTM.
ASTM. 2011. Standard test methods for one-dimensional consolidation properties of soils using incremental loading. ASTM D2435. West Conshohocken, PA: ASTM.
ASTM. 2012. Standard test method for direct shear test of soils under consolidated drained conditions. ASTM D3080. West Conshohocken, PA: ASTM.
ASTM. 2016. Standard test method for laboratory miniature vane shear test for saturated fine-grained clayey soil. ASTM D4648. West Conshohocken, PA: ASTM.
ASTM. 2018. Standard test methods for liquid limit, plastic limit, and plasticity index of soils. ASTM D4318. West Conshohocken, PA: ASTM.
Aubeny, C. P., and H. Shi. 2006. “Interpretation of impact penetration measurements in soft clays.” J. Geotech. Geoenviron. Eng. 133 (7): 767–781. https://doi.org/10.1061/(ASCE)1090-0241(2006)132:6(770).
Bagnold, R. A. 1966. An approach to the sediment transport problem from general physics. Washington, DC: US Government Printing Office.
Bilici, C., N. Stark, C. T. Friedrichs, and G. M. Massey. 2019. “Coupled sedimentological and geotechnical data analysis of surficial sediment layer characteristics in a tidal estuary.” Geo-Mar. Lett. 39 (3): 175–189. https://doi.org/10.1007/s00367-019-00565-3.
Bjerrum, L. 1972. “Embankments on soft ground.” In Vol. 2 of Proc., ASCE Conf. on Performance of Earth-Supported Structures, 1–54. West Lafayette, IN: Purdue Univ.
Chakraborty, T., and R. Salgado. 2010. “Dilatancy and shear strength of sand at low confining pressures.” J. Geotech. Geoenviron. Eng. 136 (3): 527–532. https://doi.org/10.1061/(ASCE)GT.1943-5606.0000237.
Chow, S. H., B. Bienen, and M. F. Randolph. 2018. “Rapid penetration of piezocones in sand.” In Proc., 4th Int. Symp. on Cone Penetration Testing (CPT’18), 213–219. London: CRC Press. https://doi.org/10.1201/9780429505980.
Chow, S. H., C. D. O’Loughlin, and M. F. Randolph. 2014. “Soil strength estimation and pore pressure dissipation for free-fall piezocone in soft clay.” Géotechnique 64 (May): 817–827. https://doi.org/10.1680/geot.14.P.107.
Chow, S. H., C. D. O’Loughlin, D. J. White, and M. F. Randolph. 2017. “An extended interpretation of the free-fall piezocone test in clay.” Géotechnique 67 (12): 1090–1103. https://doi.org/10.1680/jgeot.16.P.220.
Colreavy, C., C. O’Loughlin, and M. Randolph. 2016. “Estimating consolidation parameters from field piezoball tests.” Géotechnique 66 (4): 333–343. https://doi.org/10.1680/jgeot.15.P.106.
DeJong, J. T., and M. Randolph. 2012. “Influence of partial consolidation during cone penetration on estimated soil behavior type and pore pressure dissipation measurements.” J. Geotech. Geoenviron. Eng. 138 (7): 777–788. https://doi.org/10.1061/(ASCE)GT.1943-5606.0000646.
Duncan, J. M., S. G. Wright, and T. L. Brandon. 2014. Soil strength and slope stability. New York: Wiley.
Edil, T. B., A. B. Christopher, and H. B. Craig. 2007. Determination of shear strength values for granular backfill material used by the Wisconsin Department of Transportation. Rep. No. WHRP 07-09. 2007. Madison, WI: Wisconsin Highway Research Program.
Giusti, I. 2019. “Improvement of piezocone test interpretation for partial drainage conditions and for transitional soils.” Ph.D. thesis, Dept. of Architecture, Civil Engineering and Environmental Sciences, Technische Universität Braunschweig.
Grabowski, R. C., I. G. Droppo, and G. Wharton. 2011. “Erodibility of cohesive sediment: The importance of sediment properties.” Earth Sci. Rev. 105 (3–4): 101–120. https://doi.org/10.1016/j.earscirev.2011.01.008.
Haldar, A., and W. H. Tang. 1979. “Probabilistic evaluation of liquefaction potential.” J. Geotech. Eng. 105 (GT2): 145–163.
Huang, J., D. V. Griffiths, and G. A. Fenton. 2010. “Probabilistic analysis of coupled soil consolidation.” J. Geotech. Geoenviron. Eng. 136 (3): 417–430. https://doi.org/10.1061/(ASCE)GT.1943-5606.0000238.
Jain, R. K., and U. C. Kothyari. 2009. “Cohesion influences on erosion and bed load transport.” Water Resour. Res. 45 (6): 22. https://doi.org/10.1029/2008WR007044.
Jamiolkowski, M., D. C. F. Lo Presti, and M. Manassero. 2003. “Evaluation of relative density and shear strength of sands from CPT and DMT.” In Soil behavior and soft ground construction, 201–238. Reston, VA: ASCE. https://doi.org/10.1061/40659(2003)7.
Kim, K. K., M. Prezzi, and R. Salgado. 2006. Interpretation of cone penetration tests in cohesive soils. Rep. No. FHWA/IN/JTRP-2006/22. Indianapolis: Indiana DOT.
Kirchner, J. W., W. E. Dietrich, F. Iseya, and H. Ikeda. 1990. “The variability of critical shear stress, friction angle, and grain protrusion in water-worked sediments.” Sedimentology 37 (4): 647–672. https://doi.org/10.1111/j.1365-3091.1990.tb00627.x.
Lucking, G., N. Stark, T. Lippmann, and S. Smyth. 2017. “Variability of in situ sediment strength and pore pressure behavior of tidal estuary surface sediments.” Geo-Mar. Lett. 37 (5): 441–456.
Lunne, T., P. K. Robertson, and J. J. M. Powell. 1997. Cone penetration testing in geotechnical practice. London: Blackie Academic and Professional.
Mayne, P. W., and J. Peuchen. 2018. “CPTu bearing factor Nkt for undrained strength evaluation in clays.” In Proc., Cone Penetration Testing 2018 (CPT’18), 1–6. London: CRC Press.
Meyerhof, G. 1956. “Penetration tests and bearing capacity of cohesionless soils.” J. Soil Mech. Found. Div. 82 (1): 866.
Morgenstern, N. R., and S. Thomson. 1971. “Comparative observations on the use of the pitcher sampler in stiff clay.” In Vol. 483 of Sampling of soil and rock, 180–191. West Conshohocken, PA: ASTM.
Mumtaz, B., N. Stark, and S. Brizzolara. 2018. “Pore pressure measurements using a portable free fall penetrometer.” In Proc., Cone Penetration Testing 2018 (CPT’18). London: CRC Press. https://doi.org/10.1201/9780429505980.
Nguyen, G. 2013. “Determination of an uncertainty of direct shear test results of soils.” In Vol. 2 of Proc., Int. Multidisciplinary Scientific GeoConf. SGEM, 87. Red Hook, NY: Curran Associates.
Randolph, M. F. 2004. “Characterization of soft sediments for offshore applications.” In Vol. 1 of Proc., 2nd Int. Site Characterization Conf., 209–232. Rotterdam, Netherlands: Millpress.
Randolph, M. F. 2016. “New tools and directions in offshore site investigation.” Aust. Geomech. J. 51 (Dec): 81–92.
Randolph, M. F., and S. Hope. 2004. “Effect of cone velocity on cone resistance and excess pore pressures.” In Proc., Int. Symp. on Engineering Practice and Performance Of Soft Deposits, 147–152. Osaka, Japan: Yodogawa Kogisha.
Robertson, P. K., and K. L. Cabal. 2015. Guide to cone penetration testing. 6th ed. Signal Hill, CA: Gregg Drilling and Testing Inc.
Rousé, P. C. 2018. “Relation between the critical state friction angle of sands and low vertical stresses in the direct shear test.” Soils Found. 58 (5): 1282–1287. https://doi.org/10.1016/j.sandf.2018.06.005.
Rowe, P. W. 1972. “The relevance of soil fabric to site investigation practice.” Géotechnique 22 (2): 195–300. https://doi.org/10.1680/geot.1972.22.2.195.
Salgado, R., P. Bandini, and A. Karim. 2000. “Shear strength and stiffness of silty sand.” J. Geotech. Geoenviron. Eng. 126 (5): 451–462. https://doi.org/10.1061/(ASCE)1090-0241(2000)126:5(451).
Stark, N., G. Coco, K. R. Bryan, and A. Kopf. 2012. “In-situ geotechnical characterization of mixed-grain-size bedforms using a dynamic penetrometer.” J. Sediment. Res. 82 (7): 540–544. https://doi.org/10.2110/jsr.2012.45.
Stark, N., and A. Kopf. 2011. “Detection and quantification of sediment remobilization processes using a dynamic penetrometer.” In Proc., Oceans 2011, IEEE/MTS, New York: IEEE.
Stark, N., B. Radosavljevic, B. Quinn, and H. Lantuit. 2017. “Application of portable free-fall penetrometer for geotechnical investigation of Arctic nearshore zone.” Can. Geotech. J. 54 (1): 31–46. https://doi.org/10.1139/cgj-2016-0087.
Stark, N., and T. F. Wever. 2009. “Unraveling subtle details of expendable bottom penetrometer (XBP) deceleration profiles.” Geo-Mar. Lett. 29 (1): 39–45. https://doi.org/10.1007/s00367-008-0119-1.
Stark, N., and K. Ziotopoulou. 2017. “Undrained shear strength of offshore sediments from portable free fall penetrometers: Theory, field observations and numerical simulations.” In Proc., Offshore Site Investigation Geotechnics 8th Int. Conf., 391–399. South Kensington: Society for Underwater Technology.
Stegmann, S., 2007. “Design of a free-fall penetrometer for geotechnical characterization of saturated sediments and its geological application.” Ph.D. thesis, Dept. of Earth Sciences, Bremen Univ.
Steiner, A., A. J. Kopf, J. S. L’Heureux, S. Kreiter, S. Stegmann, H. Haflidason, and T. Moerz. 2014. “In situ dynamic piezocone penetrometer tests in natural clayey soils-a reappraisal of strain-rate corrections.” Can. Geotech. J. 51 (Mar): 272–288. https://doi.org/10.1139/cgj-2013-0048.
Van Ledden, M., W. G. M. Van Kesteren, and J. C. Winterwerp. 2004. “A conceptual framework for the erosion behaviour of sand–mud mixtures.” Cont. Shelf Res. 24 (1): 1–11. https://doi.org/10.1016/j.csr.2003.09.002.
Van Rijn, L. C. 2007. “Unified view of sediment transport by currents and waves. I: Initiation of motion, bed roughness, and bed-load transport.” J. Hydraul. Eng. 133 (6): 649–667. https://doi.org/10.1061/(ASCE)0733-9429(2007)133:6(649).
White, D. J., C. D. O’Loughlin, N. Stark, and S. H. Chow. 2018. “Free fall penetrometer tests in sand: Determining the equivalent static resistance.” In Proc., Cone Penetration Testing 2018: Proc., of the 4th Int. Symp. on Cone Penetration Testing, 695–701. London: CRC Press.
Winterwerp, J. C. 1989. “Flow induced erosion of cohesive beds: A literature survey.” In Cohesive sediments. Delft, Netherlands: WL Delft Hydraulics.
Yang, Z., J.-b. Zhang, and C. P. Low. 2006. “Towards dynamic integration of collaborative virtual enterprise using semantic web services.” In Proc., 4th IEEE Int. Conf. on Industrial Informatics, 102–107. New York: IEEE. https://doi.org/10.1109/INDIN.2006.275725.
Young, A. G., B. B. Bernard, B. D. Remmes, L. Babb, and J. M. Brooks. 2011. “CPT stinger—An innovative method to obtain CPT data for integrated geoscience studies.” In Proc., Offshore Technology Conf. Richardson, TX: OnePetro.
Information & Authors
Information
Published In

Journal of Geotechnical and Geoenvironmental Engineering
Volume 149 • Issue 12 • December 2023
Copyright
This work is made available under the terms of the Creative Commons Attribution 4.0 International license, https://creativecommons.org/licenses/by/4.0/.
History
Received: May 5, 2022
Accepted: May 9, 2023
Published online: Oct 13, 2023
Published in print: Dec 1, 2023
Discussion open until: Mar 13, 2024
Authors
Metrics & Citations
Metrics
Citations
Download citation
If you have the appropriate software installed, you can download article citation data to the citation manager of your choice. Simply select your manager software from the list below and click Download.
Cited by
- Julie Paprocki, Nina Stark, Thomas Lippmann, Geotechnical Characterization of a Tidal Estuary Mudflat Using Portable Free-Fall Penetrometers, Journal of Geotechnical and Geoenvironmental Engineering, 10.1061/JGGEFK.GTENG-11579, 150, 1, (2024).