Effects of Climate Change and Urbanization on Bridge Flood Vulnerability: A Regional Assessment for Harris County, Texas
Abstract
The failure of stream-crossing bridges during flood events can endanger human life, impede evacuation planning and emergency response efforts, and cause long-term disruptions to transportation systems and local and regional economies. Expanding urban development and changing precipitation patterns due to climate change can increase the frequency and intensity of high-flow conditions at bridge locations, potentially exacerbating flood-related damages. Thus, there is a critical need to evaluate how shifts in extreme precipitation and continued urban growth will affect peak flows and hydraulic conditions experienced by bridges. This study applies hydrologic and hydraulic modeling to investigate the individual and combined effects of climate change and urbanization on the magnitude of peak discharge, bridge freeboard encroachment, and flow velocity at stream-crossing bridge locations in 19 watersheds of Harris County, Texas. The developed framework provides a screening tool to assess the vulnerability of regional bridge infrastructure to high-flow events and to prioritize maintenance, retrofitting, and replacement efforts. The model results demonstrate that peak flows during a 1% annual exceedance probability event can increase by up to 40% by 2100 when considering the combined impacts of climate change and urbanization, with changes in precipitation generally contributing more than changes in land use. In 16 of the 19 studied watersheds, the 1% annual exceedance probability event is projected to occur at least twice as frequently by 2100. Across the region, an additional 36 bridges experience loss of freeboard due to the effects of urbanization and climate change, while notable increases in flow velocity () are observed at 93 bridge locations, five of which are considered scour critical. Overall, the results of this study show that climate change and urbanization will influence the hydraulic conditions at bridge locations and therefore should be carefully accounted for in the design, operation, and maintenance of bridge infrastructure in the future.
Introduction
Flooding poses a serious threat to communities across the globe, leading to loss of life, damage to homes and businesses, and disruptions to critical infrastructure systems. In the US alone, 36 flood events with damages over $1 billion occurred between 1980 and 2021, causing approximately $168 billion in total damages (NOAA 2022). Rainfall intensity is projected to increase in many locations in the future (Meehl et al. 2007; Westra et al. 2014), which could exacerbate flooding issues in areas with aging stormwater infrastructure designed based on historical data (Rainey et al. 2021). In addition, urbanization and expanding development in floodplains have increased the exposure of people and infrastructure, leading to greater potential for damage (Montz 2000). New development often results in the loss of pervious surfaces, which reduces the infiltration capacity of land areas and can lead to increased runoff to streams, further exacerbating flooding (Feng et al. 2021; Zhao et al. 2016).
Riverine flooding is a particular concern for stream-crossing roadway bridges (Mondoro et al. 2017; Batchabani et al. 2016), which comprise an important part of the surface transportation network. High riverine water levels can overtop bridge decks, leading to inundation of the roadway and temporary loss of serviceability (Pregnolato et al. 2022). Excessive hydraulic loading due to elevated water levels and velocities can compromise the structural integrity of bridges and may lead to bridge collapse, posing a threat to personal safety and resulting in extended disruptions to personal and commercial mobility (Naderi 2018; Nasr et al. 2021). Bridge overtopping or failure can also hinder evacuation and emergency response efforts during extreme events (Alipour 2017). Recent flood events have highlighted this vulnerability (Flint et al. 2017), including storms in 2015 and 2018 that caused bridge collapses in Texas over the Blanco and Llano Rivers, respectively (Furl et al. 2018).
Past studies have suggested that impacts to bridge infrastructure due to urbanization and more intense rainfall could be substantial. In a national-scale study of bridge vulnerability to climate change, Wright et al. (2012) applied an empirical rainfall-runoff model to determine peak flows in over 2,000 watersheds based on future precipitation projections derived from global climate models (GCMs). They estimated that more than 100,000 bridges in the US could be vulnerable to climate change based on scour potential, with associated adaptation costs of $140 to $250 billion. In another study of bridge infrastructure in Montgomery County, Maryland, Bhatkoti et al. (2016) used precipitation estimates from GCMs combined with an empirical hydrologic analysis to determine the change in return period of flows impacting bridges of various roadway classifications. They found that future changes in precipitation frequency will cause a reduction in the return period at which bridges are impacted, with local roads experiencing greater vulnerability than highways. While these and other past studies (e.g., Neumann et al. 2015; Khelifa et al. 2013) provide insight into the potential for future impacts on bridges, they generally apply top-down, empirical hydrologic approaches and make simplifying assumptions about bridge and channel geometry. They also do not consider spatially explicit projections of land use change. As a result, these analyses can be viewed as initial estimates of vulnerability but may not be sufficient to inform local-level risk assessments or adaptation planning efforts.
To address the need for locally relevant information on future bridge vulnerability to climate change and urbanization, this study develops a physically-based, spatially explicit framework that combines projections of future precipitation and land use with hydrologic and hydraulic modeling to simulate water surface elevations and velocities at stream-crossing bridges in Harris County, Texas. Model outputs are used to assess the loss of freeboard (i.e., the clearance between a bridge’s low chord elevation and the design flood elevation) and increased scour potential at bridge locations under future scenarios. The results of this study allow for an evaluation of bridge susceptibility to flood impacts on a countywide scale and highlight which drivers of future flood hazards are most critical. The framework presented here can be applied to other local or regional studies of bridge infrastructure to support transportation planning and design.
Study Area
Harris County is located along the Texas coast and is the third-most populous and one of the fastest growing counties in the US (Harris County, Texas 2018). Between 1990 and 2020, its population grew by 76%, spurring extensive new development, and the county is expected to experience future population growth of 59% over the next 30 years (US Census Bureau 2020). Approximately 7% of Texas’ bridges are located in Harris County (TxDOT 2021). The area is vulnerable to both riverine and coastal flooding driven by intense, short-duration thunderstorms, slower-moving frontal systems, and tropical cyclones. Low topography, poorly draining soils, and an extensive network of bayous and streams increase the risk of flooding for residents and critical infrastructure systems (FEMA 2019). Observational data since 1880 reveals that rainfall intensity for the 1% annual exceedance probability (AEP) event has increased by 12%–22% in the greater Houston area (Van Oldenborgh et al. 2017), and recent flood events have had devastating impacts in the county, such as those observed during Hurricanes Harvey and Ike (Kiaghadi et al. 2020; Rusca et al. 2021). Various studies have projected continued increases in extreme precipitation intensity across parts of Texas (Nielsen-Gammon et al. 2020; Systamatics Cambridge 2015) and the Southern Great Plains (Easterling et al. 2017). Given the chronic flooding concerns faced by the region, as well as the projected increases in population and rainfall intensity, Harris County presents a valuable case study to examine future flood impacts on bridge infrastructure.
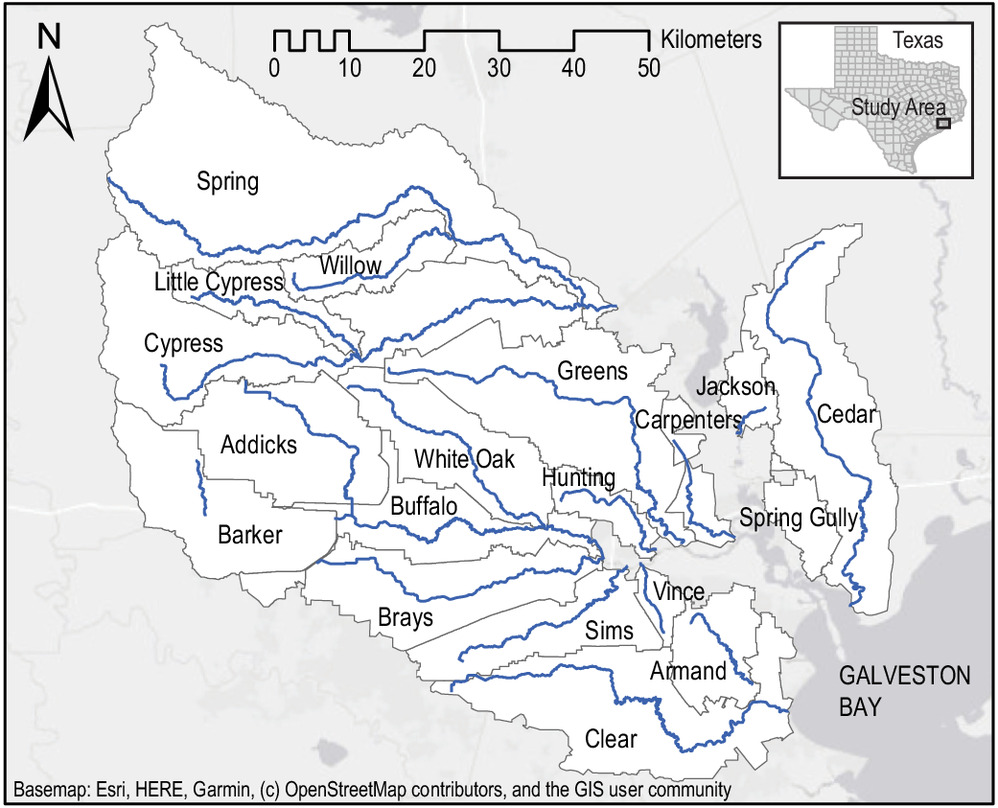
This study focuses on 19 Harris County watersheds (Fig. 1) located within the Galveston Bay–San Jacinto hydrologic unit code (HUC) 4 subregion. The watersheds range in size from to and together are home to a population of 4.5 million residents (Table 1) (Harris County Flood Control District 2021; US Census Bureau 2020). Ten of the 19 watersheds are highly urbanized, with greater than 50% developed area. There are a total of 629 bridges along the main-stem rivers in these watersheds (TxDOT 2021).
| Watershed | Area () | Population (1,000) | Total bridges | Scour-critical bridges | Average ADT () |
|---|---|---|---|---|---|
| Addicks Reservoir | 360 | 390 | 14 | — | 5 |
| Armand Bayou | 153 | 133 | 7 | — | 9 |
| Barker Reservoir | 334 | 113 | 10 | — | 1 |
| Brays Bayou | 334 | 767 | 74 | 4 | 11 |
| Buffalo Bayou | 264 | 506 | 65 | 1 | 17 |
| Carpenters Bayou | 80 | 71 | 24 | — | 8 |
| Cedar Bayou | 515 | 43 | 14 | — | 1 |
| Clear Creek | 521 | 194 | 26 | — | 7 |
| Cypress Creek | 692 | 453 | 39 | 2 | 17 |
| Greens Bayou | 546 | 608 | 75 | 12 | 10 |
| Hunting Bayou | 80 | 76 | 53 | — | 9 |
| Jackson Bayou | 67 | 19 | 5 | — | 1 |
| Little Cypress Creek | 135 | 45 | 12 | — | 2 |
| Sims Bayou | 243 | 298 | 56 | — | 8 |
| Spring Gully | 85 | 66 | 18 | — | 5 |
| Spring Creek | 1,000 | 58 | 20 | 1 | 4 |
| Vince Bayou | 39 | 89 | 21 | — | 9 |
| White Oak Bayou | 287 | 465 | 76 | 5 | 10 |
| Willow Creek | 145 | 77 | 20 | — | 3 |
Methods
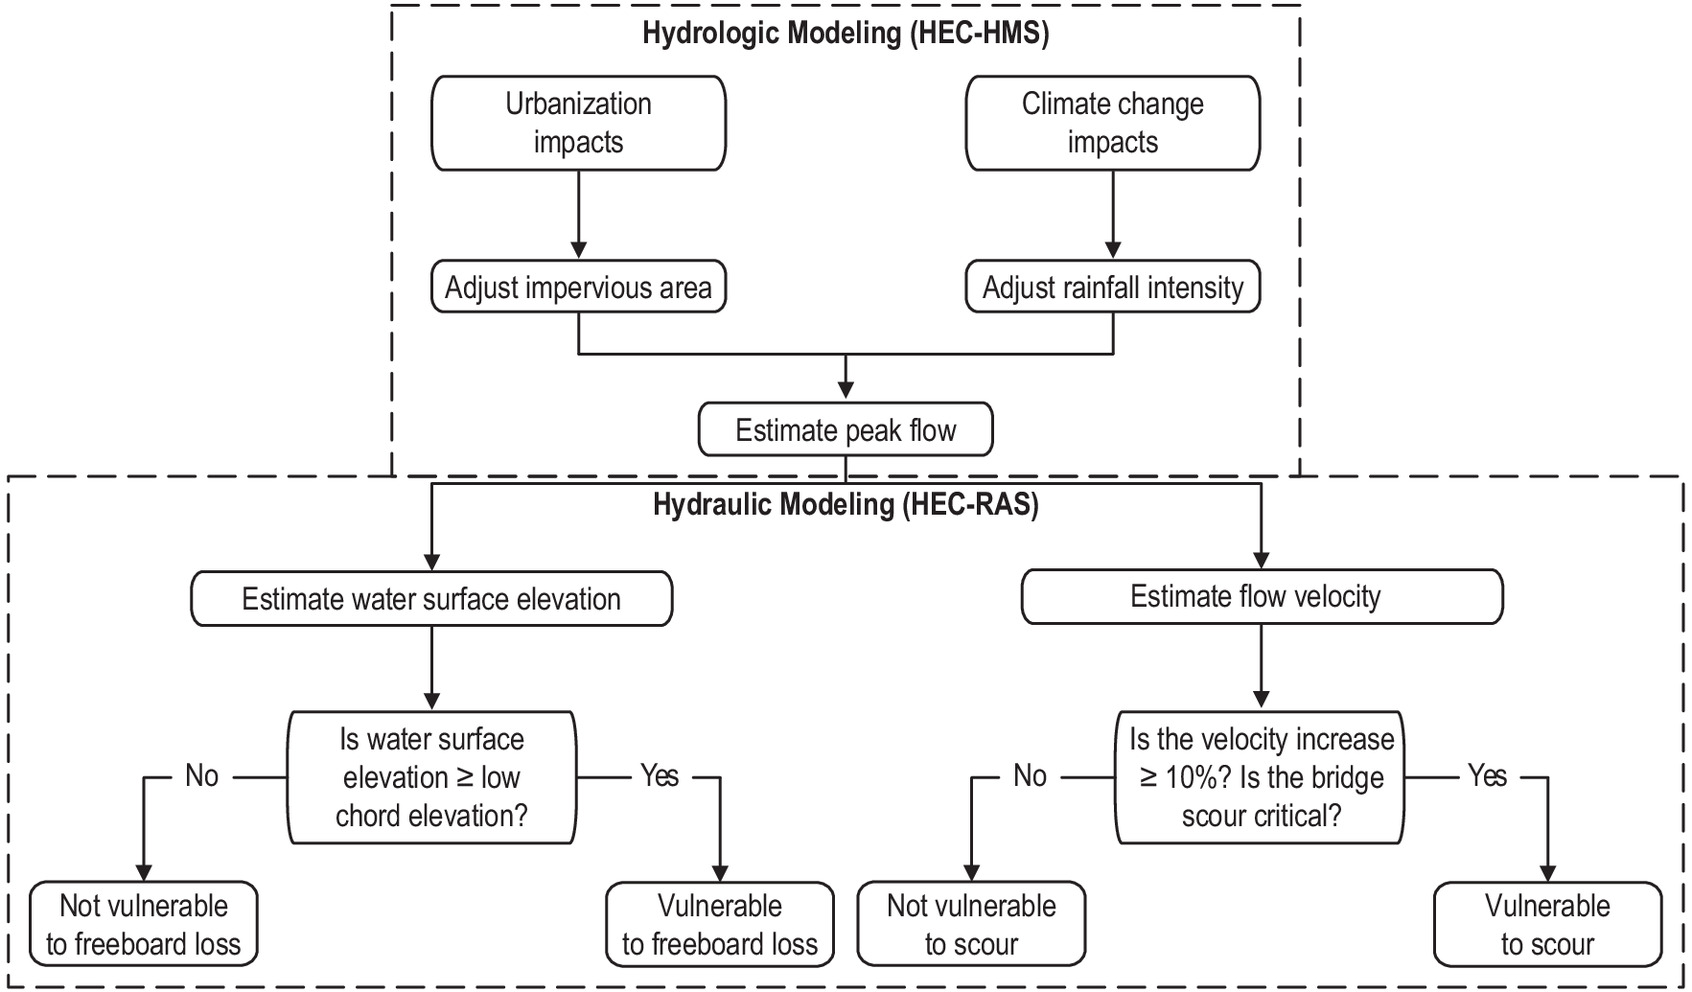
This section summarizes the approach for evaluating bridge vulnerability to loss of freeboard and scour due to high-flow events. The analysis framework is also illustrated in Fig. 2. First, a hydrologic model was applied to estimate peak flows within each watershed. Before running the hydrologic model, the impact of urbanization was incorporated by adjusting the impervious area within each watershed based on current and projected future land use land cover (LULC). The effects of climate change were included by altering the magnitude of hourly rainfall depths based on projected changes in extreme precipitation. Peak discharges from the hydrologic model were then used as boundary conditions in a hydraulic model to simulate flow velocities and water surface elevations at bridge locations within each watershed. This information was used to evaluate the vulnerability of Harris County bridges during high-flow events. The following subsections provide more details for each step.
Data Acquisition
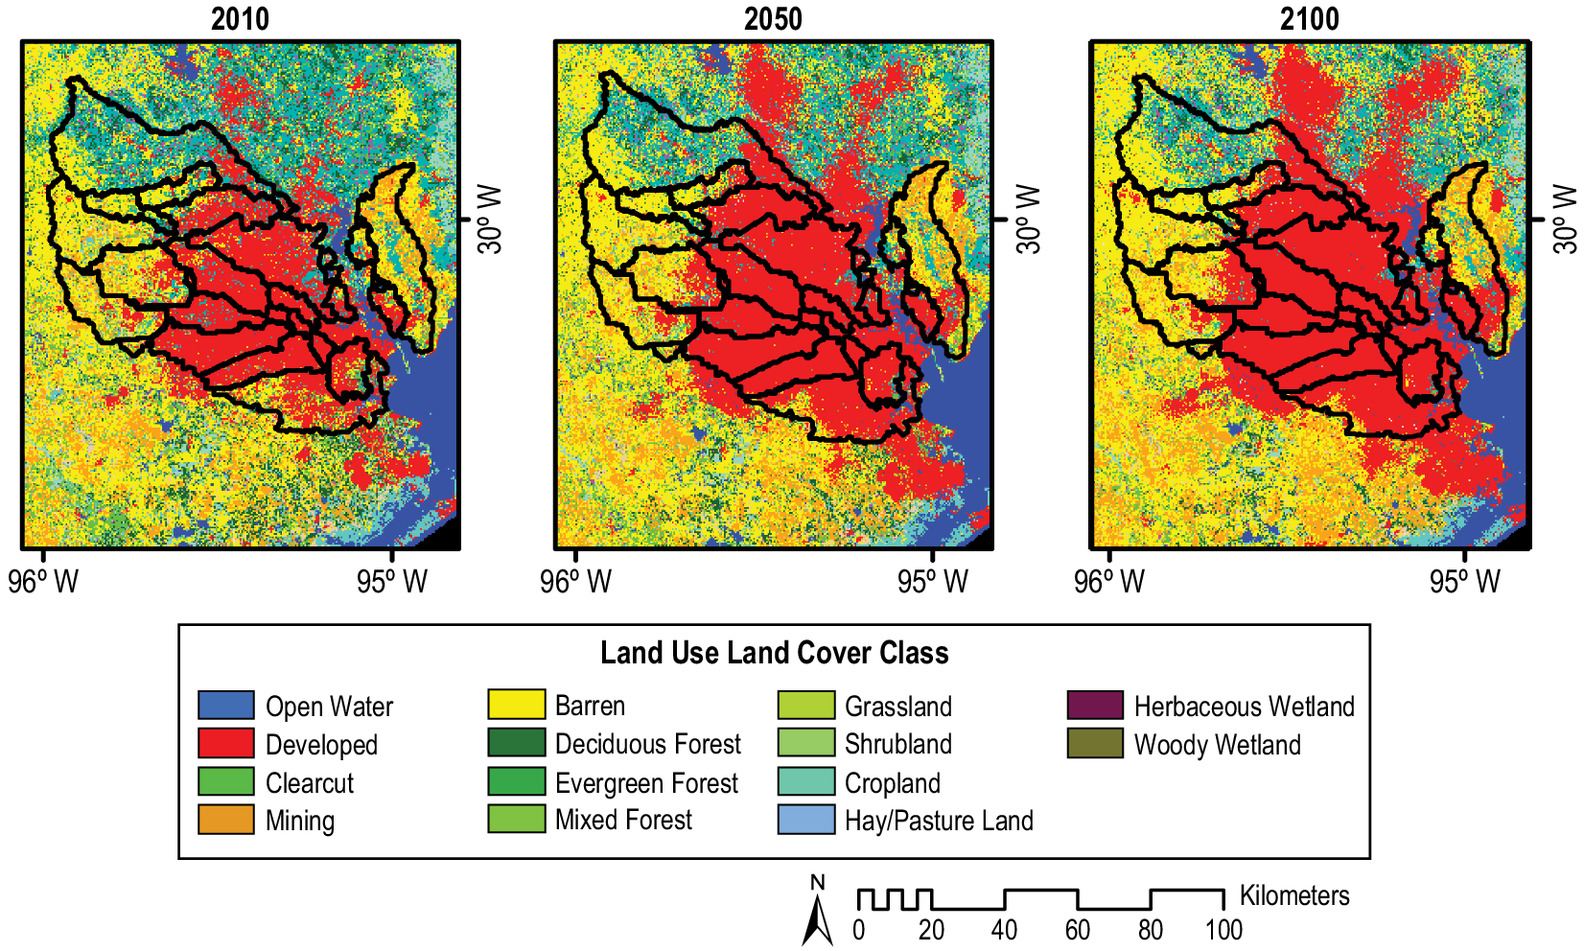
Spatially explicit, 250-m resolution projections of future LULC developed by the USGS’s Forecasting Scenarios of Land-Use Change (FORE-SCE) modeling framework (Sohl et al. 2014) were used to represent future urbanization in 2050 and 2100. These projections are based on A1B, A2, B1, and B2 emissions scenarios developed by the Intergovernmental Panel on Climate Change (IPCC) and used in their third and fourth assessment reports (IPCC 2000). Example LULC maps for the A1B emissions scenario are shown in Fig. 3. In these maps, all urban classes (i.e., low-intensity residential, high-intensity residential, recreational, commercial, industrial, and transportation) from the National Land Cover Database were aggregated into one developed class (Sohl et al. 2014), which was assumed to represent the percent imperviousness in each watershed. The maximum and minimum imperviousness projections in each watershed across the four emissions scenarios (Table 2) were used as upper and lower bounds for the urbanization analysis.
| Watershed | Imperviousness (%) | |||||
|---|---|---|---|---|---|---|
| 2010 | 2050 | 2100 | ||||
| Minimum | Maximum | Minimum | Maximum | Minimum | Maximum | |
| Addicks | 22 | 23 | 28 | 33 | 27 | 40 |
| Armand | 53 | 55 | 66 | 80 | 69 | 88 |
| Barker | 13 | 14 | 15 | 18 | 16 | 22 |
| Brays | 95 | 95 | 97 | 98 | 98 | 99 |
| Buffalo | 82 | 83 | 86 | 89 | 87 | 91 |
| Carpenters | 45 | 48 | 56 | 75 | 59 | 87 |
| Cedar | 8 | 9 | 10 | 17 | 11 | 25 |
| Clear | 53 | 55 | 66 | 80 | 69 | 88 |
| Cypress | 27 | 29 | 36 | 40 | 37 | 44 |
| Greens | 79 | 80 | 90 | 94 | 91 | 98 |
| Hunting | 94 | 95 | 98 | 99 | 98 | 99 |
| Jackson | 15 | 15 | 15 | 18 | 14 | 24 |
| Little Cypress | 4 | 4 | 5 | 6 | 9 | 11 |
| Sims | 92 | 92 | 97 | 99 | 98 | 100 |
| Spring Gully | 61 | 63 | 70 | 81 | 73 | 89 |
| Spring | 11 | 11 | 14 | 18 | 15 | 21 |
| Vince | 99 | 99 | 99 | 100 | 100 | 100 |
| White Oak | 88 | 89 | 93 | 97 | 94 | 99 |
| Willow | 11 | 12 | 21 | 32 | 23 | 42 |
Source: Data from Sohl et al. (2014).
Projections for the percent increase in daily 20-year extreme rainfall in the Southern Great Plains in 2050 and 2100 from Easterling et al. (2017) were used to represent the effects of climate change. These projections were developed by applying the locally constructed analogs (LOCA) approach to downscale GCM data (Pierce et al. 2014). Results from high and low emissions scenarios were used as upper and lower bounds for precipitation changes, resulting in increases of 9%–13% in 2050 and 12%–20% in 2100. These ranges were assumed to apply across three AEP rainfall events considered in this analysis: 2% AEP, 1% AEP, and 0.2% AEP.
A total of 13 scenarios were simulated to assess the individual and combined impacts of climate change and urbanization (Table 3). The base scenario (2010) consisted of existing LULC and historical rainfall intensities derived from the hydrologic models used for this study (see next section). Six midcentury (2050) scenarios were simulated based on the minimum and maximum changes in LULC ( and ), the minimum and maximum changes in rainfall intensity ( and ), and the combined minimum and maximum LULC and precipitation intensity ( and ). The same six scenarios were also simulated using LULC and precipitation projections for the end-of-century (2100) time frame.
| Year | Scenario | Precipitation change (%) | LULC change |
|---|---|---|---|
| 2010 | Base | — | — |
| 2050 | — | min | |
| — | max | ||
| 9 | — | ||
| 13 | — | ||
| 9 | min | ||
| 13 | max | ||
| 2100 | — | min | |
| — | max | ||
| 12 | — | ||
| 20 | — | ||
| 12 | min | ||
| 20 | max |
Hydrologic and Hydraulic Modeling
Existing calibrated hydrologic and hydraulic models were obtained from the Harris County Flood Control District (HCFCD) for the 19 watersheds considered in this study (Harris County Flood Control District 2021). The models were developed as part of FEMA Flood Insurance Studies to delineate floodplains and utilize the Hydrologic Engineering Center’s Hydrological Modeling System (HEC-HMS 3.3) and River Analysis System (HEC-RAS 5.0.7) software.
The HCFCD HEC-HMS models for each watershed were used to determine the peak discharges for each scenario. The models included hydrologic elements (e.g., subbasin, reach, junction, reservoir, diversion, source, and sink) and their connectivity to represent water movement through the watersheds (USACE 2016a). The Green and Ampt loss method (Green and Ampt 1911) was used to calculate rainfall losses from the subbasins. The direct runoff from excess precipitation was calculated using the Clark unit hydrograph transform method (Clark 1945), and the modified Puls routing method (Chow 1959; Henderson 1996) was used to predict flow at the outlet. For this study, the effect of urbanization was modeled by changing the Green and Ampt impervious area at the subbasin scale based on the FORE-SCE LULC maps. The effects of future precipitation were modeled by increasing the hourly rainfall depth inputs by the percentages listed in Table 3.
The HCFCD HEC-RAS models were used to quantify flow depths and velocities at stream-crossing bridge locations. The models included detailed channel and bridge geometry and Manning’s roughness values along the mainstem of the primary stream in each watershed (USACE 2016b). For this study, peak discharges obtained from the HEC-HMS models for each scenario were assigned as discharge boundary conditions to represent upstream and tributary inflows in the HEC-RAS models. All models were run using steady flow analysis.
Bridge Vulnerability Assessment
At each of the 629 bridge locations across the 19 watersheds, the water surface elevation and flow velocity were extracted from the HEC-RAS models at the cross section just upstream of the bridge. The water surface elevations were compared with the bridge low-chord elevations to evaluate vulnerability to loss of freeboard. Bridges were considered vulnerable if the water level was greater than or equal to the low-chord elevation, indicating the point when total loss of freeboard occurs and hydrodynamic forces begin to impact the bridge superstructure. Average daily traffic (ADT) counts for each bridge were extracted from the Texas DOT’s (TxDOT) bridge inventory (TxDOT 2021) to evaluate the criticality of impacted bridges based on traffic volumes. The three ADT categories considered here are low (), moderate (1,000–5,000), and high ().
Flow velocities were compared between the future scenarios (2050 and 2100) and the 2010 scenario to calculate the percent change in velocity at each bridge location. In addition, scour ratings were extracted from TxDOT’s bridge inventory (TxDOT 2021). Scour ratings range from 0–9, with ratings of 0–3 indicating major foundation exposure (scour critical), 4–5 indicating moderate foundation exposure, 6 indicating that no scour evaluation has been conducted, and 7–9 indicating minimal foundation exposure. Scour ratings are based either on observed scour depths measured during physical inspections or on calculated scour depths determined through a scour analysis that accounts for flow velocities and water surface elevations during design floods [e.g., using the guidance in the Federal Highway Administration’s (FHWA) Hydraulic Engineering Circular No. 18 or the TxDOT Scour Evaluation Guide] (FHWA 2012; TxDOT 2020). For this study, bridges rated 0–3 that also experienced a flow velocity increase of were identified as vulnerable due to the combined influence of pre-existing foundation exposure and higher flow velocities.
Results
The modeled changes in peak flow, freeboard loss, and flow velocity are presented in the following sections. The results for the 1% AEP are discussed throughout, as this is the event commonly considered for infrastructure planning. Results for the 2% AEP and 0.2% AEP events are summarized in the Supplemental Materials.
Changes in Peak Flow
The percent increase in peak flow at the outlets of Harris County watersheds for the 1% AEP rainfall event is summarized in Fig. 4. The results for the 2% and 0.2% AEP events are shown in Figs. S1 and S2 . Values shown are the averages of the minimum and maximum projections for the urbanization ( and ), precipitation ( and ), and combined ( and ) scenarios. At the county scale, peak flow increases by an average of 2% in 2050 and 3% in 2100 compared to 2010 under the urbanization scenario. The larger increase between 2010 and 2050 reflects that urbanization is projected to be more rapid in the first half of the century but slow after 2050. Willow Creek, which is minimally developed under the baseline scenario (Table 2) but is projected to experience a 10%–20% increase in imperviousness concentrated near the downstream end of the watershed by 2050 (Fig. 3) and an additional 2%–10% increase by 2100, shows the most significant increase in peak flow due to urbanization, ranging from 12% higher in 2050 to 16% higher in 2100. Other watersheds experience smaller increases in peak flow, with a maximum increase of 7% in Cypress Creek by 2100. As with Willow Creek, Cypress Creek has low imperviousness under the baseline scenario but is projected to see moderate increases in development (10%–15%) by 2100, mostly near the watershed outlet. Several watersheds with low projected changes in imperviousness (), including Barker Reservoir, Brays Bayou, Spring Gully, Vince Bayou, and White Oak Bayou, do not experience significant peak flow increases due to urbanization in 2050 or 2100.
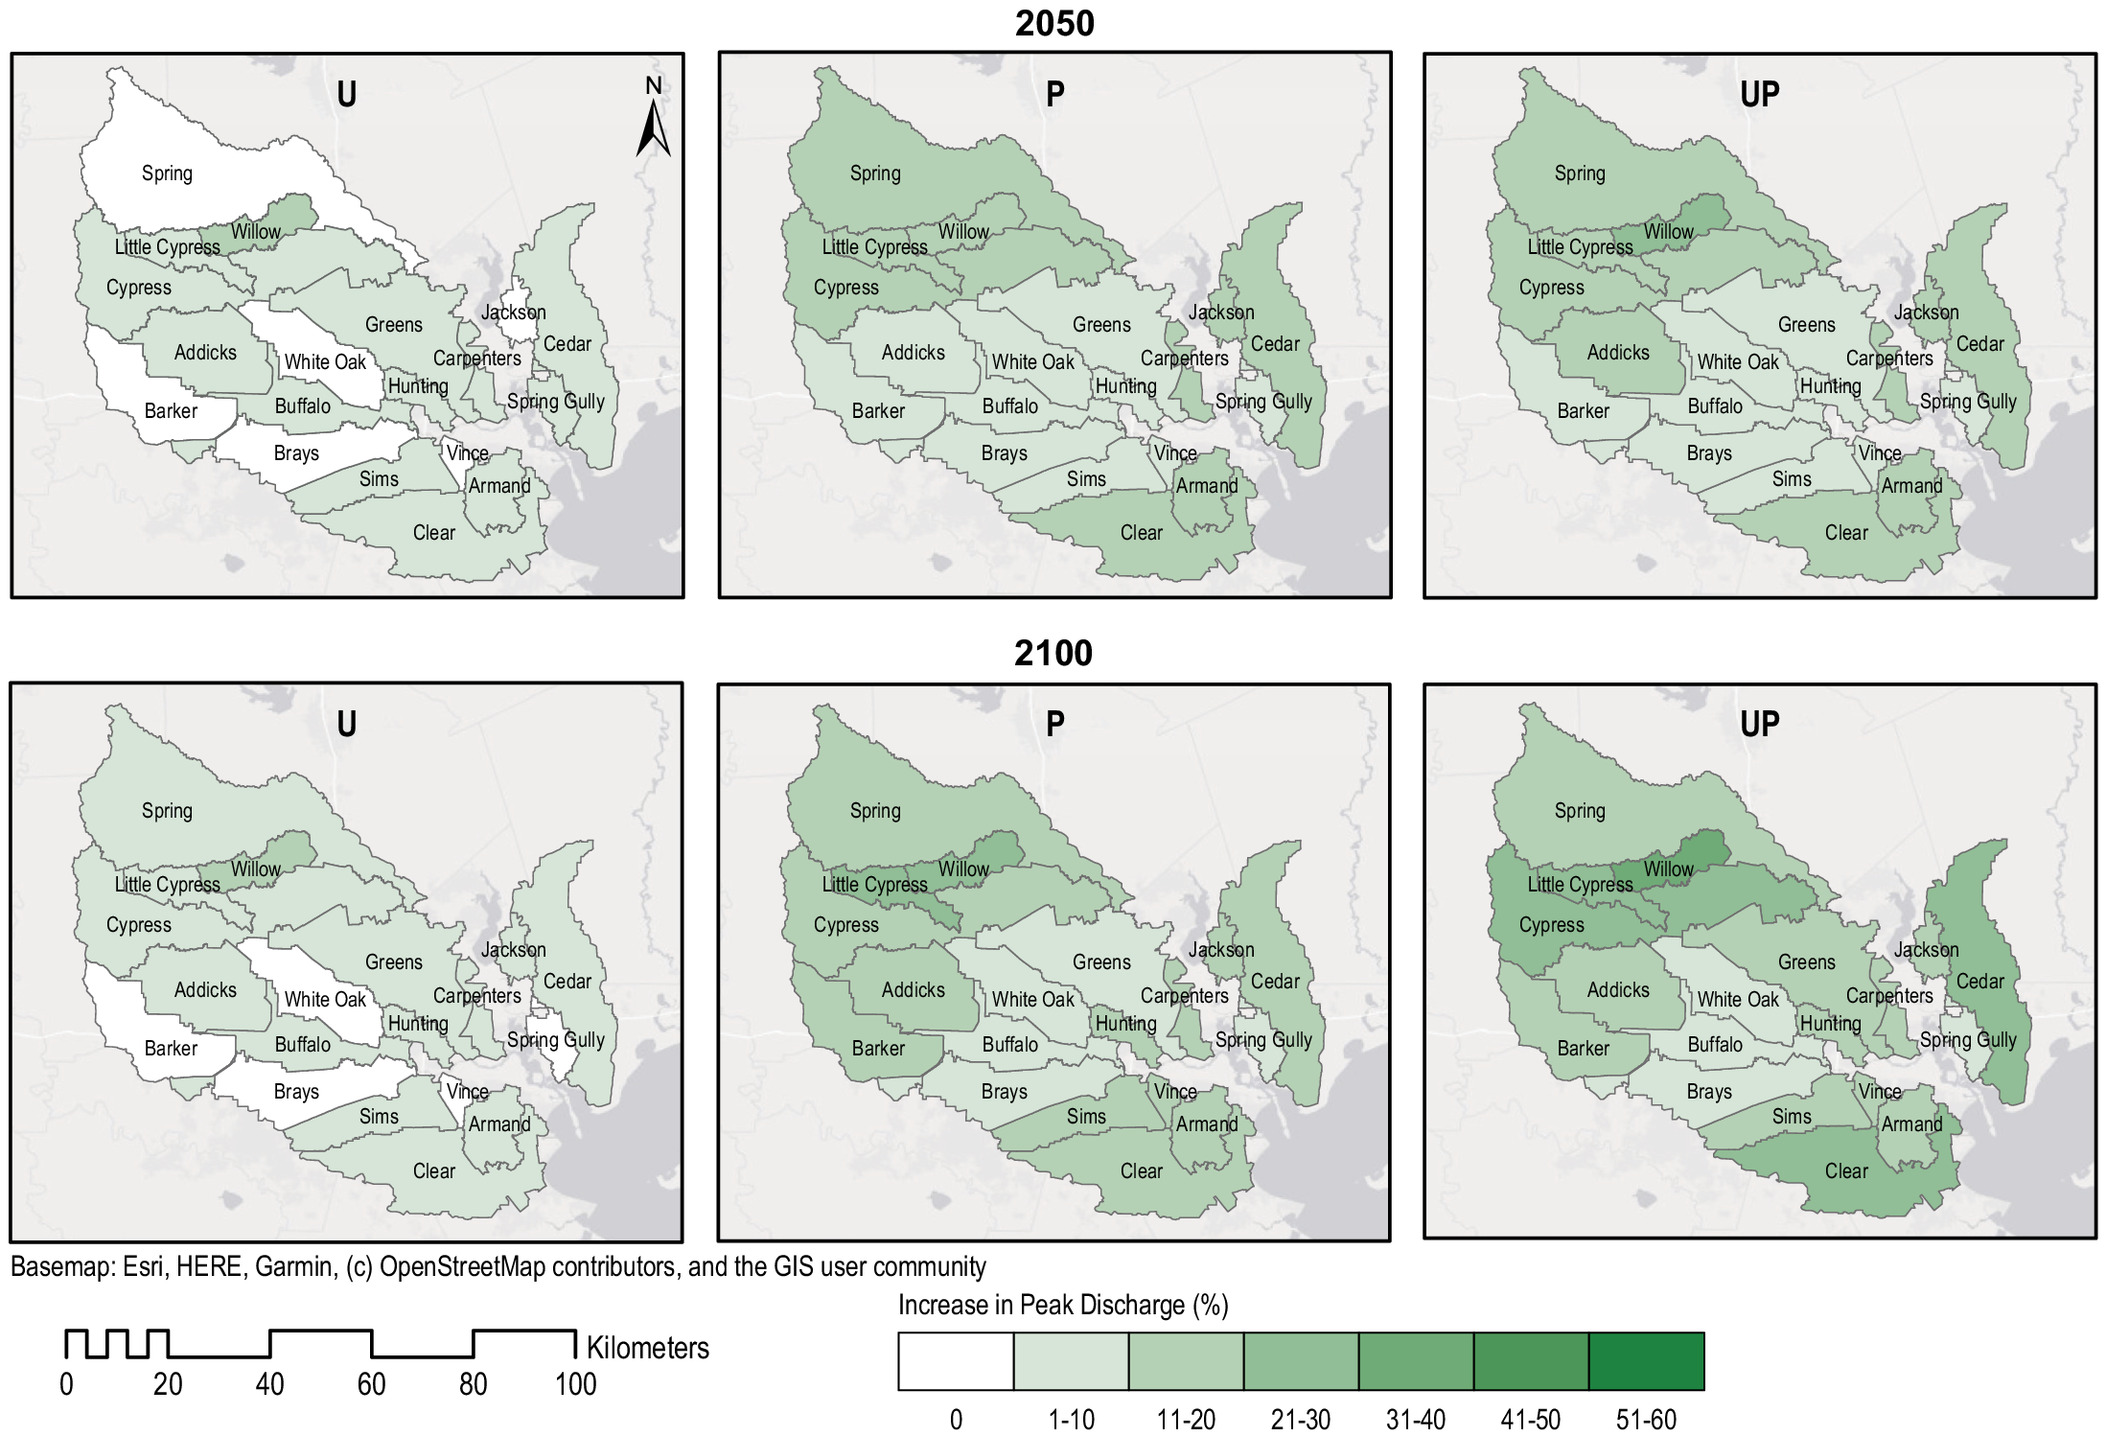
For the precipitation scenario, peak flow increases by 10% in 2050 and 14% in 2100 on average across all watersheds. Little Cypress Creek, a headwater tributary of Cypress Creek, and Willow Creek, a headwater tributary of Spring Creek, experience the most significant changes in peak flow, increasing by 18% and 16%, respectively, in 2050 and 26% and 23%, respectively, in 2100. When urbanization and precipitation are combined, peak flow increases by 11% in 2050 and 17% in 2100 on average. Willow Creek, which experiences the largest increase in peak flow due to urbanization and the second largest increase due to precipitation, also experiences the most significant increase in peak flow under the combined scenario, increasing by 27% in 2050 and 40% in 2100. Increases in peak flow greater than 20% are also observed in Cedar Creek, Clear Creek, Cypress Creek, and Little Cypress Creek by 2100.
Changes in the magnitude and frequency of discharge events due to urbanization and precipitation can influence the adequacy and expected performance level of bridge infrastructure. For example, if a bridge is designed to pass a 2% AEP event based on historical observations, but the magnitude of the 2% AEP event continues to increase due to climate change, the bridge may no longer perform as desired. To assess the potential for changes in flood frequency in Harris County watersheds, the percent difference between the 2% AEP peak discharge in 2050 or 2100 and the 1% AEP peak discharge in 2010 was calculated for each scenario (Table 4). The values in the table show where the magnitude of the 2% AEP peak flow in 2050 or 2100 equals (zero values) or exceeds (positive values) the 1% AEP peak flow for the 2010 scenario. In 2050, this change in frequency occurs in Carpenters Bayou, Clear Creek, Cypress Creek, Hunting Bayou, and Willow Creek for the scenario. In 2100, the , , , and scenarios all cause increases in the 2% AEP magnitude that equal or exceed the 2010 1% AEP magnitude. This change in frequency occurs only for Willow Creek in the scenario and Willow Creek and Cypress Creek in the scenario. The impacts are most substantial for the and scenarios, which affect 16 of the 19 watersheds. The largest impact is observed in Willow Creek, where the magnitude of the 2% AEP peak discharge for the scenario is 26% higher than the 1% AEP peak discharge for the 2010 scenario.
| Watershed | 2050 | 2100 | |||
|---|---|---|---|---|---|
| Addicks | — | — | 2 | — | 8 |
| Armand | — | — | 3 | — | 5 |
| Barker | — | — | — | — | — |
| Brays | — | — | 1 | — | 1 |
| Buffalo | — | — | — | — | — |
| Carpenters | 0 | — | 3 | — | 8 |
| Cedar | — | — | 1 | — | 7 |
| Clear | 1 | — | 3 | — | 9 |
| Cypress | 4 | — | 3 | 2 | 10 |
| Greens | — | — | 2 | — | 3 |
| Hunting | 0 | — | 3 | — | 5 |
| Jackson | — | — | 3 | — | 4 |
| Little Cypress | — | — | 1 | — | 5 |
| Sims | — | — | 2 | — | 3 |
| Spring | — | — | — | — | — |
| Spring Gully | — | — | 3 | — | 4 |
| Vince | — | — | 3 | — | 3 |
| White Oak | — | — | 1 | — | 2 |
| Willow | 10 | 2 | 3 | 3 | 26 |
Note: and represent combined minimum and maximum changes in LULC and precipitation intensity, respectively; represent maximum changes in LULC; and represents maximum changes in rainfall intensity. Scenarios that do not cause the future 2% AEP event magnitude to equal or exceed the baseline 1% AEP magnitude are omitted.
Impacts on Bridges
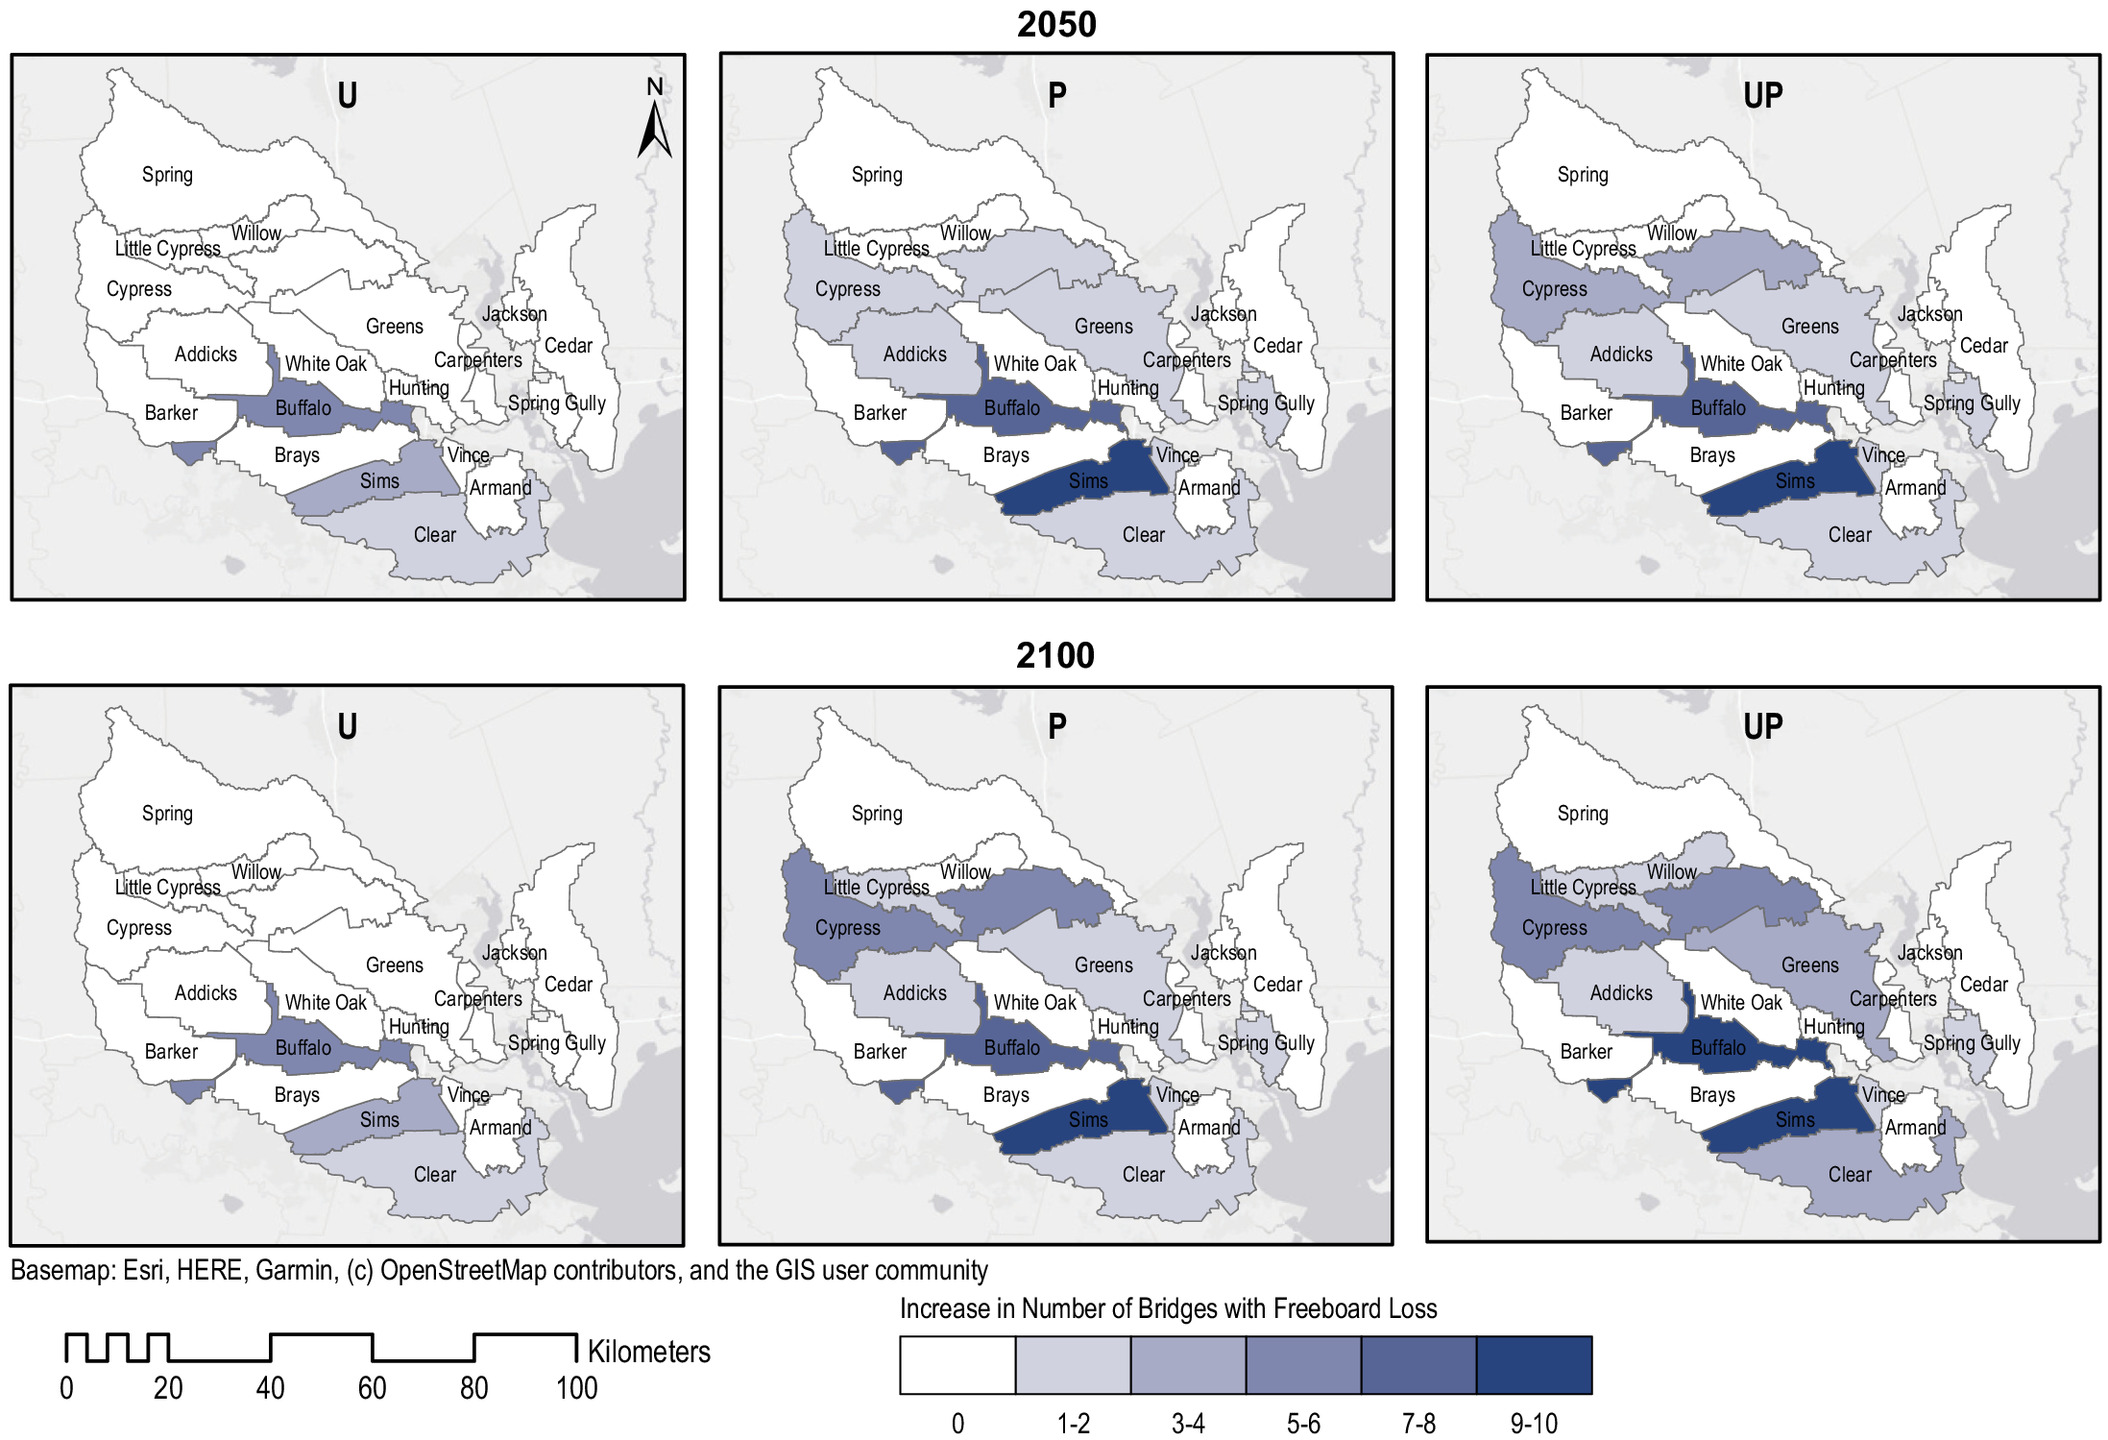
Fig. 5 shows the increase (referenced to the 2010 base scenario) in the number of bridges in each watershed that experience a complete loss of freeboard (i.e., water levels equal or exceed the bridge low chord elevation) for the 1% AEP event. The results for the 2% and 0.2% AEP events are shown in Figs. S3 and S4 . Overall, 289 bridges are susceptible to loss of freeboard under the 2010 base scenario. With urbanization, the number of vulnerable bridges increases by nine in 2050 and 2100. Urbanization has the greatest impact in Buffalo Bayou, affecting five additional bridges, but it also impacts Clear Creek and Sims Bayou. The effects of increased precipitation are larger and more widespread, causing 22 more bridges to become vulnerable in 2050 and 32 in 2100. These impacts are spread across nine watersheds, with the largest impacts in Buffalo Bayou and Sims Bayou. When combined, urbanization and precipitation result in 25 more vulnerable bridges in 2050 and 36 in 2100, impacting the same nine watersheds as the precipitation-only scenarios plus Willow Creek. Sims Bayou experiences the greatest increase in vulnerability, with nine additional bridges affected by 2050 and 10 by 2100. Countywide, the increase in vulnerable bridges between 2010 and 2050 for the combined scenario is more than twice the subsequent increase from 2050 to 2100, reflecting the larger projected increases in urbanization and precipitation intensity in the first half of the century.
For all scenarios, more than 60% of the additional bridges impacted by freeboard loss have high () ADT (Table 5). A total of 18%–28% of bridges impacted under future scenarios have moderate (1,000–5,000) ADT and 8%–11% have low () ADT. The high and moderate ADT categories experience similar percent increases in bridges vulnerable to freeboard loss, increasing by 13% by 2100 for the combined urbanization and precipitation scenario, as compared to only 9% for the low ADT category.
| Counts | 2010 | 2050 | 2100 | ||||
|---|---|---|---|---|---|---|---|
| Baseline | U | P | UP | U | P | UP | |
| 34 | 1 | 2 | 2 | 1 | 3 | 3 | |
| 1,000–5,000 | 72 | 2 | 4 | 6 | 2 | 9 | 9 |
| 183 | 6 | 16 | 17 | 6 | 20 | 24 | |
| Total | 289 | 9 | 22 | 25 | 9 | 32 | 36 |
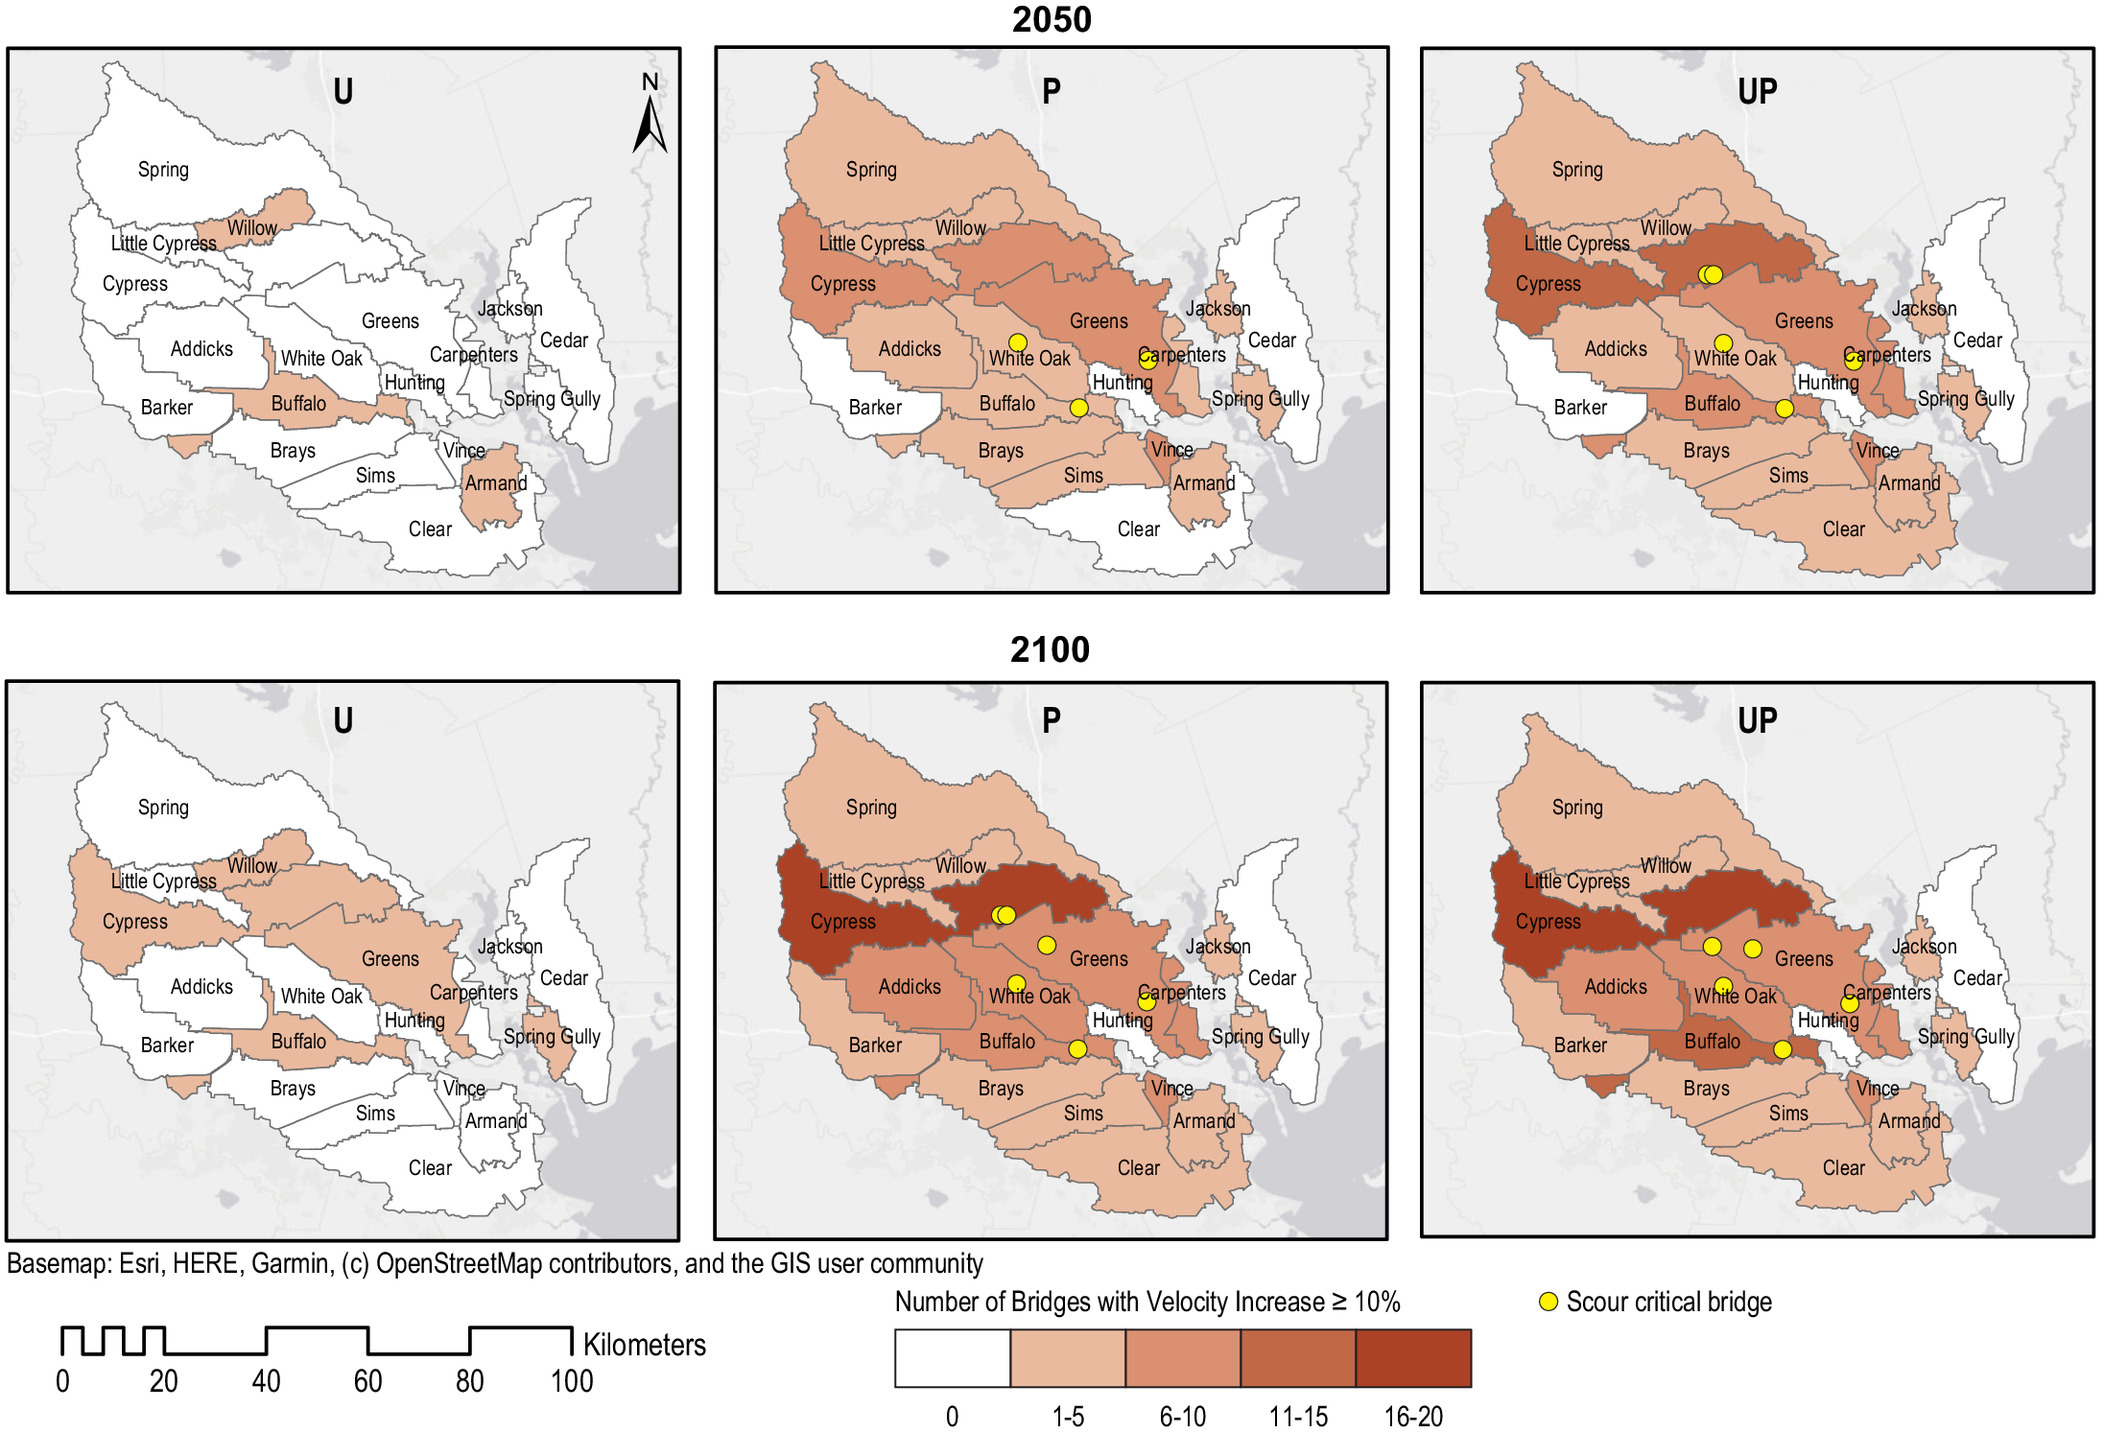
An increase in flow velocity due to changes in discharge can also pose a risk to bridge structures, especially those that are classified as scour critical. The number of bridges in each watershed where velocity increases by is shown for the 1% AEP event in Fig. 6. The results for the 2% and 0.2% AEP events are shown in Figs. S5 and S6 . The scour ratings of bridges with increase in velocity are summarized in Table 6, and the locations of scour-critical bridges (scour ratings 0–3) are also indicated in Fig. 6. For the urbanization scenario, a total of three bridges in three different watersheds are impacted by a velocity increase in 2050. These bridges are classified as having either minimal (scour ratings 7–9) or moderate (scour ratings 4–5) foundation exposure, but none are scour critical. In 2100, six bridges are impacted due to urbanization, but again none are assessed as scour critical. Increased precipitation causes more widespread impacts, affecting a total of 46 bridges (two of which are scour critical) in 2050 and 80 bridges (five of which are scour critical) in 2100. These impacts are noted across all watersheds except Cedar Creek and Hunting Bayou. Cypress Creek sees the largest impacts, with 16 bridges experiencing a velocity increase of by 2100. The combined scenario exhibits similar patterns as the precipitation-only scenario, with 60 bridges (four of which are scour critical) impacted in 2050 and 93 bridges (five of which are scour critical) in 2100. Cypress Creek and Buffalo Bayou have the largest number of impacted bridges (18 and 13, respectively, by 2100). For all scenarios, the majority of bridges impacted by velocity increases are rated as having moderate foundation exposure.
| Scour rating | 2010 | 2050 | 2100 | ||||
|---|---|---|---|---|---|---|---|
| Baseline | U | P | UP | U | P | UP | |
| 0–3 | 25 | 0 | 2 | 4 | 0 | 5 | 5 |
| 4–5 | 314 | 2 | 31 | 38 | 5 | 46 | 54 |
| 6 | 1 | 0 | 0 | 0 | 0 | 0 | 1 |
| 7–9 | 289 | 1 | 13 | 18 | 1 | 29 | 33 |
| Total | 629 | 3 | 46 | 60 | 6 | 80 | 93 |
Discussion
The results of the hydrologic modeling indicate that the combined effects of urbanization and changes in precipitation intensity can lead to large increases (as high as 40%) in peak flows across Harris County watersheds. Five of the 19 watersheds experience an increase in peak flow of greater than 20% for the 1% AEP event. These five watersheds have low to moderate imperviousness (8%–55%) under the 2010 baseline condition and experience moderate increases in imperviousness (2%–33%) by 2100. However, the observed increase in peak flow magnitude is driven primarily by changes in extreme precipitation rather than changes in LULC. In fact, the average climate-driven increase in peak flow is more than four times higher than the average increase due to urbanization. Variations in the magnitude of peak flow increases across watersheds may be driven by a variety of watershed characteristics, including the available storage area, topography, number of diversions, and spatial distribution of LULC.
In many Harris County watersheds, peak flows that previously occurred once every 100 years on average could occur at least twice as frequently by the end of the century. As the frequency and magnitude of peak flows change over the 21st century, bridges spanning waterways could experience flow events exceeding their hydraulic design criteria, potentially leading to an increased prevalence of flood-driven disruptions and unanticipated hydraulic loads. Given that the increases in peak flow and resulting impacts to bridges are generally greater from 2010 to 2050 than from 2050 to 2100, there is an immediate need to incorporate future projections into current transportation planning efforts to address potential impacts by midcentury.
By coupling hydrologic and hydraulic modeling, this analysis provides greater insight into potential mechanisms for bridge vulnerability than previous studies, which used peak flow increase as a proxy for vulnerability without considering local flow conditions at bridge locations (e.g., Wright et al. 2012). The importance of hydraulic modeling can be readily observed by comparing the spatial pattern of peak flow increases determined from hydrologic modeling (Fig. 4) with the patterns of freeboard loss and velocity increases determined from hydraulic modeling (Figs. 5 and 6). For example, although Willow Creek exhibits the largest increase in peak flow (40%) due to urbanization and increased precipitation by 2100, only one additional bridge in the watershed experiences loss of freeboard, and only two bridges (neither of which are considered scour critical) experience a velocity increase . Thus, while flow increases are large, the existing bridge infrastructure appears to be adequate to handle the additional flow. In contrast, Buffalo Bayou experiences a more moderate increase in peak flow (7%), but this results in nine additional bridges experiencing loss of freeboard and 13 bridges (one of which is scour critical) experiencing a velocity increase . From a regional planning perspective, Buffalo Bayou, which has the highest average ADT among all watersheds, would thus be a higher priority for bridge vulnerability assessment than Willow Creek.
Changes in water levels due to increases in urbanization and precipitation intensity lead to a 9% increase in the number of bridges impacted by loss of freeboard for the 1% AEP event by 2050 and a 12% increase by 2100. Given that the majority of these bridges have high ADT, overtopping or structural damage due to hydraulic loading at these bridges could cause greater traffic disruptions due to their high usage. Even at low and moderate ADT bridges, which experience higher percent increases in freeboard loss, flood-related disruptions can cause delays and limit mobility, particularly if alternative routes are not available. Although beyond the scope of this study, dynamic traffic modeling could be applied in the future to assess how a disruption at one or multiple bridges would impact travel times and delays throughout the regional transportation network. Insights derived from such modeling could be especially applicable for emergency response or evacuation planning.
The findings of this study provide an initial assessment of locations where future changes in urbanization and precipitation may increase velocity and scour potential. Of the bridges that experience a velocity increase of under the combined urbanization and precipitation scenario, 70% are rated as having major or moderate foundation exposure in 2050 and 63% in 2100. Existing issues with foundation exposure at these bridges could be exacerbated by higher-velocity flows and undermine bridge stability. Although a formal scour analysis would be needed to determine the critical velocity increase and resulting effects at each bridge location, the presented approach can be used to prioritize bridges for inspection and further evaluation, thus providing a useful screening tool for transportation managers. Future work could assess scour potential in more detail using guidance in FHWA Hydraulic Engineering Circular No. 18 or the TxDOT Scour Evaluation Guide (FHWA 2012; TxDOT 2020).
The presented framework for bridge vulnerability assessment can be utilized by agencies and jurisdictions responsible for managing transportation infrastructure, including TxDOT, Harris County, or the City of Houston, to identify potentially vulnerable bridges and prioritize mitigation activities. This framework is transferable to other jurisdictions where hydrologic and hydraulic models exist or can be developed, such as the many municipalities in the US where FEMA floodplain studies have been conducted using such models. The input data required to analyze future scenarios of climate change and urbanization can leverage national-scale studies and data sets such as the ones used in this study, and bridge data can be extracted from the National Bridge Inventory (FHWA 2022) or state-specific data sets.
Several additional limitations could be addressed through follow-on studies. Although this study considered each watershed individually, changes observed in upstream watersheds can propagate downstream, potentially leading to larger increases in peak flows, water surface elevations, and velocities in other watersheds. The development of a combined model of interconnected watersheds would provide more insight into the propagation of upstream flood peaks and the resulting impacts on bridges downstream. Second, while this study quantifies water levels and velocities at bridge locations, it does not account for the structural condition of each bridge, which will ultimately determine the potential for failure during high-flow events. Once bridges are identified as being vulnerable to loss of freeboard or increased flow velocities using the presented approach, subsequent analyses of hydraulic loading and structural response could inform decisions about maintenance, retrofitting, or replacement.
Conclusions
This study presents a regional screening tool to assess the impacts of climate change and urbanization on stream-crossing bridges in Harris County, Texas. The framework improves on previous studies by applying both hydrologic and hydraulic models to simulate local flow conditions at bridge locations based on meteorological inputs and land use in the contributing watersheds. The findings suggest that projected changes in precipitation have a larger impact on peak flows than projected changes in urbanization. In addition, bridge vulnerability to loss of freeboard or increased flow velocity due to higher peak flows is observed in 17 of the 19 watersheds studied. Increases in peak flows and resulting impacts to bridges are projected to be greater from 2010 to 2050 than from 2050 to 2100, highlighting the importance of incorporating climate nonstationarity and changes in urbanization into current bridge design and hydraulic analysis guidelines to address potential impacts by midcentury. Overall, outputs from the presented bridge vulnerability assessment approach can assist decision-makers in identifying potentially vulnerable bridges and prioritizing maintenance, retrofitting, or replacement efforts that reduce susceptibility to expected climate change and urbanization.
Supplemental Materials
File (supplemental_materials_nhrefo.nheng-1720_pervaiz.pdf)
- Download
- 5.90 MB
Data Availability Statement
All data and models that support the findings of this study are available from the corresponding author upon request.
Acknowledgments
This study was supported by the Texas Department of Transportation (TxDOT) through Project 0-7068. The authors thank the TxDOT research team, Habib Ahmari, and Simon Chao for their insightful discussions and feedback.
References
Alipour, A. 2017. “Enhancing resilience of bridges to extreme events by rapid damage assessment and response strategies.” Transp. Res. Rec. 2604 (1): 54–62. https://doi.org/10.3141/2604-07.
Batchabani, E., E. Sormain, and M. Fuamba. 2016. “Potential impacts of projected climate change on flooding in the Riviere des Prairies basin, Quebec, Canada: One-dimensional and two-dimensional simulation-based approach.” J. Hydrol. Eng. 21 (12): 05016032. https://doi.org/10.1061/(ASCE)HE.1943-5584.0001461.
Bhatkoti, R., G. E. Moglen, P. M. Murray-Tuite, and K. P. Triantis. 2016. “Changes to bridge flood risk under climate change.” J. Hydrol. Eng. 21 (12): 04016045. https://doi.org/10.1061/(ASCE)HE.1943-5584.0001448.
Chow, V. 1959. Handbook of applied hydrology. New York: McGraw Hill.
Clark, C. 1945. “Storage and the unit hydrograph.” Trans. Am. Soc. Civ. Eng. 110 (1): 1419–1446. https://doi.org/10.1061/TACEAT.0005800.
Easterling, D. R., et al. 2017. “Precipitation change in the United States.” In Climate science special report: Fourth national climate assessment. Washington, DC: US Global Change Research Program.
FEMA. 2019. “Flood insurance study: Harris County, Texas and incorporated areas.” Accessed June 26, 2022. https://map1.msc.fema.gov/data/48/S/PDF/48201CV001G.pdf?LOC=c1a988403ce020cf32f2a2dfe8d1c3c9.
Feng, B., Y. Zhang, and R. Bourke. 2021. “Urbanization impacts on flood risks based on urban growth data and coupled flood models.” Nat. Hazards 106 (1): 613–627. https://doi.org/10.1007/s11069-020-04480-0.
FHWA (Federal Highway Administration). 2012. “Evaluating scour at bridges: Fifth edition.” Accessed May 28, 2022. https://www.fhwa.dot.gov/engineering/hydraulics/pubs/hif12003.pdf.
FHWA (Federal Highway Administration). 2022. “National bridge inventory.” Accessed January 20, 2022. https://www.fhwa.dot.gov/bridge/nbi.cfm.
Flint, M. M., O. Fringer, S. L. Billington, D. Freyberg, and N. S. Diffenbaugh. 2017. “Historical analysis of hydraulic bridge collapses in the continental United States.” J. Infrastruct. Syst. 23 (3): 04017005. https://doi.org/10.1061/(ASCE)IS.1943-555X.0000354.
Furl, C., H. Sharif, J. W. Zeitler, A. El Hassan, and J. Joseph. 2018. “Hydrometeorology of the catastrophic Blanco river flood in south Texas, May 2015.” J. Hydrol. Reg. Stud. 15 (Jun): 90–104. https://doi.org/10.1016/j.ejrh.2017.12.001.
Green, W. H., and G. Ampt. 1911. “Studies on soil phyics.” J. Agric. Sci. 4 (1): 1–24. https://doi.org/10.1017/S0021859600001441.
Harris County Flood Control District. 2021. “Model and map management system.” Accessed January 20, 2022. https://www.hcfcd.org/Resources/Interactive-Mapping-Tools/Model-and-Map-Management-M3-System.
Harris County, Texas. 2018. “Population report.” Accessed May 26, 2022. https://budget.harriscountytx.gov/doc/Budget/fy2019/FY19_Population_Report.pdf.
Henderson, F. M. 1996. Open channel flow. New York: Macmillan.
IPCC (Intergovernmental Panel on Climate Change). 2000. “IPCC special report: Emissions scenarios, summary for policymakers.” Accessed January 30, 2022. https://www.ipcc.ch/site/assets/uploads/2018/03/sres-en.pdf.
Khelifa, A., L. A. Garrow, M. J. Higgins, and M. D. Meyer. 2013. “Impacts of climate change on scour-vulnerable bridges: Assessment based on HYRISK.” J. Infrastruct. Syst. 19 (2): 138–146. https://doi.org/10.1061/(ASCE)IS.1943-555X.0000109.
Kiaghadi, A., A. Govindarajan, R. S. Sobel, and H. S. Rifai. 2020. “Environmental damage associated with severe hydrologic events: A LiDAR-based geospatial modeling approach.” Nat. Hazards 103 (3): 2711–2729. https://doi.org/10.1007/s11069-020-04099-1.
Meehl, G. A., et al. 2007. “Global climate projections.” In Climate change 2007: The physical science basis. Contribution of working Group I to the fourth assessment report of the intergovernmental panel on climate change. Cambridge, UK: Cambridge University Press.
Mondoro, A., D. M. Frangopol, and M. Soliman. 2017. “Optimal risk-based management of coastal bridges vulnerable to hurricanes.” J. Infrastruct. Syst. 23 (3): 04016046. https://doi.org/10.1061/(ASCE)IS.1943-555X.0000346.
Montz, B. E. 2000. “The generation of flood hazards and disasters by urban development of floodplains.” Floods 1 (Sep): 116–127.
Naderi, N. 2018. “Numerical simulation of hydrodynamic forces on bridge decks.” Ph.D. thesis, Dept. of Civil Engineering and Geosciences, TU Delft.
Nasr, A., I. Björnsson, D. Honfi, O. Larsson Ivanov, J. Johansson, and E. Kjellström. 2021. “A review of the potential impacts of climate change on the safety and performance of bridges.” Sustainable Resilient Infrastruct. 6 (3–4): 192–212. https://doi.org/10.1080/23789689.2019.1593003.
Neumann, J. E., et al. 2015. “Climate change risks to US infrastructure: Impacts on roads, bridges, coastal development, and urban drainage.” Clim. Change 131 (1): 97–109. https://doi.org/10.1007/s10584-013-1037-4.
Nielsen-Gammon, J., J. Escobedo, C. Ott, J. Dedrick, and A. Van Fleet. 2020. “Assessment of historic and future trends of extreme weather in Texas, 1900-2036.” Accessed January 20, 2022. https://oaktrust.library.tamu.edu/handle/1969.1/188618.
NOAA (National Oceanic and Atmospheric Administration). 2022. “Billion-dollar weather and climate disasters.” Accessed February 15, 2022. https://www.ncdc.noaa.gov/billions/summary-stats#temporal-comparison-div.
Pierce, D. W., D. R. Cayan, and B. L. Thrasher. 2014. “Statistical downscaling using localized constructed analogs (LOCA).” J. Hydrometeorol. 15 (6): 2558–2585. https://doi.org/10.1175/JHM-D-14-0082.1.
Pregnolato, M., A. O. Winter, D. Mascarenas, A. D. Sen, P. Bates, and M. R. Motley. 2022. “Assessing flooding impact to riverine bridges: An integrated analysis.” Nat. Hazards Earth Syst. Sci. 22 (5): 1559–1576. https://doi.org/10.5194/nhess-22-1559-2022.
Rainey, J. L., S. D. Brody, G. E. Galloway, and W. E. Highfield. 2021. “Assessment of the growing threat of urban flooding: A case study of a national survey.” Urban Water J. 18 (5): 375–381. https://doi.org/10.1080/1573062X.2021.1893356.
Rusca, M., G. Messori, and G. Di Baldassarre. 2021. “Scenarios of human responses to unprecedented social-environmental extreme events.” Earth’s Future 9 (4): e2020EF001911. https://doi.org/10.1029/2020EF001911.
Sohl, T. L., et al. 2014. “Spatially explicit modeling of 1992–2100 land cover and forest stand age for the conterminous United States.” Ecol. Appl. 24 (5): 1015–1036. https://doi.org/10.1890/13-1245.1.
Systamatics Cambridge. 2015. “Central Texas extreme weather and climate change vulnerability assessment of regional transportation infrastructure.” In Capital area metropolitan planning organization. Austin, TX: Systamatics Cambridge.
TxDOT (Texas DOT). 2020. “Scour evaluation guide.” Accessed May 28, 2022. https://ftp.txdot.gov/pub/txdot-info/library/pubs/bus/bridge/scour-guide.pdf.
TxDOT (Texas DOT). 2021. “TxDOT bridge inventory.” Accessed January 20, 2022. https://www.txdot.gov/.
USACE. 2016a. HEC-HMS user’s manual version 4.2. Davis, CA: USACE.
USACE. 2016b. HEC-RAS user’s manual version 5.0. Davis, CA: USACE.
US Census Bureau. 2020. “County population totals.” Accessed May 26, 2022. https://www.census.gov/data/tables/time-series/demo/popest/2020s-counties-total.html.
Van Oldenborgh, G. J., K. Van Der Wiel, A. Sebastian, R. Singh, J. Arrighi, F. Otto, K. Haustein, S. Li, G. Vecchi, and H. Cullen. 2017. “Attribution of extreme rainfall from Hurricane Harvey, August 2017.” Environ. Res. Lett. 12 (12): 124009. https://doi.org/10.1088/1748-9326/aa9ef2.
Westra, S., H. J. Fowler, J. P. Evans, L. V. Alexander, P. Berg, F. Johnson, E. J. Kendon, G. Lenderink, and N. Roberts. 2014. “Future changes to the intensity and frequency of short-duration extreme rainfall.” Rev. Geophys. 52 (3): 522–555. https://doi.org/10.1002/2014RG000464.
Wright, L., P. Chinowsky, K. Strzepek, R. Jones, R. Streeter, J. B. Smith, J.-M. Mayotte, A. Powell, L. Jantarasami, and W. Perkins. 2012. “Estimated effects of climate change on flood vulnerability of US bridges.” Mitigation Adapt. Strategies Global Change 17 (8): 939–955. https://doi.org/10.1007/s11027-011-9354-2.
Zhao, G., H. Gao, and L. Cuo. 2016. “Effects of urbanization and climate change on peak flows over the San Antonio River Basin, Texas.” J. Hydrometeorol. 17 (9): 2371–2389. https://doi.org/10.1175/JHM-D-15-0216.1.
Information & Authors
Information
Published In

Natural Hazards Review
Volume 24 • Issue 3 • August 2023
Copyright
This work is made available under the terms of the Creative Commons Attribution 4.0 International license, https://creativecommons.org/licenses/by/4.0/.
History
Received: Jul 29, 2022
Accepted: Feb 27, 2023
Published online: May 12, 2023
Published in print: Aug 1, 2023
Discussion open until: Oct 12, 2023
ASCE Technical Topics:
- Architectural engineering
- Bridge engineering
- Bridge tests
- Bridges
- Building management
- Climate change
- Climates
- Engineering fundamentals
- Environmental engineering
- Field tests
- Infrastructure
- Infrastructure vulnerability
- Maintenance and operation
- Meteorology
- Precipitation
- Structural engineering
- Tests (by type)
- Urban and regional development
- Urban areas
Authors
Metrics & Citations
Metrics
Citations
Download citation
If you have the appropriate software installed, you can download article citation data to the citation manager of your choice. Simply select your manager software from the list below and click Download.
Cited by
- Fahad Pervaiz, Michelle Hummel, Bhupendra Acharya, Shih-Ho Chao, Habib Ahmari, Evaluation of Countermeasures for Hydraulic Loading on Bridges, Journal of Bridge Engineering, 10.1061/JBENF2.BEENG-6494, 29, 6, (2024).
- Nahal Maymandi, Michelle A. Hummel, Effect of Sea-Level Rise on Hurricane-Induced Compound Flooding and Economic Damages, World Environmental and Water Resources Congress 2024, 10.1061/9780784485477.006, (71-79), (2024).