Watershed-Scale Evaluation of Flood Mitigation Benefits from Surface Water Diversion and Subsurface Injection in Coastal Louisiana
Publication: Journal of Water Resources Planning and Management
Volume 149, Issue 10
Abstract
Coastal regions are witnessing unsustainable aquifer overdrafts, leading to subsidence and increased flooding. Flooding introduces its own assortment of problems because managing substantial volumes of stormwater is often infeasible through surface storage in low-gradient areas. Aquifer recharge operations, such as aquifer storage and recovery (ASR), in conjunction with small-scale surface reservoirs, has the potential to supplement the function of flood retention basins and provide additional flood relief to local communities. The purpose of this study is to test the effectiveness of surface water capture and injection at the local watershed level in mitigating flood impacts. The study is based on using a hydrologic-hydraulic numerical modeling analysis for a pilot watershed that was found to be suitable for aquifer recharge operations in the coastal region of south central Louisiana in the US. The concept of capturing excess surface water and injecting into the subsurface was found most effective during storms with multiple flood peaks and was able to add more than 75% reduction in flood peaks compared with using a retention basin alone. A key finding is that diverting surface flows into the subsurface can be effective only when implemented in conjunction with intermittent storage. The results also showed that the benefit of such operations is realized in the case of storms that have multiple flood peaks. The results have implications on the use of subsurface injections via techniques such as ASR for flood mitigation, in addition to their original purpose for groundwater management and sustainability.
Introduction
Stresses on groundwater aquifers has increased substantially over time in many areas of the world, including the coastal regions of the US (Thomas et al. 2000; Liu et al. 2008; Konikow 2013; Eldardiry et al. 2016; Alam et al. 2020, 2021). In coastal regions, overpumping can lead to subsidence, increased flooding and relative sea level rise, and saltwater intrusion (Budhu and Adiyaman 2010; Dokka 2011; Jones et al. 2016; Zektser et al. 2005). Several water management strategies, including aquifer storage and recovery (ASR), have been implemented to capture excess surface water and inject it into a groundwater aquifer for later recovery and use.
The same coastal regions also suffer typically from repetitive flooding that is caused by a combination of inland and tropical storms. A common strategy for mitigating flooding impacts is through the use of surface detention reservoirs. However, the design of such reservoirs is not always implemented with sustainable approaches for repurposing diverted floodwater for alternate use or for offsetting the overuse of groundwater resources. Therefore, there is an emerging interest to assess whether strategies such as ASR, in conjunction with surface storage, can address some of these concerns while also providing additional relief from flooding and depleted aquifers.
The question of whether diverting surface water into the subsurface through techniques such as ASR can provide flood relief through conveying of surface stormwater into the subsurface has been addressed in two recent studies in the US state of Texas. A drainage reuse initiative (DRI) feasibility study was conducted for Harris County, Texas, to evaluate different alternatives of managed aquifer recharge (MAR) (Binkley et al. 2017). The study found that shallow injection into the Chicot Aquifer and deep injection into Jasper Aquifer were most feasible for aquifer injection, but recommended further analysis to determine the injection rates that would be required to provide tangible flood mitigation benefits.
Following the devastating Hurricane Harvey, Yang and Scanlon (2019) conducted a case study to assess how much floodwater can be captured and stored in stressed aquifers. Using high-magnitude flow (HMF) metrics from 10 major rivers to calculate volumes of diverted water for injection, the study concluded that ASR injectivity is too slow in comparison with HMF intensity. The recommendation was to offset floodwater with interim surface storage so that the HMFs could be temporarily captured for enough time to allow for the entire volume to be injected through ASR.
Building on these previous efforts, the current study performed a watershed-scale assessment of the potential for flood mitigation that may result from aquifer injection operations, such as those of ASR. According to Binkley et al. (2017), capturing a sufficient quantity of stormwater for injection is highly impractical on a scale as large as a river system due to the limitation of injection rates in moving large volumes in a sufficient time to provide flood relief. Therefore, the focus for this effort was on a small-scale watershed where the flood mitigation benefit from subsurface injection potential could be maximized.
The current study used a detailed hydrologic-hydraulic model to examine the potential flood mitigation benefits of surface water capture for subsurface injection and determine under which storm magnitudes and patterns such benefits might be realized. The flood relief was assessed in terms of reductions to flood stages and spatial inundation throughout the watershed. In regions simultaneously witnessing increasing rates of aquifer overdrafting, diverting floodwater for subsurface injection has the potential to alleviate localized flooding and to improve conditions downstream, while addressing the problem of groundwater stresses for aquifers that have suitable and sustainable conditions for storing the captured surface water.
Study Site
Louisiana is a low-gradient coastal state that has an abundance of surface water resources and also experiences frequent floods that are increasing in trend (Eldardiry et al. 2016; Slater and Villarini 2016). Due to heavy reliability on groundwater for irrigation and other purposes, the Chicot Aquifer in southwest Louisiana, which provides 41% of the state’s groundwater supply, is overdrafted by approximately or 350 million gal. per day (mgd) (Sargent 2011; Borrok and Broussard 2016). A recent regional study (LaHaye et al. 2021) assessed the feasibility of implementing ASR at a watershed scale in the Chicot Aquifer region in southwest Louisiana. The study identified several promising watersheds where surface water is adequately available, and where suitable aquifer hydrogeological characteristics and land-use conditions are highly viable for ASR implementation. This current study was based on a selected watershed (Beau Bassin) that is representative of a relatively small drainage area that had been classified as suitable for ASR in a preceding study (LaHaye et al. 2021). The intent of the current study is to investigate if subsurface injection of captured surface floodwater can provide flood relief to communities within a small-scale watershed as with Beau Bassin.
The Beau Bassin watershed is located in the City of Carencro, a small community north of Lafayette, Louisiana (Fig. 1), and is a subwatershed of the larger Vermilion River Basin. This watershed has an area of approximately (6 sq mi) with a downstream outlet connected to the Vermilion River. The Vermilion River is one of the main rivers in south central Louisiana that drains to the Gulf of Mexico. The entire region experiences significant flooding that is driven primarily by runoff from its tributaries, including the Beau Bassin watershed, as well tropical storms from the Gulf.
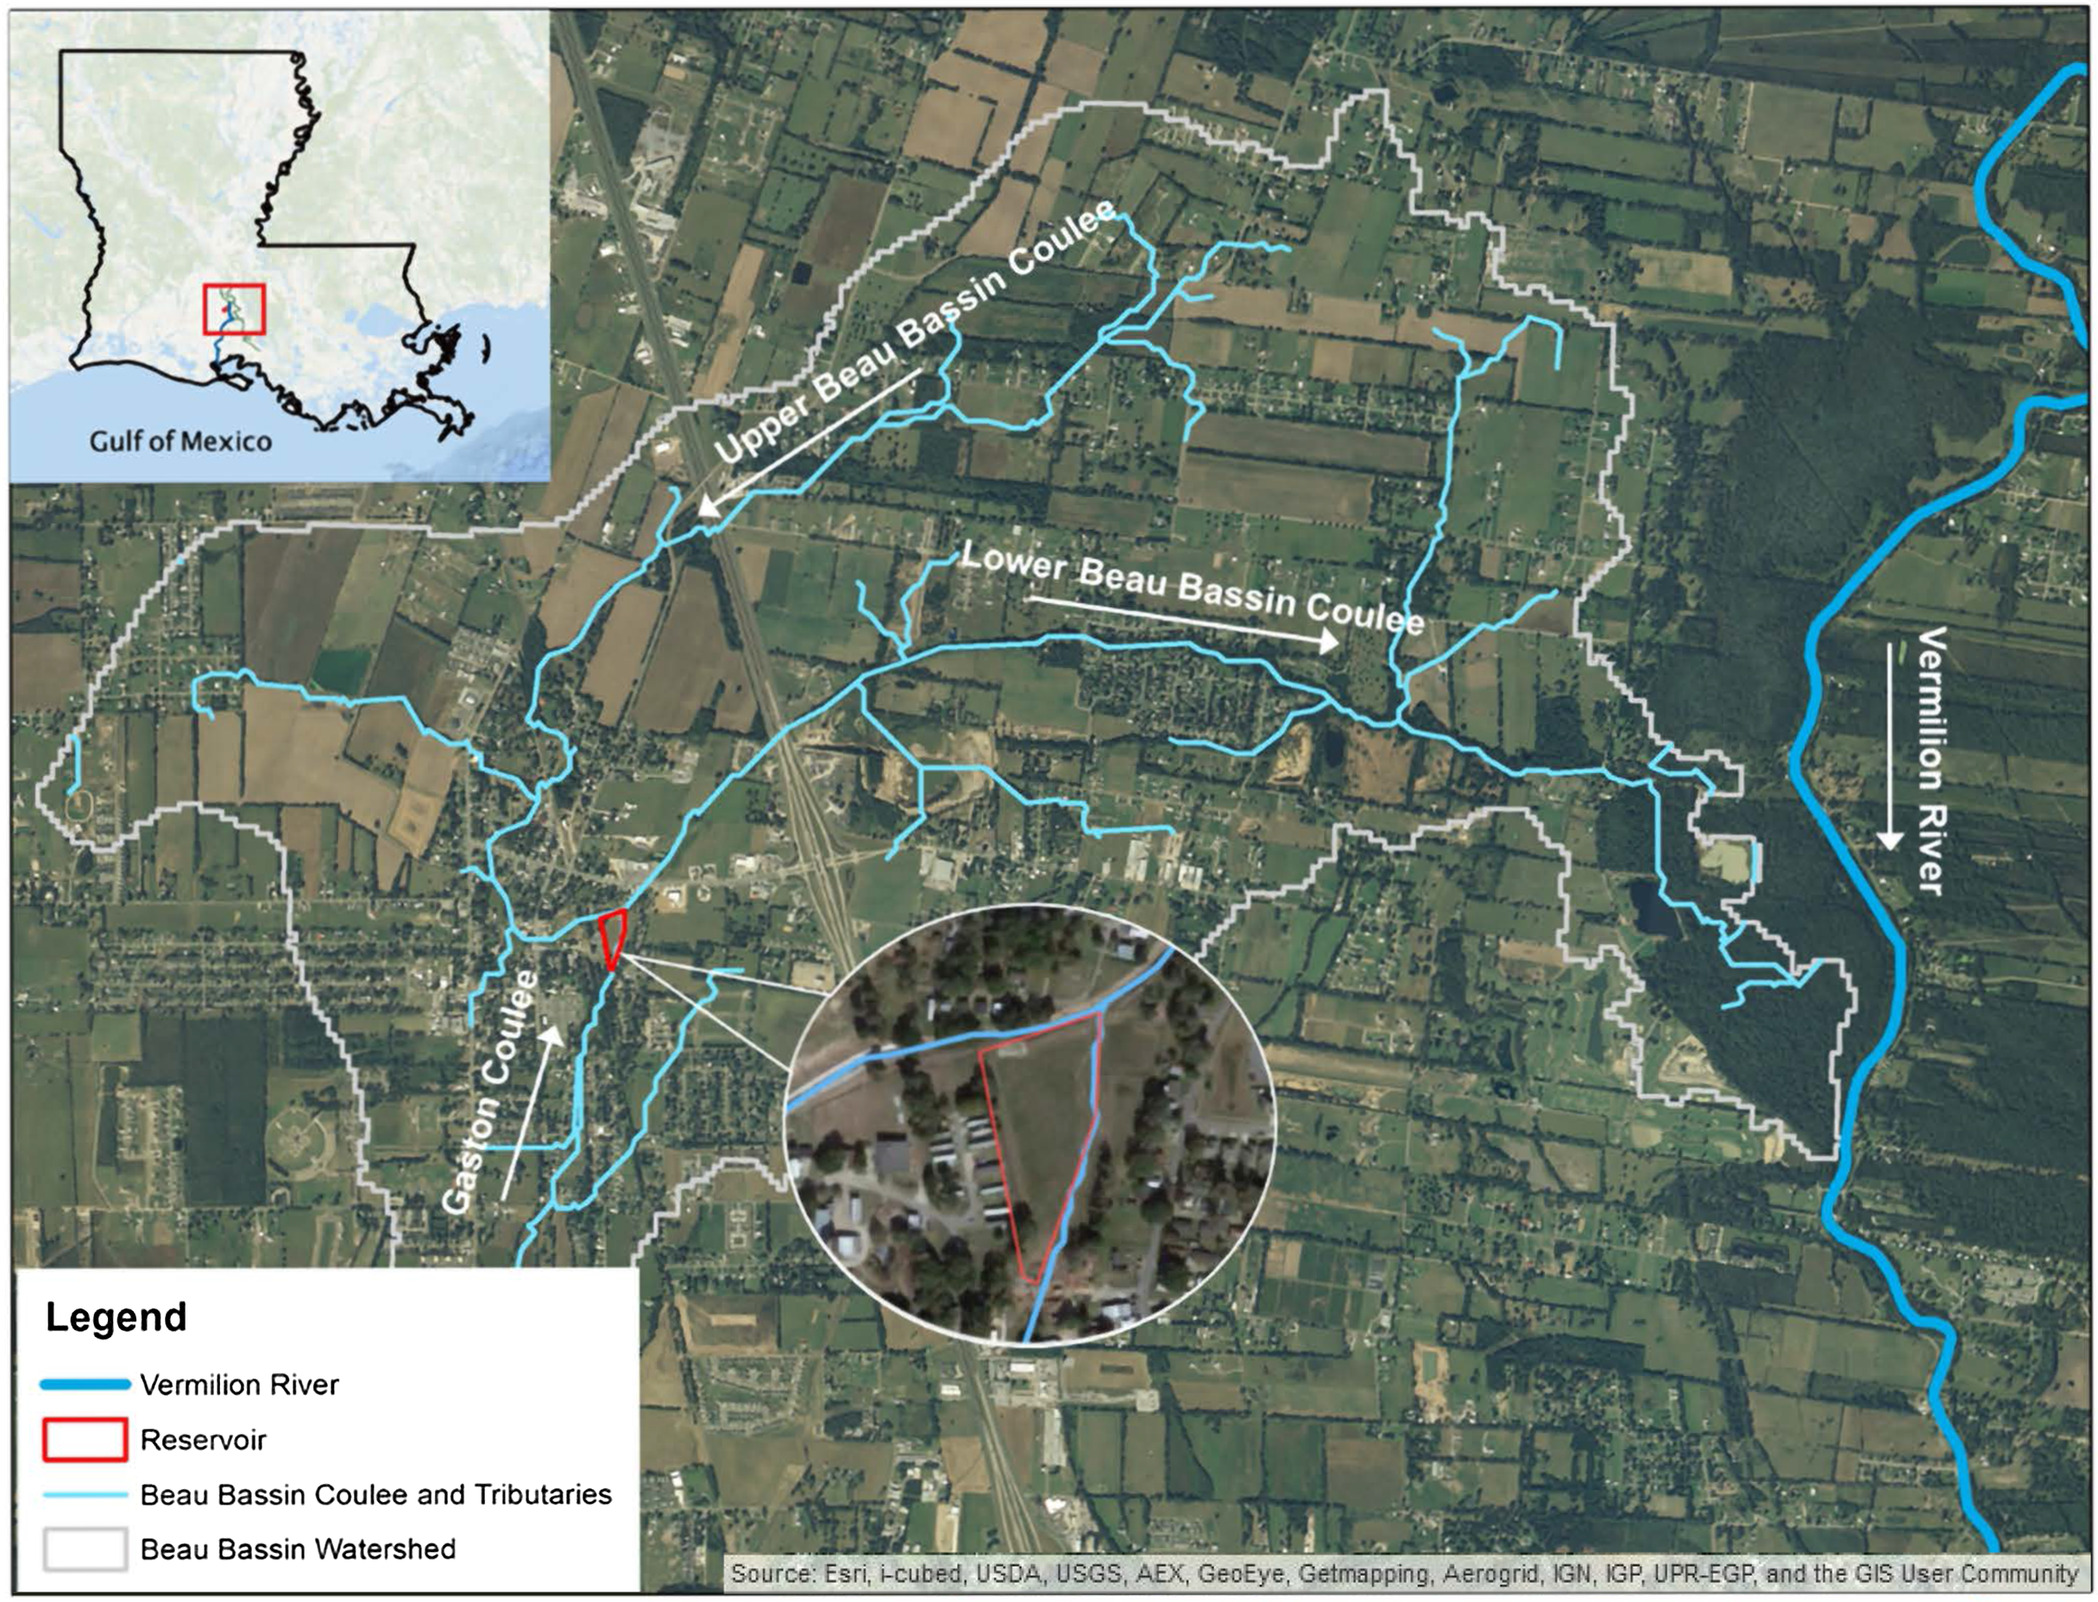
The Beau Bassin watershed has a primary stream called the Beau Bassin coulee, which has an average slope of 0.6%, as well as a few other smaller tributaries. In 2012, the USACE completed a flood feasibility study to assess 11 alternatives for reducing flood risk in the Carencro community. Of these alternatives, the most feasible one was to install a small (6.79-acre) retention basin (Fig. 1) with storage capacity of (110 acre-ft). This retention basin was used in the current study to assess the potential value for additional flood relief from adding subsurface injection operations to relieve the retention basin storage. From this point forward, the retention basin will be referred to as a reservoir for simplicity.
Methodology
Having selected the Beau Bassin watershed as a study site, a hydrologic and hydraulic modeling approach was used to simulate various configurations that represent the watershed response with and without adding the flood mitigation reservoir and the subsurface injection operations. To fully assess the added value of integrating subsurface injection into the operation of the flood mitigation reservoir, the modeling analysis was conducted under different storm types (actual historical storms and hypothetical design storms) and magnitudes (low and high recurrence periods). The subsurface injection operations were simulated by allowing the reservoir to be emptied via a pump at a rate comparable to that of ASR injection. The results of the model simulations allowed for a direct assessment of any additional flood relief that could be provided when a subsurface injection component, such as those within an ASR system, is relieving the storage in the reservoir and injecting the excess water into the aquifer.
It is acknowledged that for the actual ASR process to be implemented in the field, the floodwater would be pumped out of the reservoir and sent through a water treatment process prior to aquifer injection. This is necessary for the pumped water to meet injection regulations. However, this intermediate step of water treatment does not have any implications for the purpose of this study, which focuses on assessing the feasibility of surface water diversion and subsurface injection to provide additional flood relief. Water treatment prior to injection has no impact on the pumping rate and hence no effect on the capacity of an injection well.
Rainfall Storms
The rainfall storms considered in this study included both synthetic design storms, which are typically used in engineering hydrologic applications, as well as actual historical storms that occurred in the region (Table 1). Design storms of a 24-h duration and two typical recurrence intervals, 25- and 100-year, were compiled from the National Oceanic and Atmospheric Administration (NOAA) Precipitation Frequency Atlas 14 (Perica et al. 2013). The total rainfall depth of the 25- and 100-year storms correspond to 25 and 35 cm (9.9 and 13.6 in.), respectively, which were distributed temporally to create a 24-h storm using the standard alternating block method (Hershfield 1961).
| Event date | Time between flood peaks | Storm return period (years) | Total precipitation depth (cm) |
|---|---|---|---|
| May 2004 | 12 h | 50 | 28.65 |
| May 2008 | 14 h | 3 | 13.89 |
| May–June 2014 | 13 days | 5–10 followed by 1–2 | 34.80 |
| 24-h design storm | Single peak | 25 | 25.15 |
| 24-h design storm | Single peak | 100 | 34.54 |
In addition to synthetic design storms, the analysis was also conducted using actual historical storms. Due to the lack of rainfall gauges in the Beau Bassin watershed, the study relied on radar-based rainfall products, namely the National Center for Environmental Prediction (NCEP) Stage-IV Quantitative Precipitation Estimate (QPE) as a data source for historical storms. The Stage-IV data set has spatial and hourly temporal resolutions and is available from 2002 until present. It is a multisensor analysis produced by 12 contiguous United States (CONUS) river forecast centers (RFCs) that merge data from 140 radars and approximately 5,500 gauges over the CONUS after performing gauge correction and quality control at each RFC (Eldardiry et al. 2017; Lin and Mitchell 2005). The NCEP Stage IV was subject to validation studies in Louisiana (Habib et al. 2009; Sharif et al. 2020) and was used to drive several hydrologic and ecological studies in the region (e.g., Habib et al. 2008).
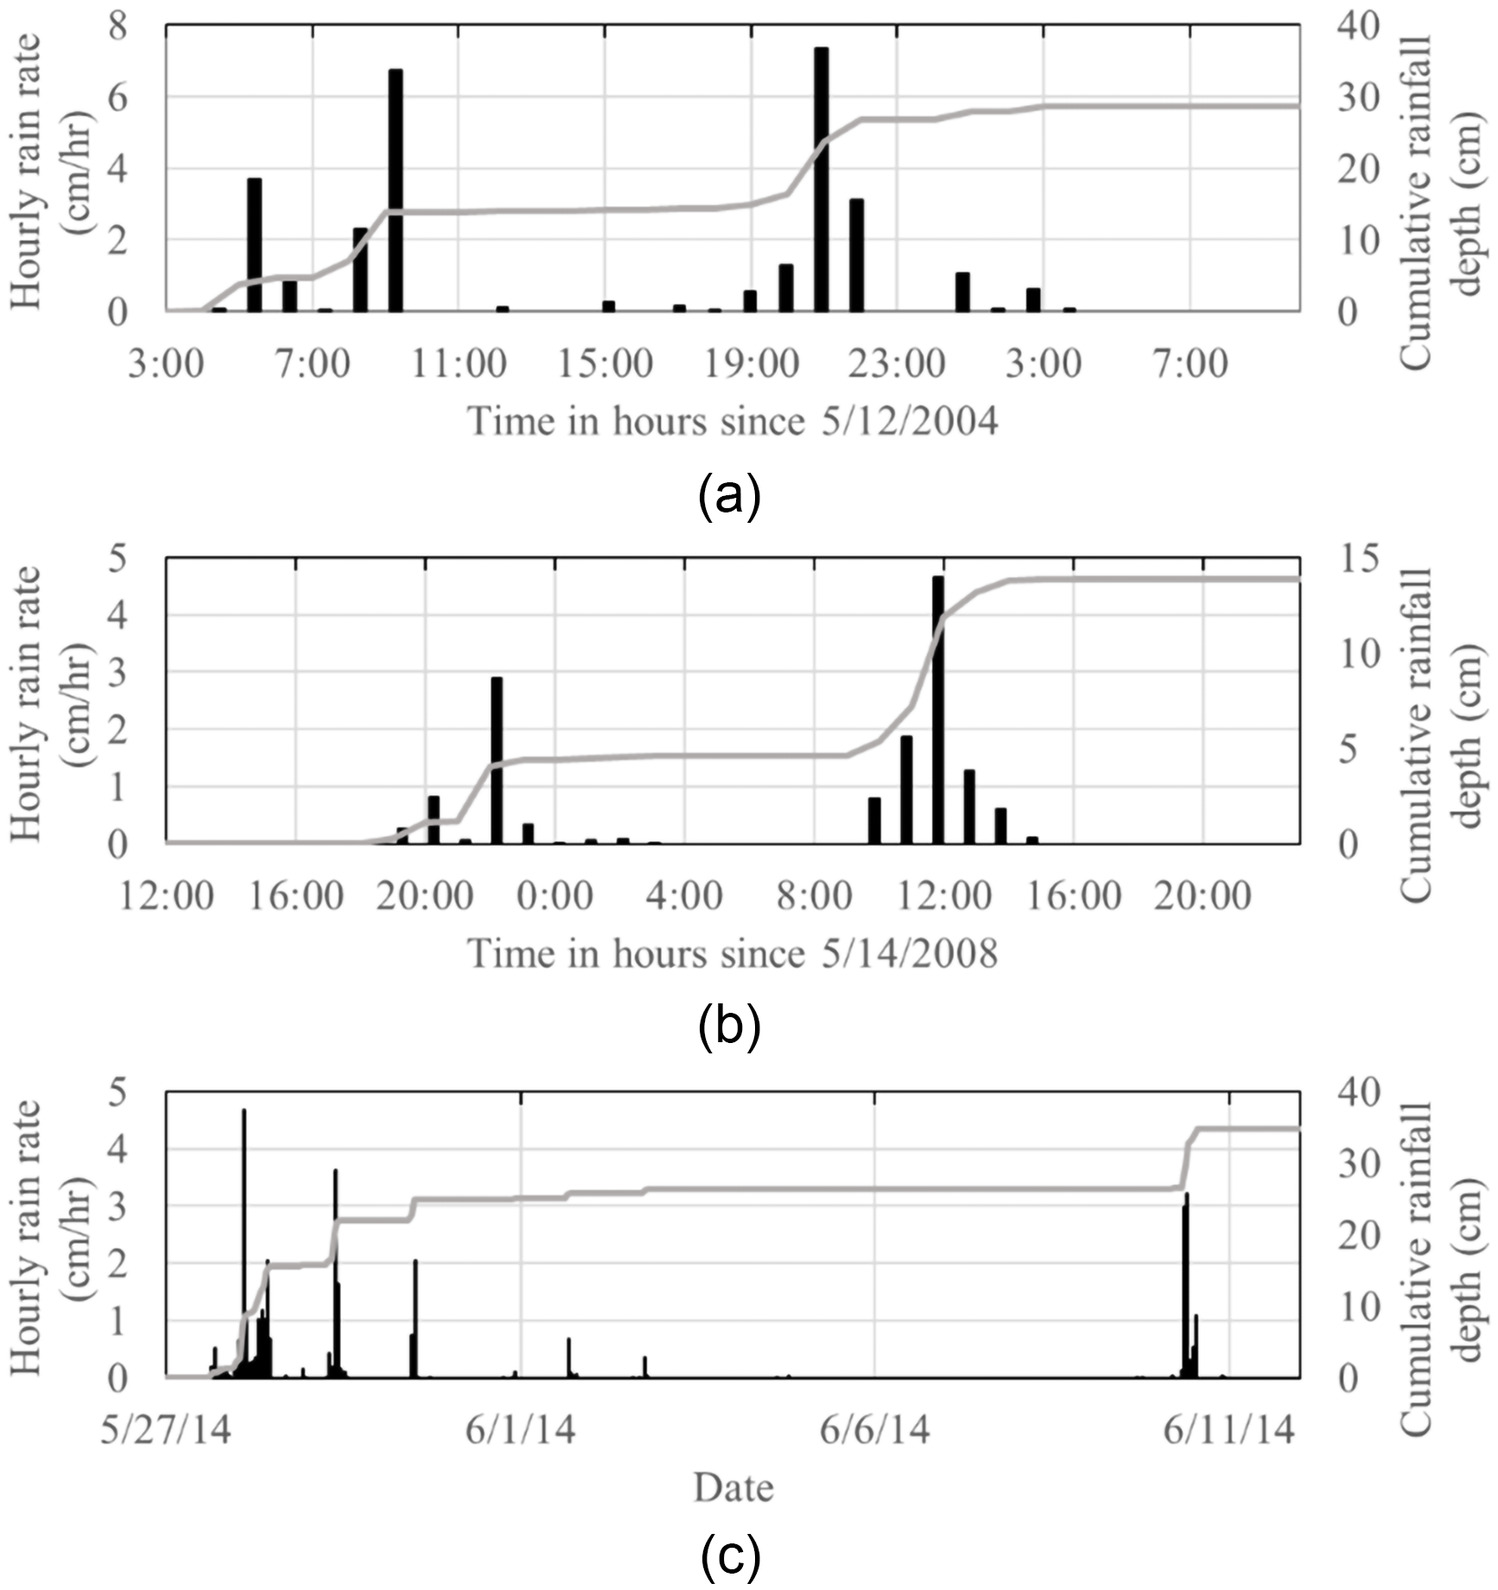
Three historical rainfall periods (Table 1) were selected for the current study, with each period containing multiple storms within a relatively short span of time that caused multiple flood peaks in the watershed. When classified using information from the NOAA Atlas, the three rainfall periods contained storms with recurrence intervals between a few years to about 50 years. Table 1 summarizes these rainfall periods by date, time span between major flood peaks, storm recurrence interval, and total rainfall depth.
Time series of hourly rainfall rates for each rainfall period were acquired from the Stage-IV national data set over the centroid of the Beau Bassin watershed (Fig. 2). These storms provided this study with various rainfall and flooding conditions, ranging greatly in magnitude and in the span of time between major peaks. For example, the 2014 storm was a particularly interesting event to consider because it involved a series of multiple flood peaks that occurred all within 3 days and another minor yet impactful event 10 days after that. Each of the synthetic storms and historical rainfall periods were used to drive the modeling simulations as described in the next section.
Hydrologic and Hydraulic Modeling
The study used the Hydrologic Modeling System developed by the United States Army Corps of Engineers (HEC-HMS V4.4) to build a semidistributed hydrologic model for the Beau Bassin watershed. To capture spatial variations in watershed characteristics, the Beau Bassin watershed was represented in the model using 25 subbasins of different sizes ranging between () with an average area of (Fig. 3). Rainfall-runoff transformation (loss estimation) and direct runoff transformation (flow hydrograph routing to the outlet) were performed for each subbasin using the US Department of Agriculture (USDA) Natural Resource Conservation Service (NRCS) methodology (USDA NRCS 1986), formerly known as the soil conservation service (SCS) curve number (CN) method. Using the NRCS method, precipitation depths (from design storms or actual historical data) were converted into estimates of surface runoff in each sub-basin using the commonly used CN parameter. The CN varies from zero (no runoff) to 100 (complete impervious conditions) and can be estimated based on the hydrologic soil group (HSG) and land-use and surface treatment characteristics of each subbasin.
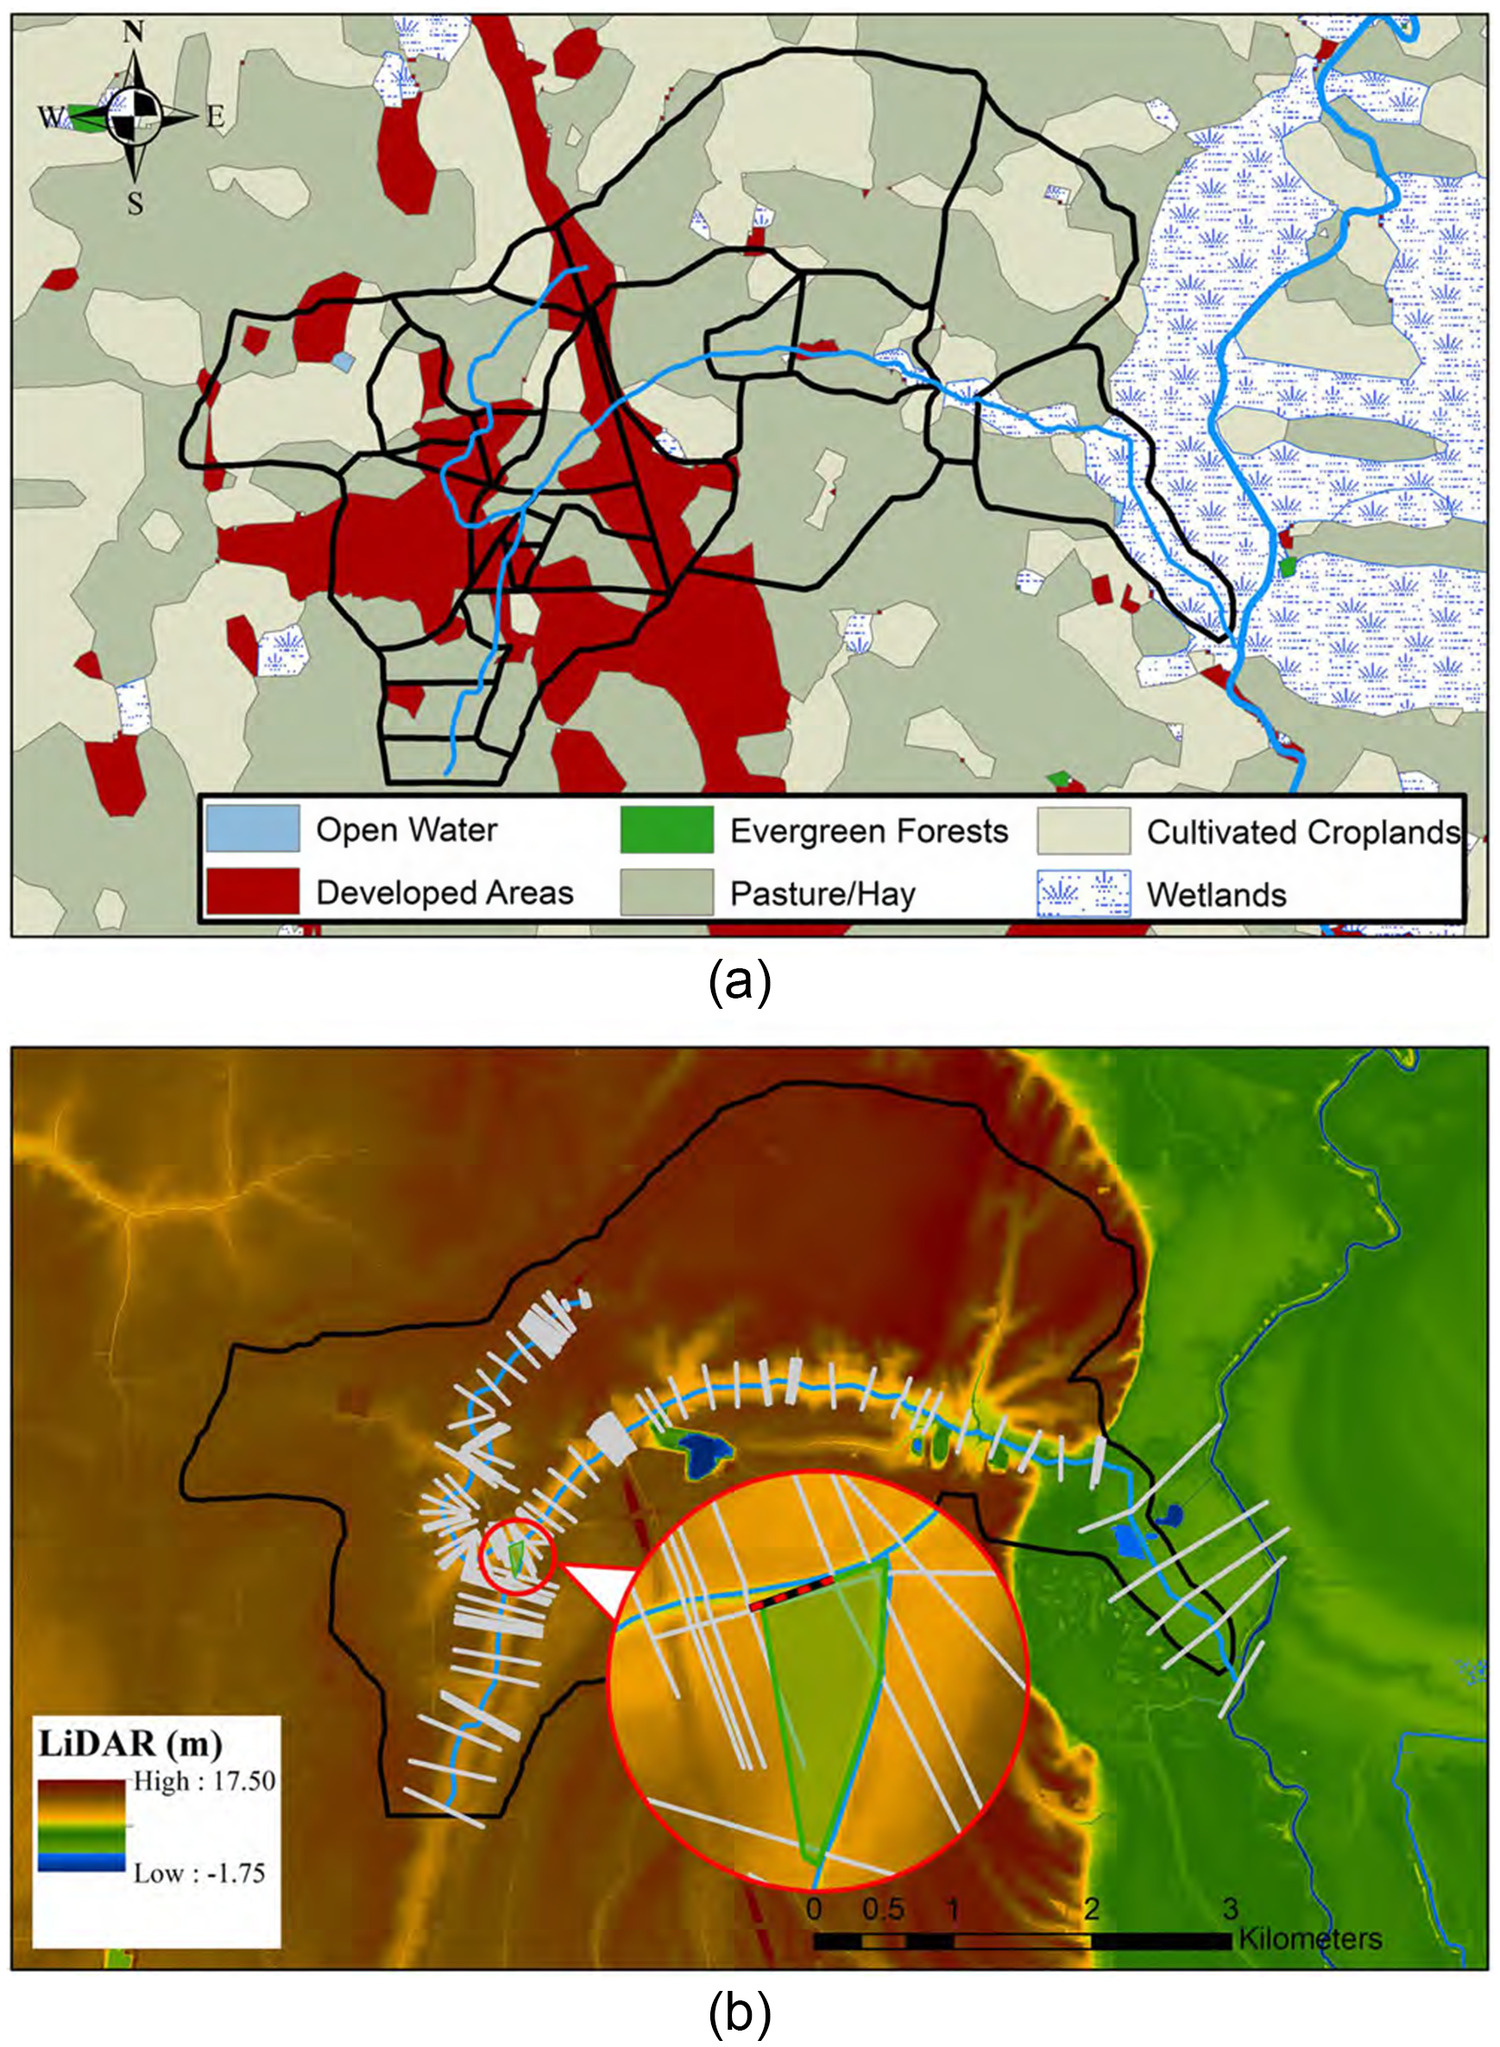
The Gridded Soil Survey Geographic Database (gSSURGO) and the National Land Cover Database (USGS 2014) (Fig. 3) were used to develop model parameters on soil group definitions and land-use characteristics for each subbasin. The soil types identified within the study area are, namely, Memphis silt loam, Coteau silt loam, and frost silt loam, which correspond to Hydrologic soil groups B, C, and D respectively (Table 2). Using this information, a CN value for each subbasin was assigned based on classification of soil and land-use combinations according to the NRCS Technical Release TR-55 (USDA NRCS 1986). The CN values in the 25 subbasins were in the range of 61–79, with a median value of 65.
| Soil name | Hydrologic soil group | Watershed area (%) |
|---|---|---|
| Memphis silt loam | B | 80 |
| Coteau silt loam | C | 5 |
| Frost silt loam | D | 15 |
To transform the calculated runoff (millimeters) to a flow hydrograph (), the SCS synthetic unit hydrograph method (SCS-UH) was applied, in which the only needed parameter is the lag time. Due to the absence of any discharge measurements in the Beau Bassin watershed, this study opted to estimate the lag time () for the 25 subbasins via empirical equations, following guidance outlined in the NRCS TR-55 for estimation of time of concentration for ungauged subbasins. The TR-55 method divides the flow path into three main segments of reasonably uniform hydraulic characteristics (sheet flow, shallow concentrated flow, and open channel flow). Then, the time of concentration for each subbasin was found by calculating the travel time for each segment and summing up the three obtained values. Finally, the lag time was assumed to be equal to 60% of the time of concentration for each subbasin. The computed lag times () for the 25 subbasins ranged between 15 and 90 min, with a typical median value of 33 min.
Once the HEC-HMS simulations were completed, the resulting outflow hydrographs from the 25 subbasins were routed through a Hydrologic Engineering Center’s River Analysis System (HEC-RAS) unsteady hydraulic model to estimate flow and stage hydrographs along the mainstream in the watershed. A stage-flow rating relationship was imposed as a downstream boundary condition at the main outlet of the Beau Bassin watershed and its junction with the Vermilion River. The HEC-RAS model simulations were performed under three different configurations:
•
Existing conditions: this configuration represents the existing conditions of the Beau Bassin coulee without implementing any flood control or subsurface injection measures.
•
Reservoir only: this configuration includes the reservoir for storing the captured surface water and is represented as a storage area with a lateral weir connection to the stream system.
•
Reservoir with subsurface injection: this is the same as the second configuration, but with adding a pump station that can divert water from the reservoir at a specified rate that simulates subsurface injection.
Two injection scenarios, one with two injection wells and another with 16, were tested to represent minimum and maximum injection extremes. All three configurations were simulated under the same storm conditions to assess differences in flood mitigation outcomes. The selection of several storm variations as detailed in Table 1 and Fig. 2 allowed the study to examine the circumstances in which surface water diversion for subsurface injection can provide the maximum benefit.
Other modeling considerations involved the connection of the reservoir to the watershed streams and a pumping station for subsurface injection. A lateral weir with a simple overflow function was used to represent the connection between the reservoir and its neighboring stream (Fig. 3). The weir crest was set at an elevation of 10 m, which was assigned after a preliminary analysis of maximum water surface elevations that ensure that the reservoir will be active during each storm. The pump station was represented as a single pump that can empty the reservoir at a flow rate determined by the assumed maximum injection rate of a single injection well. This rate is dependent on the transmissivity and storativity of the Chicot Aquifer.
The DRI feasibility study of the Chicot Aquifer in Harris County calculated a maximum injection rate of based on their average hydrogeological parameters and constraints (Binkley et al. 2017). Their average transmissivity was and storativity was 0.013. The Beau Bassin watershed was calculated to have a corresponding average transmissivity of approximately and storativity of 0.018 (LaHaye et al. 2021). Higher transmissivity and storativity typically suggests that the injection rate could be higher, so the rate of was considered an appropriately conservative assumption to use for this study. This pumping flow rate was then multiplied by the number of injection wells considered in each injection scenario (2 and 16 injection sites).
Assessment of Flood Mitigation Benefits
To assess the ability of subsurface injection of captured surface water to provide additional flood relief beyond using the reservoir only, results from simulating the three watershed configurations (existing, reservoir-only, and reservoir with injection) were extracted and compared against each other. The results were examined using two different metrics that were based on the model outputs: stage hydrographs and spatial flood inundation. For each configuration, the stage hydrograph located at the model cross section immediately downstream of the reservoir (Fig. 3) was extracted to assess any reductions in the stream water surface elevation (stage) at the peak of the flood. The peak water surface elevation along the main streams of the upper and lower Beau Bassin branches and the Gaston Coulee (Fig. 1) were also extracted to examine the extent of potential impacts on the water surface profiles at different locations in the watershed.
The ability of subsurface injection of captured surface water to provide additional flood relief was also assessed by examining possible reductions in spatial flood inundation. In order to produce inundation maps using the one-dimensional (1D) HEC-RAS model, a digital elevation model (DEM) was first established for the watershed using the Louisiana statewide lidar high-resolution (5-m) elevation data set (Cunningham et al. 2009). A water surface model was then developed by interpolating the maximum water stages at each model cross section on a grid that has the same spatial extent and resolution of the DEM surface. The water surface grid was then overlaid onto the lidar grid to calculate differences between the two surfaces and delineate the extent of the flood inundation. For each of the simulated storms, a flood inundation map was constructed from the simulation time step that corresponds to the highest flood peak attained during that storm.
Results and Discussion
Performance under Single-Peak Design Storms
This study evaluated the ability of subsurface injection in conjunction with offline surface storage to provide supplementary flood relief for a small watershed. The approach considered the Beau Bassin catchment, a small watershed in the city of Carencro, Louisiana, as an area that is suitable for aquifer recharge operation and tested the implementation of a new reservoir to provide approximately of flood storage for the area through the application of a hydrologic and hydraulic model. The watershed was then tested under the configuration where the reservoir is being relieved via subsurface injection upon the occurrence of a storm, emptying the reservoir of the entire water volume and preparing it for the next event.
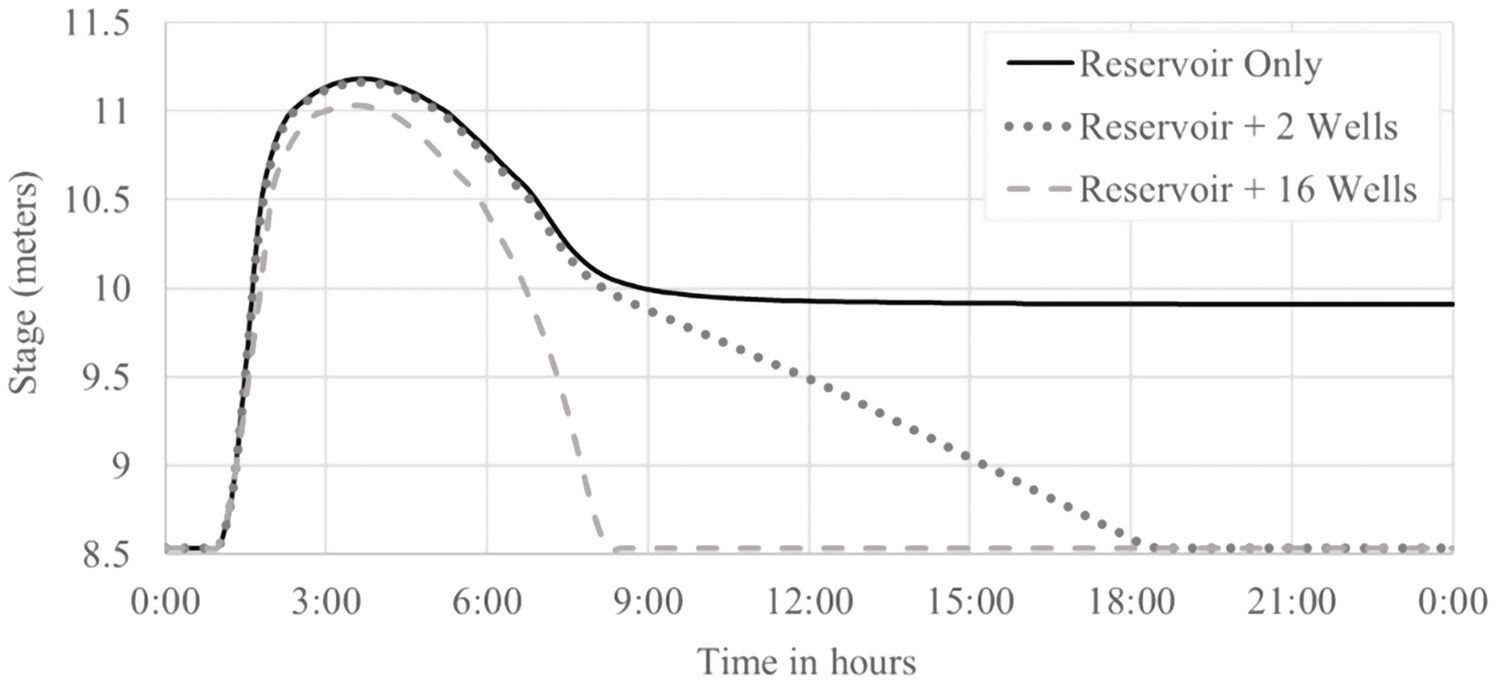
The performance of subsurface injection operations added to the flood reservoir was first assessed under single-peak storms such as the synthetic 24-h, 25-year, and 100-year events, and with pumping rates that corresponded to injection rates of 2 to 16 injection wells. First, the stage hydrograph inside the reservoir was examined for the cases of 2 and 16 injection wells versus no pumping conditions (Fig. 4). Without pumping and subsurface injection (continuous line in the figure), the hydrograph showed that under a 100-year single-peak storm, exchange into the reservoir began shortly after the storm started and quickly filled to capacity at the reservoir top elevation of 10 m. By the third hour, the flood stage rose over a meter beyond the reservoir, inundating the surrounding area. After the storm receded, the hydrograph became constant at 10 m, indicating that the reservoir was full. In the case of pumping rates that simulated the injection of 16 injection wells, the pump was able to empty the reservoir in a matter of 7 h, and for the more moderate case of two wells, the pumping rate was able to empty the reservoir in just under 18 h.
The subsequent approach examined whether the reservoir is being drained quickly enough to provide further detention during the flood and thus reduce the stage in the channels. Fig. 5 shows the stage hydrograph at the cross section of the Beau Bassin coulee just downstream of the reservoir for the 100-year and the 25-year design storms.
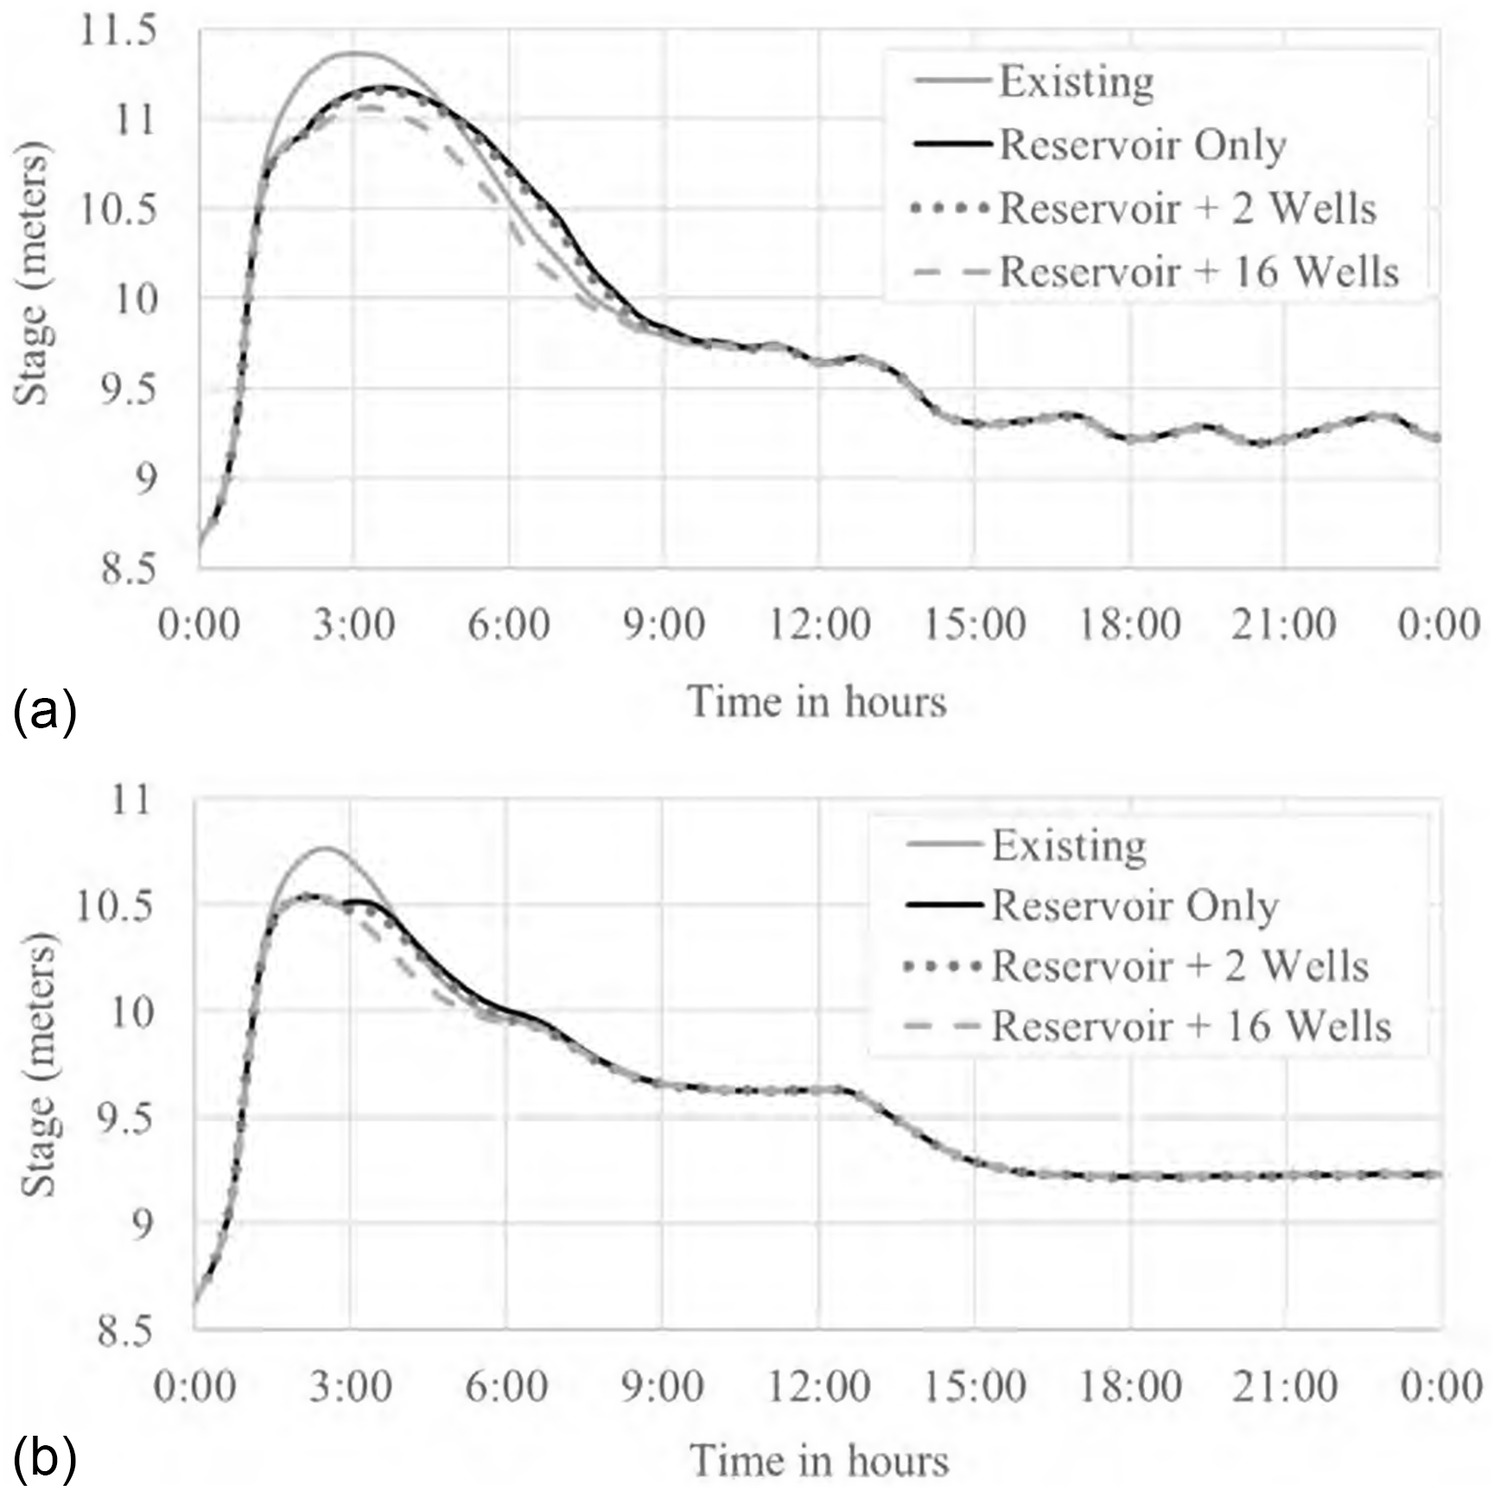
The results show that under these design storms, there was a peak reduction of about 0.17–0.2 m from the existing conditions when implementing the reservoir only (i.e., without pumping and subsurface injection). This test was to confirm that the reservoir was activated and relieving the stage in the channel during storms of this intensity. However, under such storms, having only two injection wells actively draining the reservoir is not enough to provide noteworthy value to the reservoir capacity. There was some additional reduction occurring for the case of 16 wells, although it did not begin until after the peak of the flood had passed. This indicated that the reservoir was not being drained fast enough to provide much supplementary relief during the storm. This was especially evident for the case of the 100-year storm where the flood detention reservoirs got overwhelmed by the volume of diverted water and no realistic number of injection wells could drain the reservoir efficiently to possibly provide further flood detention.
Performance under Actual Multipeak Storms
Following the results of the design storm analysis, the remainder of the study focused on analysis during actual storms that occurred in the Beau Bassin area and contained multiple flood peaks. The three storms selected for this analysis are representative of an extreme (2004), moderate (2014), and minor (2008) storm.
Stage Reduction in the Main Channel
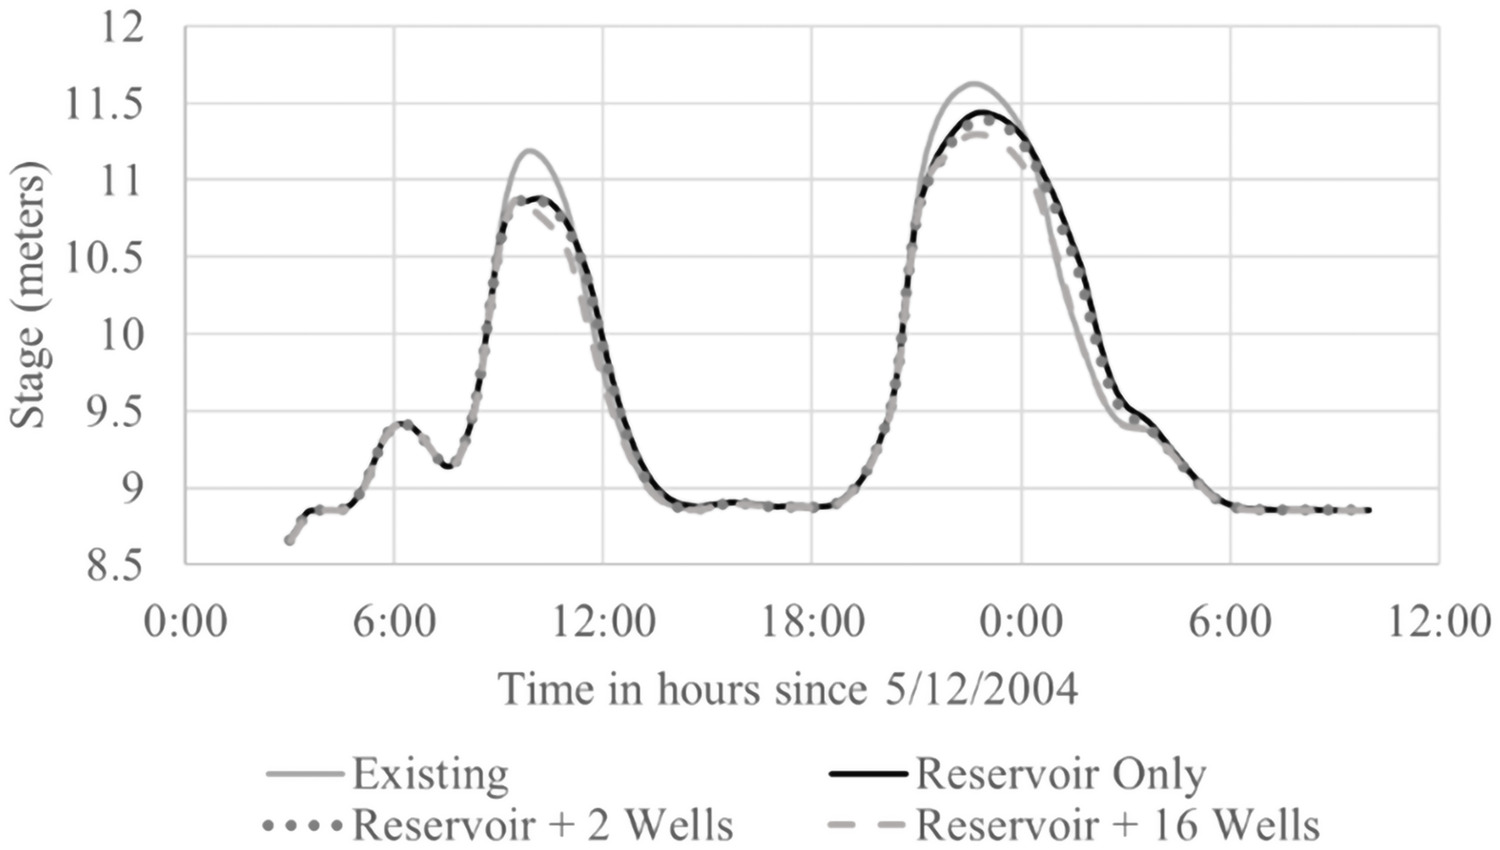
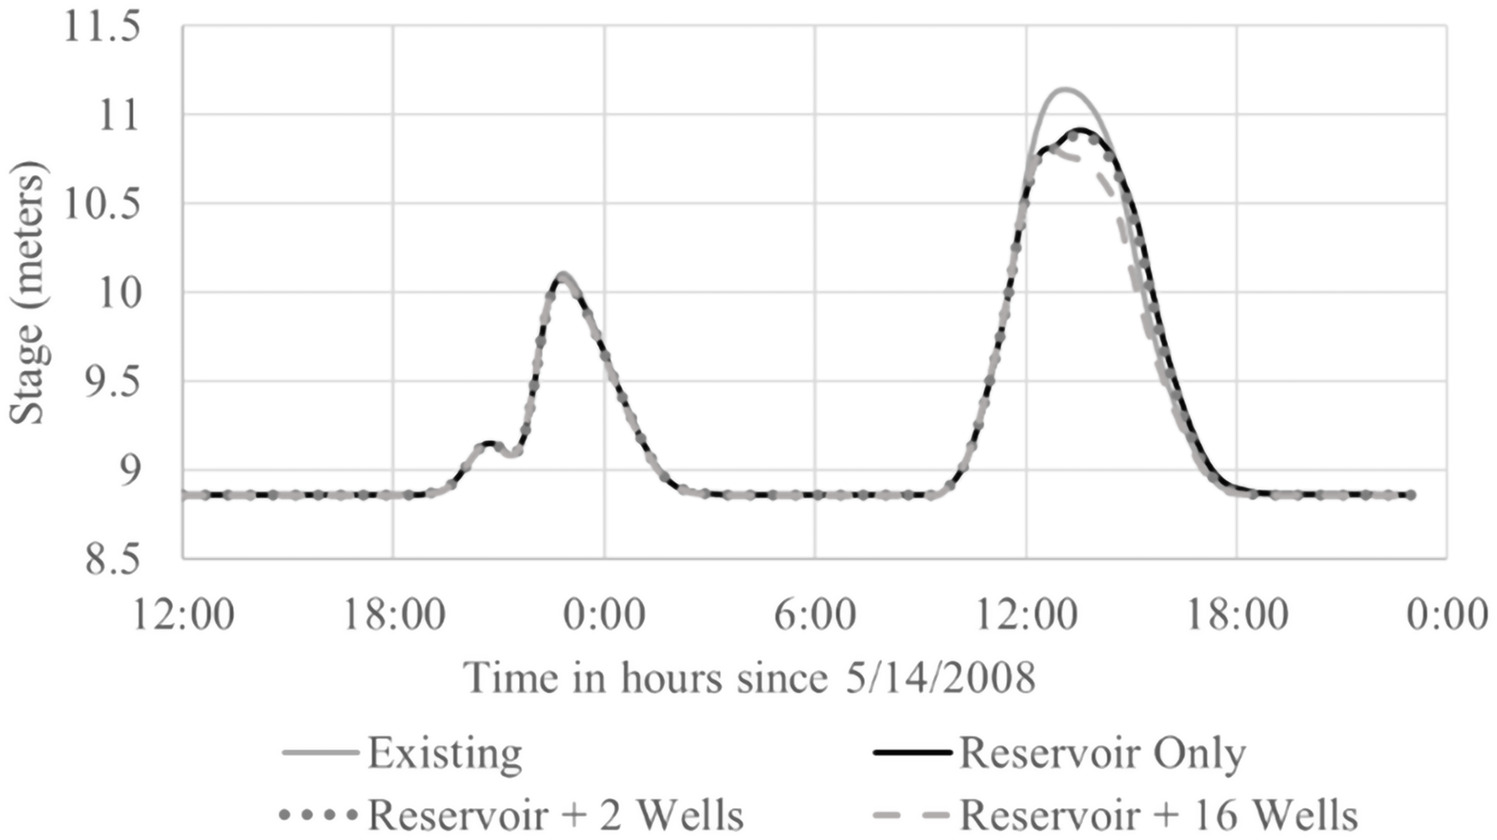
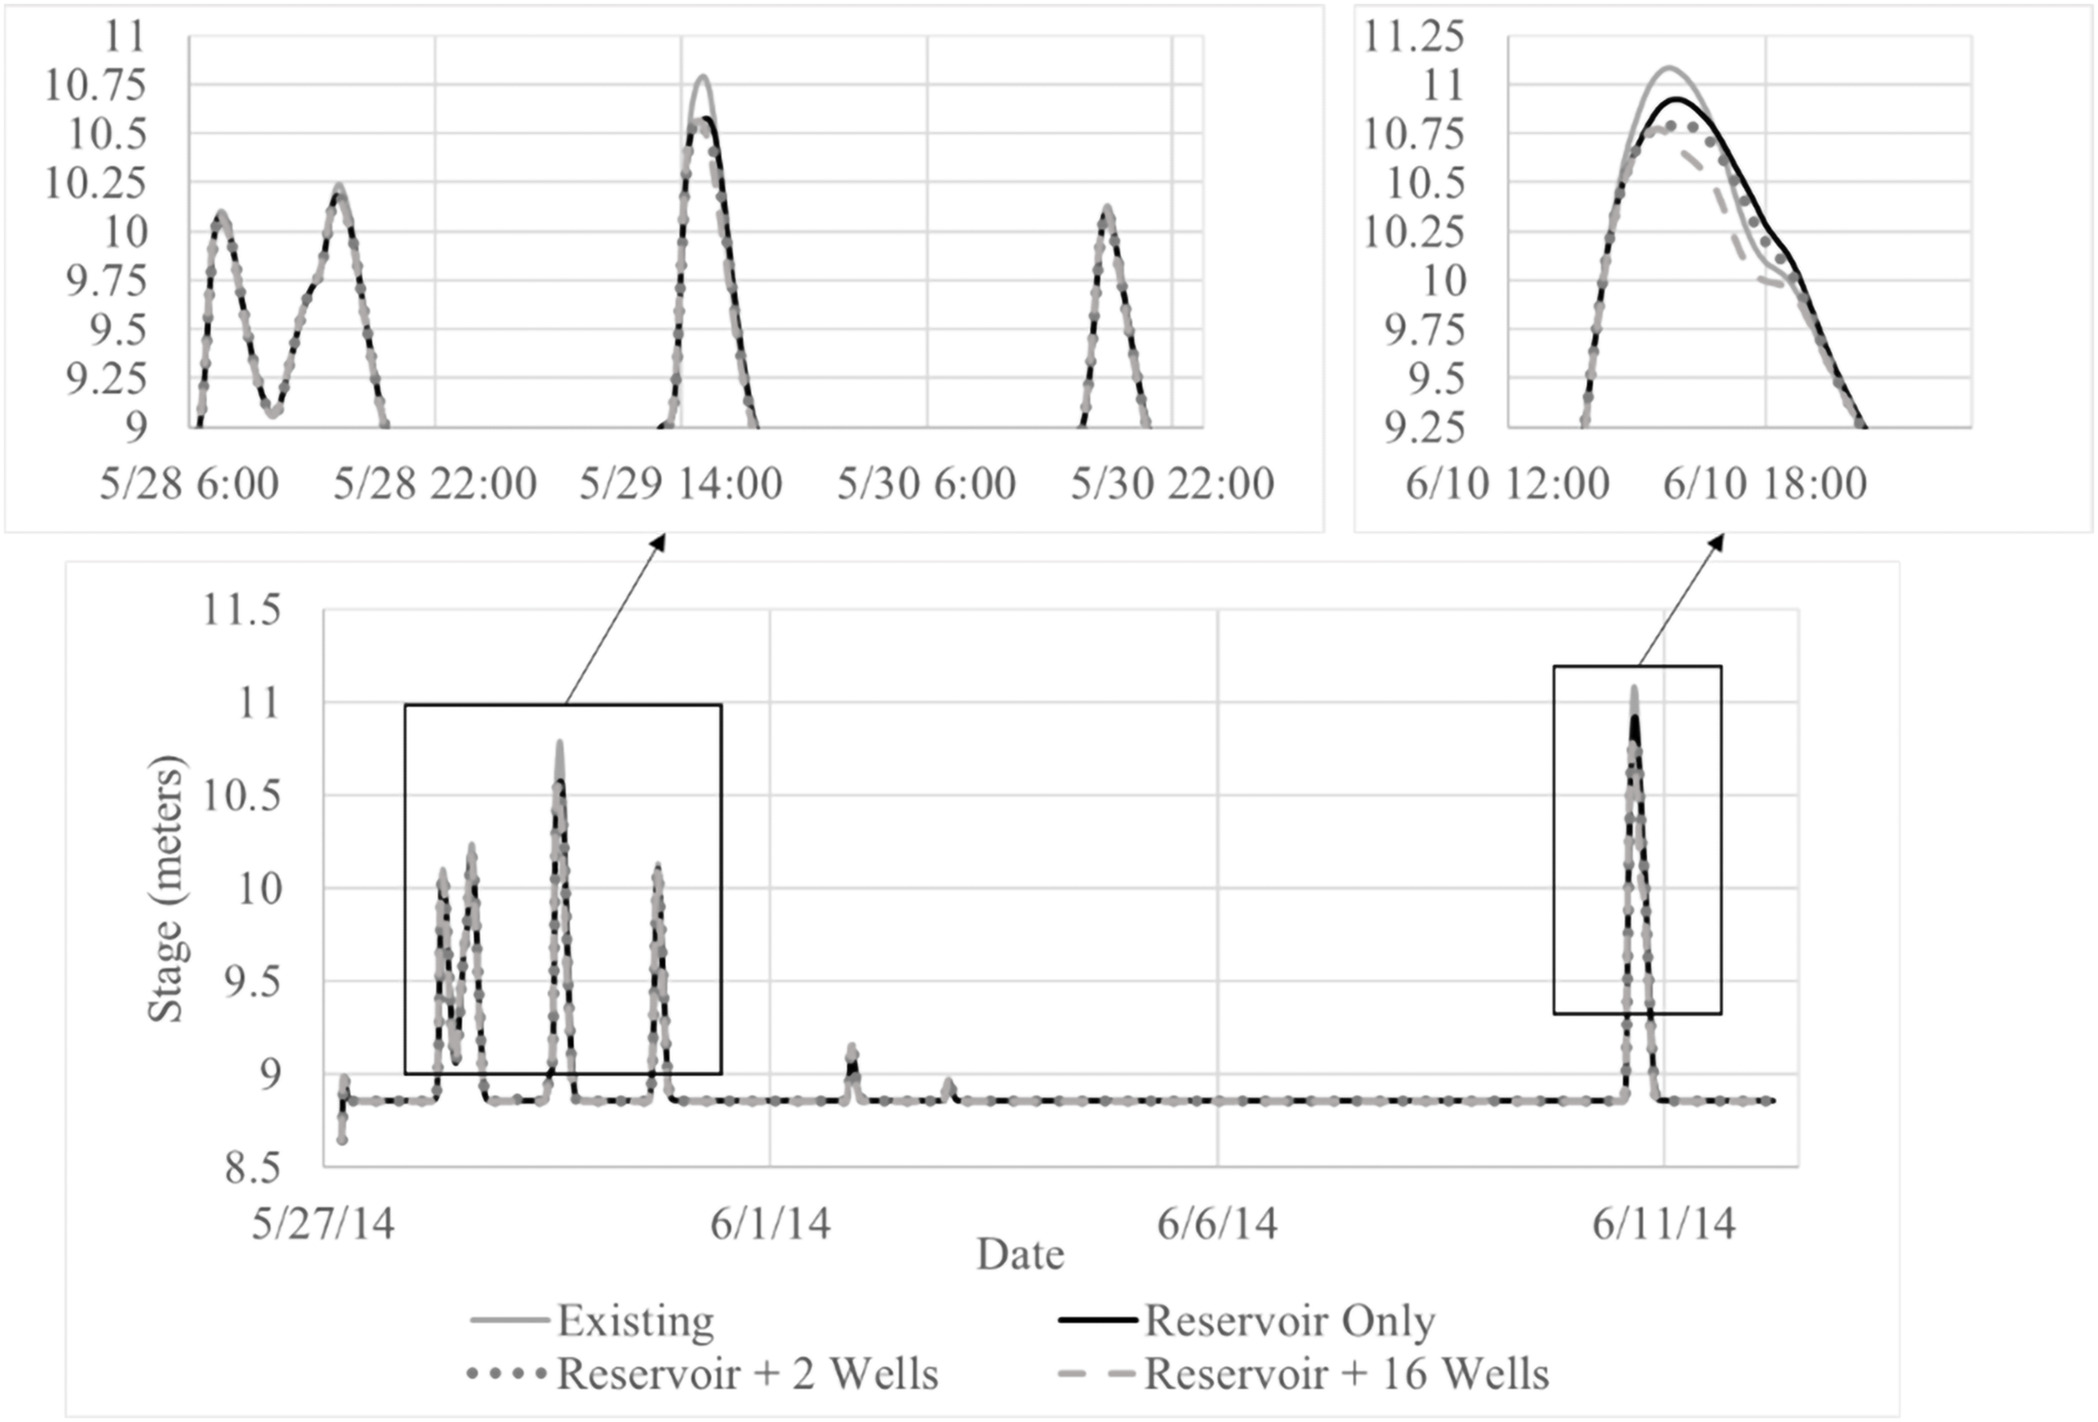
Figs. 6–8 compare the stage hydrographs at the channel cross-section just downstream of the reservoir under the three different storms. Table 3 includes a summary of the main results under the three storms and a comparison of those with the design storms.
| Storm date | Flood mitigation strategy | First peak stage reduction (m) | Additional reduction (first peak) (%) | Second peak stage reduction (m) | Additional reduction (second peak) (%) | Storm return period (years) |
|---|---|---|---|---|---|---|
| Multipeak recorded historic storms | ||||||
| May 2004 | Reservoir-only | 0.262 | N/A | 0.183 | N/A | 50 |
| Reservoir + 2 wells | 0.277 | 6 | 0.229 | 25 | ||
| Reservoir + 16 wells | 0.393 | 50 | 0.326 | 78 | ||
| May 2008 | Reservoir only | N/A | N/A | 0.204 | N/A | 3 |
| Reservoir + 2 wells | 0.223 | 9 | ||||
| Reservoir + 16 wells | 0.363 | 78 | ||||
| May–June 2014 | Reservoir only | 0.171 | N/A | 0.140 | N/A | 5–10 (May) followed by 1–3 (June) |
| Reservoir + 2 wells | 0.271 | 58 | 0.262 | 87 | ||
| Reservoir + 16 wells | 0.274 | 60 | 0.393 | 180 | ||
| Single-peak design storms | ||||||
| 100-year, 24-h | Reservoir only | 0.219 | N/A | NA | N/A | 100 |
| Reservoir + 2 wells | 0.232 | 6 | ||||
| Reservoir + 16 wells | 0.308 | 41 | ||||
| 25-year, 24-h | Reservoir only | 0.195 | N/A | N/A | N/A | 25 |
| Reservoir + 2 wells | 0.235 | 21 | ||||
| Reservoir + 16 wells | 0.256 | 31 | ||||
The intensity of the most extreme 2004 storm caused the water surface elevation in the channel to exceed and to remain above the elevation of the weir crest (10 m) for long enough to divert flows into the reservoir. This allowed the higher pumping rate of 16 injection wells to provide some relief during the first peak as well as the second. The additional reduction achieved during the second peak when compared with the case of only the reservoir was about 78%. The use of two wells did not perform nearly as well in comparison with the 16 wells for this entire storm, likely due to the storm size in comparison with the two-well slow pumping rate of only . It was also apparent that the size of the storm overwhelmed the reservoir system. In terms of percentage, the two wells were capable of adding 25% more stage reduction during the second peak, which can be significant in such a small community-sized catchment. However, it was unable to provide much added benefit during the first peak.
The 2008 event was an opposite extreme to the 2004 storm because it was a fairly minor and more frequent event, with average recurrence interval. The first peak was quite low such that it exceeded the height of overflow weir for only 45 min, which was not enough time to divert enough overflow into the reservoir. As such, neither the reservoir-only nor the addition of injection wells would provide a tangible flood relief. However, the second peak that followed afterward was relieved by about 78% with the use of 16 injection wells, whereas the use of two wells had very little effect. This was an interesting finding because it seems that, regardless of the storm size, the use of 16 injection wells was able to provide measurable additional reductions in flood stage in the second peak. A different behavior was apparent when using lower pumping rates as for the scenario of two injection wells. For very frequent storms, the two injection wells had almost no impact. At this pumping rate, the effect of subsurface injection was more dependent on the magnitude of the storm. Storms that were too small did not produce enough runoff to interact with the reservoir for a period of time sufficient for the low pumping rates to have an impact. Likewise, if a storm was too large, it overwhelmed the reservoir system and the low pumping rate could not keep up.
The final assessment was of the 2014 storm, which was an interesting case when compared with the other two, mostly because it consisted of more than two considerable stage peaks along the channel, but also because one peak occurred nearly 2 weeks after the others and still had a measurable impact on the system. This case was where the highest benefit in both scenarios of 2 or 16 injection wells was witnessed. This was most noted for the case of 16 wells, where the stage reduction for the very last storm peak almost tripled (180% added benefit) from the reduction occurring with no injection wells. This was likely the case where the highest benefit for subsurface injection could be found, which was contingent upon the occurrence of multiple storm peaks with a larger span of time between them to allow for the subsurface injection pumps to empty the reservoir and provide more storage for the next flood peak.
Comparing the performance during the first peak of the multipeak storms with the single-peak design storms, the results of the 2004 storm appear to be similar to those of the 100-year design storm. The 25-year storm is of less intensity, so both scenarios of 2 and 16 wells were able to provide a valuable benefit of 21% and 31%, respectively. Consistently during the first peak of the multipeak storms, subsurface injection of captured surface water provided some reduction, but could not altogether keep up with the acceleration of the rising flood stage. During the break between storm peaks, the pump emptied the reservoir, and provided up to five times more reduction in flood stage during the second peak.
Impact on Water Surface Profiles
In addition to examining the stage hydrographs at the downstream location of the reservoir, the analysis further evaluated how far along the channel the effect remained significant. Figs. 9–11 show the longitudinal profiles of the maximum water surface elevation (WSE) along the main channel of Beau Bassin including the upper and lower branches and of the main tributary called the Gaston Coulee. For clarity and better comparison, the figures also show the differences in the WSE profiles between the case of the existing condition (i.e., without diversion of surface flows) and each of the proposed scenarios (reservoir-only, and reservoir with different number of wells).
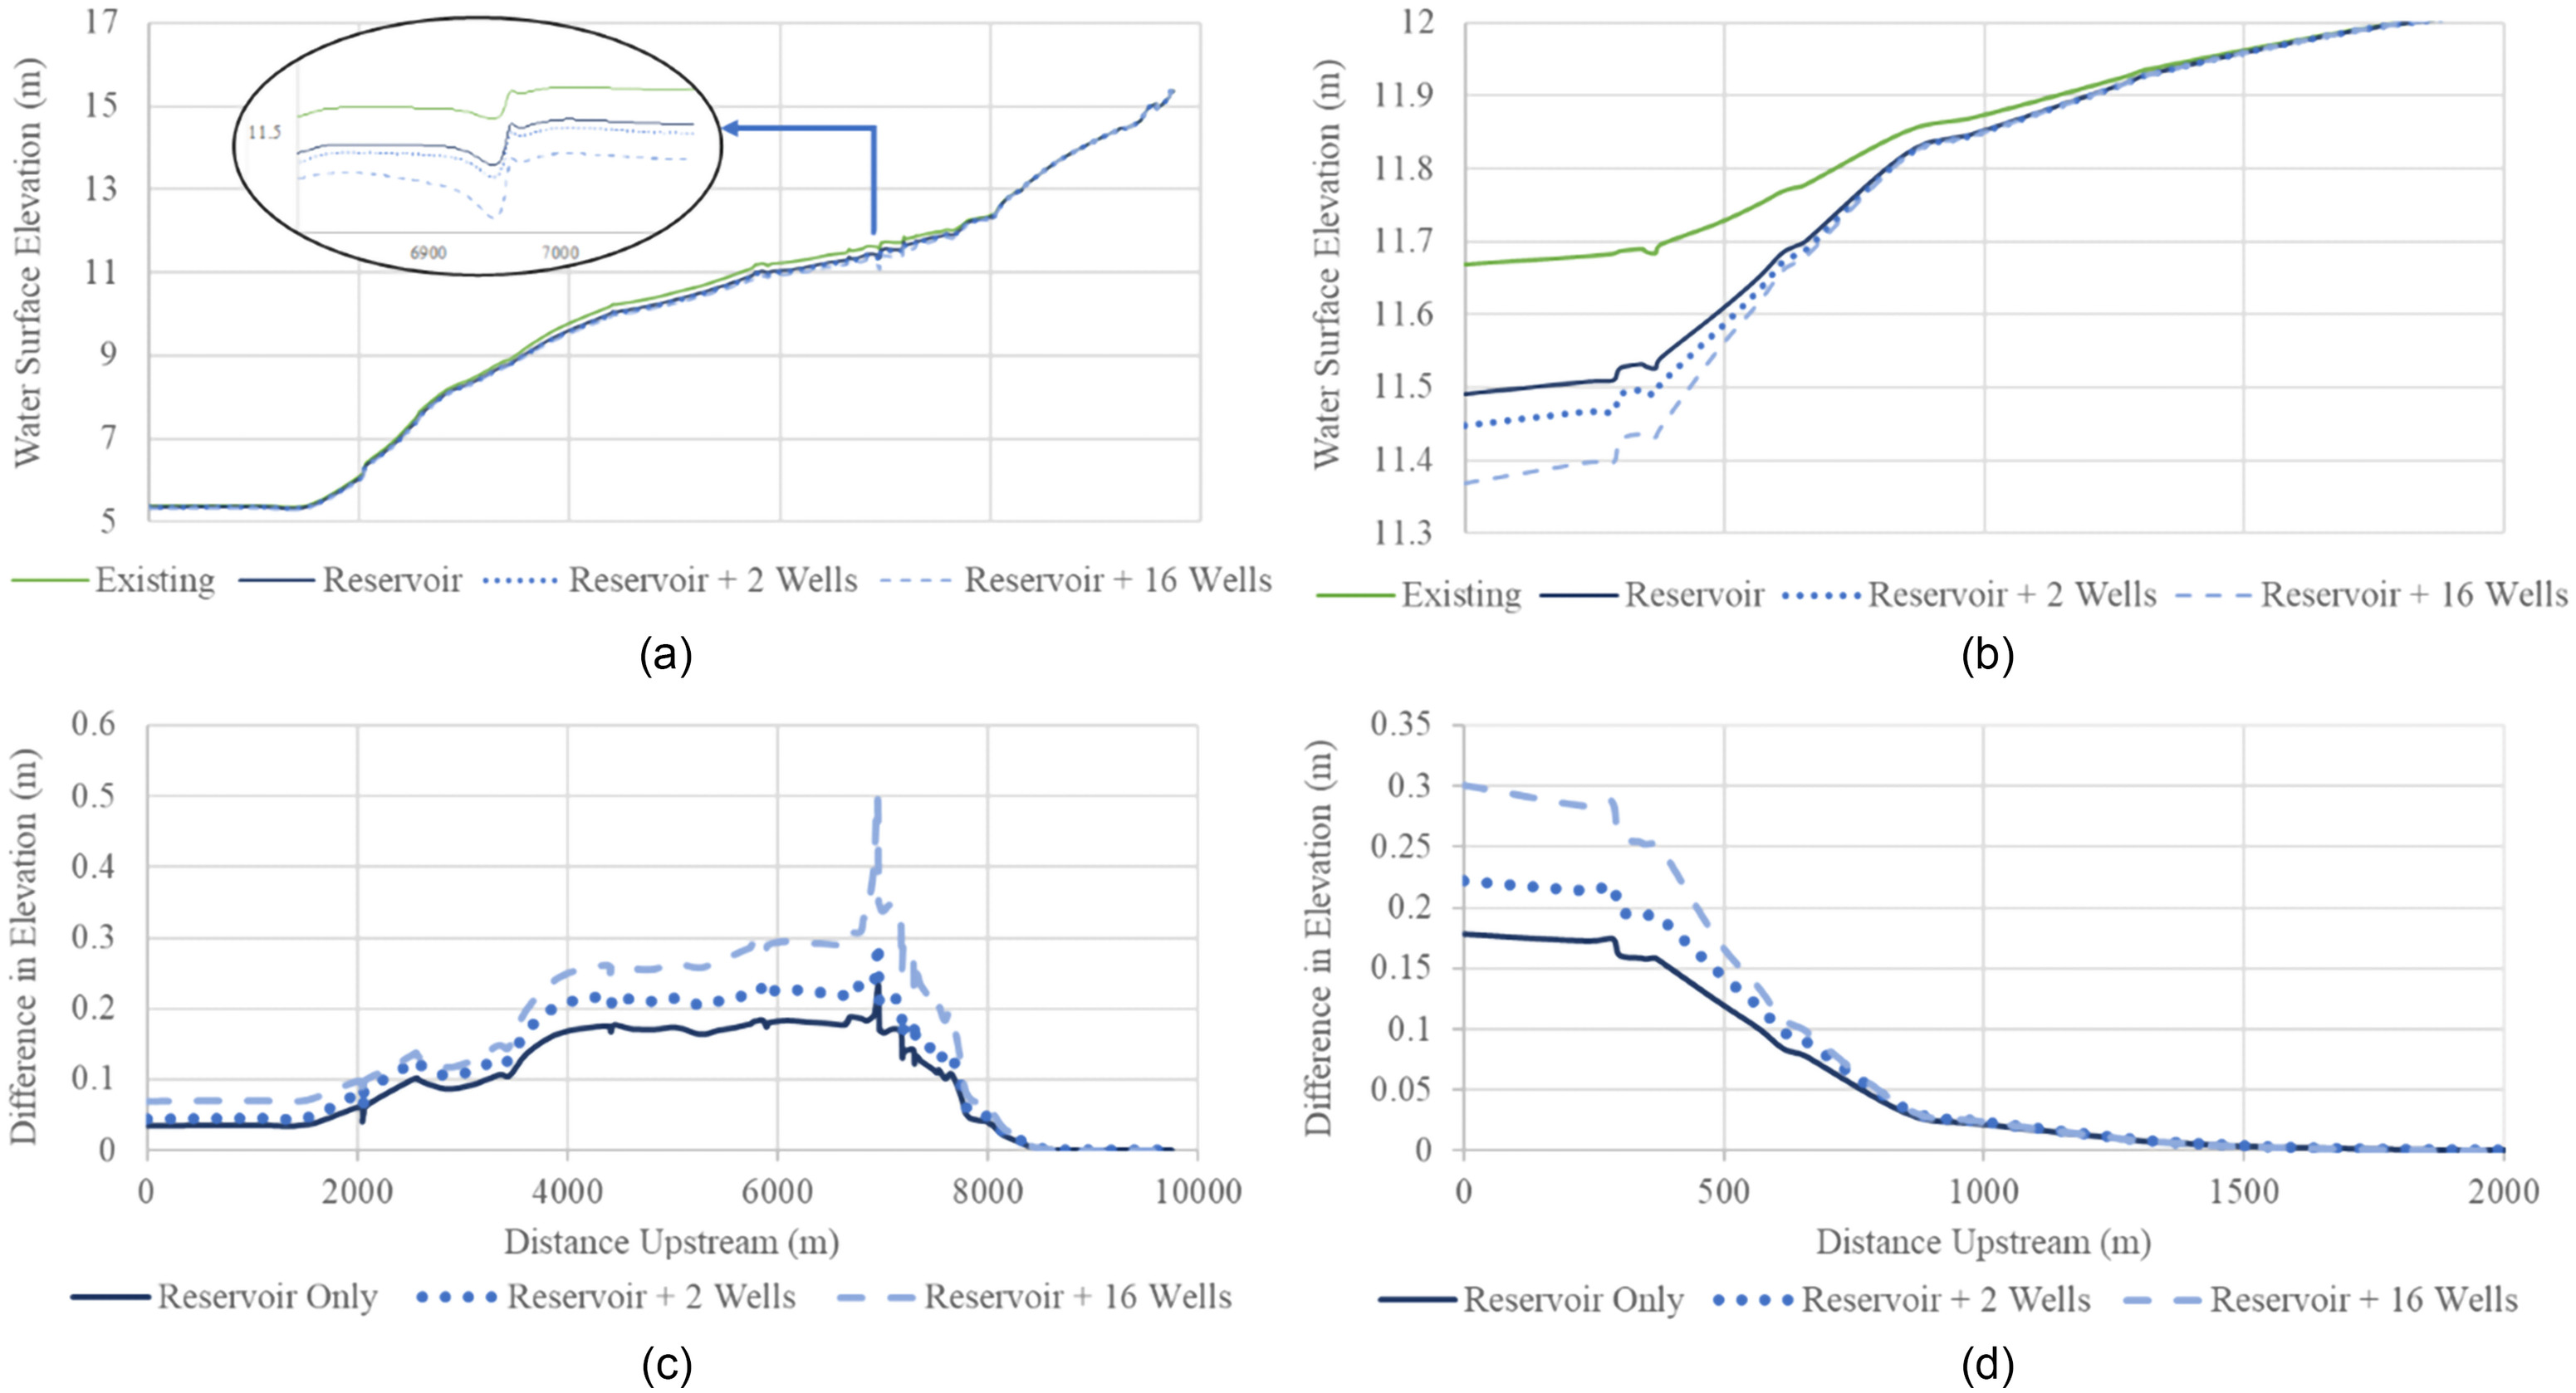
In all examples, the largest reduction in the WSE occurred at the location of the reservoir which is positioned around Station 6800 along Beau Bassin and at the confluence with the Gaston Coulee, which is immediately downstream of the reservoir inlet. This was expected because this was the location where a portion of the flow volume was being diverted from the channel. For the 2004 storm (Fig. 9), the effect of the three flood reduction scenarios was observable by a visible reduction in the WSE beginning around Station 8000 and continuing downstream beyond the reservoir and to the outlet at the Vermilion River [Figs. 9(a and c)]. The Gaston Coulee was also affected by the reservoir and subsurface injection from Stations 0 to 915 before it joined with Beau Bassin [Figs. 9(b and d)]. This reduction was likely caused by the reservoir and injection wells reducing the backwater effect on the Gaston Coulee tributary.
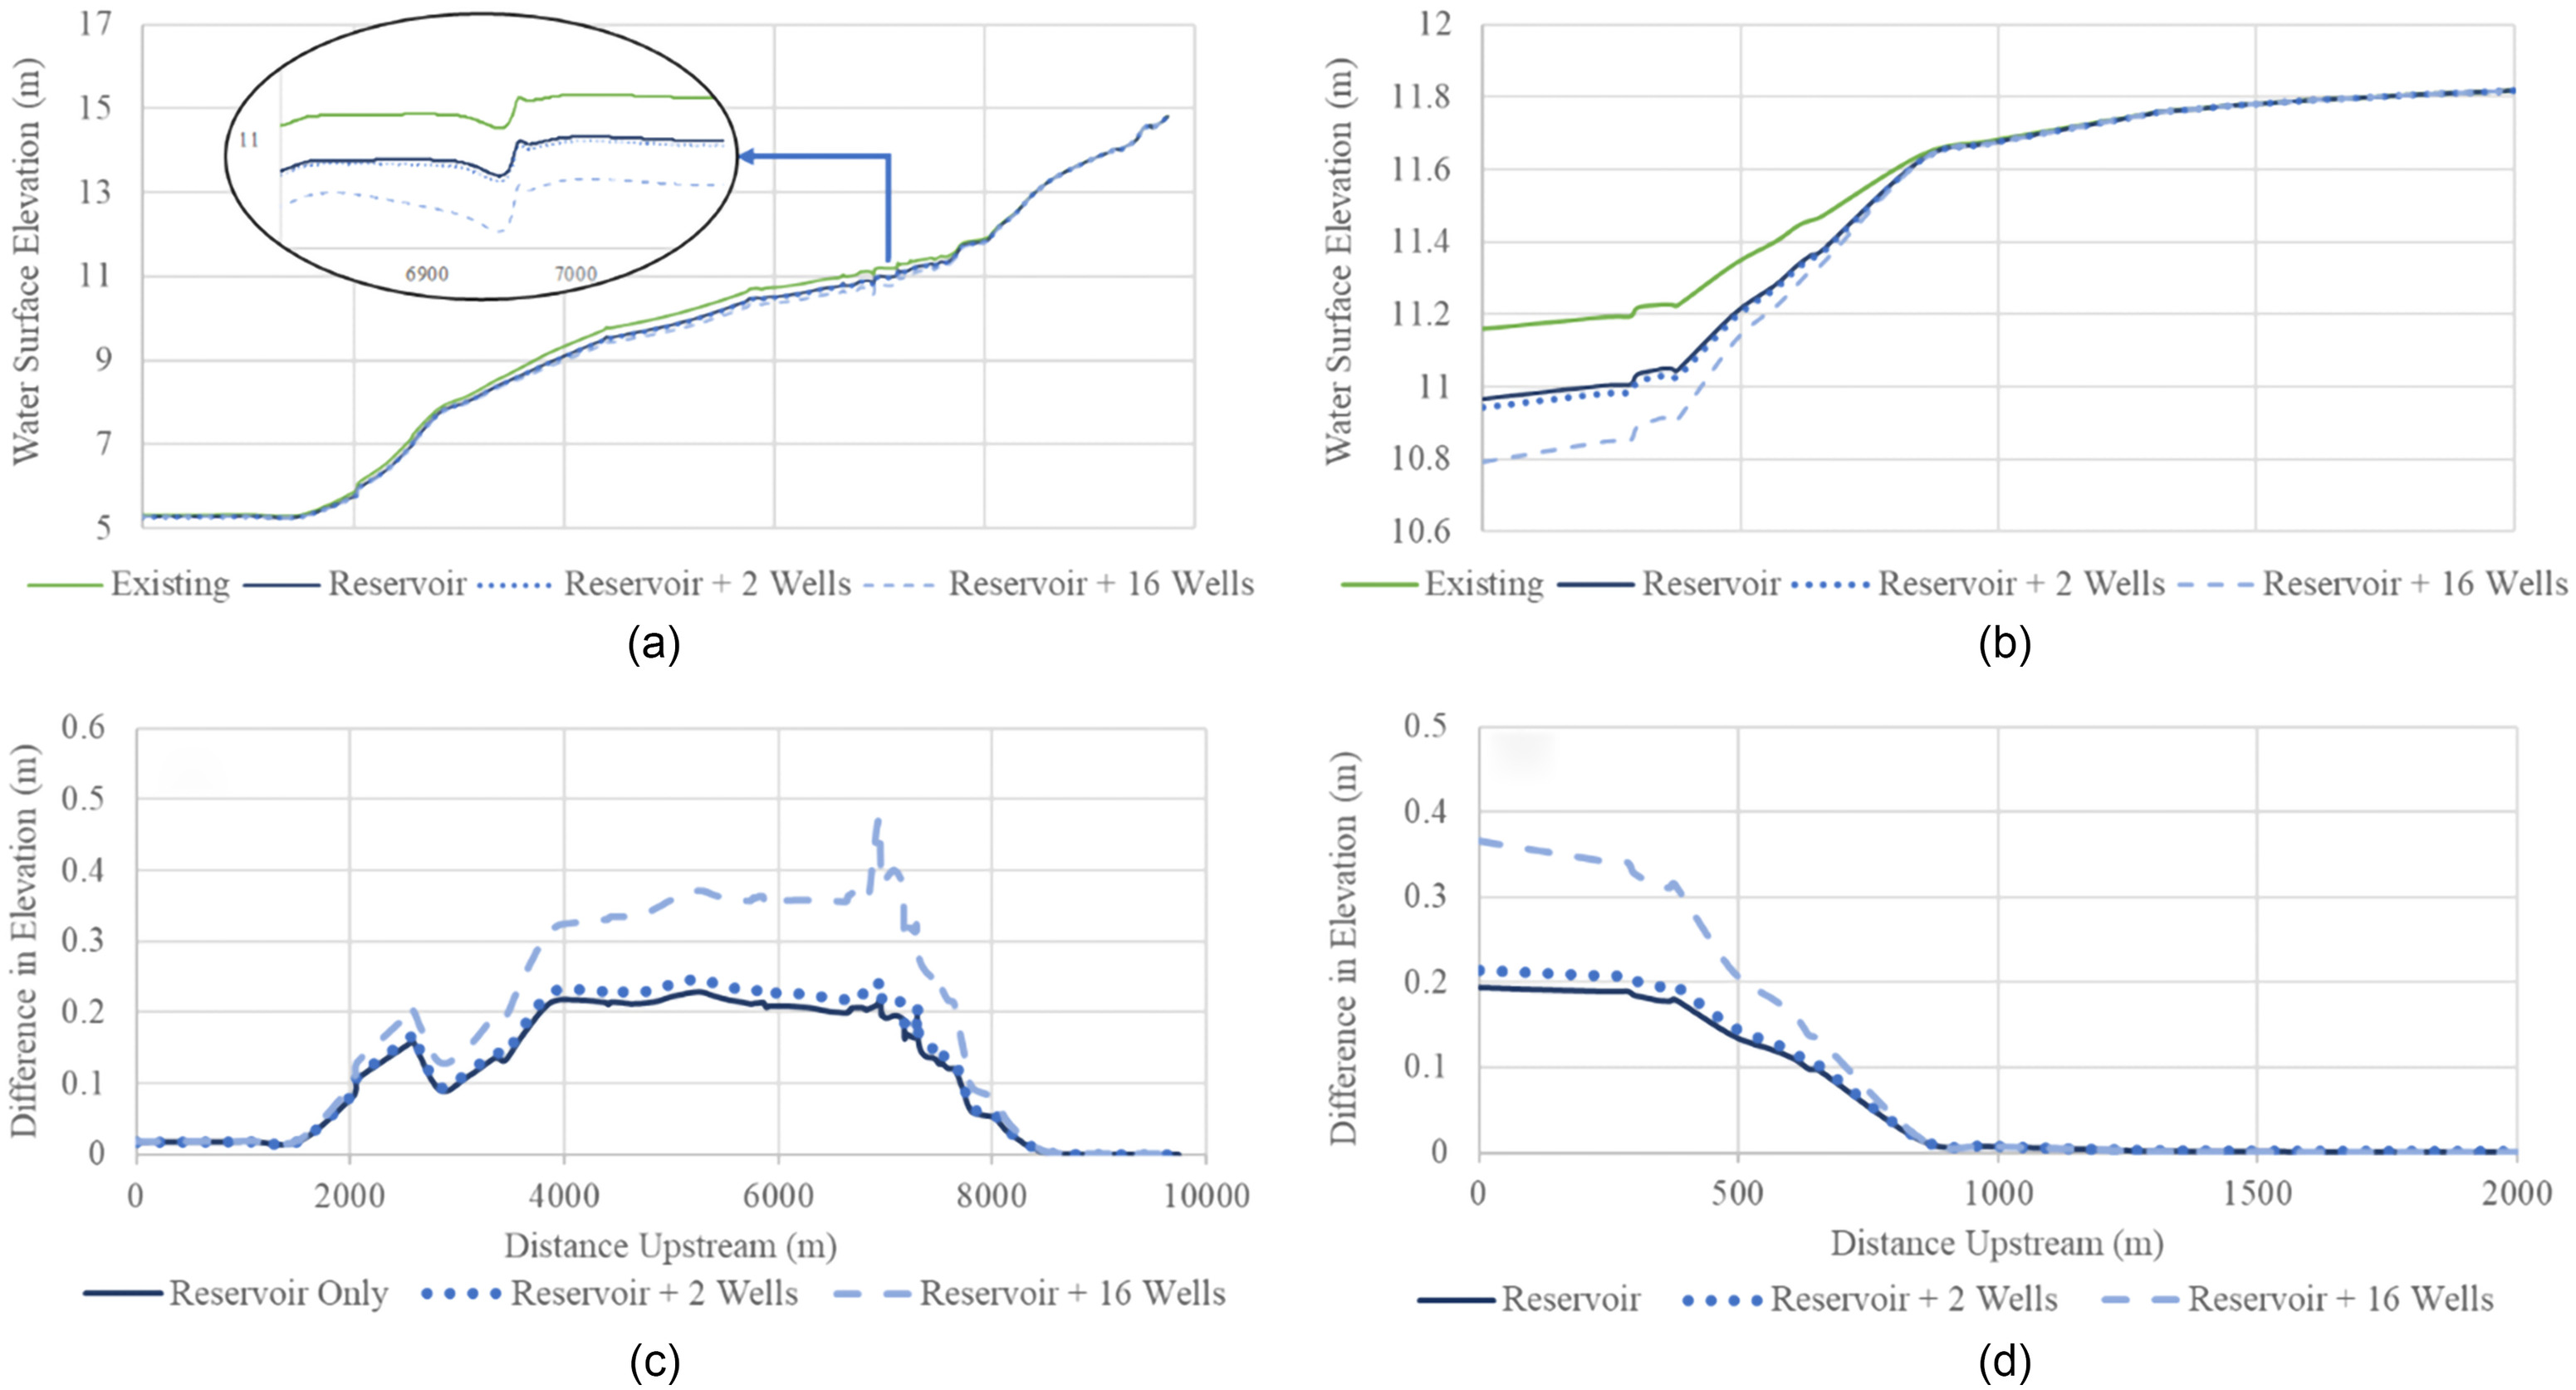
The 2008 storm (Fig. 10) was smaller in size, although the impact of the reservoir and injection wells was spread similarly to the larger 2004 storm. Reductions in the WSE along the channel profile for this smaller storm were more sensitive to changes in slope of the channel bed. This was noticeable around Station 2500 in Beau Bassin [Figs. 10(a and c)], where the change in bed slope caused the WSE in each scenario to return almost to the same condition when no flood management was in place.
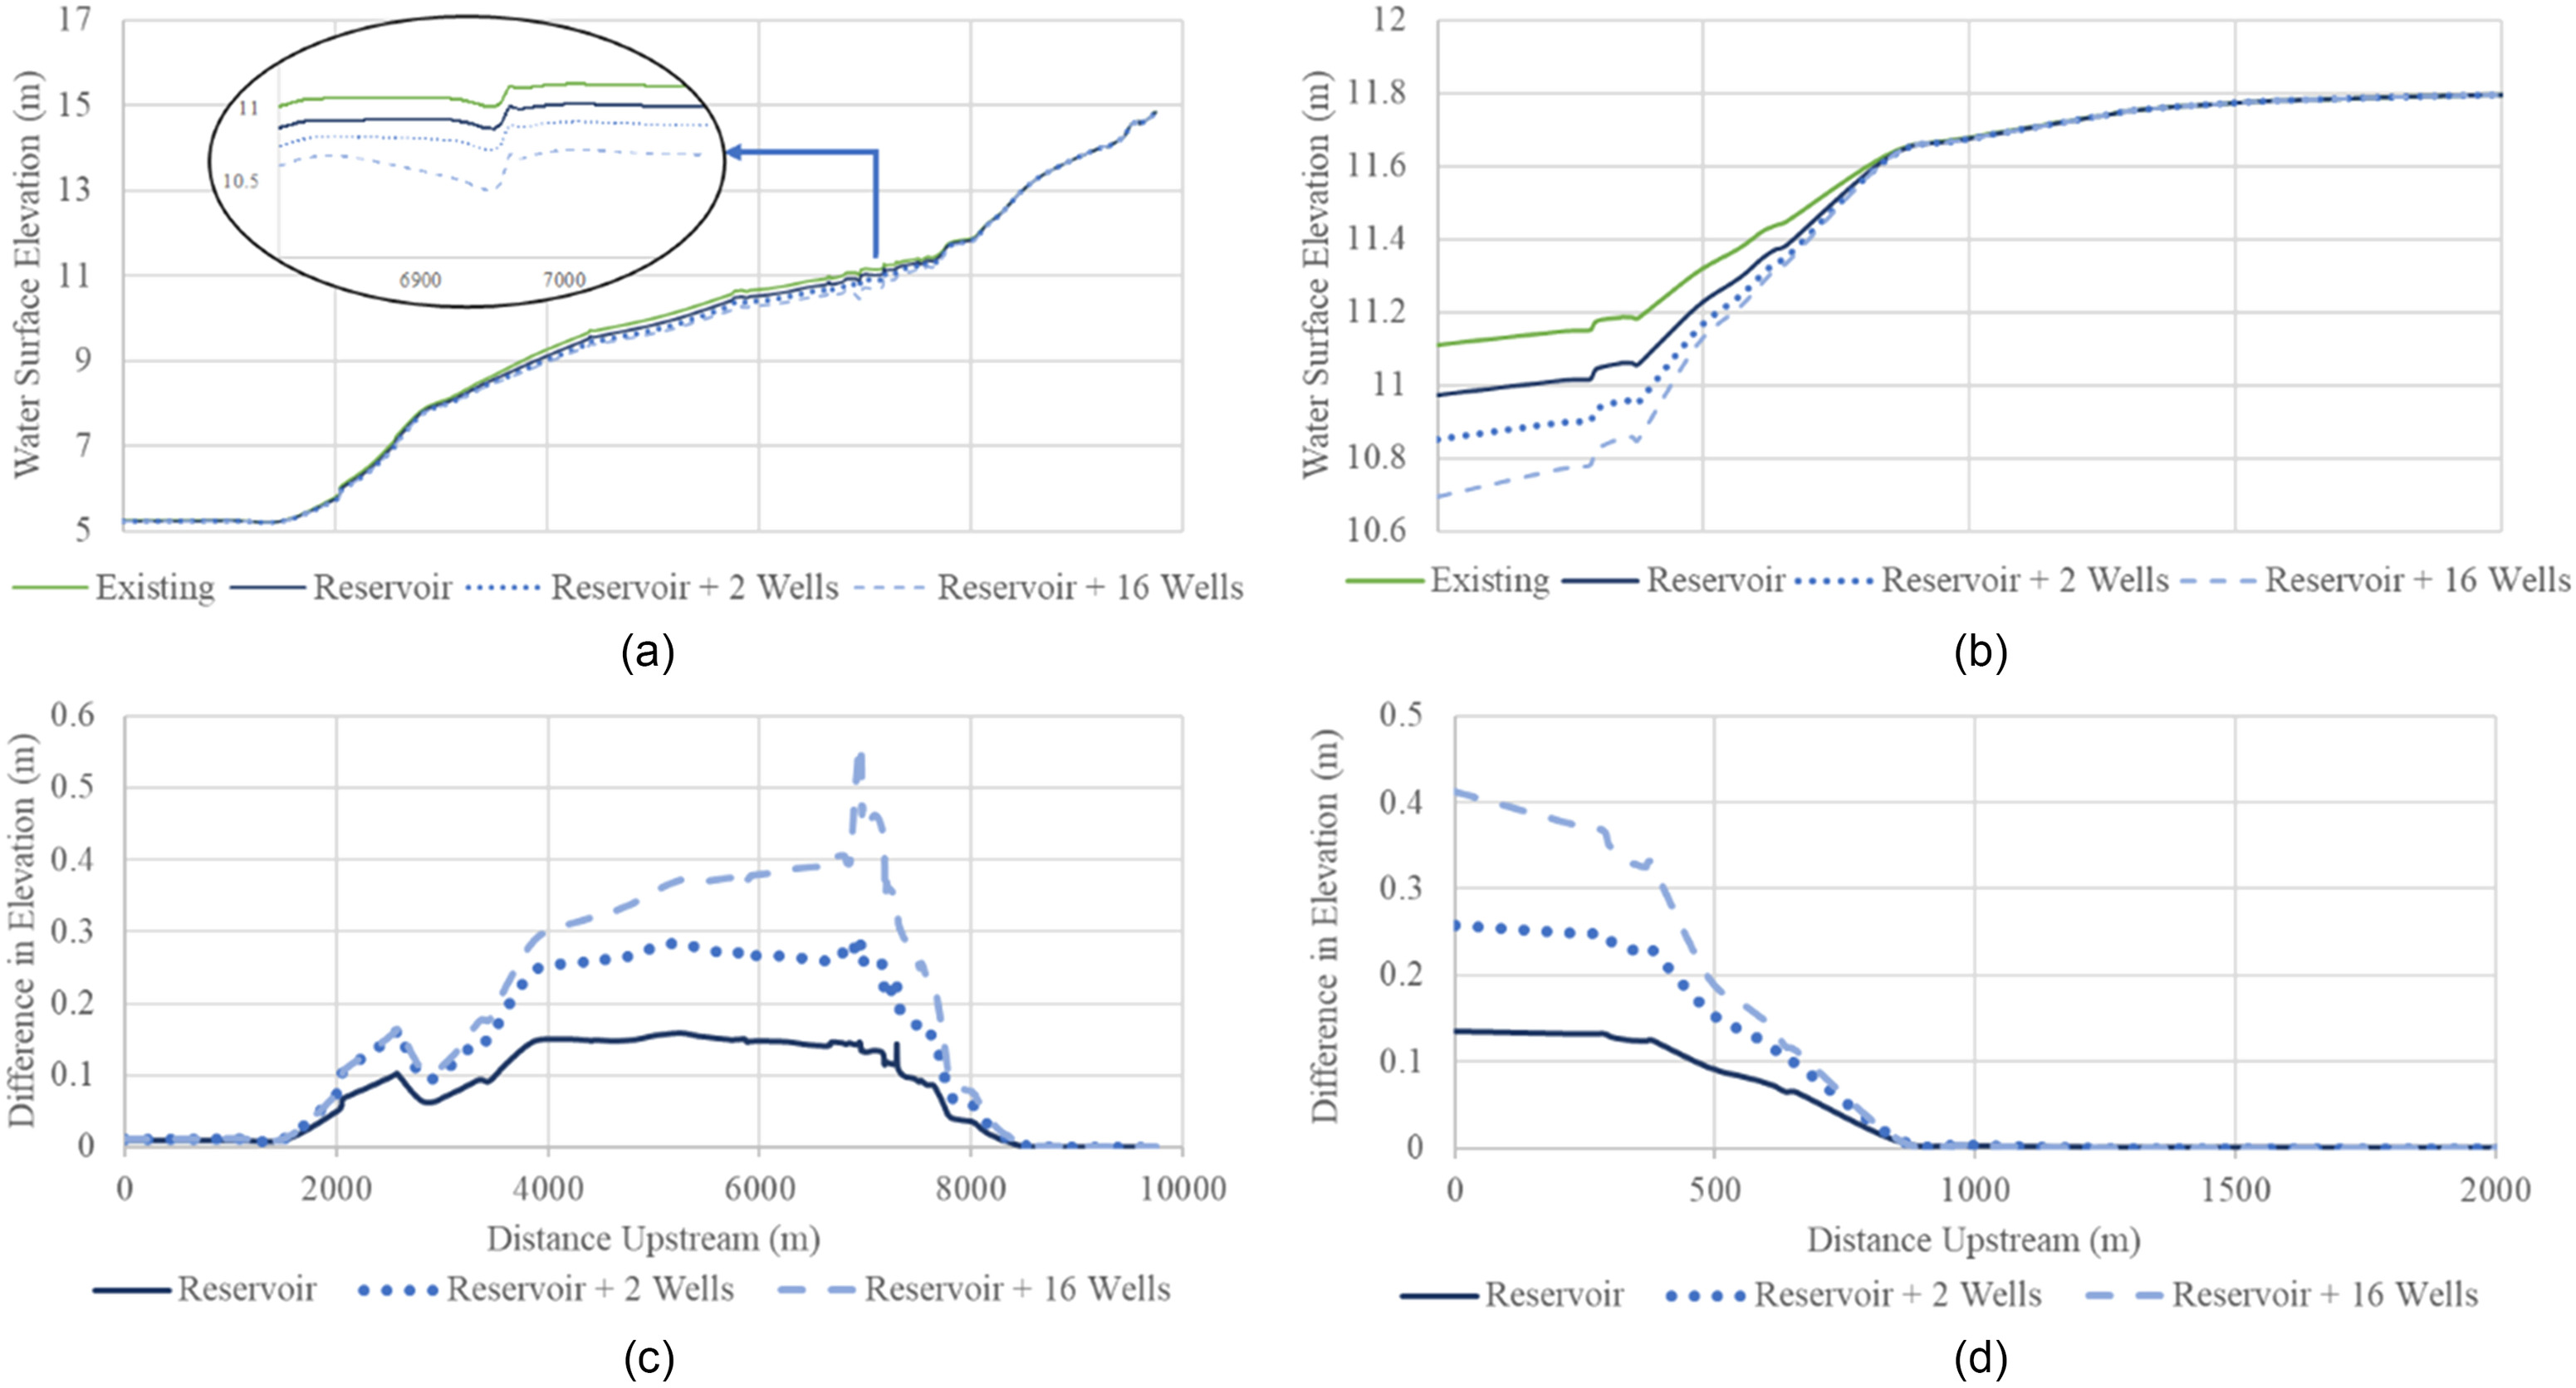
The 2014 storm (Fig. 11) presented a combination of trends in WSE from both previous examples. Overall, the WSE profile examples from these storms demonstrated that as long as the reservoir and injection wells are active, the extent upstream and downstream beyond the reservoir that are affected remained virtually the same [Figs. 11(a and c)]. This also included the extent in which the reduction occurred in the tributary because of the decreased backwater effect [Figs. 11(b and d)].
Flood Inundation Maps
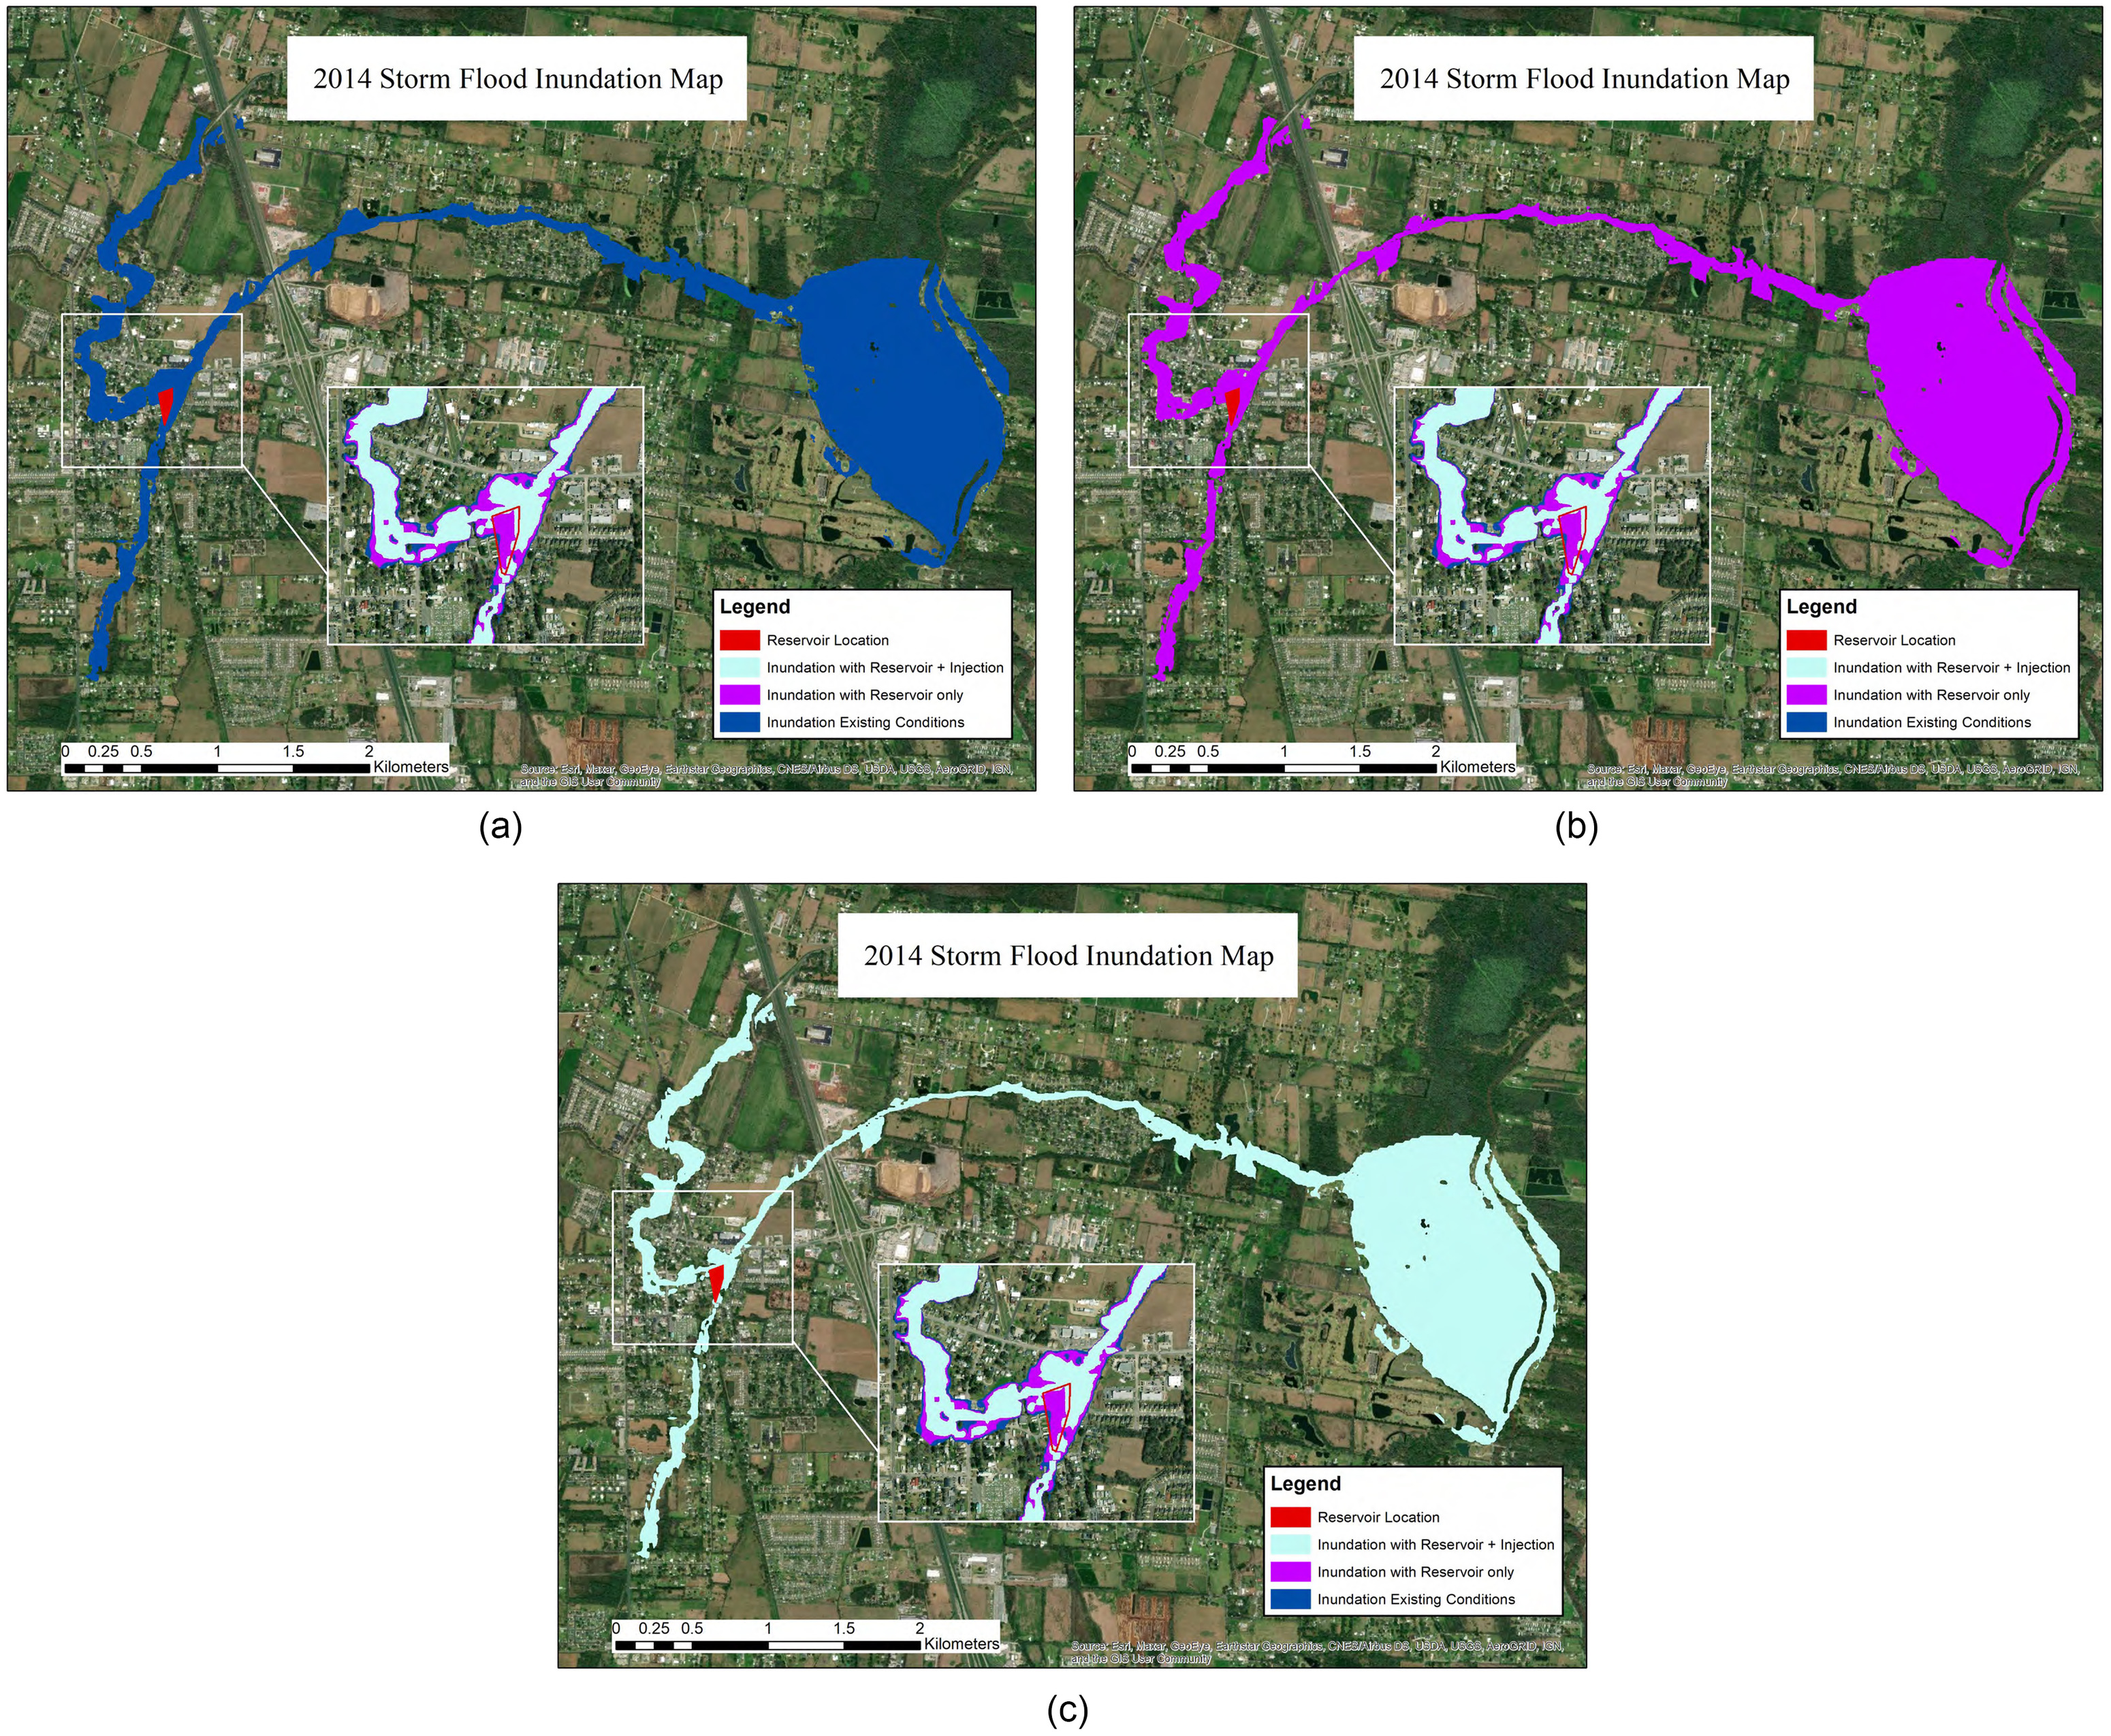
Besides reductions in flood stages, another way to measure the impact on flood mitigation is to quantify the spatial extent of flood inundation. The water surface elevation results from the hydraulic model simulations were processed and spatially projected on the background digital elevation model of the watershed to produce the inundated areas. This was done for each simulated storm under different conditions representing without and with the presence of surface reservoir and the injection operations. Figs. 12(a–c) show an example of the extent of flood inundation for the entire Beau Bassin Coulee and its tributary, Gaston Coulee, during the 2014 storm. These maps illustrate the inundation extent boundary at the time step of the second significant flood peak of the storm in question. Summarized in Table 4 is the percentage of inundated area in the watershed under each of the three storms analyzed in this study for both before and after including pumping and subsurface injection.
| Event date | Inundated area () | Area removed from inundation due to subsurface injection (%) | |
|---|---|---|---|
| Existing conditions | Reservoir + 16 wells | ||
| May 2004 | 3.34 | 3.15 | 5.7 |
| May 2008 | 2.77 | 2.52 | 9.0 |
| May–June 2014 | 2.70 | 2.47 | 8.5 |
The inundation maps illustrate the potential value of capturing surface water and injecting it into the subsurface, reducing the spatial extent of flooding [Fig. 12(c) compared with Figs. 12(a and b)]. The results in Table 4 confirmed that the magnitude of the 2004 storm overwhelmed the system. The addition of the surface reservoir and the injection did not provide much inundation reduction, and it could only relieve the system by 5.7% at its second peak. It was mentioned previously that the use of 16 injection wells for diversion out of the reservoir reduced the channel stage by over 1/3 m at this time step just downstream of the reservoir. However, because the WSE rose well beyond the overbanks of the channel, a reduction of 1/3 m did not impede the runoff from flooding the low-gradient floodplain along the channel length. Comparatively, the 2008 and 2014 storms benefited most from the implementation of subsurface injection because it reduced the inundation area by up to 9.0%. The 2014 storm showed a more significant reduction proximate to the reservoir system compared with the other storms. Even though the 2014 storm was a larger storm than 2008, the reductions were larger, likely because the major storm peaks occurred further apart in time.
Summary and Conclusions
Aquifer recharge operations, such as ASR, are typically used to address groundwater overdrafts, which can also contribute to reducing land subsidence and saltwater intrusion, especially in coastal regions such as Louisiana. The goal of this study was to assess whether capturing surface water and injecting it into the aquifer can provide supplementary flood relief beyond the original function of addressing groundwater sustainability. Unlike previous studies, the focus was on relatively small-scale watersheds where the subsurface injection rates can be sizable enough to reduce flood impacts. Although the focus was on quantifying the impact from a flood mitigation perspective, further research will be required to investigate any possible impacts of surface water injections on the subsurface, including potential increases to the groundwater table. The following is a summary of the main conclusions and recommendations derived from the results of this study:
•
This study concluded that in order for subsurface injection of captured surface water to be effective in a flood-relief application, it should be in conjunction with surface storage reservoirs. Immediate diversion of large volumes into surface reservoirs during a rain event provides the opportunity to inject this volume and remove it from the river system indirectly. The difference in magnitude between runoff flow rates and reasonable injection capability is infeasible for direct application. Therefore, with the diversion of flow into a surface storage area, large volumes of runoff are relieved from the surface system immediately, and as the water is pumped out of the storage area for subsurface injection, more surface storage space is being made available for the system to continue diverting floodwater.
•
The results showed that the impact of subsurface injection was maximized when there were multiple flood-producing rainfall events, as opposed to a single event. This is because the subsurface injection rates may not be large or fast enough to provide considerable flood relief during the first event, but prior to the second event, the surface reservoir is emptied through pumping between events so that the entire storage volume is available by the arrival of the second event. Also, due to the typically low pumping rates of subsurface injection, this system works best for flood mitigation for small watersheds where the runoff volumes are comparably small. Another factor that affected the potential flood mitigation benefits was the height of the weir that allowed the surface reservoir to overflow. For the subsurface function to be maximized for flood mitigation, the reservoir system should have a crest height low enough to interact with the channel during most events.
•
The use of surface water for aquifer recharge is considered a sustainable water management solution, and in this study, it is so for multiple reasons. Although surface storage reservoirs are one of the most common flood mitigation measures, they may not be the most feasible in low-gradient regions such as Louisiana (Vandiver and Hernandez 2004). The size of the reservoir has to be uneconomically large in order to provide enough storage in these low-lying areas, increasing the land acquisition costs. Storing water on the surface also presents concerns of surface contamination, evaporation losses, and seepage. Implementing subsurface injection in conjunction with surface flood detention reservoirs prevents the need for the storage area to be so large, considering the water volume would be regularly emptied. Where subsurface injection is applied, the volume removed from surface storage would be treated and injected into the aquifer for later reuse without risks of surface contamination or evaporation loss (FEMA 2017).
•
The results of the hydrologic and hydraulic analysis for Beau Bassin concluded that at a small watershed scale, the benefits from subsurface injection implementation are consistent under most storm conditions. When using up to 16 wells at a total pumping flow rate similar to , the capability of subsurface injection to assist a surface reservoir in flood stage reduction was less sensitive to the return period of the event. The fraction of additional stage reduction that was provided by 16 injection wells was always for storms under a 25-year return interval. Only when the pumping rates dropped did the system become less consistent and more sensitive to storm magnitude. In the simulations with only two injection wells (a rate of ), small events that did not overtop the crest level of the reservoir weir for very long received little to no relief from the addition of two wells. Likewise, the large events were overwhelming, and two wells were not capable of providing any significant reduction. However, when storm conditions such as those of the 2014 storm (more than two major peaks and a return period of ), two wells were more than sufficient by providing an additional 87% reduction in flood stages. These results also suggested that storms near this size (i.e., 10- to 25-year storms) that also contained multiple peaks would benefit more from subsurface injection in general. Use of 2 versus 16 wells was for the purpose of assessing the effect of subsurface injection capacities; however, it is expected that the specific number of wells that are most feasible for both purposes, aquifer recharge and flood relief, will be site-specific and will also depend on the desired flood reduction levels as well as other economic considerations.
•
The analyses of the maximum WSE profiles of the Beau Bassin system and the flood inundation extent maps presented some interesting patterns as well. Regardless of the magnitude of reduction that occurred through subsurface injection of captured surface water, the locations along the stream where the WSE was impacted were essentially the same for all storms. Likewise, the percentage of inundated area that was removed from the flood plain due to implementation of subsurface injection did not exceed 9.0% even with the use of 16 wells, with lesser reductions in the case of the more extreme storms. These consistencies were likely due to the dominance of the terrain of the floodplain and channel bed.
Data Availability Statement
Some or all data, models, or code that support the findings of this study are available from the corresponding author upon reasonable request (e.g., time series of storms, model inputs, and model outputs).
Acknowledgments
This work is made possible by the support of the Louisiana Sea Grant College Program as part of Program Project ID R/CRM–02 under NOAA Award NA18OAR4170098. The study is also based upon work supported by the US Geological Survey under Grant/Cooperative Agreement No. G16AP00056.
References
Alam, S., A. Borthakur, S. Ravi, M. Gebremichael, and S. K. Mohanty. 2021. “Managed aquifer recharge implementation criteria to achieve water sustainability.” Sci. Total Environ. 768 (May): 144992. https://doi.org/10.1016/j.scitotenv.2021.144992.
Alam, S., M. Gebremichael, R. Li, J. Dozier, and D. P. Lettenmaier. 2020. “Can managed aquifer recharge mitigate the groundwater overdraft in California’s central valley?” Water Resour. Res. 56 (8): e2020WR027244. https://doi.org/10.1029/2020WR027244.
Binkley, B., D. Hamilton, T. Calvin, L. Chen, G. R. Miller, Z. Sheng, R. Kaiser, J. Seifert, and J. Davis. 2017. Drainage reuse initiative feasibility study: Phase I. Houston: Harris County Flood Control District.
Borrok, D. M., and W. P. Broussard. 2016. “Long-term geochemical evaluation of the coastal Chicot Aquifer system, Louisiana, US.” J. Hydrol. 533 (Feb): 320–331. https://doi.org/10.1016/j.jhydrol.2015.12.022.
Budhu, M., and I. B. Adiyaman. 2010. “Mechanics of land subsidence due to groundwater pumping.” Int. J. Numer. Anal. Methods Geomech. 34 (14): 1459–1478. https://doi.org/10.1002/nag.863.
Cunningham, R., D. Gisclair, and J. Craig. 2009. The Louisiana statewide LIDAR project. Baton Rouge, LA: Louisiana State Univ.
Dokka, R. K. 2011. “The role of deep processes in late 20th century subsidence of New Orleans and coastal areas of southern Louisiana and Mississippi.” J. Geophys. Res. Solid Earth 116 (B6): 13–23. https://doi.org/10.1029/2010JB008008.
Eldardiry, H., E. Habib, and D. M. Borrok. 2016. “Small-scale catchment analysis of water stress in wet regions of the US: An example from Louisiana.” Environ. Res. Lett. 11 (12): 124031. https://doi.org/10.1088/1748-9326/aa51dc.
Eldardiry, H., E. Habib, Y. Zhang, and J. Graschel. 2017. “Artifacts in stage IV NWS real-time multisensor precipitation estimates and impacts on identification of maximum series.” J. Hydrol. Eng. 22 (5): E4015003. https://doi.org/10.1061/(ASCE)HE.1943-5584.0001291.
FEMA. 2017. Innovative drought and flood mitigation projects. Washington, DC: FEMA.
Habib, E., A. Henschke, and R. F. Adler. 2009. “Evaluation of TMPA satellite-based research and real-time rainfall estimates during six tropical-related heavy rainfall events over Louisiana, US.” Atmos. Res. 94 (3): 373–388. https://doi.org/10.1016/j.atmosres.2009.06.015.
Habib, E., B. F. Larson, W. K. Nuttle, V. H. Rivera-Monroy, B. R. Nelson, E. A. Meselhe, and R. R. Twilley. 2008. “Effect of rainfall spatial variability and sampling on salinity prediction in an estuarine system.” J. Hydrol. 350 (1–2): 56–67. https://doi.org/10.1016/j.jhydrol.2007.11.034.
Hershfield, D. M. 1961. Rainfall frequency atlas of the United States, for durations from 30 minutes to 24 hours and return periods from 1 to 100 Years. Washington, DC: US Dept. of Commerce, Weather Bureau.
Jones, C. E., K. An, R. G. Blom, J. D. Kent, E. R. Ivins, and D. Bekaert. 2016. “Anthropogenic and geologic influences on subsidence in the vicinity of New Orleans, Louisiana.” J. Geophys. Res. Solid Earth 121 (5): 3867–3887. https://doi.org/10.1002/2015JB012636.
Konikow, L. F. 2013. Groundwater depletion in the United States (1900–2008) scientific investigations report 2013–5079, 63. Reston, VA: USGS.
LaHaye, O., E. H. Habib, H. Vahdat-Aboueshagh, F. T. C. Tsai, and D. Borrok. 2021. “Assessment of aquifer storage and recovery feasibility using numerical modeling and geospatial analysis: Application in Louisiana.” J. Am. Water Resour. Assoc. 57 (3): 505–526. https://doi.org/10.1111/1752-1688.12923.
Lin, Y., and K. Mitchell. 2005. The NCEP stage II/IV hourly precipitation analyses: Development and applications. College Park, MD: National Centers for Environmental Prediction.
Liu, J., K. Rich, and C. Zheng. 2008. “Sustainability analysis of groundwater resources in a coastal aquifer, Alabama.” Environ. Geol. 54 (1): 43–52. https://doi.org/10.1007/s00254-007-0791-x.
LSU (Louisiana State University). 2020a. “DOQQ 2008 coastal imagery.” Accessed October 20, 2022. https://atlas.ga.lsu.edu/datasets/doqq-2008-coastal-imagery/.
LSU (Louisiana State University). 2020b. “Louisiana statewide lidar.” Atlas: Louisiana Statewide GIS. Accessed August 10, 2020. https://atlas.ga.lsu.edu/datasets/lidar2000/.
Perica, S., S. Pavlovic, M. St. Laurent, C. Trypaluk, D. Unruh, and O. Wilhite. 2013. Precipitation-frequency atlas of the United States, NOAA Atlas 14, volume 9, version 2: Southeastern States. Silver Spring, MD: US Department of Commerce, National Oceanic and Atmospheric Administration, National Weather Service.
Sargent, B. P. 2011. Water use in Louisiana, 2010. Baton Rouge, LA: Louisiana Department of Transportation and Development Water Resources.
Sharif, R. B., E. H. Habib, and M. ElSaadani. 2020. “Evaluation of radar-rainfall products over coastal Louisiana.” Remote Sens. 12 (9): 1477. https://doi.org/10.3390/rs12091477.
Slater, L. J., and G. Villarini. 2016. “Recent trends in US flood risk.” Geophys. Res. Lett. 43 (24): 12–428. https://doi.org/10.1002/2016GL071199.
Thomas, D., J. Hook, G. Hoogenboom, K. Harrison, and D. Stooksbury. 2000. “Drought management impacts on irrigation in Southwest Georgia.” In Proc., 2000 ASAE Annual Int. Meeting. Reston, VA: ASCE.
USDA NRCS (National Resources Conservation Service). 1986. Technical release 55: Urban hydrology for small watersheds. Washington, DC: USDA.
USGS. 2014. National land cover database (NLCD) 2011 land cover conterminous United States. Washington, DC: USGS. https://doi.org/10.5066/P97S2IID.
Vandiver, L., and D. Hernandez. 2004. Assessment of stormwater management in coastal South Carolina: A focus on stormwater ponds and low impact development (LID) practices. Charleston, SC: South Carolina Sea Grant Consortium.
Yang, Q., and B. R. Scanlon. 2019. “How much water can be captured from flood flows to store in depleted aquifers for mitigating floods and droughts? A case study from Texas, US.” Environ. Res. Lett. 14 (5): 054011. https://doi.org/10.1088/1748-9326/ab148e.
Zektser, S., H. A. Loáiciga, and J. T. Wolf. 2005. “Environmental impacts of groundwater overdraft: Selected case studies in the southwestern United States.” Environ. Geol. 47 (3): 396–404. https://doi.org/10.1007/s00254-004-1164-3.
Information & Authors
Information
Published In

Journal of Water Resources Planning and Management
Volume 149 • Issue 10 • October 2023
Copyright
This work is made available under the terms of the Creative Commons Attribution 4.0 International license, https://creativecommons.org/licenses/by/4.0/.
History
Received: Feb 9, 2022
Accepted: May 24, 2023
Published online: Aug 4, 2023
Published in print: Oct 1, 2023
Discussion open until: Jan 4, 2024
ASCE Technical Topics:
- Basins
- Bodies of water (by type)
- Business management
- Environmental engineering
- Floods
- Mitigation and remediation
- Practice and Profession
- Recharge basins
- Retention basins
- River engineering
- River systems
- Sea water
- Stilling basins
- Surface water
- Water (by type)
- Water and water resources
- Water management
- Water storage
- Water supply
- Water supply systems
- Water treatment
- Watersheds
Authors
Metrics & Citations
Metrics
Citations
Download citation
If you have the appropriate software installed, you can download article citation data to the citation manager of your choice. Simply select your manager software from the list below and click Download.