User Perspectives on Distance- and Time-Based Road Tolling Schemes: European Case Study
Publication: Journal of Transportation Engineering, Part A: Systems
Volume 147, Issue 9
Abstract
Understanding users’ attitudes toward national-level road pricing schemes is crucial for successful implementation. Despite the European Union (EU) policy agenda, there is a gap in understanding users’ attitudes toward distance-based (DB) and time-based (TB) pricing considering features of pricing technology, willingness to pay, and previous pricing scheme experiences. This gap is especially prominent in the southern and eastern European countries. This research explores factors affecting the maximum acceptable price for DB and TB pricing, as well as users’ experience and attitudes, using a case study of North Macedonia. The analysis framework uses statistical modeling of questionnaire data, including structural equation modeling. The findings show that the TB concept is more suitable for daily users, while a DB scheme is more suitable for less frequent motorway users. In addition to use frequency, income and previous experience with pricing technology were the strongest predictors of willingness to pay. The findings provide lessons on the distributive benefits and burdens of DB and TB schemes, as well as their implications for policy learning by considering context-dependent trade-offs between user and policymaker perspectives in medium-income transition European countries.
Introduction
In general, two basic motorway pricing concepts define what users pay, related to how charges are levied. These are distance-based (DB) pricing and time-based (TB) pricing (Matthews and Nellthorp 2012). DB pricing relies on users paying the toll according to their effective distance of motorway travel, i.e., the number of kilometers traveled between toll gates. In the case of TB road pricing, the toll is calculated as the lump sum value based on the time that a driver has paid for (i.e., day, week, month, or year) regardless of the actual kilometers traveled. The DB pricing concept is implemented using manual toll collection gates and automatic coin machines that require the user to carry cash or a credit card, as well as electronic toll collection (ETC) technologies with and without barriers. ETC technologies include numerous systems based on such technologies as dedicated short-range communication, radio frequency, global navigation satellite systems and cellular networks, and automated number plate recognition systems, which usually do not require users to engage in monetary transactions at toll gates (European Parliament 2014, Milenković et al. 2018; Navandar et al. 2019). For TB pricing, instead of paying at toll gates, users must purchase a vignette (or toll pass used in European countries) from a dedicated location, which in some countries could also include gas stations. The purchased vignette must be affixed to the windshield in the form of stickers, or in the case of electronic vignettes, the vehicle’s license plate number is uploaded to the enforcement system for later automatic recognition. Both pricing schemes could be adjusted based on other vehicle parameters, such as vehicle size or emission class.
In the last two decades, the European Union (EU)-level policy has been framing the implementation of national motorway pricing through several directives, such as 2004/52/EC, 2006/38/EC, and 2011/76/EU. These policies aim at internalizing the external costs of road transportation and interoperability of road pricing systems across EU states. The EU-level policy has advocated for DB toll road systems because such systems are expected to ensure fairer rates across Europe and reduce vehicle use and emissions. However, in contrast to this policy initiative, Europe faces significant challenges in harmonizing the different road pricing structures that arose as a result of different pricing schemes, price rates, and pricing technologies in the various European countries. In addition to the aforementioned policy objectives to introduce and harmonize road pricing in Europe, an important contrasting perspective is that of user acceptance and potential regressive impacts, which often relates to political acceptance of road pricing (Hensher and Bliemer 2014; Ison 2017; Li et al. 2020; Rouhani 2018; Rouwendal and Verhoef 2006; Souche-Le Corvec et al. 2016). From a user perspective, one must deal with alternative road pricing schemes, such as paying per kilometer traveled or paying for a certain amount of time on a given road network. Additionally, users face alternatives as a result of differences in pricing schemes based on vehicle parameters and differences in interacting with pricing technology, which includes several alternative systems (e.g., vignette, radio frequency identification, automated number plate recognition, or global navigation satellite) (European Parliament 2014; Milenković et al. 2018). In the context of multiple alternatives, users are challenged in understanding their advantages and disadvantages, especially since users’ characteristics can shape their attitudes, such as income or previous experiences with road pricing. Thus, understanding users’ acceptance of road pricing schemes requires analyzing the multidimensionality of user perspectives (Lo and Hickman 1997).
In contrast, previous scarce research on user perspectives about TB and DB pricing mostly focused on western and northern European countries, with limited discussion on southern and eastern Europe, which often have very important policy objectives related to infrastructure financing (Carpintero 2010; Glavic et al. 2017). In addition, previous researchers rarely focused on simultaneously comparing users’ perspectives on TB and DB road pricing in the context of existing road pricing schemes, accounting for details of the particular pricing scheme and technology. Keeping all of the foregoing points in mind, this paper uses a case study in North Macedonia, a country in southeastern Europe, to explore factors affecting the maximum acceptable price for DB and TB road pricing and users’ experience and preferences with respect to DB and TB road pricing. The results provide a basis for discussing the advantages and disadvantages of both pricing concepts from the perspective of different user categories and a basis for policy learning about tolling concepts in Europe and worldwide. To this end, the following section presents an overview of the interdependent economic and sociopsychological dimensions of road pricing, highlighting the issue’s multidimensional user perspectives. The third section presents the case study background, while the fourth section describes the implemented methodology based on user questionnaires and statistical modeling. The fifth section presents the findings from the statistical modeling. The last section concludes the paper with a discussion of findings in relation to previous knowledge, reflection on policy learning related to DB and TB road pricing models, an outline of this case study’s limitations, and further research pathways.
Background of User Perspectives on Road Pricing
The theory of road pricing has a history spanning three centuries, starting with Dupuit, Pigou, and Knight (Pigou 1920; Knight 1924; Bonnafous and Crozet 2018). The central point from users’ perspective is that the provision of scarce resources requires users to pay an additional so-called tax equal to the marginal external costs for other road users, infrastructure, and both society and the environment (Nash and Matthews 2013; Ison 2017; Milenković et al. 2020). Thus, the price that reflects these additional externalities acts as a demand-management signal to a user’s decision-making about whether, how, when, and using which route to travel (Morrison 1986; Matthews and Nellthorp 2012; Ison 2017). Because national road pricing is also an important source of infrastructure-related funds in some cases, determining the price usually involves a trade-off between a minimum toll rate that users can afford while providing a sufficient return on investment (Chi et al. 2017). Thus, road pricing for motorways is distinct from the pricing of urban roads, often referred to as congestion charging, implying its higher emphasis on different policy objectives, with urban users also having different travel preferences (Milenković et al. 2019).
At the core of a theoretical understanding of road pricing is a monetary boundary value where an individual would be willing to pay for the use of goods or services, often referred to as willingness to pay (WTP) (Hanemann 1991; Small 2012). One of the most important related factors in WTP identified across the literature is user income (Hensher and Goodwin 2004; Abrantes and Wardman 2011). In addition to income, previous research has identified several other factors, including road type, trip purpose, the amount of travel time savings, total travel time, total distance traveled, travel day, time of day, frequency of road use, motorway distance traveled, additional passengers in the vehicle, and estimated traffic accident risk (Brownstone and Small 2005; Brownstone et al. 2003; Hensher and Goodwin 2004; Hensher et al. 2009; Ho et al. 2016; Jou et al. 2012; Jou and Huang 2014; Yusuf et al. 2014; Baumgarten and Middelkamp 2015; Glavić et al. 2017). The second important value after WTP is willingness to accept (WTA) or maximum acceptable price (MAP), which is the upper limit at which the individual would forego using particular goods or services. In road pricing policy practice, WTP and MAP provide a range of values where a potential politically acceptable road price could be sought for national motorway pricing in medium-income countries (Glavić et al. 2017). In addition to these theoretical perspectives, the actual practice of formulating a road pricing scheme requires taking into account additional psychological perspectives in order to make acceptable trade-offs between efficiency, effectiveness, and social feasibility (Rothengatter 2003; Rouwendal and Verhoef 2006; Verhoef et al. 1996).
Despite the wide range of literature on user perspectives, most of the previous literature focuses on only one motorway pricing scheme without accounting for differences between schemes (Jaensirisak et al. 2005; Bueno et al. 2017; Jou et al. 2012). In general, research has shown that more complex road pricing schemes are likely to be less acceptable (Bonsall et al. 2007; Vrtic et al. 2007; Zmud and Arce 2008). Compared to urban road pricing (e.g., O’Mahony et al. 2000; Nielsen 2004), the literature on national road pricing focusing on both DB and TB schemes in Europe remains limited. In particular, there exists a dearth of research from eastern and southeastern European countries, such as Poland, Czechia, Slovakia, Hungary, Romania, Bulgaria, Slovenia, Croatia, Bosnia and Herzegovina, Montenegro, and Serbia. For example, assessing the impact of various scheme elements on acceptability, Vrtic et al. (2007) found that DB motorway tolls and kilometer-dependent tolls were the preferred pricing types for all roads in Switzerland, in contrast to area licensing and time-dependent tolls. Research from Germany focused on assessing TB and DB road pricing scenarios in order to understand user perspectives and behavioral change in connection with road pricing by conducting a stated-preference laboratory experiment with 155 participants (Francke and Kaniok 2013). Additional research from Germany, where vehicles under 3.5 t currently do not have to pay road tolls, focused on assessing welfare changes from TB and DB road pricing scenarios, including compensation measures and based on travel diaries (Raub et al. 2013). The only research efforts focused on Europe exploring user perspectives on different road pricing schemes in the context of existing road pricing schemes were conducted in Norway (Odeck and Kjerkreit 2010) and Spain (Bueno et al. 2017). This Norwegian case also considered regional differences in relation to road pricing acceptance, similar to the extension of the research conducted on Spanish road pricing (Gomez et al. 2017). In addition, the latter research was extended to an analysis of factors affecting ETC adoption (Heras-Molina et al. 2019). No research has focused exclusively on understanding users’ attitudes toward both DB and TB pricing concepts considering features of pricing technology, in the context of an already existing motorway pricing scheme, and focused on medium-income countries in southeastern Europe.
Case Study Background on Europe and North Macedonia
Policy initiatives across European countries, as well as associated technological developments, have created the conditions for uptake of some form of road pricing policy in almost all European countries. The only countries not having any form of road pricing of their infrastructure are Cyprus, Finland, Monaco, and Ukraine. Such policy learning on road pricing between European countries is in line with the domino theory on road pricing outlined in the 1990s (Grieco and Jones 1994). However, despite some amount of policy learning, these road pricing schemes are not harmonized since there is a diversity of pricing schemes across Europe. The countries that use TB road pricing for passenger cars are Switzerland, Czechia, Slovakia, Austria, Slovenia, Hungary, Bulgaria, and Romania. In addition, TB pricing for trucks is mandatory in Sweden, Denmark, Lithuania, Latvia, Estonia, Luxembourg, and the Netherlands. Other countries in Europe use DB pricing. Even within the same country, different vehicle categories might be charged using different toll collection technologies and pricing schemes, such as DB road pricing using toll gates for heavy vehicles and TB road pricing for passenger and light vehicles (Matthews and Nellthorp 2012). Currently, the EU parliament is discussing whether light- and heavy-duty vehicles should be charged depending on their actual road use and the pollution generated (i.e., polluter pays principle). According to these plans, the EU countries using TB road pricing should switch to DB road pricing starting in 2023 in the case of trucks and buses and in 2027 for vans and minibuses. Thus, the overall EU-level policy leans heavily toward implementing a DB road pricing scheme in the long term.
The Republic of North Macedonia is a relatively small country, with a 2019 population of 2,083,419 (Worldometers 2019), geographically located in southeastern Europe, and currently in the transition process toward EU membership. The current national motorway network of North Macedonia has 242 km, which matches the relatively small geographic size of . The entire motorway network is under a DB road pricing scheme, with 10 toll gates located at motorway interchanges. The road charge is paid manually, in cash, with an approximate value of for passenger cars, while heavy vehicles pay a higher price. The policy on the toll amount and method for charging it was adopted first by the Public Enterprise for State Roads on July 20, 2009, and later amended on July 10, 2014. The revenue from motorway tolls constitutes an important source of funds for the Public Enterprise for State Roads, in addition to fuel and vehicle taxation and other commercial activities. Despite some independent units and sectors in the Public Enterprise’s organizational structure, toll collection stations are Public Enterprise’s subsidiaries, whose job it is to charge tolls, and they do not enjoy the status of legal entities and do not act independently. However, a legal case was settled in 2013, where 86 people were sentenced to jail and 11 to monetary penalties for fraud and corruption in toll collection. After this incident, toll collection technology in North Macedonia was upgraded. The current system often faces congestion in peak and summertime periods. For example, one trip of 50–100 km requires three or four stops at toll plazas and waiting in queues to pay tolls. In comparison to the national motorway network, the secondary road network is of relatively low quality and often includes stretches through urban areas.
The road pricing scheme and policy in North Macedonia is framed by a larger context of a country aspiring to become an EU member. In particular, North Macedonia is a landlocked and multiethnic transition society with many structural challenges, much like other medium-income countries from southeastern Europe (UN 2019). For example, an average monthly income in North Macedonia is around €400. Stronger economic growth is tied to gradually improving but still inadequate infrastructure, and a significant level of public spending on infrastructure projects is expected to continue in the near future. Joining the EU also remains an important policy priority for long-term policymaking related to the transportation system. At the moment, there is an ongoing policy process governing the upgrade of the outdated manual toll system, related to possible changes in infrastructure financing (Glavić et al. 2016). Thus, the upgrade of the toll system is related not only to conventional policy objectives for the national motorway network in southeastern Europe, such as lack of public funding (Glavic et al. 2016). Policymaking in connection with pricing scheme upgrades is also framed around the ongoing integration into the EU transportation system as part of the wider societal transition toward EU membership. In this context, possible funding challenges could result in failure to adequately operate motorway infrastructure, thereby degrading the service level and causing traffic diversion to lower rank roads, i.e., so-called rat running. This negative feedback loop could lead further to a range of environmental, safety, and infrastructure consequences. Previous research indicated that the aspiration to join the EU as a policy anchor can also be a source of challenges for the democratic development of the North Macedonian governance system (Risteska 2013). With this context in mind, North Macedonia represents a good case study of the complexity of user perspectives on alternative road pricing schemes and for drawing lessons on pricing policy across diverse governance contexts.
Methodology
The overall aim of this study is to explore the preferences of (1) existing motorway users as drivers of passenger cars (2) with previous experience of both DB and TB road pricing schemes. Regarding the former, drivers other than those using passenger cars tend to have different travel patterns and, thus, preferences for WTP and use road tolling. For example, commercial drivers do not pay toll charges themselves, their employers do. With regard to the latter, this means that, besides experience using motorways in North Macedonia that currently apply a DB scheme, the respondents had to have had experience with pricing in other countries with a vignette system, for example, neighboring Bulgaria. Given the research aim of exploring road users’ attitudes toward DB and TB road pricing schemes and technology, the methodology used here centers on questionnaire-based data collection and a quantitative analysis framework, including statistical modeling. This section describes the questionnaire design, data collection, and sampling process, as well as the quantitative analysis framework, including ANOVA, structural equation modeling (SEM), and logistic regression. Methodological decisions were made considering relations between these three aspects of questionnaire design, data collection process, and requirements for statistical modeling.
Questionnaire Design
The anonymous questionnaire was designed with a view toward recruiting the desired respondent type (i.e., person from North Macedonia with both DB and TB scheme experience) and minimizing the participant dropout rate. Thus, the landing page of the questionnaire clearly stated that the questionnaire focused on the aforementioned respondent type, included basic definitions of DB and TB pricing concepts, and contained the initial control questions. A DB road pricing system was introduced to the respondents through the description of the ETC system, while a TB road pricing system was introduced through a description of vignettes. The first control question asked the respondent to select the ETC system used previously, with the following options: ETC with barriers, ETC without barriers, and have not used ETC. The second control question asked the respondent to answer whether she has used a vignette system and, in the case of an affirmative answer, to estimate the number of kilometers traveled and the time period when a vignette was used. After the landing page, if the respondent had answered affirmatively to both ETC and vignette questions, the respondent proceeded to the questionnaire proper, which had four parts. More information about sampling and filtering is in the next section, “Data Collection Process and Sample Characteristics.”
The first part of the questionnaire was focused on socioeconomic characteristics of the respondents as well as the patterns of their motorway usage. Questions were about gender (male/female/other), age group (18–29, 30–39, 40–49, 50–59, ), education level (elementary school, high school, vocational school, university), personal average monthly income in euros (, 250–500, 500–750, 750–1,000, 1,000–1,250, ), frequency of motorway usage (everyday, several times per week, several times per month, several times per year), average monthly distance traveled on motorway in kilometers (, 30–60, 60–90, 90–120, 120–150, ), the most common day of the week of motorway usage (workday, weekend) and the most common reason for motorway usage (commuting to work/school, leisure and shopping, work-related, other). The income categories were selected in line with standard income categories used in North Macedonia, while distance traveled categories were selected based on estimates from regional travel survey. This part of the questionnaire had an additional filter question that asked about the most frequently used vehicle types on motorways (motorcycle, passenger car, light-duty vehicle, heavy-duty vehicle, bus, semitrailer truck). This question, together with the question about the total amount of kilometers traveled, was used to filter out respondents who were not predominantly passenger car users (see the section “Data Collection Process and Sample Characteristics”).
The second part of the questionnaire focused on the WTP and MAP questions, similarly to previous studies (e.g., Odeck and Kjerkreit 2010; Chen and Wen 2014; Glavić et al. 2017; Gomez et al. 2017; Jou et al. 2012; Milenković et al. 2019). WTP and MAP questions were first asked in relation to DB pricing, and respondents were required to answer the question of how much they were willing to pay (WTP) and at what price they would stop using the motorway (MAP). These two question types had two versions, with one asking for a toll estimate taking into account only travel time savings in comparison to using a two-lane road, and with the other asking for a toll estimate taking into account all other benefits from using the motorway compared to a two-lane road, such as a higher level of service and higher level of traffic safety. For the estimate travel time saved, the value was described as 30–40 min per 100 km traveled. This value was determined based on the data from automatic traffic counters regarding the average travel speed of passenger cars on two-lane roads and motorways. For example, passenger cars using a national motorway network tend to have average speeds of approximately , while those using a secondary road network drove around . Thus, 30–40 min of travel time savings is a realistic difference for a trip of 100 km switching from a secondary road to the motorway network. These WTP and MAP questions were in line with the contingent valuation method for stated preferences, where respondents are asked to select one value among the option prices ranging from €1 to €10, in €1 increments. The values were selected based on a range of values around the current toll price of three euros, although skewed for higher values, in order to explore a wider set of values, while also reducing the cognitive load for the respondent if the respondent had to provide a value herself. This exploratory approach, as used in some of the previous road pricing case studies (Glavić et al. 2017; Jou et al. 2012; Milenković et al. 2019), was necessary given the dearth of research on road pricing in southeastern Europe, which makes it hard to conduct stated-choice experiments. Moreover, the stated-choice approach was not used because it would significantly increase the time and effort needed to complete the questionnaire. Finally, the objective of this study was not to derive the road price value for either direct policy implementation or further use in transport modeling, so the stated-choice approach was not considered necessary.
Similarly, after the WTP and MAP questions for the DB pricing scheme, the respondent was asked to answer WTP and MAP questions related to the TB pricing scheme. Respondents were asked to state how much would they would pay in euros for weekly (, 3–6, 6–9, ), 10–day (, 5–8, 8–11, 11–14, ), monthly (9–12, 12–15, 15–18, 18–21, 21–24, ), or annual (30–50, 51–70, 71–90, 91–110, ) vignettes. The same values were used on the MAP question about the vignette price at which the respondent would stop driving on motorways. The range of values for vignette prices were developed taking into account actual vignette prices from other southeastern European countries, namely, Bulgaria, Romania, Hungary, Czechia, Slovakia, and Slovenia (Table 6). An additional reason for asking about WTP and MAP values was to filter out respondents from the sample. That is to say, MAP values had to be equal to or greater than the WTP values, because this conformed with the expectations of rational respondent choice (see the section “Data Collection Process and Sample Characteristics”).
The third part of the questionnaire was related to users’ attitudes toward the characteristics of the toll system, as well as their explicit preferences for one of the two pricing concepts. The respondents were first asked to evaluate the importance of the pricing system characteristics, using a five-point Likert scale, with one being the least important characteristic and five the most important. Pricing technology characteristics were grouped into four categories to minimize the number of questions: technical, traffic, social, and environmental characteristics. Technical characteristics pertain to (1) the interoperability of the system for use in other countries; and (2) flexibility in using the pricing device for other purposes, such as parking or navigation. Traffic characteristics pertain to (1) toll collection without frequent or excessive stopping, (2) traveling at a desired speed and without losing travel time, and (3) safe driving conditions in connection with acceleration/deceleration and changing lanes. Social characteristics pertain to (1) easy procedure for buying and recharging the toll collection device, (2) the cost of the toll collection device, (3) fairness of pricing, and (4) the possibility of fraud or misuse by the toll collection party. Finally, environmental characteristics pertain to negative impacts, such as noise or air pollution or visual degradation of the environment due to road pricing devices. The last question of this questionnaire was a binary preference choice between DB and TB road pricing schemes and technology.
Data Collection Process and Sample Characteristics
The data collection process was defined to shorten the time needed for completing the survey, aiming for a maximum of 10 min, owing to the expected low willingness to participate in these studies by the general public. To acquire a statistically significant number of respondents’ questionnaires, data collection was based upon two collection methods: an online survey and field surveys. In the first phase, an online questionnaire was sent to various companies, organizations of the employed, unemployed, or retired in order to expand the representativeness of the sample. In the second phase of data collection, a field survey was used to increase the sample size beyond the minimum threshold. This task involved the distribution of a paper-based questionnaire to respondents. A total of 327 questionnaires were collected where respondents had experience with DB and TB schemes and were predominantly passenger car drivers. Of the 327 total responses collected, 251 (76.8%) were collected online and 76 (23.2%) in the field. These 327 questionnaires were validated for respondents who had had experience with both DB and TB pricing schemes and further filtered for consistency of the respondents’ answers using a comparison of WTP and MAP values. That is, the consistency check involved evaluating whether MAP values were equal to or greater than WTP values. After this process, the final sample included a total number of 284 valid questionnaires. Out of 284 respondents included in the final sample, 216 (76.1%) were collected online and 68 (23.9%) in the field.
The final sample size of 284 respondents adequately represented the anticipated motorway passenger car driving population with respect to age, education, and income, as well as frequency of motorway usage. The total sample had 189 (66.5%) male and 95 female (33.5%) participants. The largest part of the sample consisted of motorway users aged 30–39 (23%), 40–49 (27%), and 50–59 (21%), but the sample also included the youngest 18–29 (19.4%), as well as the oldest population 60+ (9.5%). In addition, 18.7% of sample respondents earned a monthly income of less than €250, 40.5% earned between €250 and €500, 22.9% earned between €500 and €750, 9.5% earned between €750 and €1,000, and finally 8.5% earned monthly income greater than €1,000. In comparison, the motorization rate in North Macedonia from 2017 was 194 passenger cars per thousand inhabitants (Marinković 2019). The inhabitants aged 25–54 years make up the largest share of the population (44.3%), while the median age in this country is 37.8 years (Worldometers 2019). The average monthly net wage paid per employee in 2019 was €417 (Republic of Macedonia State Statistical Office 2019). We have also tested the differences between the responses of the field survey respondents and online questionnaire respondents (Table 1). The use of ANOVA determined that the preferences of the field survey respondents and online questionnaire respondents did not differ statistically significantly (for WTP values , and for MAP values ). Consequently, this parameter was not included in SEM analysis, and two samples were merged into one.
| Respondents’ preference | Field survey | Online questionnaire | -value | -value | ||
|---|---|---|---|---|---|---|
| Mean | Median | Mean | Median | |||
| WTP: all benefits | 3.75 | 4 | 3.75 | 3.5 | 0.001 | 0.982 |
| MAP: all benefits | 5.11 | 5.5 | 5.08 | 5 | 0.017 | 0.895 |
Considering the aforementioned sample size, we must highlight that several previous surveys that examined users’ attitudes and preferences regarding road pricing schemes were based on samples of similar or even smaller sizes. For example, sample sizes included 211 (Farrell and Saleh 2005), 114 (Di Ciommo et al. 2013), 206 (Grisolía et al. 2015), 121 (Politis et al. 2020), and 155 respondents (Francke and Kaniok 2013). In the analyses of transportation system participants’ behaviors and attitudes, SEM analysis was used based on the sample size, which corresponds to the sample size in this research (further details about SEM can be found in the “DB and TB Analysis Framework” section). For example, Şimşekoğlu and Lajunen (2008) aimed to explain self-reported seat belt use among front seat passengers on rural and urban roads using SEM analysis and relying on a sample of 277 respondents. Xu et al. (2010) analyzed the determinants of travel information use using SEM analysis and a sample of 247 respondents. Kline et al. (1998a, b) proposed that a minimum sample size of 200 was needed to reduce bias to an acceptable level for any type of SEM analysis. Although there is little consensus on the recommended sample size for SEM (Sivo et al. 2006), Hoelter (1983), and Garver and Mentzer (1999) also proposed a critical sample size of 200. Thus, we have adopted this rule of thumb, where 200 is understood as the minimum threshold to provide a sufficiently statistically significant sample for adequate analysis. Also, the sample size of this research is appropriate for ANOVA (Ross and Willson 2017) and for binary logistic regression (van Smeden et al. 2019).
DB and TB Analysis Framework
To formulate the analysis framework, the normality of distribution of the sample data was tested by visual evaluation of the histogram shape and by the Kolmogorov-Smirnov test. Since the distributions of all continuous variables (WTP and MAP values) did not statistically significantly deviate from the normal distribution (Table 2), and considering that one of the aims of this study was to explore the factors affecting user preferences related to TB and DB road pricing, the overall analysis framework consists of the following three components:
1.
DB pricing–only analysis
a.
Arithmetic mean and standard deviation of WTP and MAP values for only travel time savings and for all benefits.
b.
ANOVA estimation of the difference significance of MAP values for all motorway benefits at different levels of personal income, motorway usage frequency, and average distance traveled.
c.
SEM exploration of predictors’ impact on users’ MAP.
2.
TB pricing–only analysis
a.
Arithmetic mean and standard deviation of WTP and MAP values for vignettes in different periods and comparing them to actual vignette values from a reference set of EU countries.
b.
ANOVA estimation of difference significance of MAP values for different levels of personal income, motorway usage frequency, and average distance traveled.
c.
SEM exploration of predictors’ impact on users’ MAP.
3.
Comparative DB and TB pricing analysis
a.
Frequency analysis of preferences between DB or TB pricing scheme based on motorway usage frequency.
b.
Binary logistic regression to estimate impact of frequency of motorway usage on likelihood that user would prefer either DB or TB road pricing.
c.
Ratio of normalized (price/100 km) estimates of MAP values for DB and TB pricing in relation to motorway usage frequency.
| Variable | Kolmogorov-Smirnov test (D) | -value |
|---|---|---|
| WTP: all benefits | 0.052 | 0.063 |
| MAP: all benefits | 0.053 | 0.053 |
SEM was selected as the analysis method for understanding behavioral intentions and relationships among the variables impacting behavior (Bamberg and Schmidt 2001; Jakobsson et al. 2000; Chen et al. 2007; Kim et al. 2013). One of SEM’s strengths is its flexibility, which permits examination of several variables and their interrelationships simultaneously, the use of various types of data (e.g., categorical, dimensional, censored, count variables), and comparisons across alternative models (Hoe 2008; Wolf et al. 2013). Within this research, SEM coefficients were used to express the strength and the sign of causal paths between predictors. SEM testing used chi-square (), df, -value, root-mean-square error of approximation (RMSEA), comparative fit index (CFI), Tucker–Lewis index (TLI), and normed-fit index (NFI), excluding nonsignificant variables and nonsignificant coefficients. Neither of the initial SEM models for DB and TB schemes, including all the variables for MAP DB and TB, had a good fit to the data, with , , , , , , , and , , , , , , and , respectively. When evaluating SEM results in an iterative fashion to obtain a final model, we followed best practice recommendations in the literature, highlighting, for example, that the test should be nonsignificant at , , , , and standardized root-mean-square residual (Hu and Bentler 1998, 1999). The most common challenge identified in earlier research, and in our case as well, is that the test is significant, and one or more of the four indexes are unacceptable under the proposed cut-offs (Bagozzi 2010). Thus, Browne and Cudeck (1993) suggest that a value of about 0.08 or less for the RMSEA would indicate a well-fitting model. Thus, we followed a recommendation that the proposed cut-off values are too conservative under certain conditions, especially if research is geared toward exploratory analysis (Bagozzi 2010).
In an iterative process, two final SEM models were developed, one with the DB MAP as the dependent variable and the other with the TB MAP as the dependent variable. In both SEM models the predictor patterns consists of the most common day of motorway usage and purpose of motorway usage. In addition, the latent variables that refer to users’ attitudes toward the importance of toll-collection system characteristics are technical characteristics, traffic characteristics, and social characteristics, in line with the categories in the last part of the questionnaire. Environmental characteristics was another variable considered for SEM based on the questionnaire, but neither for DB nor TB pricing model were they statistically significant for inclusion in the final formulation. In addition to these latent variables, both models contain predictors referring to the monthly income of respondents and their frequency of motorway usage. The DB model contains a variable related to the ETC experience, while the TB model contains the variable vignette experience.
Analysis of DB and TB Pricing Schemes
Results of Distance-Based Pricing Analysis
Descriptive Statistics for DB Scheme
The results show that MAP values were higher than WTP values. In addition, the users perceived values for both WTP and MAP as higher when all benefits were considered than when only travel time savings were taken into account (Table 3).
| WTP and MAP values | Mean | Standard deviation |
|---|---|---|
| WTP: travel time savings () | 2.66 | 1.24 |
| WTP: all benefits () | 3.75 | 1.44 |
| MAP: travel time savings () | 4.11 | 1.58 |
| MAP: all benefits () | 5.08 | 1.85 |
ANOVA Results for DB Scheme
Table 4 shows mean values of MAP for all benefits for user groups with different monthly income. The values from Table 4 show that the mean MAP values are higher for groups of users with higher income. ANOVA was conducted to determine whether the MAP values for users of different income groups differed significantly. The ANOVA results showed that there was a statistically significant difference between mean MAP values in the five income groups [; ]. Additional comparisons by means of the Tukey honestly significant difference (HSD) test showed that respondents with incomes of up to €250 and those with incomes of €250–€500 differed statistically significantly from all other groups, as well as from each other. Only the €750–€1,000 income group did not statistically significantly differ from the €500–€750 income group () and the group with incomes higher than €1,000 ().
| Variables | Categories | MAP () | |||
|---|---|---|---|---|---|
| Mean | Standard deviation | -test | -value | ||
| Income | 3.59 | 1.35 | 32.739 | ||
| €250–€500 | 4.65 | 1.54 | |||
| €500–€750 | 5.82 | 1.54 | |||
| €750–€1,000 | 6.35 | 1.62 | |||
| 7.04 | 1.77 | ||||
| Frequency | Daily users | 2.87 | 1.25 | 83.672 | |
| Monthly users | 5.42 | 1.50 | |||
| Annual users | 5.86 | 1.54 | |||
| Distance | 5.29 | 1.86 | 0.590 | ||
| 30–60 km | 4.93 | 2.03 | |||
| 60–90 km | 5.19 | 1.91 | |||
| 90–120 km | 4.79 | 1.68 | |||
| 120–150 km | 4.84 | 2.01 | |||
| 5.05 | 1.67 | ||||
Table 4 also presents the MAP values for user groups with different frequencies of motorway usage. Based on the presented values, it can be concluded that users who use motorways less frequently are more willing to pay than those who use motorways more frequently. The ANOVA results showed that there was a statistically significant difference between mean MAP values in three usage frequency groups [; ]. Additional comparisons by means of the Tukey HSD test showed that the mean value of daily motorway users differed significantly from the mean values for monthly users () and annual users (). The weekly user group did not statistically significantly differ from the annual user group (). However, it should be emphasized that the value of statistical significance was close to the threshold. Finally, ANOVA was applied to determine whether the mean MAP values differed for users with different average distance traveled on the motorway (Table 4). The results of the ANOVA showed no statistically significant differences in the mean MAP values for users with different average distance traveled on the motorway [; ].
SEM Results for DB Scheme
The obtained final model for the MAP DB (Fig. 1) had a good fit to the data (, , , , , ). The proposed model explains 61.1% of variability and therefore makes a model of acceptable quality. The results of the final MAP DB model show that Patterns have a statistically significant positive impact on frequency. These results could be interpreted as stemming from the fact that those who use motorways on working days and for work/school purpose use motorways more frequently. However, in this model only 17% of the variance of frequency is explained. Income and frequency stood out as statistically significant predictors. For income, the regression coefficient was positive, meaning that as income rose, the MAP values also increased. For frequency, the regression coefficient was negative, meaning that as frequency rose, the MAP values decreased.
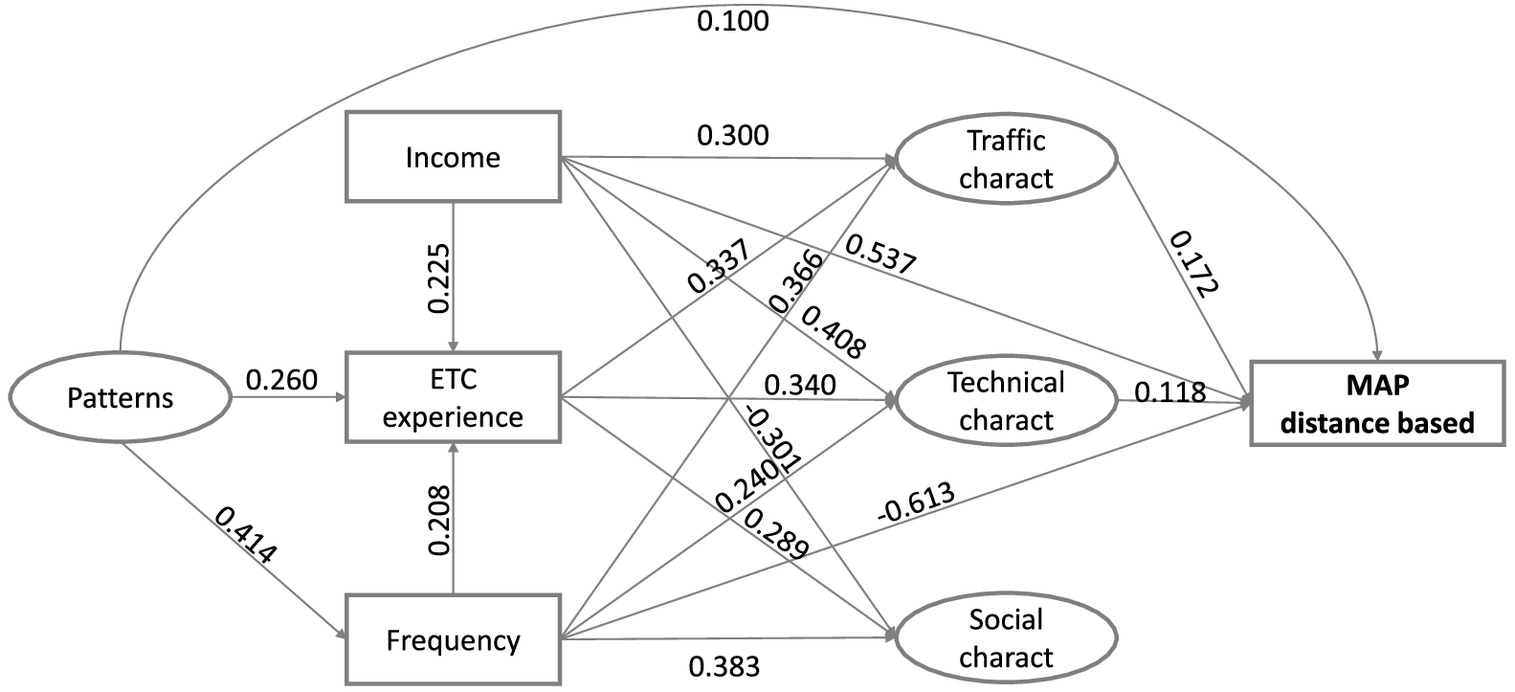
When it comes to experience, a positive, statistically significant impact of patterns, income, and frequency () is expected. These results show that users with higher monthly income and more frequent usage of motorways are more familiar with ETC systems. The results also show that experience has a positive, statistically significant effect on users’ attitude regarding the importance of traffic, technical, and social characteristics of the system. This means that the more users are familiar with the ETC system, the more significant they find the characteristics of the toll collection system. The results of the model show that users’ income has a positive, statistically significant effect on their attitude regarding the importance of traffic and technical characteristics, while it has a negative effect on social characteristics. This means that users with higher income consider traffic and technical characteristics to be more important than users with lower income. On the other hand, those with higher income find social characteristics related to the possibility of theft and fairness of pricing less significant than users with lower income. Also, it has been determined that frequency has a positive, statistically significant effect on all three latent variables: traffic, technical, and social characteristics. In other words, users who use motorways more frequently find characteristics of toll collection systems more significant than users who use motorways less frequently. In this model, 46.1% variance of traffic characteristics, 45.3% variance of technical characteristics, and 35.2% variance of social characteristics are explained. Finally, traffic characteristics and technical characteristics have a positive, statistically significant effect on the MAP DB model, which means that users who consider traffic and technical characteristics more significant are prepared to pay a larger sum of money for toll collection than users who find these items less significant. Environmental characteristics for DB pricing were not statistically significant to be included in the final SEM formulation.
Results of Time-Based Pricing Analysis
Descriptive and Comparative Statistics for TB Scheme
The results show that for most users in North Macedonia, the MAP value is approximately €6 for a weekly vignette, €8 for a 10-day vignette, €17 for a monthly vignette, and €68 for an annual vignette (Table 5). Table 6 shows prices of vignettes in the regional countries for vehicles up to 3.5 t to make these prices comparable with the MAP values of passenger car users in the Republic of North Macedonia. Table 6 shows that most of these results are in accordance with the prices of vignettes in neighboring countries, with some countries having lower and some having higher prices, usually correlated to average income in those countries.
| Measure | WTP (€) | MAP (€) | ||||||
|---|---|---|---|---|---|---|---|---|
| Weekly vignette | Ten-day vignette | Monthly vignette | Annual vignette | Weekly vignette | Ten-day vignette | Monthly vignette | Annual vignette | |
| Mean | 4.16 | 5.95 | 12.14 | 50.31 | 5.92 | 8.42 | 16.75 | 68.43 |
| Standard deviation | 2.55 | 3.64 | 3.37 | 17.99 | 3.51 | 4.92 | 4.61 | 24.72 |
| Vignette types | MAP (€) | |||||||
|---|---|---|---|---|---|---|---|---|
| MKD | BUL | ROU | HUN | AUT | CZE | SVK | SLO | |
| Weekly vignette | €6 | €5 | €3 | — | — | — | — | €15 |
| Ten-day vignette | €8 | — | — | €9 | €9 | €12 | €10 | — |
| Monthly vignette | €17 | €13 | €7 | €15 | — | €17 | €14 | €30 |
| Annual vignette | €68 | €34 | €28 | €134 | €87 | €58 | €50 | €110 |
Note: MKD = North Macedonia; BUL = Bulgaria; ROU = Romania; HUN = Hungary; AUT = Austria; CZE = Czechia; SVK = Slovakia; and SLO = Slovenia.
ANOVA Results for TB Scheme
The results of the ANOVA are presented in Table 7, showing that there was a statistically significant difference between MAP values of different income groups in relation to all types of vignettes. As to weekly and 10-day vignettes, there were no statistically significant differences only between the user groups of income and €250–€500 income (), as well as between the €500–€750 income group and €750–€1,000 income group (). When it comes to monthly and annual vignettes, there was a statistically significant difference only between the income groups and all other groups (). In addition, when it comes to weekly or 10-day vignettes, those users of motorways several times a year (annual users) are willing to pay the most money. They are followed by those who use motorways several times a month (monthly users) and, finally, by those who use motorways most frequently—several times a week (daily users). The ANOVA results showed that in the case of weekly vignettes [; ], as well as 10-day vignettes [; ], there was a statistically significant difference between the MAP values in relation to the frequency of motorway usage. The additional Tukey HSD test determined that there was a statistically significant difference only between weekly and annual users both in the case of weekly () and 10-day vignettes (). In contrast to annual users who would pay the most for weekly and 10-day vignettes, daily users would be more willing to pay a larger sum of money for monthly and annual vignettes. The ANOVA results for monthly vignettes [; ] and annual vignettes [; ] revealed statistically significant differences in MAP values for three groups of users of different frequency of motorway usage. In the case of monthly vignettes, similarly to annual vignettes, there was a statistically significant difference only between weekly and monthly users (). When analyzing the impact of distance traveled, the results of the ANOVA revealed no statistically significantly differences in the MAP TB values for users with different average distances traveled on the motorway (, , , for weekly, 10-day, monthly, and annual vignettes, respectively) (Table 7).
| Variables | Categories | Mean of MAP values (€) | |||
|---|---|---|---|---|---|
| Weekly vignette | Ten-day vignette | Monthly vignette | Annual vignette | ||
| Income | 4.19 | 5.99 | 15.47 | 63.68 | |
| €250–€500 | 4.51 | 6.41 | 15.79 | 65.97 | |
| €500–€750 | 7.48 | 10.58 | 16.79 | 64.19 | |
| €750–€1,000 | 6.01 | 8.60 | 17.09 | 74.80 | |
| 12.15 | 17.38 | 23.74 | 95.04 | ||
| -test | 51.013 | 54.539 | 20.532 | 9.717 | |
| -value | 0.001* | 0.001* | 0.001* | 0.001* | |
| Frequency | Daily users | 5.05 | 7.13 | 19.20 | 83.07 |
| Monthly users | 5.73 | 8.20 | 16.54 | 67.15 | |
| Annual users | 6.54 | 9.29 | 15.73 | 62.35 | |
| -test | 3.736 | 3.910 | 11.730 | 14.907 | |
| -value | 0.025 | 0.021 | 0.001* | 0.001* | |
| Distance | 5.68 | 8.07 | 16.78 | 69.51 | |
| 30–60 km | 5.63 | 8.06 | 16.72 | 65.71 | |
| 60–90 km | 6.14 | 8.79 | 17.42 | 71.38 | |
| 90–120 km | 5.35 | 7.66 | 16.39 | 68.69 | |
| 120–150 km | 6.11 | 8.74 | 17.37 | 66.50 | |
| 6.90 | 9.72 | 16.28 | 67.51 | ||
| -test | — | 1.115 | 1.027 | 0.346 | 0.289 |
| -value | — | 0.353 | 0.402 | 0.885 | 0.919 |
Note: .
SEM Results for TB Scheme
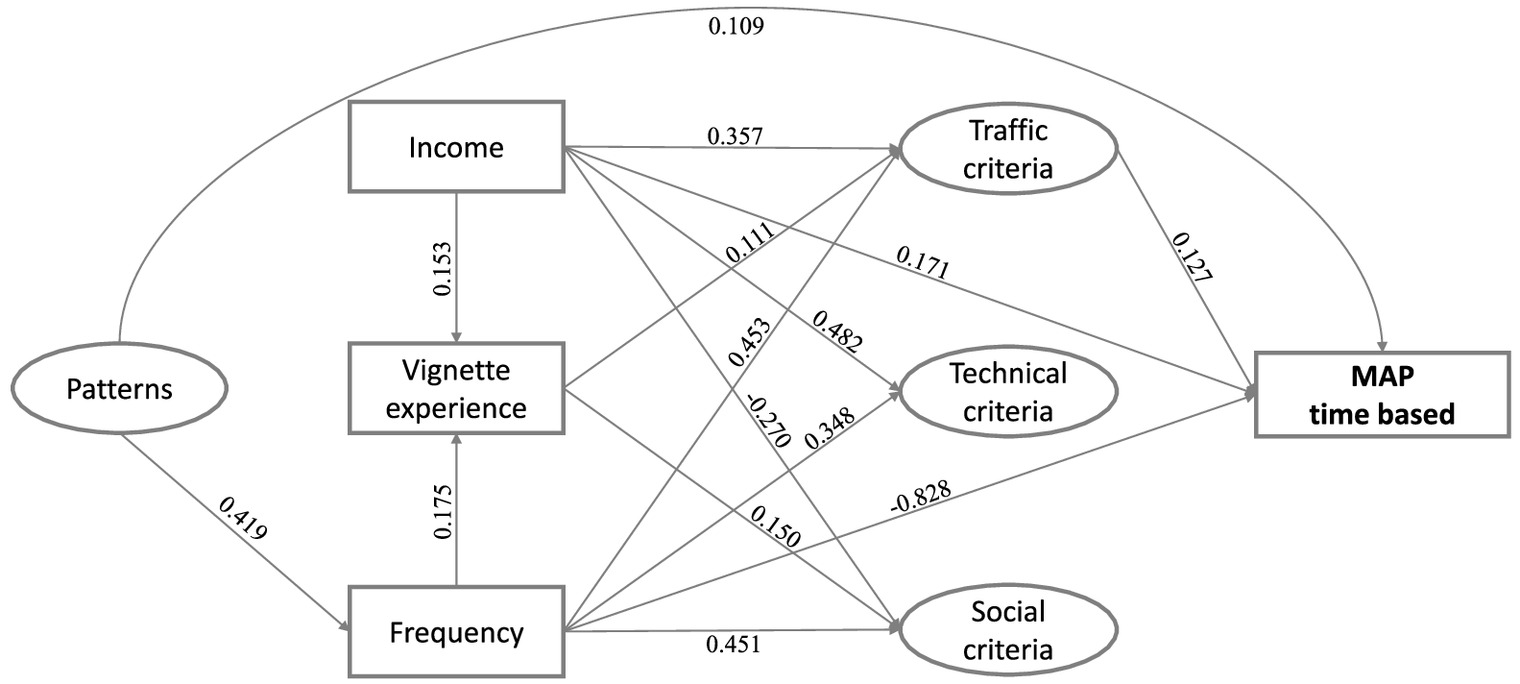
The final model for the MAP TB had a good fit to the data (, , , , , ), with 69.7% of variability explained (Fig. 2). Similarly to the aforementioned MAP DB model, patterns (day in a week and purpose of motorway usage) have a positive, statistically significant impact on frequency. In the case of the MAP TB model, equivalently to the MAP DB model, only 17% of the variance of frequency is explained. Income and frequency stood out as statistically significant predictors. For income, the regression coefficient was positive, while for frequency, the regression coefficient was negative. In the MAP TB model, there is also a positive, statistically significant impact of income and frequency on vignette experience, similarly to the impact on ETC experience in the MAP DB model, while the variable patterns is not statistically significant. It should be emphasized that the MAP DB model explained a significantly larger percentage of the variance of ETC experience () than the percentage of the explained variance of vignette experience () in the TB model. The results also show that in this model vignette experience has an effect on the traffic and social characteristics but not on the technical characteristics of the system, as was the case of the MAP DB model and the impact on ETC experience. Also similar to the aforementioned MAP DB model, user Income has a positive, statistically significant effect on attitude toward the importance of traffic and technical characteristics, while it has a negative effect on social characteristics. Frequency also has a positive, statistically significant effect on all three latent variables: traffic, technical, and social characteristics. In comparison to the MAP DB model, the TB model explained a somewhat smaller percentage of the variance of traffic, technical, and social characteristics (37.5% variance of traffic characteristics, 35.3% of technological characteristics, and 31% of social characteristics). In contrast to the MAP DB model, where both traffic characteristics and technical characteristics had a positive, statistically significant effect, in the MAP TB model, only traffic characteristics had a positive, statistically significant effect. Environmental characteristics for TB pricing were not statistically significant and so were not included in the final SEM formulation.
Comparative Analysis of Distance-Based and Time-Based Pricing
Distance-Based versus Time-Based Pricing According to Analysis of Road Users’ Attitudes
The analysis of distribution of users’ directly stated preference for the DB or TB concept are presented in Table 8. These values lead to the conclusion that the majority of all respondents prefer DB (67%) over TB road pricing (33%). However, when the frequency of motorway usage is considered, daily users prefer TB road pricing, while periodic (monthly and annual) users prefer DB road pricing. The binary logistic regression analysis presented in Table 9 shows an estimate of the impact of usage frequency on the likelihood of preferring DB or TB pricing. The obtained results showed that daily users were 4.4 times more likely to consider TB road pricing more convenient than DB road pricing in relation to other users (). On the other hand, it was found that annual users were 3.5 times more likely () to consider DB road pricing as being more convenient than TB road pricing in relation to other users () (Table 9). Monthly users were not statistically significantly more likely to consider DB as a better option than TB road pricing and vice versa, in relation to other users ().
| Pricing concept | Daily users | Monthly users | Annual users | Total | ||||
|---|---|---|---|---|---|---|---|---|
| Percentage | Percentage | Percentage | Percentage | |||||
| DB road pricing | 21 | 36.8 | 72 | 63.2 | 91 | 80.5 | 184 | 64.7 |
| TB road pricing | 36 | 63.2 | 42 | 36.8 | 22 | 19.5 | 100 | 35.3 |
| Frequency | Odds ratio | -value | |
|---|---|---|---|
| TB road pricing | DB road pricing | ||
| Daily users | 4.366 (2.370–8,043) | 0.229 (0.124–0.422) | 0.001* |
| Monthly users | 1.126 (0.686–1.849) | 0.888 (0.541–1.457) | 0.638 |
| Annual users | 0.288 (0.166–0.502) | 3.469 (1.993–6.040) | 0.001* |
Note: .
Normalized Distance-Based versus Time-Based Pricing According to MAP Values
Table 10 shows MAP values for TB road pricing converted to the same comparable unit () using the data about the stated kilometers traveled, frequency of motorway usage, and value of MAP for TB road pricing. The results for the calculated comparable data show that for annual users TB road pricing is on average 2.3 times more expensive than DB road pricing, for monthly users 2.1 times, and for everyday users DB road pricing is 1.4 times more expensive. These results are in accordance with the results from Tables 8 and 9.
| Frequency | Mean of MAP values | Ratio TB/DB | |
|---|---|---|---|
| DB road pricing () | TB road pricing () | ||
| Daily users | 2.87 | 1.93 | 0.67 |
| Monthly users | 5.42 | 11.6 | 2.14 |
| Annual users | 5.86 | 13.4 | 2.29 |
Discussion and Conclusions
Discussion of Results
The study confirms an assumption of the difference between WTP and MAP values for both TB and DB road pricing, where MAP values are higher than WTP (Hanemann 1991; Small 2012; Glavic et al. 2017). Although previous research informs us that users can have a hard time understanding the costs and benefits of road pricing (Grieco and Jones 1994; Small 2012), WTP and MAP values are higher when users are asked to account not only for travel-time savings but also other advantages of using motorways. The obtained WTP and MAP values are in accordance with the values of DB and TB prices in southeastern Europe, while they are lower from prices in central Europe, where GDP per capita is several times higher. The key factors affecting the MAP values for DB and TB road pricing were users’ income and frequency of motorway usage, with those with higher income being more willing to pay and more frequent users being less willing to pay, similar to conclusions from Yusuf et al. (2014). Contrary to some previous studies that concluded that income does not influence WTP or acceptability (Bueno et al. 2017; Gomez et al. 2017; Jaensirisak et al. 2005), one must take into account the fact that users in North Macedonia might be poor in both time and money. Thus, income can have a significant effect on the very capacity to afford road pricing for certain social groups. In contrast, those groups with higher income might also have a negative relation to the intention to reduce car use (Jakobsson et al. 2000), thereby leading to a higher threshold for refraining from motorway use. In addition, more frequent motorway usage over a certain period results in greater expenses to the user, so it leads to lower MAP values. In the case of both SEM models, it was determined that the latent variable pattern had a statistically significant impact on MAP values. It was discovered that those who used motorways on working days and for work/school purposes had a higher MAP value than those who used motorways on weekends and for other purposes. These results are also in accordance with several previous studies (Jakobsson et al. 2000; Hensher and Goodwin 2004; Zmud and Arce 2008; Glavić et al. 2017). Unlike in Jou et al. (2012), no effect of trip distances on WTP was identified in this study, which could be associated with a rather small size of the national motorway network in North Macedonia.
When all respondents are taken in the account, DB road pricing was generally perceived as a more preferable option than TB road pricing. However, further analysis of user attitudes showed that user preferences for DB and TB road pricing depended on the frequency of motorway usage. Daily users preferred TB road pricing, while monthly and annual users preferred DB road pricing. In other words, comparative analysis of the results showed that users recognize the advantages of one or the other pricing scheme in a way that corresponded to their user group. Comparison of the normalized DB and TB MAP values also supports this user attitude. When converting TB MAP values to a comparable unit as DB MAP, the result was that DB road pricing was 2.14 times cheaper for monthly and 2.29 times cheaper for annual users, while TB road pricing was 1.49 cheaper for daily users.
The obtained results are logical considering the fact that daily motorway users travel significantly more kilometers than occasional travelers, as previously concluded by Raub et al. (2013). Therefore, if they are able to buy an annual vignette, they will save more over paying for actual annually traveled kilometers. In the case of monthly and annual users, the situation is different, because they usually pay more in the case of TB road pricing than they would pay based on actual distance traveled. These results can be contrasted with a hypothetical ratio between DB and TB road pricing of , with the assumption that drivers take more risks when they are being charged for the use of road space based on time (Bonsall and Palmer 1997). Furthermore, we must take into account that there is some consensus in the literature that the more complex a pricing scheme is perceived to be, the less acceptable it is likely to be (Bonsall et al. 2007; Bueno et al. 2017; Vrtic et al. 2007; Zmud and Arce 2008). At the core of user perspective on the positive relationship between pricing scheme complexity and acceptability might be a high cognitive load required for its evaluation (Francke and Kaniok 2013). For example, this evaluation challenge might manifest as a flat rate bias, where one is trying to avoid and insure from future unanticipated costs, even if pay-per-use might be cheaper in total.
The analysis also showed that users’ MAP value depended on the experience of users with DB and TB concepts and the technology of road pricing. When it comes to the DB model, it was found that experience using ETC systems, which are typical representatives of the DB concept, had a positive impact on users’ attitudes toward the significance of the traffic, technical, and social characteristics of the system. In other words, the more familiar users are with the ETC system, the more significant they find the aforementioned characteristics, which is similar to the general findings of Chen et al. (2007) and Heras-Molina et al. (2019). When it comes to the TB model, it was found that the experience of using TB systems had a positive, statistically significant impact on the importance of traffic and social characteristics, but not of technical characteristics. This finding means that the more familiar users are with TB road pricing, the more significant they find traffic and social characteristics, while the impact on technical criteria was not statistically significant. The obtained result is logical keeping in mind the fact that technical characteristics referring to interoperability and flexibility are primarily related to the ETC system and not to vignettes. Finally, it was determined for the DB model that if technical and traffic characteristics were more significant for users, the users’ MAP values were also relatively higher. When it comes to the TB model, only the latent variable referring to traffic characteristics had a positive, statistically significant impact on MAP values. Familiarity with technology and the consequent evaluation of the importance of its characteristics is interestingly also related to higher income and more frequent usage, as well as to higher willingness to pay. This point is related to the previously raised point on learning about benefits and costs associated with different pricing concepts in the context of existing road pricing schemes. However, it is important to highlight that, contrary to some previous research where environmental awareness was related to acceptability (Jaensirisak et al. 2005), such a significant causation was not identified in this research. This effect might be due to specific norms in North Macedonia that might differ from those in Western Europe.
Policy Learning Discussion
In the context of multiple, and even potentially conflicting, policy objectives in the diverse European context, bridging perspectives between pricing system planners and managers on the one hand and road users on the other hand can be essential for developing policy processes. As stated previously, EU-level policy favors the DB concept because it is related to a user-pays principle, where users pay for kilometers traveled (Raub et al. 2013). In contrast, a criticism of TB schemes is that a flat rate decouples purchase from consumption, reducing the perceived cost of activity, thereby failing to have significant effects on road use demand. Besides changes in the total demand, both DB and TB pricing schemes with pricing differentiation can somewhat affect decisions to use other modes or passenger vehicles without an internal combustion engine. However, such decisions are constrained in terms of alternative modes, such as railways and low purchasing power, both of which apply to North Macedonia.
The question of interoperability across Europe for both TB and DB pricing schemes remains open because it depends on both further technological and policy developments, with the latter related to funding and financing policy. DB-based ETC charging technologies require the installation and use of onboard units that are not always accepted by all users (Chen et al. 2007; Heras-Molina et al. 2019), although ETC devices could be used for other purposes (e.g., paying for parking, fuel- or cordon-based congestion pricing, navigation, vehicle theft prevention). Users can also have higher concerns regarding privacy and data security with ETC devices. In the case of sticker-based vignettes attached to the windshield, some users might perceive this as a visual degradation of the vehicle.
From an infrastructure management perspective, the use of DB pricing requires additional investment in roadside equipment and might lead to congestion at tolling points if vehicles are required to slow down (Glavić et al. 2017). In comparison, a TB-based vignette system can be introduced relatively quickly but might still entail operating costs for enforcement (e.g., automatic number plate recognition). Finally, in the case of motorways built on a public-private partnership model, implementing either a TB or a DB scheme should be evaluated for the effective collection and distribution of tolls to avoid the previously mentioned problem of “rat running” and associated negative feedback loops.
Although the EU policy leans toward a DB scheme, we must recognize that all stakeholders face a multitude of equity dilemmas related to a multitude of pricing schemes, technologies, and objectives. Thus, our conclusion is that there is a clear need for greater understanding of different user perspectives, which might help in reducing regressively distributed effects and achieving wider sociopolitical acceptance. In particular, the findings of this study highlight the need for understanding different, especially low-income and low-use-frequency, user perspectives on both road pricing schemes and pricing technology. Considering the diverse needs of users, an immediate policy question arises as to whether to develop a hybrid road pricing scheme, where daily users could pay using a TB scheme while less frequent users would pay using a DB scheme. The concept of a hybrid road pricing scheme has been discussed, with the travel distance as opposed to the frequency as differentiating parameter (Jou et al. 2012). This hybrid road pricing model could hold promise in terms of addressing the trade-off between road managers’ desire to maximize revenue and road users’ desire to maximize motorway usage at an acceptable price. In the context of time- and money-poor users, this scheme would potentially avoid “rat running” problems described earlier. With the advancement of road pricing technologies, technical limitations pose no challenge for introducing hybrid pricing. However, besides the question of technical feasibility, planning road pricing schemes raises a larger issue of user involvement in the development of policymaking processes and institutional capacity building. A special emphasis in such development should be on transparent informing and deliberation about the intentions and revenue use from tolling (Bueno et al. 2017; Odeck and Kjerkreit 2010; Ison 2017; Langmyhr 1997; Glavic et al. 2017). Even if previous research often concluded that users prefer less complex pricing schemes, participatory solutions achieved through deliberation could seek not just the simplest but also the most desirable and feasible scheme, which would be able to optimally deal with trade-offs between multiple policy and user objectives. Ultimately, the question of hybrid pricing is something that EU-level policymaking must consider, especially when it comes to transition countries, such as North Macedonia.
Limitations and Future Research Directions
One of the potential limitations of this research is sample size. This limitation stems from the specific requirement that respondents need to satisfy, which restricts the number of eligible respondents. Future research needs to try to increase sample size in a quantitative and qualitative manner. More qualitative methods could be added to the analysis framework to explain some of the missing factors, such as environmental awareness, because these might have deeper cultural meanings related to the car as a symbol of success and independence in transition countries. In addition, although a significant part of the variability of the dependent variable was explained in the developed models (in the case of MAP DB it was 61.1%, while in the case of MAP TB it was 69.7%), a specific percentage of the dependent variable’s variability (MAP DB and MAP TB) remained unexplained. Therefore, future studies should examine additional factors that might have an impact on these values, such as the relative level of service on secondary road networks, revenue redistribution schemes, or vehicle occupancy from the perspective of flat-rate bias and mental accounting. Although we can anticipate an effect similar to that in previous research on this topic, such as that cost will decrease but in a nonlinear manner in the case of shared vehicles (e.g., Ho et al. 2016), this topic would also pertain to sharing and gender norms in North Macedonia. Similarly, the relation between motorway pricing and mobility as service schemes should also be further investigated (Liimatainen and Mladenović 2018). In relation to further reflection on the proposed cut-off values for SEM, future research could expand upon factors that would further explain the variance of MAP values.
From the standpoint of governance studies, and given the ongoing EU-level policy processes, questionnaire studies in the future should span more European countries. We can especially highlight the lack of research in countries currently having a TB pricing scheme. These kinds of pan-European questionnaires should also include questions about pricing fairness for occasional motorway users across national borders. Given the amount of diverse literature on the topic, an essential step in further development is a wide-scale systematic literature review and meta-analysis of factors and data collection methods. Further deepening of the relation between user perspectives and policymaking would benefit from the development of decision-support frameworks (e.g., Milenković et al. 2018). If road pricing research is to contribute to further institutional capacity building, there is a need for in-depth comparative analysis of road pricing policy styles across Europe. As we have seen in this case study, domino theory is not adequate to explain further governance challenges since most countries have adopted some road pricing scheme. Metaphorically speaking, the dominos have fallen, but the game is still on, and many decisions remain to be made. These further decisions about the transition of transportation systems must account for a multitude of governance contexts across Europe and the associated need to develop mechanisms of deliberative democracy in southeastern Europe.
Data Availability Statement
The data sets used or analyzed during the current study are available from the corresponding author on reasonable request.
Acknowledgments
This research was partially funded by the FinEst Twins Center of Excellence (H2020 Grant 856602).
References
Abrantes, P. A., and M. R. Wardman. 2011. “Meta-analysis of UK values of travel time: An update.” Transp. Res. Part A: Policy Pract. 45 (1): 1–17. https://doi.org/10.1016/j.tra.2010.08.003.
Bagozzi, R. P. 2010. “Structural equation models are modelling tools with many ambiguities: Comments acknowledging the need for caution and humility in their use.” J. Consum. Psychol. 20 (2): 208–214. https://doi.org/10.1016/j.jcps.2010.03.001.
Bamberg, S., and P. Schmidt. 2001. “Theory-driven subgroup-specific evaluation of an intervention to reduce private car use.” J. Appl. Soc. Psychol. 31 (6): 1300–1329. https://doi.org/10.1111/j.1559-1816.2001.tb02675.x.
Baumgarten, P., and J. Middelkamp. 2015. “On interurban road pricing schemes and the impacts of traffic diversion on road safety in Germany: Empirical findings and implications.” Eur. J. Transp. Infrastruct. Res. 15 (2): 147–162. https://doi.org/10.18757/ejtir.2015.15.2.3066.
Bonnafous, A., and Y. Crozet. 2018. “Consumer surplus and pricing of transport infrastructures: The legacy of Jules Dupuit.” Transp. Policy 70 (Nov): 8–13. https://doi.org/10.1016/j.tranpol.2017.12.008.
Bonsall, P., J. Shires, J. Maule, B. Matthews, and J. Beale. 2007. “Responses to complex pricing signals: Theory, evidence and implications for road pricing.” Transp. Res. Part A: Policy Pract. 41 (7): 672–683. https://doi.org/10.1016/j.tra.2006.06.001.
Bonsall, P. W., and I. A. Palmer. 1997. “Do time-based road-user charges induce risk-taking?—Results from a driving simulator.” Traffic Eng. Control 38 (4): 200–203.
Browne, M. W., and R. Cudeck. 1993. “Alternative ways of assessing model fit.” In Testing structural equation models, edited by K. A. Bollen and J. S. Long. Newbury Park, CA: SAGE.
Brownstone, D., A. Ghosh, T. F. Golob, C. Kazimi, and D. Van Amelsfort. 2003. “Drivers’ willingness-to-pay to reduce travel time: Evidence from the San Diego I-15 congestion pricing project.” Transp. Res. Part A: Policy Pract. 37 (4): 373–387. https://doi.org/10.1016/S0965-8564(02)00021-6.
Brownstone, D., and K. A. Small. 2005. “Valuing time and reliability: Assessing the evidence from road pricing demonstrations.” Transp. Res. Part A: Policy Pract. 39 (4): 279–293. https://doi.org/10.1016/j.tra.2004.11.001.
Bueno, P. C., J. Gomez, and J. M. Vassallo. 2017. “Seeking factors to increase the public’s acceptability of road-pricing schemes: Case study of Spain.” Transp. Res. Rec. 2606 (1): 9–17. https://doi.org/10.3141/2606-02.
Carpintero, S. 2010. “Toll roads in central and eastern Europe: Promises and performance.” Transp. Rev. 30 (3): 337–359. https://doi.org/10.1080/01441640903017380.
Chen, C. D., Y. W. Fan, and C. K. Farn. 2007. “Predicting electronic toll collection service adoption: An integration of the technology acceptance model and the theory of planned behavior.” Transp. Res. Part C: Policy Pract. 15 (5): 300–311. https://doi.org/10.1016/j.trc.2007.04.004.
Chen, D. J., and Y. H. Wen. 2014. “Effects of freeway mileage-based toll scheme on the short-range driver’s route choice behavior.” J. Urban Plann. Develop. 140 (2): 04013012. https://doi.org/10.1061/(ASCE)UP.1943-5444.0000167.
Chi, S., J. Bunker, and M. Teo. 2017. “Measuring impacts and risks to the public of a privately operated toll road project by considering perspectives in cost-benefit analysis.” J. Transp. Eng., Part A: Syst. 143 (12): 04017060. https://doi.org/10.1061/JTEPBS.0000088.
Di Ciommo, F., A. Monzón, and A. Fernandez-Heredia. 2013. “Improving the analysis of road pricing acceptability surveys by using hybrid models.” Transp. Res. Part A: Policy Pract. 49 (Mar): 302–316. https://doi.org/10.1016/j.tra.2013.01.007.
European Parliament. 2014. “Technology options for the European Electronic Toll Service, European Union.” Accessed August 10, 2018. http://www.europarl.europa.eu/studies.
Farrell, S., and W. Saleh. 2005. “Road-user charging and the modelling of revenue allocation.” Transp. Policy 12 (5): 431–442. https://doi.org/10.1016/j.tranpol.2005.06.003.
Francke, A., and D. Kaniok. 2013. “Responses to differentiated road pricing schemes.” Transp. Res. Part A: Policy Pract. 48 (Feb): 25–30. https://doi.org/10.1016/j.tra.2012.10.002.
Garver, M. S., and J. T. Mentzer. 1999. “Logistics research methods: Employing structural equation modeling to test for construct validity.” J. Bus. Logist. 20 (1): 33.
Glavic, D., M. Mladenovic, T. Luttinen, S. Cicevic, and A. Trifunovic. 2017. “Road to price: User perspectives on road pricing in transition country.” Transp. Res. Part A: Policy Pract. 105 (Nov): 79–94. https://doi.org/10.1016/j.tra.2017.08.016.
Glavic, D., M. N. Mladenovic, and A. Stevanovic. 2016. “Policy Improvements for winter road maintenance in South-East Europe: Case study of Serbia.” Public Works Manage. Policy 21 (2): 173–195. https://doi.org/10.1177/1087724X15595239.
Glavić, D., M. Milenković, and M. Mladenović. 2016. “Comparative analysis of the Macedonian road tolling system with EU trends.” In Proc., I Int. Conf.—Transport for Today’s Society, 79–88. Bitola, North Macedonia: St. Kliment Ohridski.
Glavić, D., M. Milenković, A. Trpković, M. Vidas, and M. Mladenović. 2017. “Assessing sustainability of road tolling technologies.” In Proc., AIIT Int. Congress on Transport Infrastructure and Systems—TIS, 803–810. Rome, Italy: Taylor & Francis Group.
Gomez, J., A. Papanikolaou, and J. M. Vassallo. 2017. “Users’ perceptions and willingness to pay in interurban toll roads: Identifying differences across regions from a nationwide survey in Spain.” Transportation 44 (3): 449–474. https://doi.org/10.1007/s11116-015-9662-6.
Grieco, M., and P. M. Jones. 1994. “A change in the policy climate? Current European perspectives on road pricing.” Urban Stud. 31 (9): 1517–1532. https://doi.org/10.1080/00420989420081401.
Grisolía, J. M., F. López, and J. de Dios Ortúzar. 2015. “Increasing the acceptability of a congestion charging scheme.” Transp. Policy 39 (Apr): 37–47. https://doi.org/10.1016/j.tranpol.2015.01.003.
Hanemann, W. M. 1991. “Willingness to pay and willingness to accept: How much can they differ?” Am. Econ. Rev. 81 (3): 635–647.
Hensher, D. A., and M. C. Bliemer. 2014. “What type of road pricing scheme might appeal to politicians? Viewpoints on the challenge in gaining the citizen and public servant vote by staging reform.” Transp. Res. Part A: Policy Pract. 61 (Mar): 227–237. https://doi.org/10.1016/j.tra.2014.02.017.
Hensher, D. A., and P. Goodwin. 2004. “Using values of travel time savings for toll roads: Avoiding some common errors.” Transp. Policy 11 (2): 171–181. https://doi.org/10.1016/j.tranpol.2003.10.002.
Hensher, D. A., J. M. Rose, J. de Dios Ortúzar, and L. I. Rizzi. 2009. “Estimating the willingness to pay and value of risk reduction for car occupants in the road environment.” Transp. Res. Part A: Policy Pract. 43 (7): 692–707. https://doi.org/10.1016/j.tra.2009.06.001.
Heras-Molina, J., J. Gomez, and J. M. Vassallo. 2019. “Drivers’ adoption of electronic payment in the Spanish toll road network.” Transportation 46 (3): 931–955. https://doi.org/10.1007/s11116-017-9831-x.
Ho, C. Q., C. Mulley, Y. Shiftan, and D. A. Hensher. 2016. “Vehicle value of travel time savings: Evidence from a group-based modelling approach.” Transp. Res. Part A: Policy Pract. 88 (Jun): 134–150. https://doi.org/10.1016/j.tra.2016.03.016.
Hoe, S. L. 2008. “Issues and procedures in adopting structural equation modeling technique.” J. Appl. Quantit. Methods 3 (1): 76–83.
Hoelter, J. W. 1983. “The analysis of covariance structures: Goodness-of-fit indices.” Sociol. Methods Res. 11 (3): 325–344. https://doi.org/10.1177/0049124183011003003.
Hu, L. T., and P. M. Bentler. 1998. “Fit indices in covariance structure modeling: Sensitivity to underparameterized model misspecification.” Psychol. Methods 3 (4): 424. https://doi.org/10.1037/1082-989X.3.4.424.
Hu, L. T., and P. M. Bentler. 1999. “Cutoff criteria for fit indexes in covariance structure analysis: Conventional criteria versus new alternatives.” Struct. Equation Modell. Multidiscip. J. 6 (1): 1–55. https://doi.org/10.1080/10705519909540118.
Ison, S. 2017. Road user charging: Issues and policies. London: Routledge.
Jaensirisak, S., M. Wardman, and A. D. May. 2005. “Explaining variations in public acceptability of road pricing schemes.” J. Transp. Econ. Policy 39 (2): 127–154.
Jakobsson, C., S. Fujii, and T. Gärling. 2000. “Determinants of private car users’ acceptance of road pricing.” Transp. Policy 7 (2): 153–158. https://doi.org/10.1016/S0967-070X(00)00005-6.
Jou, R. C., Y. C. Chiou, K. H. Chen, and H. I. Tan. 2012. “Freeway drivers’ willingness-to-pay for a distance-based toll rate.” Transp. Res. Part A: Policy Pract. 46 (3): 549–559. https://doi.org/10.1016/j.tra.2011.11.012.
Jou, R. C., and G. L. Huang. 2014. “Willingness to pay price for tolls and on-board units for short-distance freeway users who normally avoid toll boots.” Transp. Policy 31 (Jan): 10–18. https://doi.org/10.1016/j.tranpol.2013.11.001.
Kim, J., J. D. Schmöcker, S. Fujii, and R. B. Noland. 2013. “Attitudes towards road pricing and environmental taxation among US and UK students.” Transp. Res. Part A: Policy Pract. 48 (Feb): 50–62. https://doi.org/10.1016/j.tra.2012.10.005.
Kline, B. R. 1998a. “Software programs for structural equation modeling: Amos, EQS, and LISREL.” J. Psychoeducational Assess. 16 (4): 343–364. https://doi.org/10.1177/073428299801600407.
Kline, R. B. 1998b. Principles and practice of structural equation modeling. New York: Guilford Press.
Knight, F. H. 1924. “Some fallacies in the interpretation of social cost.” Q. J. Econ. 38 (4): 582–606. https://doi.org/10.2307/1884592.
Langmyhr, T. 1997. “Managing equity: Case of road pricing.” Trans. Policy 4 (1): 25–39. https://doi.org/10.1016/S0967-070X(96)00031-5.
Li, X., Y. Yuan, H. Wang, and J. Hu. 2020. “Understanding public acceptability of congestion charging in Beijing.” J. Transp. Eng., Part A: Syst. 146 (8): 04020080. https://doi.org/10.1061/JTEPBS.0000394.
Liimatainen, H., and M. N. Mladenović. 2018. “Understanding the complexity of mobility as a service.” Res. Transp. Bus. Manage. 27 (Jun): 1–2. https://doi.org/10.1016/j.rtbm.2018.12.004.
Lo, H. K., and M. D. Hickman. 1997. “Toward an evaluation framework for road pricing.” J. Transp. Eng. 123 (4): 316–324. https://doi.org/10.1061/(ASCE)0733-947X(1997)123:4(316).
Marinković, M. 2019. “Motorization rate in Serbia, Republic of Srpska, Federation of BiH, Montenegro and North Macedonia.” Put i Saobraćaj 65 (4): 49–53. https://doi.org/10.31075/PIS.65.04.08.
Matthews, B., and J. Nellthorp. 2012. “National road user charging: Theory and implementation.” In Cars and carbon, 295–323. Dordrecht, Netherlands: Springer.
Milenković, M., D. Glavić, and M. Maričić. 2019. “Determining factors affecting congestion pricing acceptability.” Transp. Policy 82 (C): 58–74. https://doi.org/10.1016/j.tranpol.2019.08.004.
Milenković, M., D. Glavić, and M. N. Mladenović. 2018. “Decision-support framework for selecting the optimal road toll collection system.” J. Adv. Transp. https://doi.org/10.1155/2018/4949565.
Milenković, M., N. Stepanović, D. Glavić, V. Tubić, I. Ivković, and A. Trifunović. 2020. “Methodology for determining ecological benefits of advanced tolling systems.” J. Environ. Manage. 258 (Mar): 110007. https://doi.org/10.1016/j.jenvman.2019.110007.
Morrison, S. A. 1986. “A survey of road pricing.” Transp. Res. Part A: General 20 (2): 87–97. https://doi.org/10.1016/0191-2607(86)90035-X.
Nash, C., and B. Matthews. 2013. Transport pricing and subsidy. The SAGE Handbook of Transport Studies. London: Sage.
Navandar, Y. V., A. Dhamaniya, D. A. Patel, and S. Chandra. 2019. “Traffic flow analysis at manual tollbooth operation under mixed traffic conditions.” J. Transp. Eng, Part A: Syst. 145 (6): 04019023. https://doi.org/10.1061/JTEPBS.0000247.
Nielsen, O. A. 2004. “Behavioral responses to road pricing schemes: Description of the Danish AKTA experiment.” J. Intell. Transp. Syst. 8 (4): 233–251. https://doi.org/10.1080/15472450490495579.
Odeck, J., and A. Kjerkreit. 2010. “Evidence on users’ attitudes towards road user charges—A cross-sectional survey of six Norwegian toll schemes.” Transp. Policy 17 (6): 349–358. https://doi.org/10.1016/j.tranpol.2010.04.001.
O’Mahony, M., D. Geraghty, and I. Humphreys. 2000. “Distance and time based road pricing trial in Dublin.” Transportation 27 (3): 269–283. https://doi.org/10.1023/A:1005248204428.
Pigou, A. 1920. The economics of welfare. London: MacMillan.
Politis, I., M. Kyriakoglou, G. Georgiadis, and P. Papaioannou. 2020. “Evidence from highway drivers in Greece showing toll avoidance and utility of alternative routes.” Transp. Res. Rec. 2674 (9): 948–958. https://doi.org/10.1177/0361198120933265.
Raub, K. R., A. B. Scholz, and G. T. Liedtke. 2013. “Impacts of road user charges on individual welfare—A pre-inauguration exploration for Germany.” Case Stud. Transp. Policy 1 (1–2): 46–52. https://doi.org/10.1016/j.cstp.2013.08.001.
Republic of Macedonia State Statistical Office. 2019. “Monthly statistical bulletin (No. 11), Skopje, State Statistical Office.” Accessed December 18, 2019. http://www.stat.gov.mk/publikacii/2019/1.2.19.11_en.pdf/.
Risteska, M. 2013. “The role of the EU in promoting good governance in Macedonia: Towards efficiency and effectiveness or deliberative democracy?” Nationalities Papers 41 (3): 431–446. https://doi.org/10.1080/00905992.2013.769504.
Ross, A., and V. L. Willson. 2017. Basic and advanced statistical tests. Rotterdam, Netherlands: Sense Publishers.
Rothengatter, W. 2003. “How good is first best? Marginal cost and other pricing principles for user charging in transport.” Transp. Policy 10 (2): 121–130. https://doi.org/10.1016/S0967-070X(02)00063-X.
Rouhani, O. M. 2018. “Beyond standard zonal congestion pricing: A detailed impact analysis.” J. Transp. Eng, Part A: Syst. 144 (9): 04018052. https://doi.org/10.1061/JTEPBS.0000151.
Rouwendal, J., and E. T. Verhoef. 2006. “Basic economic principles of road pricing: From theory to applications.” Transp. Policy 13 (2): 106–114. https://doi.org/10.1016/j.tranpol.2005.11.007.
Şimşekoğlu, Ö., and T. Lajunen. 2008. “Social psychology of seat belt use: A comparison of theory of planned behavior and health belief model.” Transp. Res. Part F: Traffic Psychol. Behav. 11 (3): 181–191. https://doi.org/10.1016/j.trf.2007.10.001.
Sivo, S. A., X. Fan, E. L. Witta, and J. T. Willse. 2006. “The search for” optimal” cutoff properties: Fit index criteria in structural equation modeling.” J. Exp. Educ. 74 (3): 267–288. https://doi.org/10.3200/JEXE.74.3.267-288.
Small, K. A. 2012. “Valuation of travel time.” Econ. Transp. 1 (1–2): 2–14. https://doi.org/10.1016/j.ecotra.2012.09.002.
Souche-Le Corvec, S., C. Raux, J. Eliasson, C. Hamilton, K. Brundell-Freij, K. Kiiskilä, and J. Tervonen. 2016. “Predicting the results of a referendum on urban road pricing in France: ‘The cry of Cassandra’?” Eur. Transp. Res. Rev. 8 (2): 15. https://doi.org/10.1007/s12544-016-0201-0.
UN (United Nations). 2019. World economic situation and prospects 2019. New York: UN.
van Smeden, M., K. G. Moons, J. A. de Groot, G. S. Collins, D. G. Altman, M. J. Eijkemans, and J. B. Reitsma. 2019. “Sample size for binary logistic prediction models: Beyond events per variable criteria.” Stat. Methods Med. Res. 28 (8): 2455–2474. https://doi.org/10.1177/0962280218784726.
Verhoef, E., P. Nijkamp, and P. Rietveld. 1996. “The trade-off between efficiency, effectiveness, and social feasibility of regulating road transport externalities.” Transp. Plann. Technol. 19 (3–4): 247–263. https://doi.org/10.1080/03081069608717572.
Vrtic, M., N. Schuessler, A. Erath, and K. Axhausen. 2007. “Design elements of road pricing schemes and their acceptability.” In Proc., 86th Annual Meeting of the Transportation Research Board. Washington, DC: Transportation Research Board.
Wolf, E. J., K. M. Harrington, S. L. Clark, and M. W. Miller. 2013. “Sample size requirements for structural equation models: An evaluation of power, bias, and solution propriety.” Educ. Psychol. Meas. 73 (6): 913–934. https://doi.org/10.1177/0013164413495237.
Worldometers. 2019. “North Macedonia population.” Accessed December 20, 2019. https://www.worldometers.info/world-population/north-macedonia-population/.
Xu, C., W. Wang, J. Chen, W. Wang, C. Yang, and Z. Li. 2010. “Analyzing travelers’ intention to accept travel information: Structural equation modeling.” Transp. Res. Rec. 2156 (1): 93–100. https://doi.org/10.3141/2156-11.
Yusuf, J. E. W., L. O’Connell, and K. A. Anuar. 2014. “For whom the tunnel be tolled: A four-factor model for explaining willingness-to-pay tolls.” Transp. Res. Part A: Policy Pract. 59 (Jan): 13–21. https://doi.org/10.1016/j.tra.2013.10.021.
Zmud, J., and C. Arce. 2008. Compilation of public opinion data on tolls and road pricing. National cooperative highway research program synthesis 377. Washington, DC: National Academy of Sciences.
Information & Authors
Information
Published In

Journal of Transportation Engineering, Part A: Systems
Volume 147 • Issue 9 • September 2021
Copyright
This work is made available under the terms of the Creative Commons Attribution 4.0 International license, https://creativecommons.org/licenses/by/4.0/.
History
Received: Nov 5, 2020
Accepted: Mar 25, 2021
Published online: Jul 7, 2021
Published in print: Sep 1, 2021
Discussion open until: Dec 7, 2021
Authors
Metrics & Citations
Metrics
Citations
Download citation
If you have the appropriate software installed, you can download article citation data to the citation manager of your choice. Simply select your manager software from the list below and click Download.