A Relational Data Model for Advancing Stormwater Infrastructure Management
Publication: Journal of Sustainable Water in the Built Environment
Volume 9, Issue 1
Abstract
To date, the knowledge benefits that can result from the growing abundance of measured stormwater data have yet to be fully realized within the industry. Obstacles due to data format and storage, retrieval, and quality control have limited the size and impact of accessing known data, resulting in data that are often siloed by project or objective, which inhibits advancements in our understanding, as well as decision making and information sharing across municipalities. Consortium of Universities for the Advancement of Hydrologic Sciences, Inc. (CUAHSI)’s observations data model (ODM) is a relational data model designed to organize disparate types of data; however, it does not provide avenues for the storage of stormwater monitoring–specific metadata. To facilitate stormwater infrastructure data analysis, the Villanova stormwater infrastructure data model (SIDM), constructed comparably to ODM1, was created by adding and removing tables from the ODM1 structure, along with other modifications to enable efficient data access. The novel data model presented here facilitates a comprehensive spatiotemporal analysis specific to stormwater systems to overcome traditional stormwater data siloes and harness the benefits of stormwater data through efficient avenues. The data model structure of the SIDM enables stormwater-specific data to be managed efficiently not only to provide data regarding function and performance but to advance the science around stormwater planning and management, as well as knowledge sharing across researchers, utilities, and municipalities. In this paper, we describe the logic of the design, benefits of the data model, and applications to specific green stormwater infrastructure installations. This has the potential to not only provide novel insight but open the door for applications of modeling advancement in physics-based models and beyond to artificial intelligence, data analysis, and data-informed decision making in the planning, design, operation, and maintenance of stormwater systems.
Introduction
The great challenge of stormwater management is to design a resilient system that mitigates the deleterious water quality and water quantity impacts of urbanization. Management systems are moving on from a singular extreme event detention approach to a broader resilient system foundation (NRC 2009; Rettig et al. 2014; Traver and Ebrahimian 2017). Although progress has been made in stormwater management infrastructure, the variable nature of rainfall processes, climate, anthropogenic activities, and dynamic site conditions on our stormwater control measures (SCMs) has inhibited advancement of our understanding. Stormwater components are often designed as individual, decentralized systems rather than as interconnected systems, largely due to a lack of a more systematic view and the choice by municipalities to implement SCMs opportunistically (Roy et al. 2008; Bell et al. 2016; Dickhaut and Richter 2020). To move past overly simplistic and overgeneralized designs for stormwater management, which lack the incorporation of local climate or the site surroundings, requires a unit process-based approach coupling measured water quantity and quality data (Traver and Ebrahimian 2017; Hou et al. 2021; Wadzuk et al. 2021a). Further, there is a need to develop more sustainable data-informed maintenance programs (Houle et al. 2013; Blecken et al. 2017; Clary et al. 2018; De-Ville et al. 2018; DelGrosso et al. 2019; Sharior et al. 2019). Observation data present an opportunity to develop smart and sustainable data-informed SCM maintenance programs (Wadzuk et al. 2021a; Wadzuk et al. 2021b). Concurrent with a move toward data-informed design and maintenance, municipalities are moving toward requiring monitoring to demonstrate performance in their stormwater management plans, (e.g., Measure W in Los Angeles; Storm Water Grant Program 2019), which will create a preponderance of data that will only be leveraged with an efficient data model. Last, providing a format that encourages data sharing, municipalities designing, regulating, and managing stormwater programs can more seamlessly learn from each other, furthering the technology of stormwater management.
The Data Revolution has invited new frontiers for understanding SCM performance (Traver and Ebrahimian 2017). Large data repositories shed light on how stormwater infrastructure functions through time, but often relevant data are siloed by data type, common user, or data collection or generation (e.g., national, state, or municipal). Most existing stormwater infrastructure data is siloed by site management, researcher, or municipality, and often by departments or utilities within municipalities, which makes it difficult to translate data and findings outside municipal boundaries. Further, the database architecture even from the state to municipal level is different, so data cannot be seamlessly integrated. Data often need to be translated or transformed when transferred between organizations, requiring a significant time investment in the investigator’s analysis (Abdallah and Rosenberg 2019). The lack of continuity between systems limits the efficiency and insight that stormwater infrastructure data can provide. The need for comprehensive frameworks for water data has been recognized at the national level [e.g., the proposed Water Data Act (H.R. 7792)].
Two of the largest water data repositories, the EPA’s Storage and Retrieval System (STORET) and USGS’s National Weather Information System (NWIS) demonstrate the challenges that hinder seamless interaction between modern stormwater data repositories. Both online systems were developed in the late 1990s and early 2000s (respectively) to collect large amounts of water quality and quantity data in a public, online format. Little consideration was given to using controlled language in the collected data, and investigators were only required to submit data in a compatible upload format to their respective repository, resulting in disparate systems with overlapping and misnamed variable codes (Chen and Han 2016; Choat et al. 2022). This slowed data querying and returned results that contained irrelevant or missing data, resulting in limitations for data sharing and further analysis (Beran and Piasecki 2009).
To overcome these challenges, numerous organizations have created interoperable data storage models with more stringent controlled language requirements for measured variables (Kumar et al. 2005). Developers are free to implement their repository in any format but must follow stringent controlled language requirements and submit metadata along with data files (Horsburgh et al. 2008, 2016). One such organization, the Consortium of Universities for the Advancement of Hydrologic Sciences, Inc. (CUAHSI), created the Observations Data Model (ODM) and Hydrologic Information System (Horsburgh et al. 2008; Maidment 2008) to overcome the lack of homogeneity between existing repositories of hydrological systems data. Before the ODM existed, hydrological data were difficult to locate and access, were usually in a format that required translation before use, and lacked documentation for understanding it (Horsburgh et al. 2008). The ODM defined a set of required attributes and relationships for storing hydrological data that addressed many of these issues. It requires that data be stored and retrieved in a spatially organized time series, uses a controlled vocabulary, and has traceable metadata (Horsburgh et al. 2008). This also facilitated integration with hydrologic observational data from heterogeneous federal, state, and local data providers into a “virtual database” using a service-oriented architecture (Maidment 2008). A second iteration of the ODM, ODM2, expands the original ODM, ODM1, framework to accommodate a wider range of data collection devices, defines stricter controlled language and implementation guidelines, and allows for a wide range of types of hydrologic data (Horsburgh et al. 2016). However, the complexity of this data model is beyond the needs of typical stormwater monitoring and management. As a result, efficiently serving stormwater infrastructure data with this number of attributes would be unnecessarily computationally expensive.
Across the field of stormwater management, the metadata associated with observed values is critical for interpreting and applying the information adequately through space and time. Although time and space are obviously relevant to data interpretation, within stormwater there are many other influential components to the interpretation of a value. How a sample is collected or analyzed may not compare well with samples collected or analyzed through other means. Further, the quality control or quality assurance process applied to the data can also result in disparate data.
SCMs, which are being implemented globally and often in urban areas, are a subset of hydrologic systems. The suite of attributes required for stormwater monitoring data is not able to be captured by several existing platforms. The International BMP Database does not support the full range of stormwater data (e.g., it does not enable continuous time series data to be paired with discrete sample data). The structure of ODM1 cannot capture attributes such as subsite location (or sample location), data quality features, and event type. The complex structure of ODM2 created challenges for serving this wealth of time series data without introducing NULL values for extraneous attributes beyond the need for stormwater data, specifically. Unlike hydrologic systems data, SCM monitoring data are often collected at sublocations within a site, which we refer to here as sample locations; samples are often classified and differentiated as having been collected during periods of base flow or storm flow and having had a style of sample collection (e.g., grab sample, composite, autosample) and analysis (e.g., relative detection limit), all of which are highly critical to analysis and interpretation.
Additionally, the magnitude of the data generated requires a streamlined model for efficient data management, including data loading, querying, and exporting. The ODM2 has the ability to incorporate these features, but the degree of possible attributes was a barrier for readily serving and managing data. Accounting for these features requires a data model, based on the ODM1 structure, that is designed to incorporate attributes for stormwater infrastructure while allowing the efficient retrieval of data. We hypothesize that this can be accomplished through a standardized data format for both discrete and continuous data, with appropriately abstracted metadata to describe the observations stored in a streamlined and uniform manner while providing an efficient manner to query the data specific to stormwater data. Here, we present the stormwater infrastructure data model (SIDM), a multidimensional data cube that organizes metadata through relational tables, allowing for advanced data parsing and analysis to overcome the traditional barrier of managing stormwater data. With sufficient metadata, this format allows for a virtually unlimited number of observations across time, space, and variables to be collected in a unified, highly detailed format. A relational data model allows for a systematic management scheme that enables advanced data mining, predictive modeling, and deviation detection for observations, where most operational data are stored in relational databases due to their reliability, scalability, available tools, and performance (Connolly and Beg 2005). The SIDM allows for SCM data to be analyzed across an array of dimensions, including but not limited to the spatial and temporal domain, allowing for deeper insight into how SCMs perform individually but also potentially providing insight to how SCMs perform as a system. This paper describes the structure of the SIDM and how it overcomes data management challenges specific to stormwater data and allows for deeper insight into the function and operation of SCMs.
Stormwater Observation Data
Within the stormwater management community, there is an increasing movement toward municipalities having inspection or monitoring programs (Stormwater BMP Maintenance TC 2019), resulting in an abundance of observational data. For example, a simple monitoring program for inflow and outflow (depth, velocity, flow) at continuous 15-minute intervals and 12 discrete water quality grab samples at the influent and effluent for six analytes [total suspended solids (TSS), total dissolved solids (TDS), total nitrogen (TN), total phosphorus (TP), copper, and zinc] results in 210,384 observations per year at one site. A municipal program can have hundreds of sites. This rise in monitoring is to support the desire to have an improved understanding of how a specific SCM performs relative to planning-level or compliance expectations or how a suite of SCMs perform in a region. For example, as part of Measure W passed in 2019 in Los Angeles, California, monitoring is a funded item and is required by SCM projects receiving funding (Los Angeles County Flood District 2019; Storm Water Grant Program 2019). Further, monitoring can aid in operation and maintenance efforts and decision making through improved models and analysis (Wadzuk et al. 2021a). SCM monitoring can also facilitate deepening the community’s understanding of the unit processes driving performance over time, ultimately allowing for more efficient and effective designs. SCM monitoring is a resource-intensive activity, and the resulting data need an organized and efficient structure for the knowledge held within the monitoring data to be used in stormwater planning and management decision making.
Due in part to the lack of a comprehensive national database of assets, the stormwater sector in the US is relatively data poor, inhibiting the ability of some municipalities to meet stormwater regulatory requirements (ASCE 2021). In personal communication by the authors with stormwater program managers in Austin, Texas; Philadelphia, Pennsylvania; and Portland, Oregon, we found all three municipal stormwater utilities use different data management platforms that do not facilitate easy data sharing outside their organization (Wadzuk et al. 2021a). However, there is an expressed need and desire for open knowledge sharing across municipalities. This is also evident through the breadth of municipal membership in the Green Infrastructure Leadership Exchange (https://giexchange.org/). The Exchange is “a highly connected peer learning network that offers a platform for practitioners to share experiences, circulate ideas, and solve problems together toward finding more sustainable water infrastructure solutions,” yet it does not have a mechanism to share explicit green stormwater infrastructure (GSI) function data. Some examples of questions the Exchange and others in the stormwater community are asking include:
•
How reliable is the captured water recession rate for a SCM type in an event and over time? Is this reliability transferable across a climate region?
•
What is the nutrient removal or outflow from the SCM? How does this shift by season and storm size? How does this scale to other similar land uses and GSI sites?
•
What are the annual trends and spatially variability of vegetation, and how is this related to SCM function?
•
How can the maintenance needs of an SCM be predicted? What is the typical timing between regular maintenance occurrences that optimizes performance and costs?
•
What is the predicted life of an SCM and its projected performance over the span of that period?
To answer these types of questions either by one organization or across organizations, a novel data model specific to stormwater was required. Stormwater data include continuously monitored data, storm sampled data, and model-produced data, and ultimately, this SIDM answers a community need to store and retrieve disparate types of data beyond what is currently available. Without a model that enables efficient management and access, the data are simply not available for research or management, greatly inhibiting advancement of our knowledge base. In designing this data model, the type of metadata required to interpret data, data retrieval speeds, and data integration was also considered. Although urban stormwater data collection is increasing, there are few databases that span beyond a municipality. Often data are siloed by department, limiting the ability to extract or transfer knowledge. One exception to this is the International Stormwater Best Management Practices Database (BMP Database). The BMP Database is a collection of stormwater data from institutions around the world (Clary et al. 2018) that does have a common data standard but relies on users to convert data into the dictated format and voluntarily upload data. The BMP Database is a repository of SCM field studies that provides access to monitoring data, as well as analysis tools and performance summaries. Over time, the BMP Database was expanded for land use and contains six different databases (urban stormwater BMP performance, agricultural BMPs, stream restoration BMPs, National Stormwater Quality Runoff Database, Department of Transportation Portal to BMP Database, and Urban BMP Cost Database). The database provides a wealth of SCM data, including information about watersheds, design, monitoring, and costs (National LID Clearinghouse 2021). The power of the BMP Database is that it is not managed by one municipality but rather jointly supported by nonprofit organizations (i.e., American Society of Civil Engineers and Water Research Foundation) such that the database is open. However, these data are largely lumped discrete event-specific data, matching how data are stored in disparate, and often sparse, state and municipal repositories. This information provides performance data for a wealth of SCMs (Clary et al. 2018). However, the limited data records, inconsistent vocabulary, and output format make it challenging to access the data in a seamless fashion or apply them to more advanced continuous simulations. Further, submitting data to the BMP Database makes them publicly available for analysis, but it does not offer a platform to enable in-house data management and analysis across all assets a municipality or organization has.
To further SCM design outcomes and acquire transferable insight to SCM function requires stormwater databases for a range of spatial scales and system complexity (Choat et al. 2022; Roy et al. 2008; Taira et al. 2018; WEF and ASCE-EWRI 2012). For example, a municipality may want to quantify individual SCM performance within a neighborhood and also know how all the SCMs in a neighborhood are collectively meeting stormwater goals, such as combined sewer overflow reduction at an outfall. Additionally, understanding the performance of an individual SCM requires merging of event and continuous data. Although SCM performance is tied to a storm event, the continual hydrological processes within SCMs dictate performance capability, such as antecedent conditions, groundwater levels, evapotranspiration, and sediment influx (Homet et al. 2022; Hess et al. 2017).
By linking continuous and event-based data, these performance indicators can be identified and described. For example, there may be higher influent pollutant concentrations after long periods of dry time that can be readily discerned with linked data in the SIDM, versus previous data sets, storage, or structures that simply had discrete event concentrations without the larger environment of data and therefore no evident reason for abnormally high concentrations. Also, by better linking multiple processes in a SCM, the scientific community will be able to more precisely identify and quantify the ecosystem services provided by SCMs on local environments (Parr et al. 2016; Vogel et al. 2015). To meet these challenges, a more robust, but efficient, data model that provides access to event and continuous data through controlled vocabulary to stormwater capable of incorporating multiple sites is needed.
SIDM Design and Schema
The SIDM design, based on CUAHSI’s ODM1, consists of a set of relational tables. The ODM specifications define a framework for recording the date, spatial location, and variable for a datapoint with its associated metadata detailing how it was collected (Horsburgh et al. 2008). The SIDM implements and builds on these specifications to pivot the database specifically toward stormwater infrastructure data. The SIDM collects additional metadata specifying the sublocation where a datapoint was collected, type of storm event that occurred during sample collection, and associated detection limit. The SIDM collects metadata for sampling sites in a portable document format (PDF) with information about the site’s location, SCM type, construction, monitoring history, site description, location and purpose of sample location, and names of samples and variables collected. Documentation is associated with a site at its creation in the SIDM and is accessible through the SIDM web application’s map interface.
The SIDM is implemented using 44 individual data tables stored within the MySQL relational database management system. Fig. 1 delineates the SIDM relational diagram. Thirty-seven of the 44 tables store SIDM data (e.g., data values, site information, and basic codes and definitions), whereas the remaining seven are used throughout the web application to manage data logs, file uploads, notes, sharing permissions, and users. Additional tables define controlled vocabulary for the codes used throughout the SIDM, which are derived from CUASHI’s ODM guidelines (http://his.cuahsi.org/mastercvreg/cv11.aspx). In Fig. 1, the title of each table in the diagram specifies the type of data stored in each SIDM table and lists the attributes stored in those tables. Cardinality is defined using the links between tables and shows the number of instances of other tables that must be created or referenced by a parent table to retrieve the information it stores. Data storage by the SIDM is accomplished by creating DataValues (center of the diagram) for all observations. Metadata for the attributes in each DataValue is fetched in a key–value fashion from other tables in the SIDM using the identifiers (IDs) specified in DataValues.
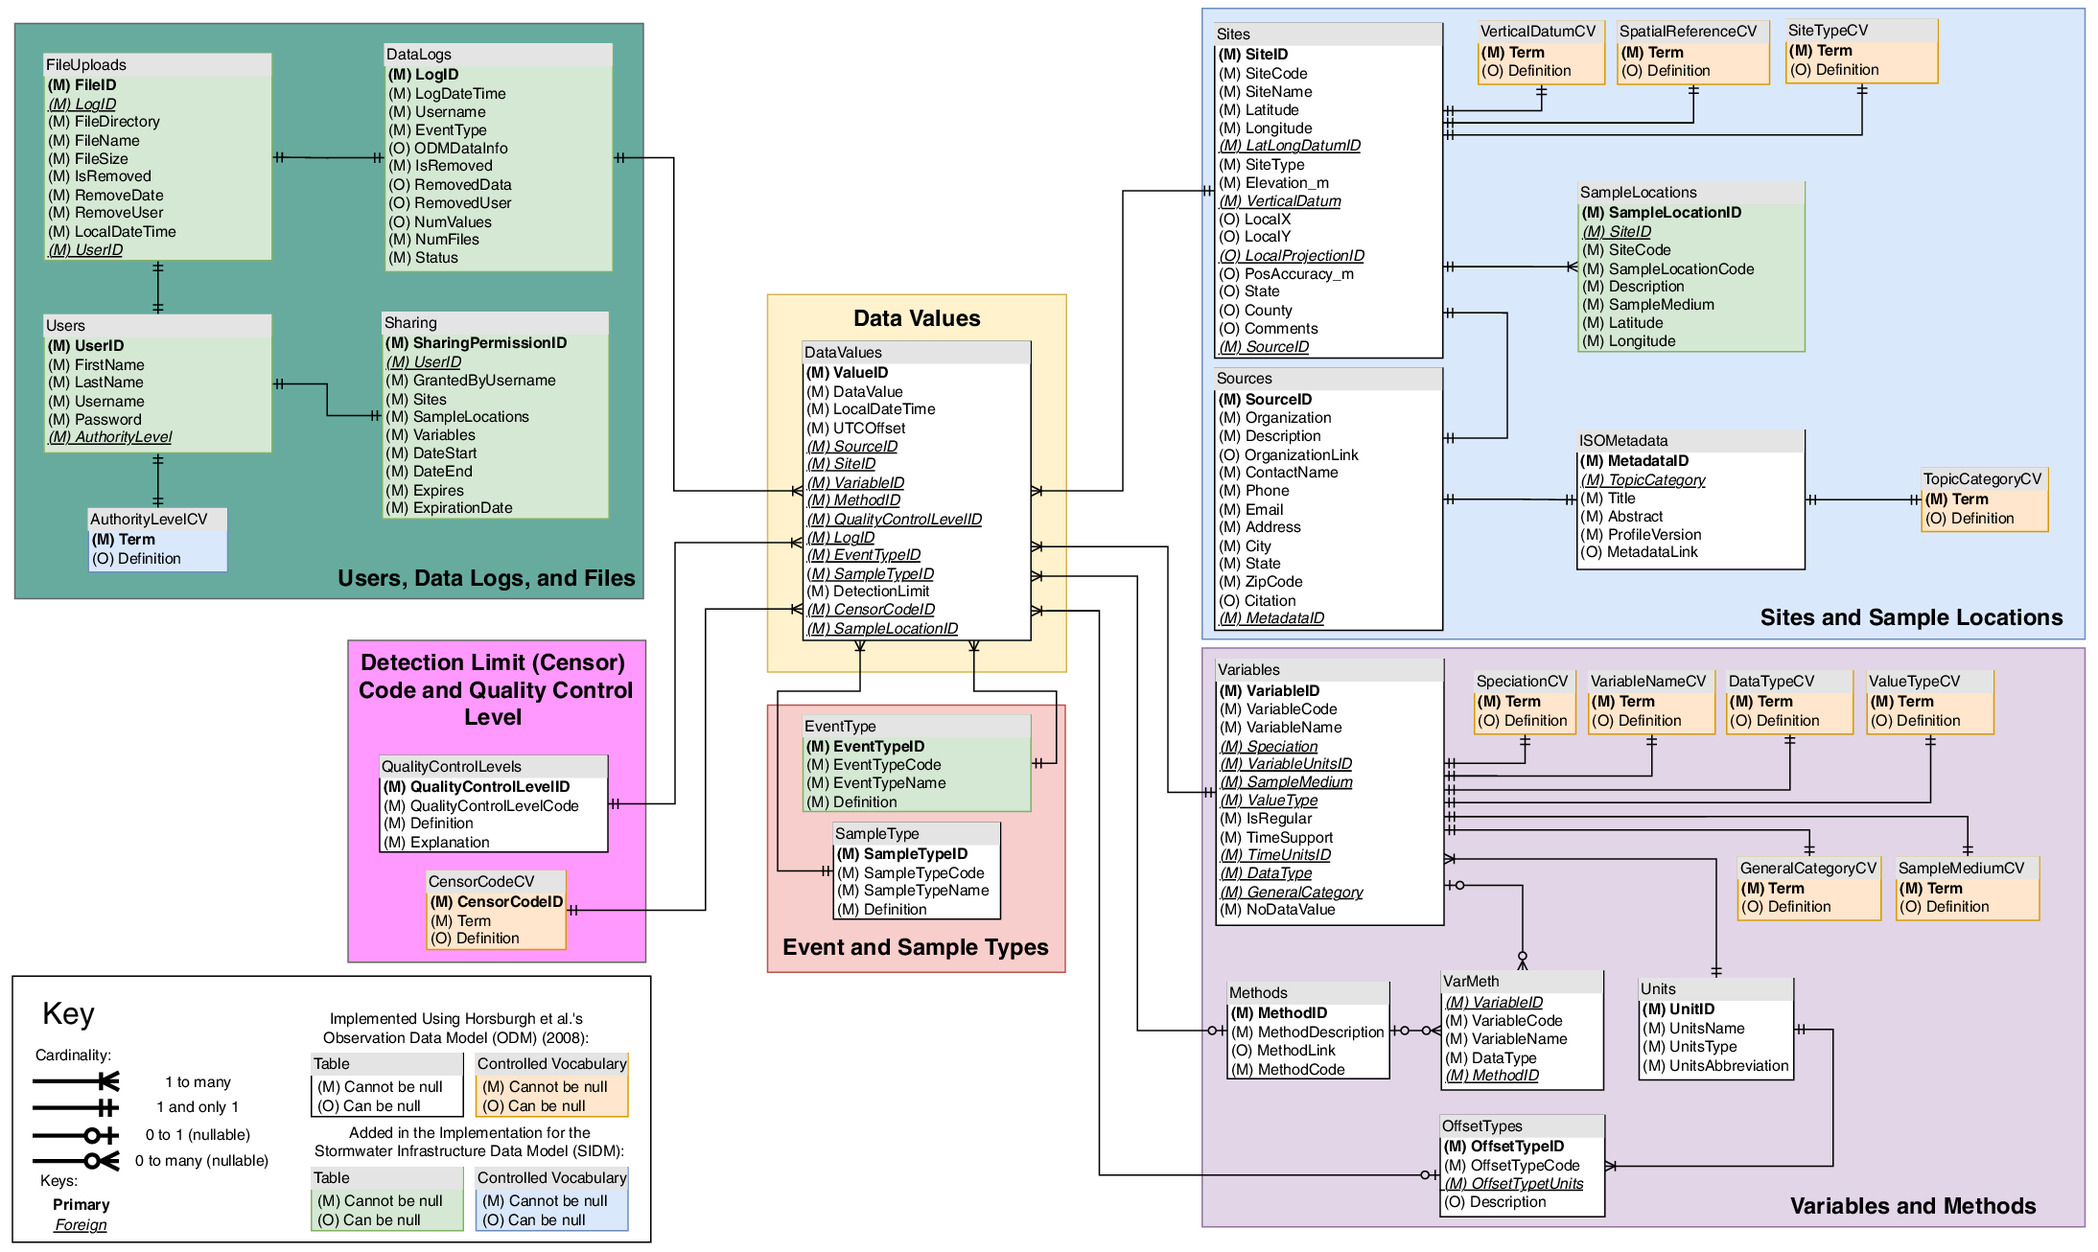
One major departure from the ODM1 is the introduction of the Datalog table, which is a record of all data added to or removed from the database. This can be done in bulk or through single value uploads. To implement this feature, a new LogID field is added to all data values during the data upload process. This field is indexed by an incremental sequence for each upload event. Although it marginally increases the size of the database, this new LogID field improves performance for updating the Series Catalog table and deleting large amounts of data at once.
Each table uses the InnoDB storage engine. InnoDB was chosen to ensure atomicity, consistency, isolation, durability (ACID)–compliant transactions and to allow for foreign key constraints. These constraints enforce strict relationships between each table and prevent many common data insertion or deletion errors.
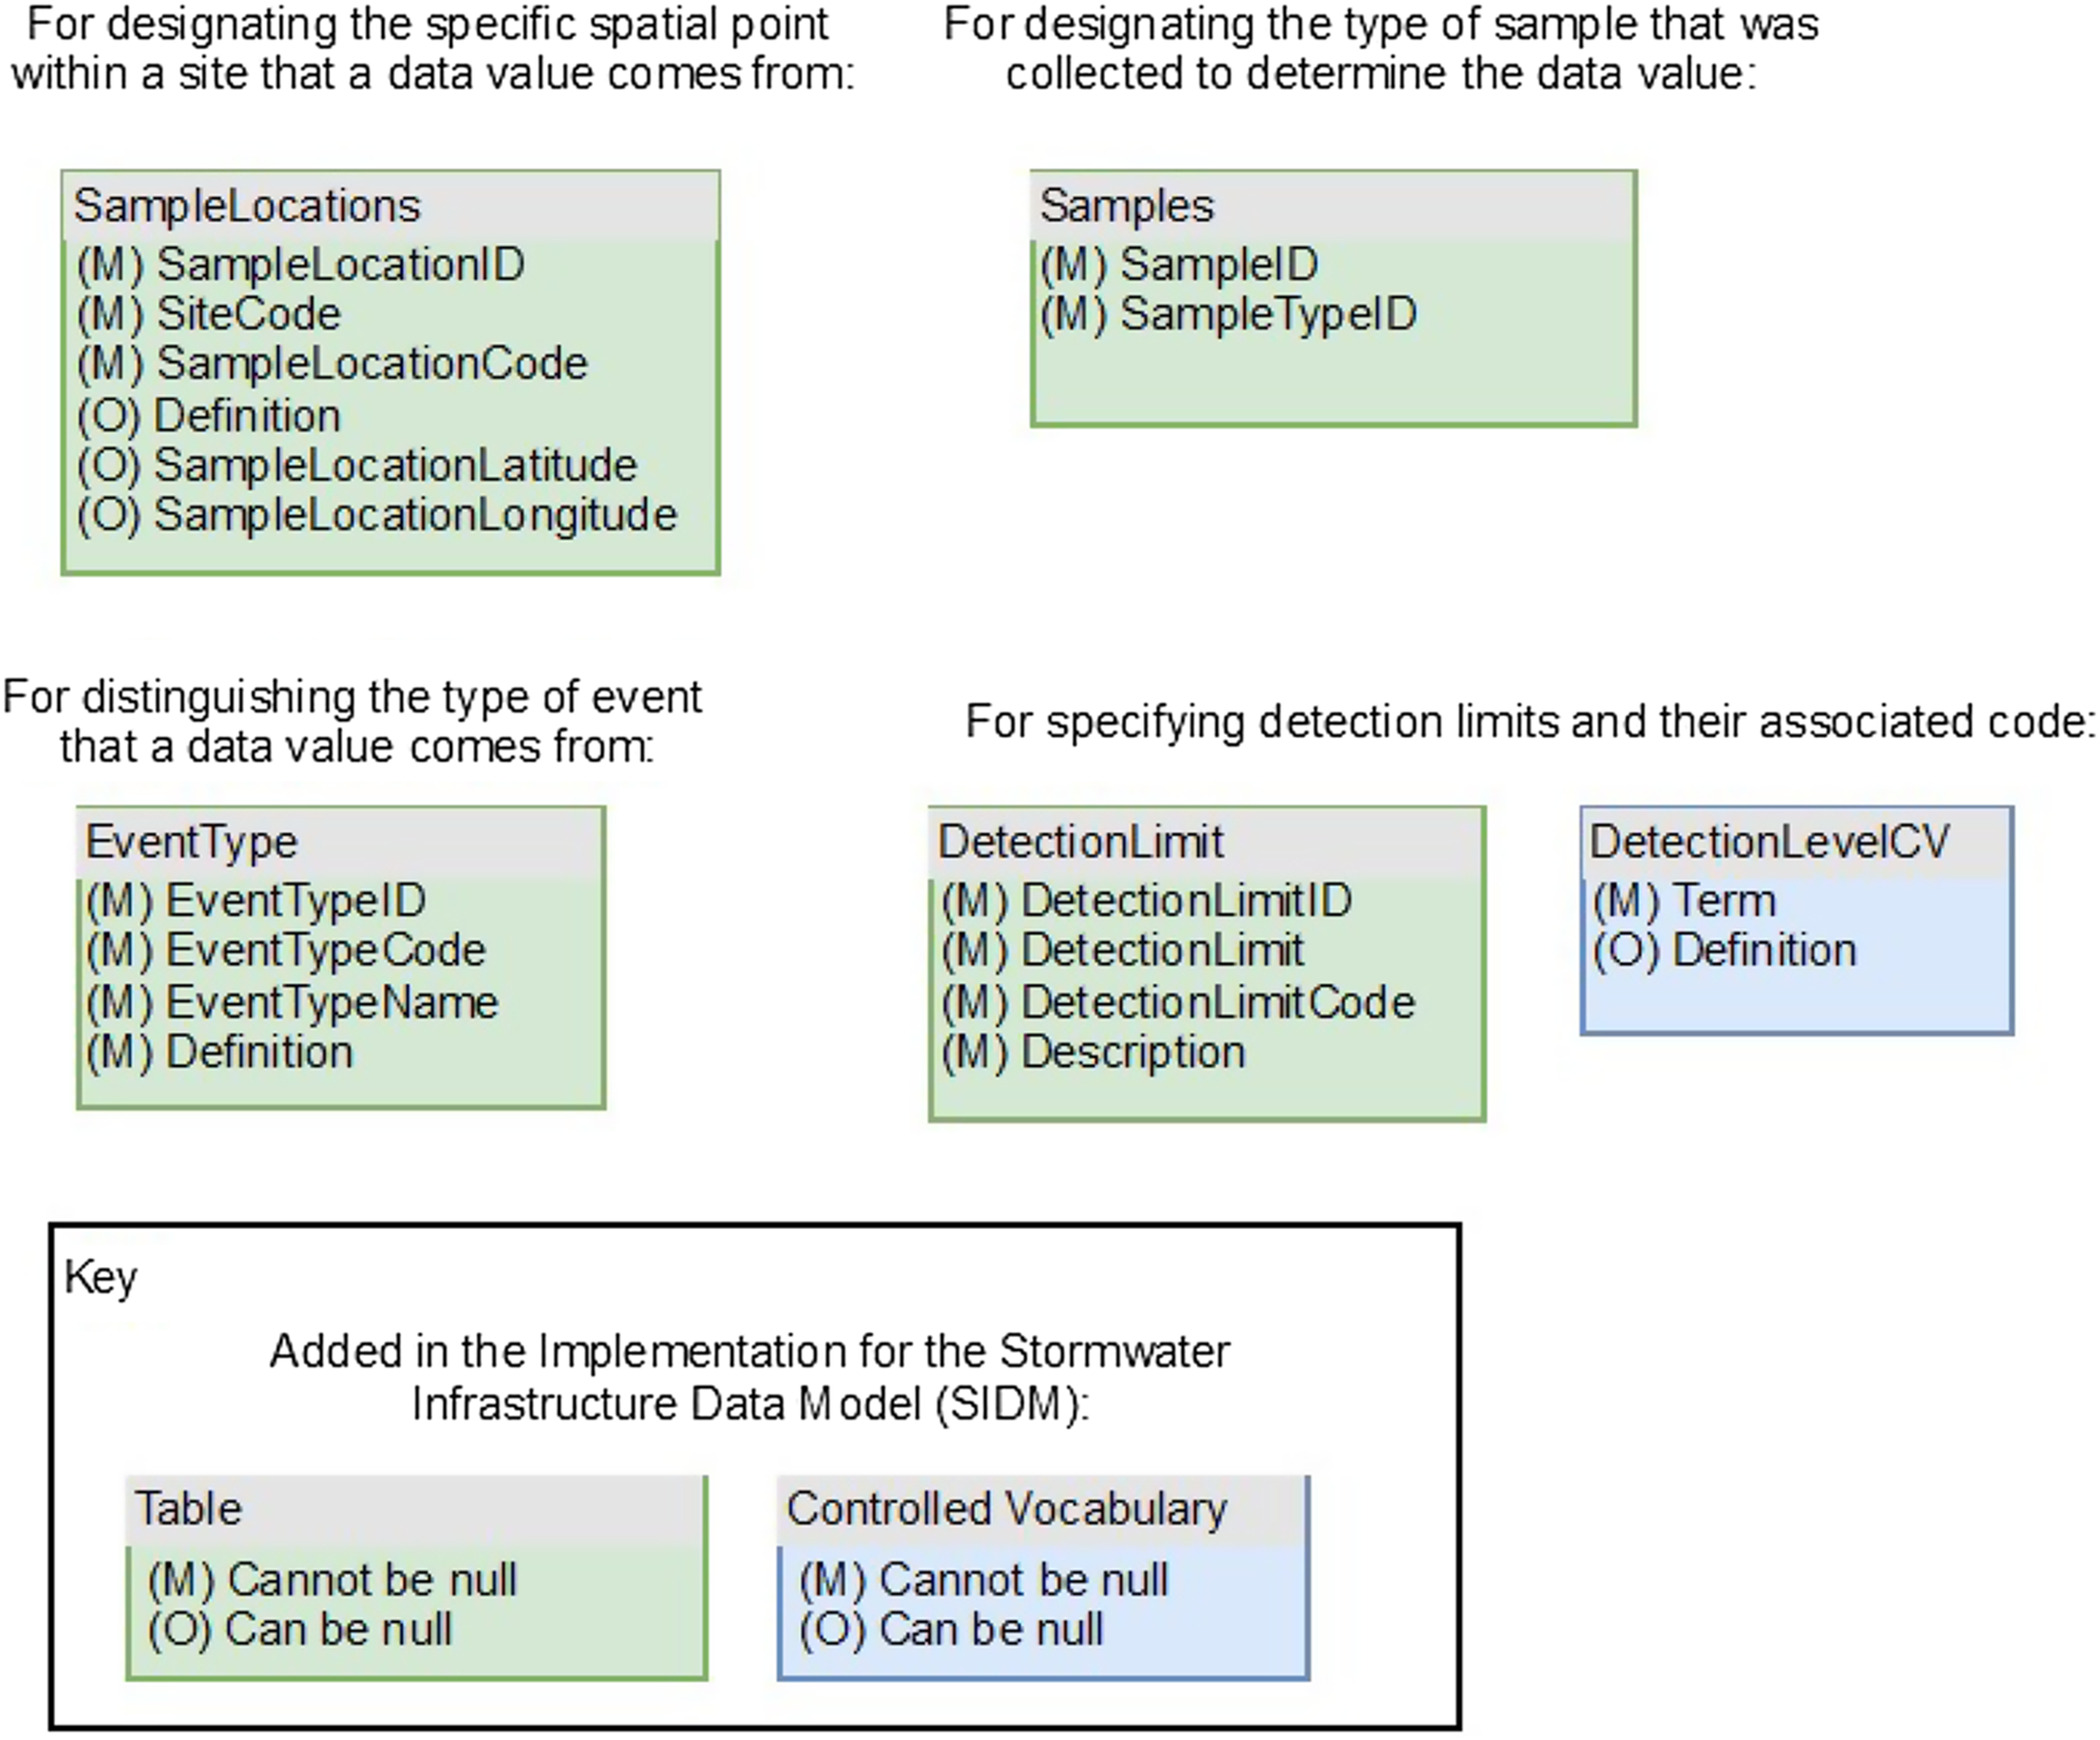
The Datalog table also stores all the uploaded comma-separated values (CSV) file information, related via a child FileUploads table. By using the Datalog and the associated FileUploads table, a SIDM database administrator can completely recreate the underlying MySQL database in the unlikely event of database corruption. Likewise, accidental deletion of data can be easily remedied because the Datalog stores both the deletion event and the underlying file that was deleted. The SIDM adds three additional tables to the ODM1 structure to describe the observational metadata, which is key for stormwater infrastructure observations. Although the latter metadata is more nuanced specific to stormwater infrastructure data interpretation, they are key parameters related to the instrumentation used for stormwater quality (Fig. 2). These include the following:
•
Detection limit system (DetectionLimit/DetectionLevel): where the concentration of an analyte or variable can be flagged as falling below the acceptable detection threshold by the lab instrumentation. CUAHSI defines controlled vocabulary for sensor codes to identify if a value has a detection limit. In ODM2, detection limits and detection limit codes (defined by the relationship between the detection limit value and data value) are accounted for through an optional table called the DataQuality extension that stores additional metadata beyond just detection limit information (Horsburgh et al. 2016). However, the SIDM applies only exactly what is needed for stormwater quality observations, the detection limit, and an associated code. Because this is an issue that has proven challenging in data reuse and data interpretation, detection limit and detection limit code are required for all observations values, even if they are null, rather than making it optional like in ODM2. A new column was added that stores the actual detection limit along with the censor code. This aids in data interpretation when the method or instrumentation used for data collection has changed, resulting in a change in data resolution. It is particularly helpful for stormwater quality monitoring where the SCM’s reduction of constituents results in values that are below the detection limit (Lee and Helsel 2005).
•
Event type (EventType): base flow, interflow, and storm flow indicators; the difference between these three environmental conditions has drastic impacts on water quality indicators and watershed health. ODM2 uses SamplingFeatures; however, these can only define one SamplingFeature.Specimen (Horsburgh et al. 2016). Therefore, observations cannot have both a SampleType and EventType. In the SIDM, this was made a standalone table defined by individual DataValues, which allows for multiple EventTypes at each SampleLocation.
•
Sample location (SampleLocations): are subset locations within a single research site. This allows for differentiation between duplicate variables measured at a given site, typically for comparison purposes across space. Sample locations can be thought of as subsites, in that they are a spatial extension of the original site codes. This allows for the isolation of individual features within a single stormwater control measure (e.g., observations at an inlet versus an outlet). The ODM2 defines a SamplingFeature as optional metadata that can be either a site or a sampling location (Horsburgh et al. 2016); however, there is no designation or relationship between the two. Although it could potentially be applied to meet stormwater infrastructure monitoring needs, it is well beyond what was required. Alternatively, ODM2 also has SpatialOffsets at SamplingFeatures, which did not provide the specificity needed to map observations. The SIDM is designed to distinguish between two types of SamplingFeatures: sites and their subsites, called sample locations. These tables are kept separate, requiring every sampling location to be related to only one site. Because every sample is related to a sample location at a site where the observation was made, this is required for every DataValue.
•
Sample type (SampleType): to differentiate how the sample was collected. This allows for data to be categorized as grab, composite, continuous, or autosample. Autosamplers can be programed to collect a composite sample or several discrete samples that can be triggered by time interval or rainfall volume. These data aid in long-term data reuse to identify potential sources of discrepancy associated with new sampling methods. This is defined as a child of the SamplingFeature table called SamplingFeature.Specimen in ODM2 (Horsburgh et al. 2016). Within the SIDM, SampleType does not have to be defined by the SampleLocation and is instead derived from a standalone table and defined by individual DataValues. This allows for there to potentially be multiple SampleTypes at each SampleLocation.
Throughout the development process, the SIDM was designed to align with principles of findability, accessibility, interoperability, and reusability (FAIR) data (Wilkinson et al. 2016). The SIDM aims to create a data model structure that meets these criteria to enable more robust and sustainable study of the data. The SIDM makes finding data easy through a graphical user interface (GUI) search page with filters for each type of metadata compared to other stormwater databases. The effective interface for building queries to search the database enables authorized users to retrieve data values and metadata. The SIDM and interface were developed using multiple iterations of user feedback to ensure that all required variables and parameters were collected to accurately describe the observations. Focus was also given to user input to ensure that the process was streamlined to minimize user input error (e.g., leaving out a critical variable accidentally because it was not required). The data model is reusable because any given combination of space (site, sample location), time, and variable codes uniquely identifies a data point and can be used as a reference for further analysis. Metadata associated with every value is stored in data logs and gives future users knowledge about how and under what conditions the data were collected.
Villanova’s Stormwater Observations Data
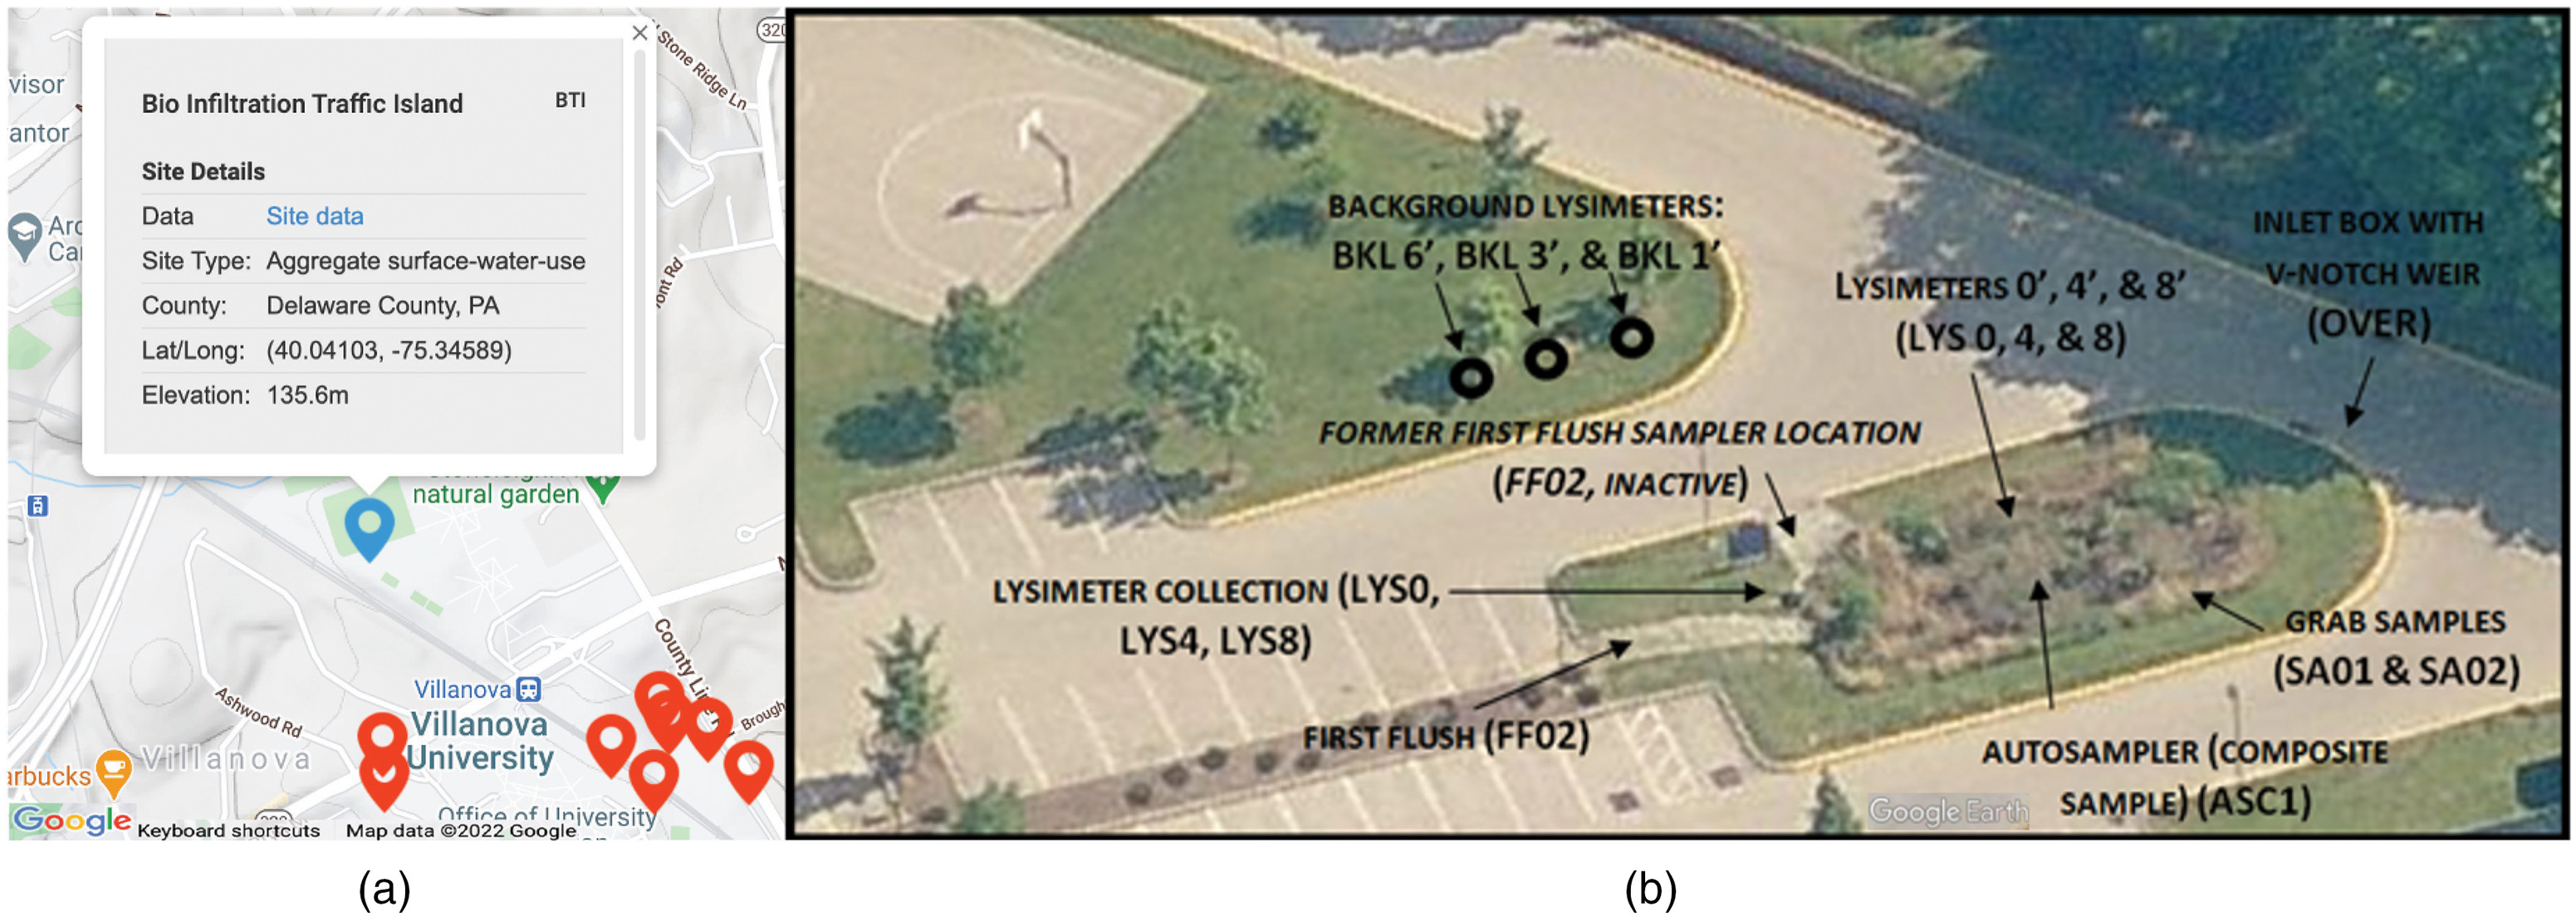
This paper describes an application of the SIDM to data collected by the Villanova Center for Resilient Water Systems (VCRWS). VCRWS has collected nearly 20 years of SCM data (from 2003 onward) across 21 different sites and 124 sample locations (the SIDM defines sample locations as locations where observation data are collected). Fig. 3 provides an example of one of the study sites, which has 16 sample locations. Differentiating between individual sample locations on a specific site is key for analysis (e.g., comparing inflow to outflow) both for aggregation at a specific site or for comparisons across multiple SCM sites.
Data are collected through continuous sampling sensors, grab samples, autosamplers, and field and lab measured data. The variables measured include discrete data [pH, total suspended solids, total dissolved solids, total kjeldahl nitrogen [TKN], nitrite , orthophosphate [PO4-], total phosphorous, soluble phosphate, chloride, nitrite + nitrate [NOx], ammonia , suspended and dissolved metals (zinc, lead, cadmium, chromium, copper)] and continuous data (electrical conductivity, temperature, dissolved oxygen, turbidity, sun elevation, total rainfall, flow depth, velocity, ponding depth, wind speed, wind direction, soil moisture, soil conductivity, soil temperature, relative humidity, air pressure, and solar radiation). Additionally, modeled variables, such as recession rate and outflow, are included in the database because these are key performance indicators. The collection method or processing of the laboratory samples for a specific variable may differ between sites or through time as laboratory equipment is updated, which is described by the Method Code. Metadata necessary for data interpretation is collected, such as detection limit, battery voltage, and system history. The large volume of continuous water quality and quantity measurements greatly exceeds any known green stormwater infrastructure database (for comparison, the International Best Management Practice Database has 5,041 TDS from across the world, whereas the SIDM has 4,561 measurements for the VCRWS sites).
Stormwater observations data, like many raw data sources, are inherently messy in its original format. The data output by time series dataloggers and lab instrumentation are in formats not conducive to direct loading into database systems. Both formats contain most or all of the appropriate metadata. Although these formats are easy to read and facilitate quality assurance reviews, they are not flexible enough to store and query quickly in a database. Unlike other stormwater databases, we merged continuous and discrete data to describe the infrastructure performance and function from a quantitative and qualitative approach.
SIDM Web Application Design
The user interface, the SIDM web application, allows users to view and query data, export data to a downloadable graph or file, view the database code dictionary, and add data to the database. Additionally, database administrators can add to or edit the code dictionary, access data logs for the database, manage users, and change access permissions for restricted users. The SIDM software stack consists of a PHP instance running on an Apache webserver plus an instance of MySQL for data storage. The web-based interface is accessible by all modern browsers and requires no software installation by the user.
The initial interface screen shows a spatial representation of all VCRWS sampling sites available [Fig. 3(a)]. Users can click any labeled sampling sites on the map or in the menu to load data available, which can be viewed graphically. Site summary pages highlight the site history and available data. To retrieve data, users query data using the Query Builder, which contains filters, allowing for data retrieval for a combination of sites, sampling locations, variables, collection methods, event types, sample types, quality control levels, detection limits, or date ranges. Query results appear in tabular form for dynamic comparison with the included plotting interface. Options to change the amount of data viewed on one page, page through the results, change the applied filters on the query, and export the results to a CSV file are available.
For performance reasons, the output files are split into 1 million–row chunks to allow faster upload and processing by the server. A corresponding file index is appended to the file name to allow for distinct files when running this process on large data sets that can produce many output files. This method is preferable when performing the operation on a large data set, such as the historical data set for many sites.
Data importing is the most processing-intensive aspect of the SIDM. Workbooks containing raw data are cleaned, leaving just sampling dates and their data points. The SIDM data loader requires each data point to be parsed into one row of a CSV file (containing the following metadata: Datetime, DataValue, DetectionLimit, DetectionLimitCode, SiteCode, SampleLocationCode, VariableCode, MethodCode, EventTypeCode, SampleTypeCode, OffsetTypeCode, OffsetTypeValue). The SiteCode, SampleTypeCode, OffsetTypeCode, and OffsetValue are the same for all values in an input file and are statically defined. Metadata specific to each row in the input file (the Datetime and consequential EventTypeCode) and the metadata specific to each data point in the input file (DataValue, DetectionLimit, DetectionLimitCode, VariableCode, and MethodCode) are retrieved while iterating over each of the values in the Input file. SampleLocationCodes are retrieved using a combination of the SiteCode, VariableCode, and MethodCode.
Formatted files are uploaded to the VCRWS database using the data loader. Output files are uploaded directly to the database in portions smaller than 100 Mb. Upon upload, files are checked to ensure proper format and that timestamps are in the appropriate MySQL datetime format. To speed up this process, local file importing takes an input created by the upload process and directly injects data to the database. If there is an error with the uploaded file, an error code identifying the issue and where it is in the file is returned. The validation algorithm for processing uploaded values demonstrates linear complexity (also known as linear Big O notation). Therefore, adding many rows of data does not add extra computational time relative to how long a smaller number of rows would take to validate. Because the limit for upload is 100 Mb, validation is typically achieved in less than 5 minutes, ensuring that the uploaded data fit what is already in the database.
Storing data in “long” format, where a value must be specified for each piece of metadata in a DataValues row, is preferable for flexibility and query purposes because of the ability to add variables, sites, sample locations, and methods dynamically. The appropriate metadata can be added in the corresponding relational tables, and values can immediately be added to the data value storage. Similarly, query performance is increased due to the use of indexes within the data values table. Instead of adding a new index for each new variable, adding new data causes existing indices to update. Specifically, covering indexes, a SQL concept that uniquely identifies records based on a joint set of columns pertaining to a specific query, drastically increase performance by allowing the SQL engine to efficiently find and return query results using “where” statements to filter results based on those indices rather than directly searching the entire data record. There is an additional storage cost associated with creating and maintaining each index, but because storage is inexpensive and processing time remains the largest overhead to serving data, this tradeoff is acceptable.
Table 1 describes the complexity of searches possible with the Query Builder. The simplest search returns a single data point. The next most complex search involves the same spatial parameters but occurs over a series of timestamps. A single variable in a time series or at a timestamp can be queried for multiple site sampling locations collecting the specified variable. This process can be repeated at multiple sites. In the most complex search, any combination of one or more sites and one or more site sampling locations can be performed in a time series or at a timestamp for multiple variables.
| Type | Measurement | Time series | Intrasite coverage | Intersite coverage | Multivariable coverage |
|---|---|---|---|---|---|
| Description | A single observation for a variable at a specified timestamp within a site and sample location that has an accompanying quality control level, offset, and method of collection | A series of measurements for a variable within a time interval | A series of measurements for a variable at multiple sampling locations within a site | A series of measurements for a variable at multiple sites and one or more sampling locations within those sites | A series of measurements for multiple variables at one or more sites and one or more sampling locations within those sites |
| Space | Fixed location at a site and sampling location within a specified site | Fixed location at a site and sampling location within a specified site | Between many sampling locations within a site | Between many sites and sampling locations within those sites | Between many sites and sampling locations within those sites |
| Time | Instant in time | Time interval | Either an instant of time or over a time interval | Either an instant of time or over a time interval | Either an instant of time or over a time interval |
| Variable | One variable, with one measurement that is a floating-point number | One variable, with many measurements that are floating-point numbers | One variable, with one or many measurements that are floating-point numbers across multiple sampling locations | One variable, with one or many measurements that are floating-point numbers across multiple sites and sampling locations | Many variables, with one or many measurements that are floating-point numbers across multiple sites and sampling locations |
| SIDM function | Query Builder specifying a single date and time for a single variable at a specific site and sampling location within the site | Query Builder specifying a range of dates for a single variable at a specific site and sampling location within the site | Query Builder specifying a single date and time or a range of dates for a single variable at a specific site and multiple sampling locations within the site | Query Builder specifying a single date and time or a range of dates for a single variable at multiple sites and sampling locations within those sites | Query Builder specifying a single date and time or a range of dates for more than one variable at multiple sites and sampling locations within those sites |
SIDM Example Results
Despite the simple nature of data storage and retrieval, the SIDM’s relational nature has the capacity for powerful data analysis. Given that each datapoint has an associated spatial and temporal value, single datapoints at different spatial locations or different points in time can easily be related to one another. The SIDM’s strict formatting requirements will create an output file from a query of variables in the same format. When combined with other sampling locations from the same site, one could quickly produce a comprehensive analysis of variable trends through time. These examples highlight the features and function of the SIDM in the storage of different types of stormwater observations; the intention of these examples is not to provide specific analytical methods or findings regarding the performance of any GSI.
Example of Types of Stormwater Observations
The example applies the SIDM structure at a single site, the rain garden (Fig. 3). The rain garden is a SCM built at Villanova University in 2003 that collects runoff from a drainage area with 50% impervious surfaces. The rain garden diverts runoff through an infiltration basin with amended soils and vegetation to reduce downstream peak flow, stream bank erosion, and nonpoint source pollution. As runoff travels through the system, a series of sensors collect data on the water’s physical and chemical properties [Fig. 3(b)].
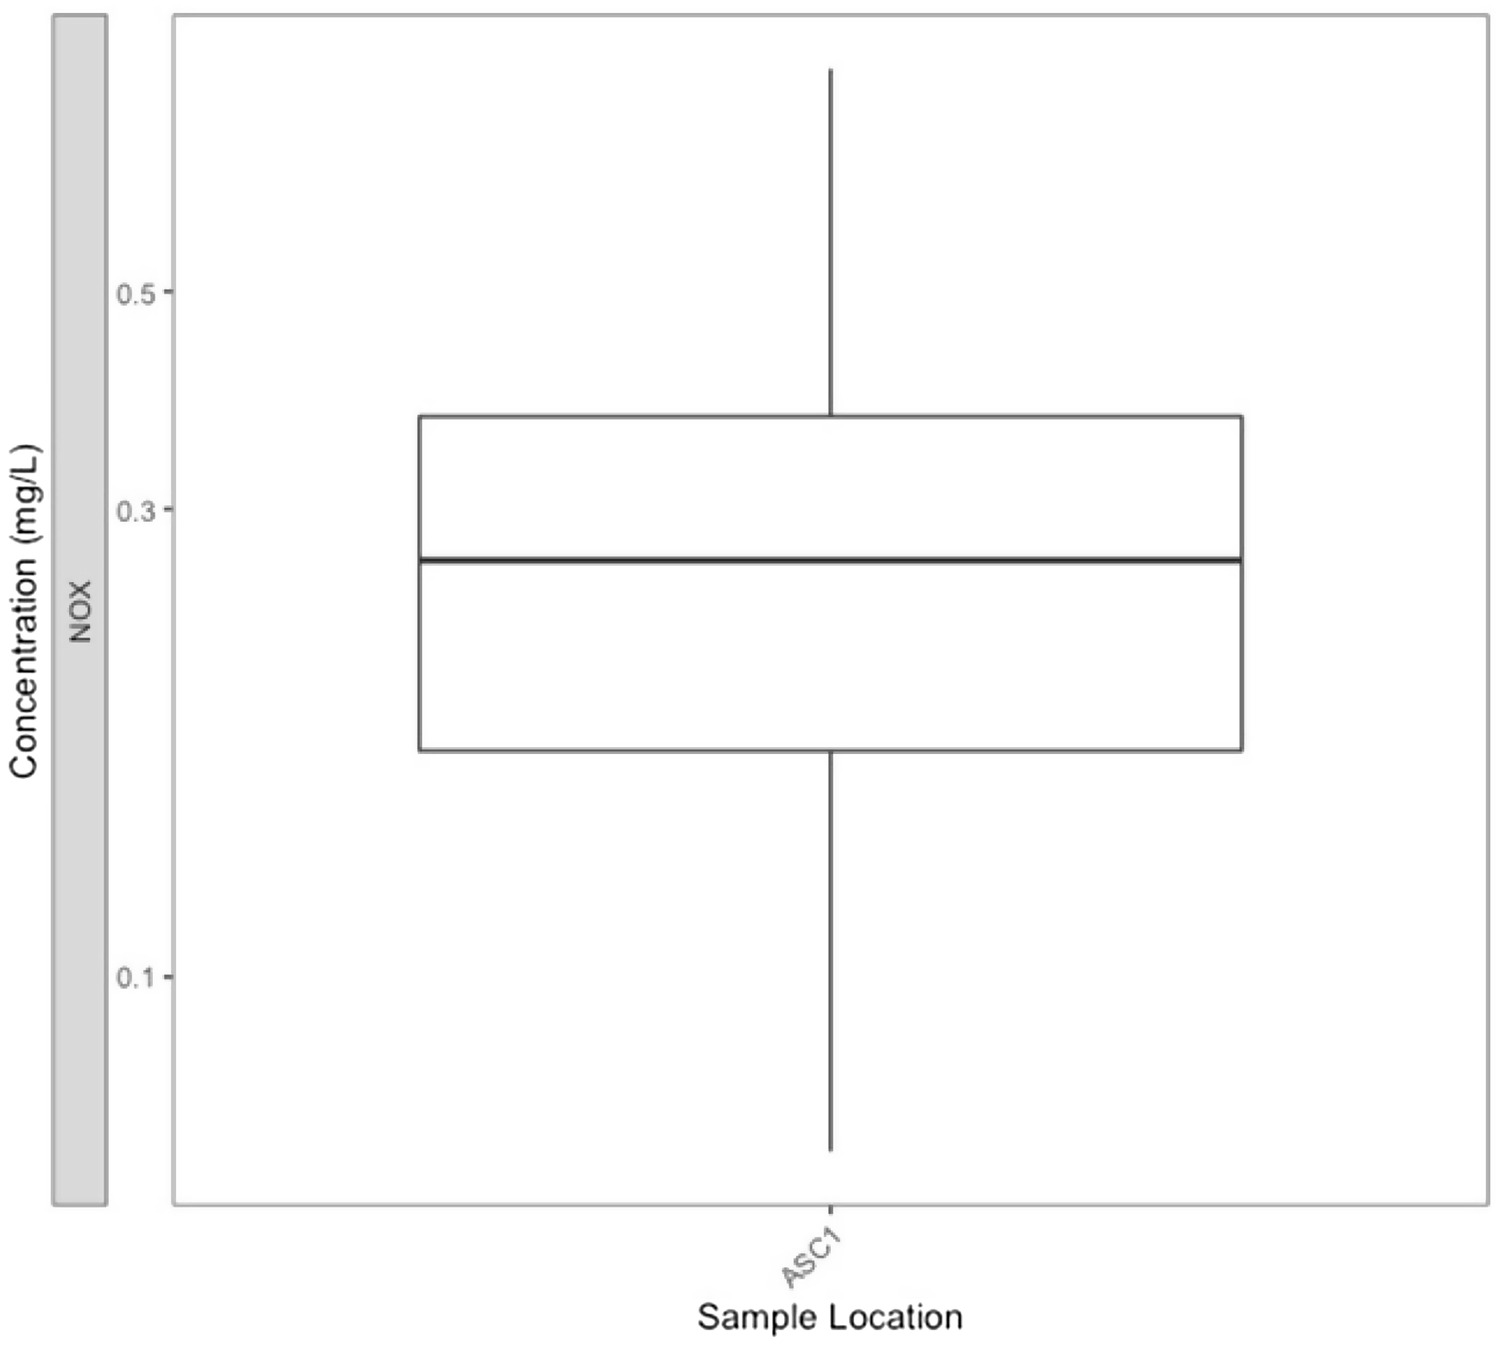
Queried data are retrieved from the tables storing their respective information in the SIDM. All Nitrite + Nitrate () data values collected and measured from samples collected at the composite autosampler [ASC1, Fig. 3(b)] that were above the detection limit for individual storm events have been specified from the Query Builder’s filter menu and then visualized from the raw export without the need for translation or reformatting (Fig. 4).
Each of these filters has a numerical identification that can be used as a key to retrieve the metadata from other tables associated with it. The SiteCode has a SiteCodeID of 4. The Query Builder receives the SiteCodeID 4 and finds all DataValues in the DataValues table of the SIDM with the same SiteCodeID. Fig. 5 demonstrates how the same usage of keys and values is reflected in the way the SIDM stores and retrieves metadata for values in the DataValues table. Each entry in a table containing codes for metadata has a unique ID code associated with it, which is used by values in the DataValues table to reference metadata associated with that ID in its respective table. For instance, an entry in the DataValues table with a SiteCodeID of 15 and SampleLocationID of 4 would be a piece of data from the BTI at ASC1. Some of the metadata tables contains references to other tables in the same way. The table pointing from in Fig. 2 shows how a row in the SIDM’s Variables table for specifies the units. The stored in the row of the Sources table specifies that data from this source are collected from VCRWS-related projects.

Example of Spatial Variability of Stormwater Observations
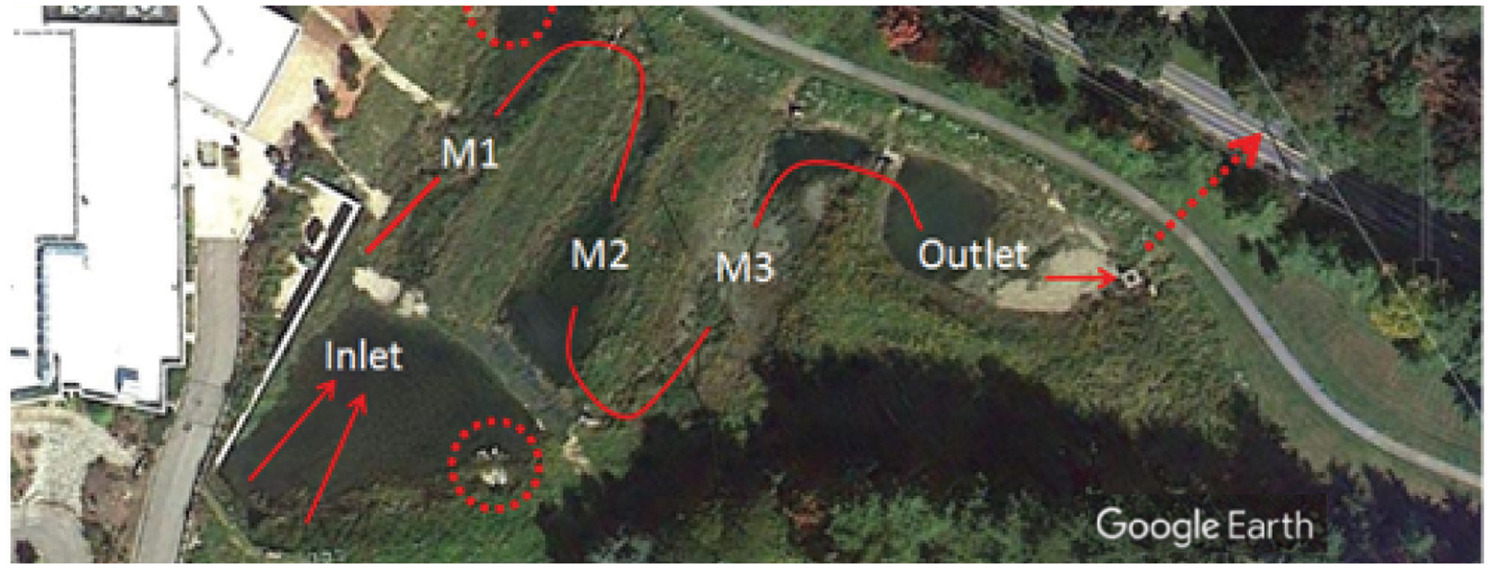
To demonstrate the SIDM’s capability for relating data values both spatially and temporally, this example considers a constructed stormwater wetland (CSW) on the western portion of the Villanova campus. The Villanova CSW was built in 1999 with the purpose of capturing runoff from of the university’s campus before it enters Mill Creek. Captured runoff enters at the confluence of two inlets (Fig. 6, inlet) and passes through a series of three meanders (Fig. 4, M1, M2, and M3), which were added in a second iteration in 2010 for increased hydraulic residence time and vegetation interaction to potentially improve nutrient extraction, before reaching the outlet (Fig. 6, outlet). The inlet and outlet of the Villanova CSW are equipped with flow meters to measure continuous, 5-minute discharge readings. These locations undergo water quality sampling after storm events and periodically during baseflow conditions using both autosampler and grab samples. All these data are stored in the SIDM discretized by sampling location and time of collection with respective variable codes.
As an example of how pollutant load may be analyzed, this example shows how data are queried and extracted from the SIDM for calculation and analysis that would be done outside of the SIDM. The query tool enables the user to extract just the data they need to directly perform their analysis without further data processing. Total suspended and dissolved solids are measured in a laboratory setting using the autosampler and grab samples collected from the inlet and outlet of the CSW (Fig. 7, SiteID 16) after storm events and intermittently during periods of baseflow. Querying the SIDM for TSS and TDS (Fig. 7, VariableIDs 6 and 7) values and continuous discharge (Fig. 8, VariableID 108) from the inlet and outlet (Fig. 8, SampleLocationIDs 129 and 130 for the two discharge sensors at the inlet, SampleLocationID 124 for water quality samples taken from the inlet, and SampleLocationID 128 for the discharge sensor and water quality samples from the outlet), one can construct an event-total mass load for each nutrient passing through the CSW for water quality sampling events. This would be accomplished by multiplying each nutrient’s measured concentration by the event-total discharge volume of the inlet and outlet with appropriate unit (Fig. 7, UnitsID 199 for TSS and TDS in and UnitsID 35 for discharge in cfs) conversions. During baseflow conditions, grab samples are collected from all five of the sampling locations of the CSW. A distribution of event-total mass loads for TN and TP, in addition to TDS and TSS, at all five sampling locations during baseflow conditions can be constructed using event-duration integrated discharge volumes from 5-minute discharge observations (identified in postprocessing using rainfall data to contextualize periods of dry weather) and average nutrient concentrations (also calculated in postprocessing procedure grouping by date of event) from nutrient data with the EventTypeCode for baseflow stored in the SIDM (Fig. 7). In this example, detailing seasonal total mass loads for individual events between 2012 and 2019, inlet discharge was supplemented for sample locations not directly measuring discharge (M1, M2, and M3). The DateTime stored with each water quality observation allows for contextualization of event-total mass loads of these nutrients by season and serves as a basis by which discrete and continuous data, both indexed by the date and time of their observation, can be related to each other in postprocessing procedures as facilitated by the structure of the SIDM. Ultimately, this facilitates the analysis and comparison of a wide range of parameters.

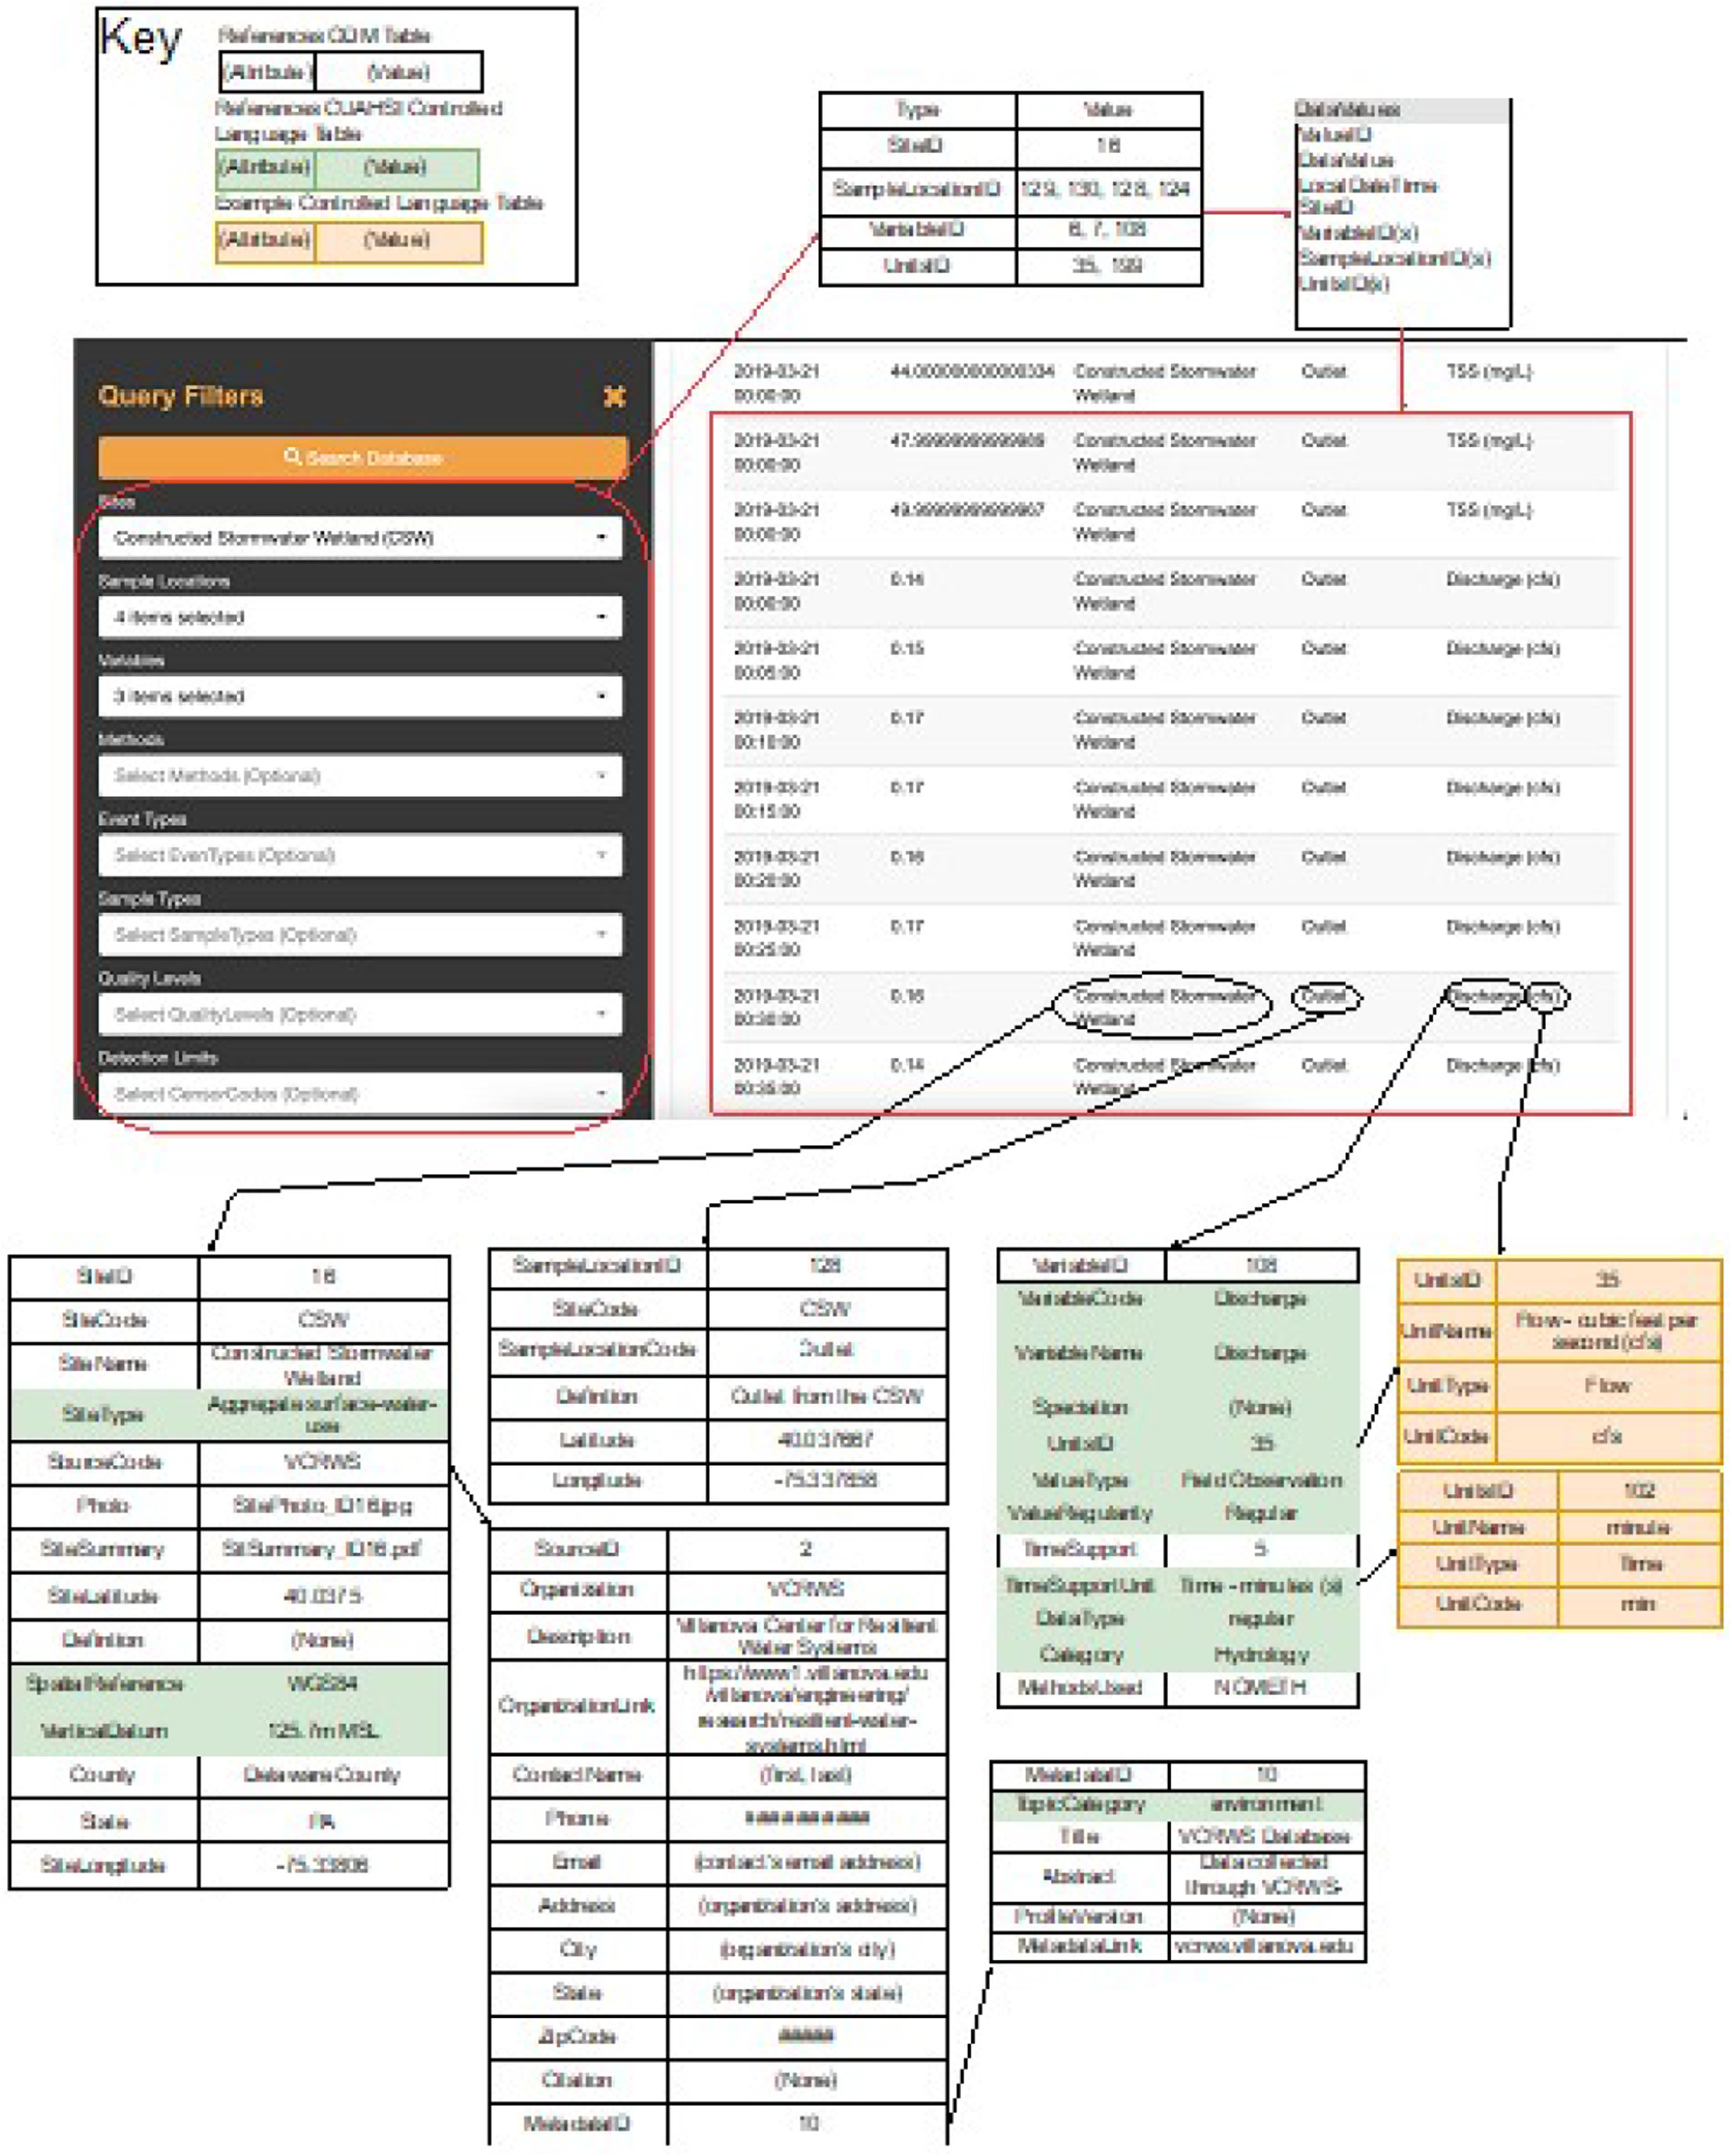
The collection of metadata for each DataValue entered in the SIDM facilitates this task with almost no need for data translation beyond unit conversion for relating the quantities of units between VariableCodes. The Datetime and SampleLocationCodes of each DataValue for the VariableCodes Discharge, TN, TP, TSS, and TDS within the SiteCode CSW organizes these values relationally, spatially, and temporally (Fig. 8). Additional metadata for the type of event the nutrient values from (EventTypeCode) and the type of sample the nutrient values were extracted from (SampleTypeCode) allows investigators to add extra facets to analysis of the spatial and temporal mass loading performance of their systems.
Discussion and Conclusions
To date, the SIDM has enabled effective and efficient organization of stormwater observation data beyond what was previously possible. Modern SQL practices have allowed faster storage and querying of data, minimizing processing time and increasing ease of use for VCRWS’s extensive 20-year stormwater infrastructure data set. This data model has the potential to enable efficient analysis of organized data not just across VCRWS’s diversity of sites but across municipalities and potentially larger administrative platforms. Because the data model is freely available, other entities could create their own model with their data. An entity can find benefit in easier and new ways to glean information from the data it already collects. Further, as more entities adopt this data model and can then easily share data, they can enter partnerships with other SIDM entities to share and amplify findings to inform improved designs and more efficient operation and maintenance, for example.
The SIDM aligns with principles of FAIR data—findability, accessibility, interoperability, and reusability. By designing the data model to align with these FAIR principles, the process of describing, organizing, storing, loading, and accessing stormwater observations is more methodological and structured. This benefits data users in the following ways:
•
Controlled language: Through standardized language, stormwater observations can be easily compared without confusion of measurement principles or meanings. By linking the CUAHSI’s controlled vocabulary, these observations can be connected to other ODM databases. This could potentially be maintained by ASCE’s Environmental and Water Resource Institute, which has established subcommittees on data management.
•
Efficient processing (uploading, storage, and retrieval): Advancements in stormwater monitoring coupled with growing stormwater systems have resulted in the generation of multitudes of stormwater observation data. To use this information for analysis, the data must leverage advanced tools for efficient processing.
•
Quality control: A strict quality assurance process upon upload of original data files ensures that SIDM data contain accurate codes with unique names and data related to them that can be queried as a result. The use of quality control levels and detection limits permits water quality data collection with their event-specific information.
•
Data reuse: Data reuse and sustainability are facilitated through the creation of data logs for each data upload and deletion event, coupled with the storage of original file uploads. Stored data can be filtered and exported with the Query Builder. The use of controlled language across all uploads ensures that minimal data translation is required for sharing and further exploration of exported data. This will facilitate data reuse.
•
Analysis across traditional data barriers: Often stormwater data is siloed due to the manner of data collection (continuous data versus discrete data), management of data collection, or processing of data. To create a comprehensive view of stormwater infrastructure performance, these traditional barriers must be overcome. The SIDM facilitates this through a relational structure, which allows for a comparison between infrastructure observations (e.g., precipitation, temperature, or inflow) and performance indicators (e.g., SCM recession rate) for a more comprehensive data analysis across spatial and traditional regulatory barriers. Ultimately, this will aid in the reuse of data.
The SIDM creates a platform for stormwater data management. Unifying the stormwater data structure will allow holistic analysis of infrastructure systems performance and function through time. The metadata stored in the database facilitates data interpretation for data reuse. Further, this SIDM can provide a common platform to enable resource-limited municipalities to enhance their data sets and increase knowledge acquisition. The SIDM has the potential to allow for the transferability of knowledge between cities, deepening our insight into best practices for design and asset management. Further, the model has the potential to link urban stormwater infrastructure to surface environmental data that will enable more systematic analysis of all water systems. Stormwater data have not yet fully benefited from this advancement in informatics. In this paper, we present the SIDM as a solution for stormwater infrastructure data management, analysis, and storage.
As urban areas grow, stormwater management systems become increasingly intricate. This is coupled with increased feasibility in data collection. The stormwater community is moving toward data-driven approaches for design and maintenance, necessitating efficient and effective stormwater data management. Spatiotemporal analysis of these stormwater systems will deepen engineering and scientific understanding of system function through time and space and interactions with other hydrologic systems (e.g., rivers, reservoirs) (Wadzuk et al. 2021a, b). However, advancement of our understanding to achieve these goals requires the implementation of a data model capable of serving data efficiently, integrating discrete and continuous data in a standardized data format. Simultaneously, the data model must incorporate the abstract metadata required to describe the observations specific to stormwater data to enable shared use and knowledge across stormwater entities. The stormwater community often relies on knowledge from different entities, as exemplified through organizations such as the ASCE Environmental and Water Resources Institute, the Water Research Foundation, and the Green Infrastructure Leadership Exchange, to name just a few. By providing these entities not just with a repository but a data model that can be used in robust data analysis and data sharing, helpful knowledge can be transferred more readily. Future iterations of the SIDM will include the ability to organize data by site parameters (e.g., infrastructure type, drainage area) for a deeper system analysis. Further, this could spur additional innovation, such as new tools for data analysis and modeling applications. Implementation of a stormwater-specific data model, such as the SIDM, supports these opportunities through efficient and FAIR management of stormwater observation data, enabling the building of the stormwater knowledge base and facilitating knowledge expansion that will increase as data grow.
Data Availability Statement
The data, models, and code that support the findings of this study are available from the corresponding author upon reasonable request. Additionally, the structure of the SIDM is available to the public at structure uploaded to www.github.com/VCRWS/SIDM. The structure is available on Zenodo (McGauley 2021).
Acknowledgments
The data model described in this manuscript was developed using data and resources from the Villanova Center for Resilient Water Systems (VCRWS). The data model described was inspired by and based on the Consortium of Universities for the Advancement of Hydrologic Science, Inc. (CUAHSI) Observation Data Model (ODM). This project was made possible with funds and support from the Villanova Center for Resilient Water Systems.
References
Abdallah, A. M., and D. E. Rosenberg. 2019. “A data model to manage data for water resources systems modeling.” Environ. Modell. Software 115 (Sep): 113–127. https://doi.org/10.1016/j.envsoft.2019.02.005.
ASCE. 2021. “Stormwater infrastructure—ASCE’s 2021 infrastructure report card.” Accessed January 26, 2021. https://infrastructurereportcard.org/cat-item/stormwater/.
Bell, C. D., S. K. McMillan, S. M. Clinton, and A. J. Jefferson. 2016. “Hydrologic response to stormwater control measures in urban watersheds.” J. Hydrol. 541 (8): 1488–1500. https://doi.org/10.1016/j.jhydrol.2016.08.049.
Beran, B., and M. Piasecki. 2009. “Engineering new paths to water data.” Comput. Geosci. 35 (4): 753–760. https://doi.org/10.1016/j.cageo.2008.02.017.
Blecken, G.-T., W. F. H. Al-Rubaei, A. M. Viklander, and W. G. Lord. 2017. “Stormwater control measure (SCM) maintenance considerations to ensure designed functionality.” Urban Water J. 14 (3): 278–290. https://doi.org/10.1080/1573062X.2015.1111913.
Chen, Y., and D. Han. 2016. “Big data and hydroinformatics.” J. Hydroinf. 18 (4): 599–614. https://doi.org/10.2166/hydro.2016.180.
Choat, B., A. Pulido, A. S. Bhaskar, R. L. Hale, H. X. Zhang, T. Meixner, L. McPhillips, K. Hopkins, J. Cherrier, and C. Cheng. 2022. “A call to record stormwater control functions and to share network data.” J. Sustainable Water Built Environ. 8 (2): 02521005. https://doi.org/10.1061/JSWBAY.0000971.
Clary, J., A. Earles, M. Leisenring, and D. Pankani. 2018. “Recommended operation and maintenance activity and cost reporting parameters for stormwater best management practices database.” In Environmental and water resources institute. Alexandria, VA: The Water Research Foundation.
Connolly, T. M., and C. E. Beg. 2005. Database systems: A practical approach to design, implementation, and management. 4th ed. Boston: Pearson.
DelGrosso, Z. L., C. C. Hodges, and R. L. Dymond. 2019. “Identifying key factors for implementation and maintenance of green stormwater infrastructure.” J. Sustainable Water Built Environ. 5 (3): 05019002. https://doi.org/10.1061/JSWBAY.0000878.
De-Ville, S., M. Menon, and V. Stovin. 2018. “Temporal variations in the potential hydrological performance of extensive green roof systems.” J. Hydrol. 558 (Jan): 564–578. https://doi.org/10.1016/j.jhydrol.2018.01.055.
Dickhaut, W., and M. Richter. 2020. “Decentralized stormwater management: Experiences with various measures in Germany.” In Water-related urbanization and locality, 167–179. Berlin: Springer.
Hess, A., B. Wadzuk, and A. Welker. 2017. “Evapotranspiration in rain gardens using weighing lysimeters.” J. Irrig. Drain. Eng. 143 (6): 04017004. https://doi.org/10.1061/(ASCE)IR.1943-4774.0001157.
Homet, K., P. Kremer, V. Smith, R. Ampomah, and S. Strader. 2022. “Mapping predicted areas of common maintenance impacts to green stormwater infrastructure in Philadelphia, Pennsylvania.” J. Sustainable Water Built Environ. 8 (3): 05022003. https://doi.org/10.1061/JSWBAY.0000986.
Horsburgh, J. S., et al. 2016. “Observations data model 2: A community information model for spatially discrete Earth observations.” Environ. Modell. Software 79 (Jan): 55–74. https://doi.org/10.1016/j.envsoft.2016.01.010.
Horsburgh, J. S., D. G. Tarboton, D. R. Maent, and I. Zaslavsky. 2008. “A relational model for environmental and water resources data.” Water Resour. Res. 44 (5): 6392. https://doi.org/10.1029/2007WR006392.
Hou, X., L. Qin, X. Xue, S. Xu, Y. Yang, X. Liu, and M. Li. 2021. “A city-scale fully controlled system for stormwater management: Consideration of flooding, non-point source pollution and sewer overflow pollution.” J. Hydrol. 603 (21): 127155. https://doi.org/10.1016/j.jhydrol.2021.127155.
Houle, J. J., R. M. Roseen, T. P. Ballestero, T. A. Puls, and J. Sherrard. 2013. “Comparison of maintenance cost, labor demands, and system performance for LID and conventional stormwater management.” J. Environ. Eng. 139 (7): 932–938. https://doi.org/10.1061/(ASCE)EE.1943-7870.0000698.
Kumar, P., M. Folk, M. Markus, and J. C. Alameda. 2005. Hydroinformatics: Data integrative approaches in computation, analysis, and modeling. Boca Raton, FL: CRC Press.
Lee, L., and D. Helsel. 2005. “Statistical analysis of water-quality data containing multiple detection limits: S-language software for regression on order statistics.” Comput. Geosci. 31 (10): 1241–1248. https://doi.org/10.1016/j.cageo.2005.03.012.
Los Angeles County Flood District. 2009. Safe, clean water program feasibility study guidelines. Los Angeles: Los Angeles County Flood District.
Maidment, D. R. 2008. “Bringing water data together.” J. Water Resour. Plann. Manage. 134 (2): 95–96. https://doi.org/10.1061/(ASCE)0733-9496(2008)134:2(95).
McGauley, M. 2021. VCRWS/SIDM: Cenado (Version v1.0). Ann Arbor, MI: Proquest.
National LID Clearinghouse. 2021. “LID National Clearinghouse.” Accessed June 1, 2022. https://www.lid-stormwater.net/clearinghouse/index.html.
NRC (National Research Council. 2009. Urban stormwater management in the United States. Washington, DC: National Academies Press.
Parr, T. B., N. J. Smucker, C. N. Bentsen, and M. W. Neale. 2016. “Potential roles of past, present, and future urbanization characteristics in producing varied stream responses.” Freshwater Sci. 35 (1): 436–443. https://doi.org/10.1086/685030.
Rettig, A. J., S. Khanna, D. Heintzelman, and R. A. Beck. 2014. “An open source software approach to geospatial sensor network standardization for urban runoff.” Comput. Environ. Urban Syst. 48 (4): 28–34. https://doi.org/10.1016/j.compenvurbsys.2014.05.003.
Roy, A. H., S. J. Wenger, T. D. Fletcher, C. J. Walsh, A. R. Ladson, W. D. Shuster, H. W. Thurston, and R. R. Brown. 2008. “Impediments and solutions to sustainable, watershed-scale urban stormwater management: Lessons from Australia and the United States.” Environ. Manage. 42 (2): 344–359. https://doi.org/10.1007/s00267-008-9119-1.
Sharior, S., W. McDonald, and A. J. Parolari. 2019. “Improved reliability of stormwater detention basin performance through water quality data-informed real-time control.” J. Hydrol. 573 (4): 422–431. https://doi.org/10.1016/j.jhydrol.2019.03.012.
Stormwater Best Management Practices (BMP) Maintenance Task Committee (TC). 2019. Inspection and maintenance of stormwater control measures. Reston, VA: ASCE.
Storm Water Grant Program. 2019. “Proposition 1 storm water grant program guidelines—Amended for Round 2.” Accessed February 21, 2022. https://www.waterboards.ca.gov/water_issues/programs/grants_loans/swgp/prop1/docs/prop1_swgp_guidelines_final_october2019_rev01.pdf.
Taira, J., L. Riggs, K. Graeve, B. Smith, C. Hebson, L. Joyce, and G. Jackson. 2018. Leading landscape design practices for cost-effective roadside water management. Washington, DC: AASHTO.
Traver, R. G., and A. Ebrahimian. 2017. “Dynamic design of green stormwater infrastructure.” Front. Environ. Sci. Eng. 11 (4): 15. https://doi.org/10.1007/s11783-017-0973-z.
Vogel, J. R., T. L. Moore, R. R. Coffman, S. N. Rodie, S. L. Hutchinson, K. R. McDonough, A. J. McLemore, and J. T. McMaine. 2015. “Critical review of technical questions facing low impact development and green infrastructure: A perspective from the Great Plains.” Water Environ. Res. 87 (9): 849–862. https://doi.org/10.2175/106143015X14362865226392.
Wadzuk, B., B. Gile, V. Smith, A. Ebrahimian, and R. Traver. 2021a. “Call for a dynamic approach to GSI maintenance.” J. Sustainable Water Built Environ. 7 (2): 02521001. https://doi.org/10.1061/JSWBAY.0000945.
Wadzuk, B., B. Gile, V. Smith, A. Ebrahimian, and R. Traver. 2021b. “Forthcoming. Moving towards dynamic and data-driven GSI maintenance.” J. Sustainable Water Built Environ. 7 (4): 02521003. https://doi.org/10.1061/JSWBAY.0000958.
WEF and ASCE-EWRI (Water Environment Federation and American Society of Civil Engineers-Enviornmental & Water Resources Insitute). 2012. Design of urban stormwater controls, MOP 23. New York: McGraw-Hill Professional.
Wilkinson, M. D., et al. 2016. “The FAIR guiding principles for scientific data management and stewardship.” Sci. Data 3 (1): 160018. https://doi.org/10.1038/sdata.2016.18.
Information & Authors
Information
Published In

Journal of Sustainable Water in the Built Environment
Volume 9 • Issue 1 • February 2023
Copyright
This work is made available under the terms of the Creative Commons Attribution 4.0 International license, https://creativecommons.org/licenses/by/4.0/.
History
Received: Jun 7, 2022
Accepted: Sep 10, 2022
Published online: Nov 28, 2022
Published in print: Feb 1, 2023
Discussion open until: Apr 28, 2023
ASCE Technical Topics:
- Business management
- Data analysis
- Decision making
- Engineering fundamentals
- Environmental engineering
- Government
- Hydrologic data
- Hydrologic engineering
- Hydrologic models
- Hydrology
- Information management
- Infrastructure
- Local government
- Methodology (by type)
- Models (by type)
- Organizations
- Practice and Profession
- Research methods (by type)
- Stormwater management
- Water and water resources
- Water treatment
Authors
Metrics & Citations
Metrics
Citations
Download citation
If you have the appropriate software installed, you can download article citation data to the citation manager of your choice. Simply select your manager software from the list below and click Download.
Cited by
- Andrea Welker, Sara Baghalian, Megan Farnsworth, Robert Traver, Quantitative Analysis of the Water Budget of a Rain Garden in Pennsylvania, Journal of Sustainable Water in the Built Environment, 10.1061/JSWBAY.SWENG-545, 10, 2, (2024).
- Ruochen Dong, Jacob D. Nelson, Savannah L. Cummins, Jonathan L. Goodall, Tracking the Cost of Maintaining Stormwater Best-Management Practice Facilities: The Role of Database Design and Data Entry Best Practices, Journal of Sustainable Water in the Built Environment, 10.1061/JSWBAY.SWENG-506, 10, 1, (2024).