Performance of Hurricane-Resistant Housing during the 2022 Arabi, Louisiana, Tornado
Publication: Journal of Structural Engineering
Volume 150, Issue 5
Abstract
Mitigating tornado damage remains a critical challenge for communities throughout much of the United States. Enhanced construction techniques typically used in hurricane-prone regions are often recommended as at least part of the solution, but the effectiveness of these techniques lacks empirical evaluation. This study investigates the performance of modern wood-frame residential structures in Arabi, LA, constructed to hurricane-resistant standards, that were impacted by a strong tornado on March 22, 2022. Field teams deployed beginning March 25, 2022, just three days after the tornado touched down, capturing perishable data on the building performance using vehicle-mounted surface-level panoramic cameras, forensic engineering investigations, and unmanned aerial systems. This paper describes the field deployments and identifies common failure mechanisms observed by the field teams. Analytical fragility functions are developed based on the load path observations and compared to empirical fragility functions generated from linking the building performance observations with wind speed estimates at each building derived from a parametric wind field model conditioned to tree-fall patterns. The study finds that despite the frequent use of hurricane-resistant hardware, such as hurricane straps and anchor bolts, key weak links elsewhere in the load path compromised the resistance and led to premature failures. The agreement between the empirically- and analytically-derived fragility functions was lacking, demonstrating the challenges that remain in understanding near-surface tornado wind loading and structural response. Nonetheless, the study provides a consensus framework for future tornado assessments that can help improve our understanding of tornado loading through the utilization of reconnaissance data. Further, the study findings on deficiencies in the load paths of homes in hurricane-prone regions have practical value to risk assessments and future construction practices.
Introduction
Tornadoes are currently ignored in the design of typical buildings [i.e., considered Risk Category II buildings per ASCE 7 (ASCE 2022)], including residential structures, throughout the United States. One exception is Moore, OK, where local officials have enhanced the building code in direct response to previous tornado impacts (Ramseyer et al. 2016; Simmons et al. 2015). This leaves much of the US building stock highly vulnerable to tornadoes. For example, an EF-2 tornado has maximum wind speeds of up to (135 mph) according to the enhanced Fujita scale (McDonald et al. 2012). A tornado of this magnitude produces wind loads as much as 38% greater (based on the square of the velocity ratio) than design wind loads for typical buildings in nonhurricane-prone regions, where the basic wind speed is around (115 mph) or less (ASCE 2017).
Between 1993 and 2022, an average of 1,225 tornadoes have struck the United States each year (NOAA 2023), approximately 20% of which are rated EF-2 or higher (Fan and Pang 2019), and nearly all occur east of the continental divide. Due to their smaller footprints relative to hurricanes and other synoptic wind storms, the annual probability of a tornado striking a given point in the United States, even in the more tornado-prone regions, is relatively low (approximately 5E-4 annual probability, or 2,000-year mean reoccurrence interval for a relatively tornado-prone region such as Birmingham, AL (Stoner and Pang 2021). However, despite the low point probability, tornadoes cause 77 direct fatalities and billions in economic losses on average each year, with impacts likely to grow due to both changes in exposure and hazard (Ashley and Strader 2016). Continuing to ignore tornadoes, and the impacts they cause, in our building codes is a failure of policy (Prevatt et al. 2012).
Recognizing this policy failure, and the impacts on fatalities, injuries, as well as economic losses, there have been many studies highlighting the need for enhancing the resistant capacity of building structures (Honerkamp et al. 2022; Masoomi et al. 2018; Prevatt et al. 2012; Standohar-Alfano and van de Lindt 2016) and the benefits of enhanced construction (Ghosh et al. 2023; Liang 2001; Sandink et al. 2019; Simmons et al. 2015; Sutter et al. 2009) for mitigating tornado impacts. Many of these studies focus specifically on light wood-frame construction, as it comprises over 90% of the housing market and was valued at $33.3 trillion in 2018 (Adhikari et al. 2020). Wind damage mitigation studies frequently tie the enhanced construction to specific elements of the structural load path, notably the use of hurricane straps instead of toe-nails in the roof-to-wall connections, and the use of anchor bolts with nuts and washers instead of concrete cut nails or other weak anchorage options at the wall-to-foundation connection. It is implied by these studies that making some simple changes in the design of connections would significantly improve the resistance of wood-frame buildings to tornadoes. These studies are complemented by recent experimental and numerical studies on fundamental tornado-structure interaction. Laboratory tornado simulators have greatly advanced our knowledge of tornado structure and interaction with individual buildings (Ashrafi 2021; Bezabeh et al. 2018; Chen et al. 2023; Haan et al. 2010; Sabareesh et al. 2019; Wang et al. 2020), including the effects of building geometry (Case et al. 2014; Razavi and Sarkar 2021) and presence of openings (Chen et al. 2022; Jaffe and Kopp 2021; Wang et al. 2020). The data from these simulators are being used to investigate differences in wind loads induced by tornadoes and straightline winds (Kopp and Wu 2020; Roueche et al. 2020) and develop new codes and standard provisions for tornado-induced loading (Narancio et al. 2023; Wang and Cao 2021). Numerical simulations of tornadoes have also advanced tremendously in recent years, including the use of large eddy simulation to simulate the interaction of tornadoes with both individual buildings (Honerkamp et al. 2022; Liu et al. 2021; Verma et al. 2022) and clusters of buildings (Kawaguchi et al. 2020) to better understand the structural loads that must be resisted.
Despite these advancements in our understanding of tornado-induced wind loads and structural response, there is still a lack of empirical evidence to demonstrate that simple changes to building construction will enhance the structural performance of buildings under tornado hazards. The International Code Council International Residential Code (IRC) has effectively required roof-to-wall connections beyond toe-nails since 2015 by including rafter/truss uplift connection force tables, which provide required uplift forces dependent on roof slope, roof span, wind exposure, and truss/rafter spacing. Reconnaissance reports have noted hurricane straps (or equivalent) and anchor bolts in recent construction in noncoastal regions after tornadoes (Pilkington et al. 2021; Wood et al. 2020), confirming the code impact at the local level. However, discerning whether these enhanced construction indicators actually improve performance is challenging because wind speeds in tornadoes are estimated based on the damage they cause (Mehta 2013) and not based on direct near-surface wind field measurement. Thus, there is a circular reference involved in estimating tornado wind speed intensity based on damage to enhanced construction unless sufficient independent wind intensity indicators are used (e.g., Lombardo et al. 2015). Furthermore, empirical evidence from field studies (Marshall 2002; Wood et al. 2020) suggests that enhanced construction indicators (e.g., hurricane straps and anchor bolts) are not necessarily indicative of an enhanced, continuous load path, as other weak links along the load path can compromise the benefits of strengthened links elsewhere.
With such questions, there remains a need to document and evaluate the performance of enhanced structural load paths in wood-frame residential buildings under tornado-induced wind loads to elucidate the true benefits of the enhanced construction and subsequently calibrate and inform future analytical and numerical models.
The objective of this study is to contextualize the performance of hurricane-resistant housing subjected to a strong tornado with respect to key causal factors, including the regulatory environment, hazard conditions, and observed structural load path. This study will take Arabi, LA, a community in a hurricane-prone region that was struck by a strong tornado on March 22, 2022, as an illustrative demonstration/hindcast for the proposed method. The rest of the paper is organized as follows: First, a brief meteorological summary of the 2022 Arabi, LA, tornado is provided. Next, the historical and regulatory context related to construction in Arabi is summarized. This is followed by a description of the reconnaissance strategy and technologies utilized and a summary of the resulting data set. The next section summarizes the near-surface wind environment based on analysis of wind indicators. The typical structural load path observed in the homes that were investigated is next provided. Failure observations are next summarized, followed by a fragility analysis of a benchmark building representative of tornado-impacted residential structures in Arabi and illustrating the impact of various construction alternatives on system performance. Finally, the paper concludes with a summary discussion and conclusions.
Summary of the EF-3 Arabi, LA, Tornado
The Arabi, LA, tornado was part of a larger spring tornado outbreak across the Southeast United States that occurred over March 21–22, 2022 (Roueche et al. 2023). A total of 43 tornadoes were reported, including seven rated EF-2 and two EF-3 by the National Weather Service (NWS) using the enhanced Fujita scale (McDonald et al. 2012). The Arabi tornado touched down at 7:21 PM CDT, traveling a distance of 18.5 km (11.5 mi) across Jefferson, St. Bernard, and Orleans Parishes before lifting at 7:38 PM. The NWS survey teams found that most of the damage was concentrated within a relatively narrow path (300 m wide) through the community of Arabi (NOAA 2022) and estimated peak wind speeds to be (160 mph). Approximately 200 structures were damaged by the Arabi tornado, causing an estimated $30 million in economic losses, and tragically there were two reported fatalities, one direct and one indirect (NOAA 2022). The tornado primarily affected single-family homes.
Local Historical and Regulatory Context
The New Orleans area, including Arabi, has witnessed several hurricanes and tornadoes in the past two decades, summarized in Table 1. Most notably, Hurricane Katrina impacted the region in 2005 leading to widespread flooding and costing over $15 billion in direct economic losses to residential buildings in the New Orleans region (Link 2010). The entire area affected by the 2022 Arabi tornado was flooded with inundation depths up to 2.14 m (7 ft) (NOAA 2020), although wind speeds were well below design levels. Since Katrina in 2005, the New Orleans area, including Arabi, has been impacted by Hurricanes Isaac (2012), Zeta (2020), and Ida (2021), although in each case wind speeds were well below design, and flooding was minimal. As a result, damage from these storms was primarily confined to building envelope failures and power infrastructure failures.
In addition to the recent hurricane impacts, 11 tornadoes have also affected the New Orleans area in the past two decades, including the 2022 Arabi tornado. Notably, these include an EF-3 in February 2017, two EF-2 tornadoes in February 2007, an EF-2 in February 2006, and the EF-3 tornado that struck Arabi in March 2022 and is the focus of this paper.
Recognizing the significant threat presented by windstorms, the state of Louisiana has been proactive in adopting and maintaining regulatory practices, including building code adoptions, targeted toward natural hazard mitigation (IBHS 2021). The International Building Code (2000 version) was first adopted in 2004, but there were no statewide requirements for residential buildings. In the aftermath of Hurricane Katrina, in 2006, the statewide Louisiana State Uniform Construction Code (LSUCC) was adopted, and it required enforcement of the latest International Residential Code (IRC) for new construction and voluntary adoption of Appendix J for existing buildings. At the time of the tornado in 2022, LSUCC enforced the 2015 version of the IRC.
As per current and previous versions of IRC enforced by the LSUCC, Arabi has a 700-year mean reoccurrence interval basic wind speed of (145 mph), triggering the requirement for wind load design for residential structures based on the Wood Frame Construction Manual (AWC 2018), ICC 600 (ICC 2014, p. 600), or similar, and precludes the use of the prescriptive provisions of the IRC. In essence, residential structures built according to the IRC in Arabi could be considered engineered structures. In addition to these design requirements, St. Bernard Parish, where Arabi is located, has also enforced additional requirements to prevent flooding of residential buildings, such as requiring that the lowest floor of residential buildings be above the base flood elevation. In the most recent version of the building code, this requirement has changed to a minimum of 0.46 m (18 in.) above the base flood elevation. This requirement results in elevated buildings supported on foundations akin to pier and beam systems. However, elevating building foundations may alter wind loads on buildings, which is not well understood at present. Furthermore, since the elevation requirement is primarily focused on flood hazard mitigation, the elevated foundations are not required to resist uplift caused by wind loads (except in special flood zones). The presence of wind and flood hazards results in competing design requirements (Hughes et al. 2022; Kameshwar and Padgett 2014; Padgett and Kameshwar 2016). Elevating buildings is beneficial for preventing flood damage; however, it may have detrimental effects on the wind performance of buildings, especially without sufficient anchoring of the foundation to resist wind-induced uplift and drag forces.
Reconnaissance Strategy and Methods
Posttornado reconnaissance activities were performed on March 25–29, 2022, by researchers from six universities. The response was coordinated by the structural extreme events reconnaissance (StEER) network (Kijewski-Correa et al. 2021). The response strategy focused on deploying rapid imaging technologies to capture the entirety of the tornado path from aerial and terrestrial perspectives, conducting rapid on-site assessments of structural performance, conducting forensic load path assessments of potential case study buildings, and characterizing the near-surface wind field through documentation of wind indicators. Table 2 summarizes the teams and members involved in data collection.
| Team ID | Team members | Activities | Dates deployed |
|---|---|---|---|
| FAST1 | Mariantonieta Gutierrez Soto (Penn State University), Alejandro Palacio-Betancur (Penn State University), and Garett Demaree (University of Kentucky) | Surface-level panoramas, rapid assessments, and forensic load path assessments | March 25–26, 2022 |
| Team 2 | Trung Do (University of Louisiana at Lafayette), Sabarethinam Kameshwar (Louisiana State University), and Guillermo Escoto Rodriguez (University of Louisiana at Lafayette) | Forensic load path assessments | March 28–29, 2022 |
| Team 3 | David Roueche (Auburn University), Jordan Nakayama (Auburn University), and Amir Safiey (Auburn University) | Forensic load path assessments | March 28–29, 2022 |
| Team 4 | Frank Lombardo (University of Illinois at Urbana-Champaign) and Guangzhou Chen (University of Illinois at Urbana-Champaign) | Wind field characterization and wind speed estimation | March 28–29, 2022 |
Surface Level Panoramas
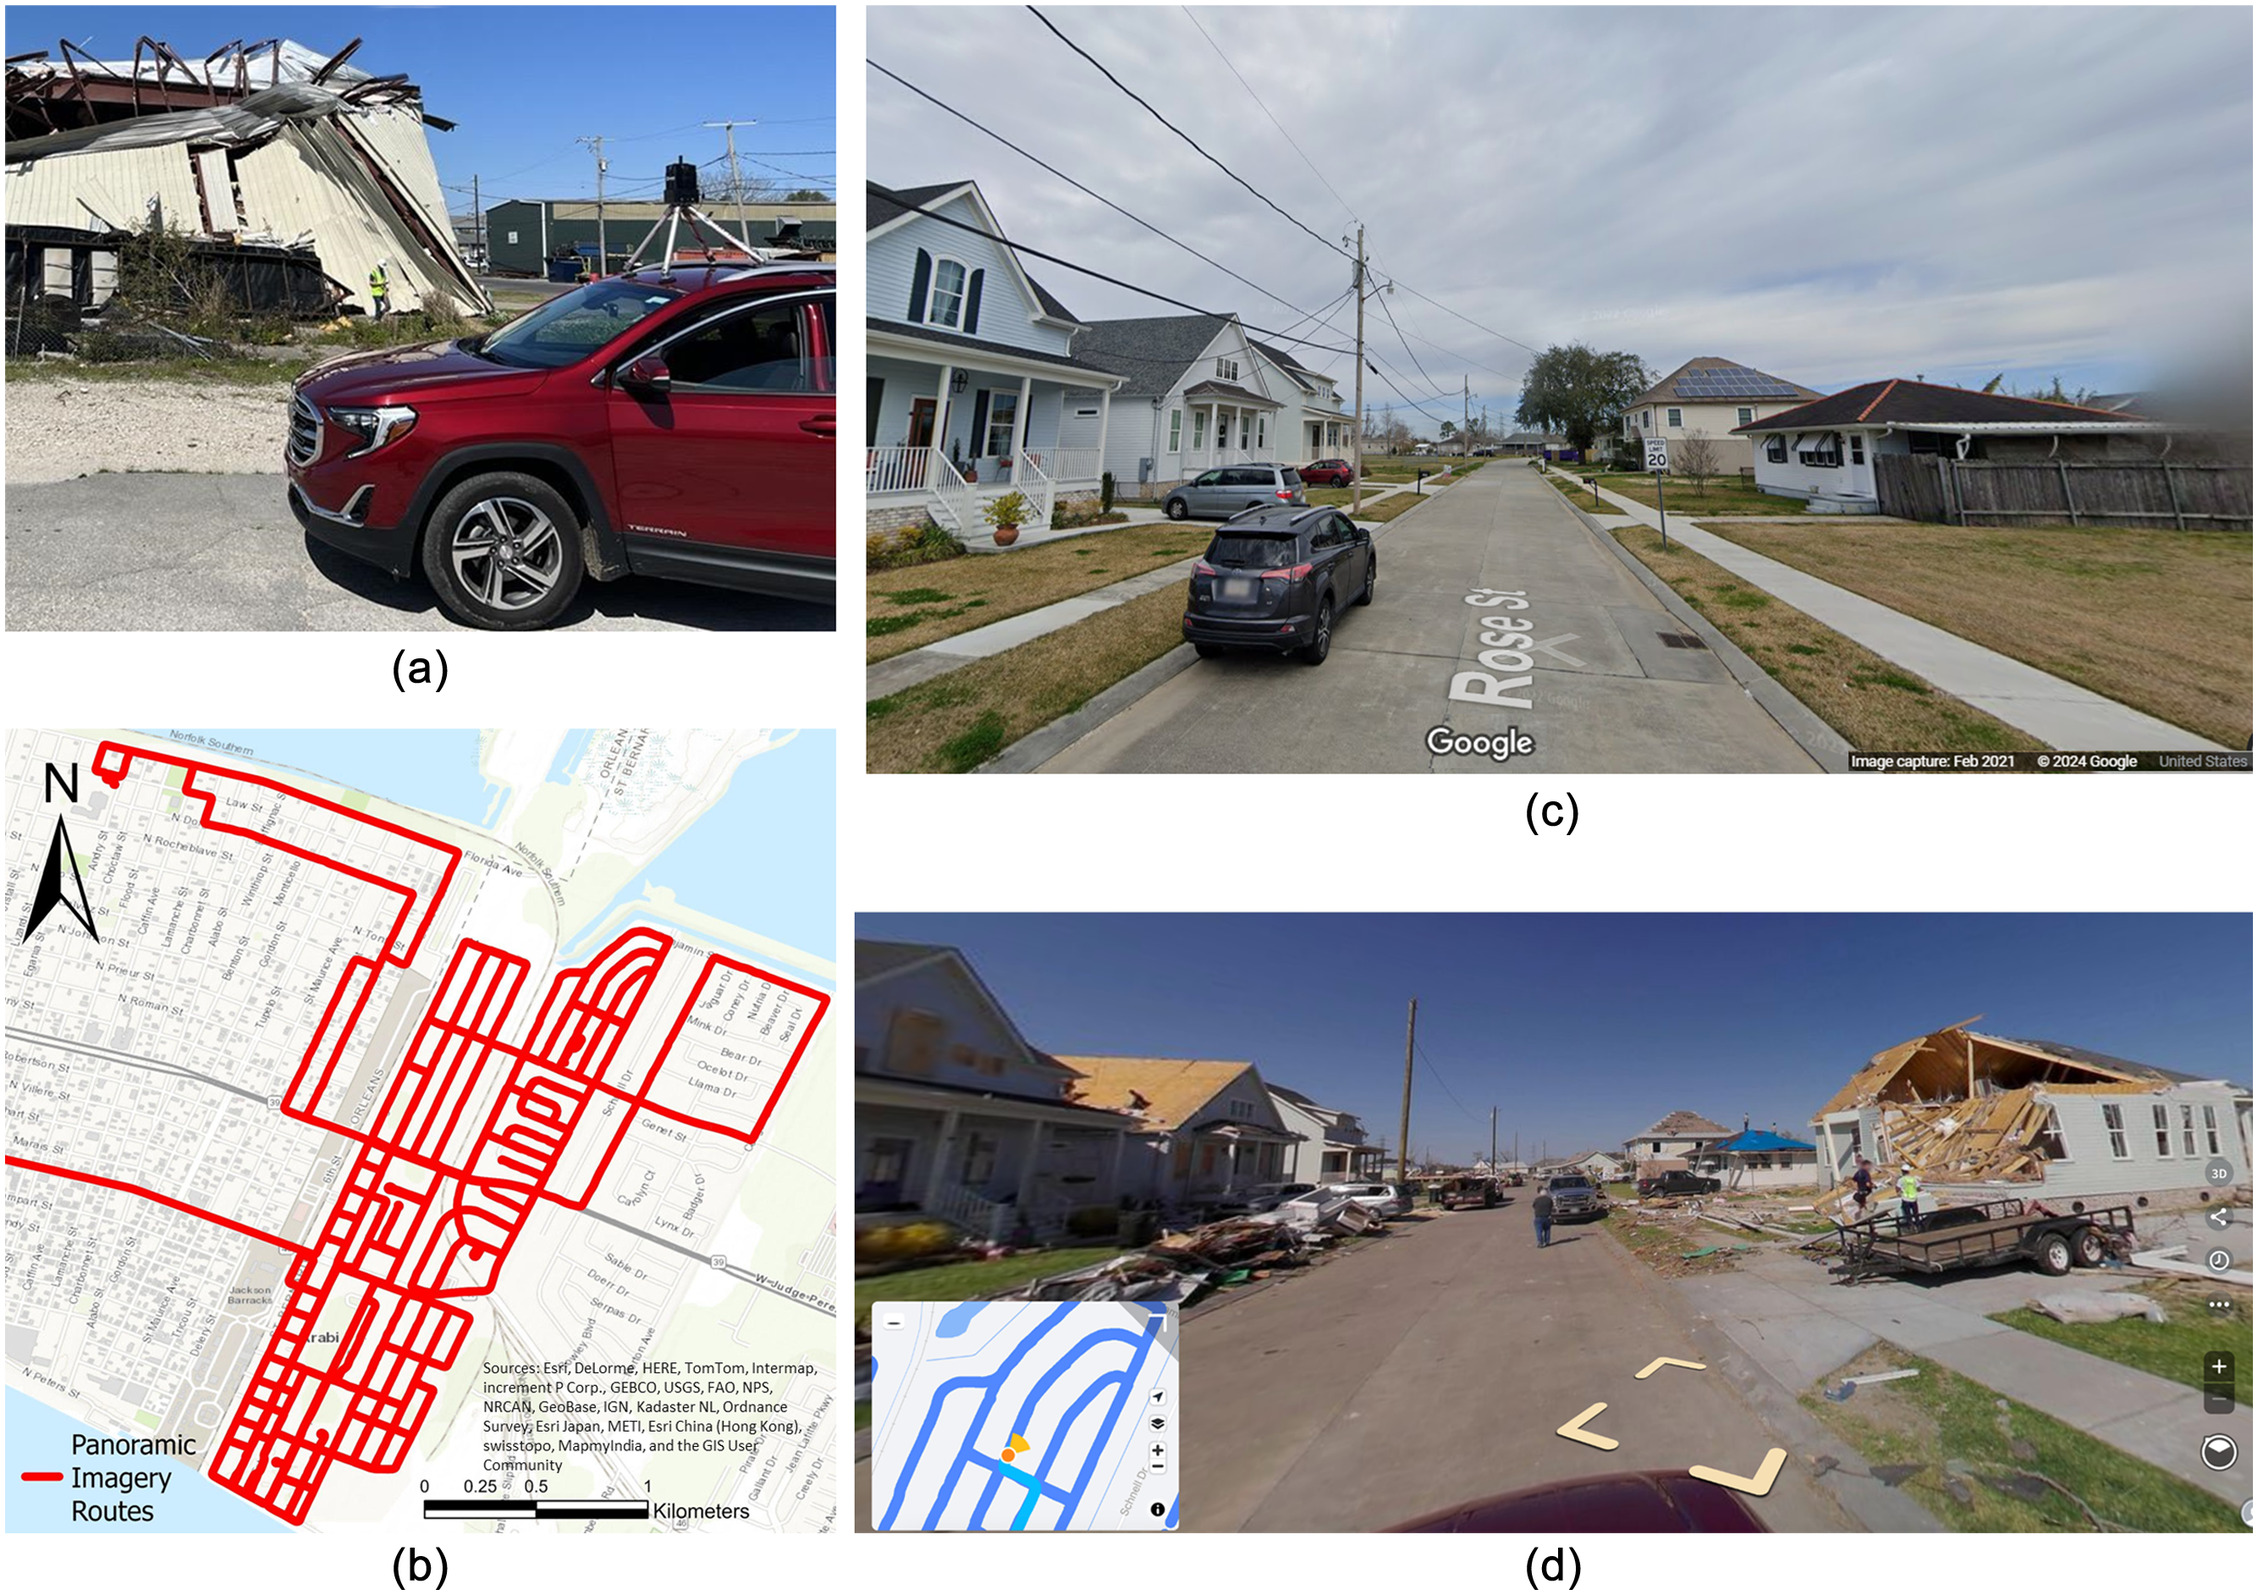
A vehicle-mounted camera (NCTech iStar Pulsar) was used to rapidly capture surface-level panoramas (SLP) of the tornado path through Arabi. The camera produced 11,000 by 5,500-pixel panoramas covering a field of view. Each image was georeferenced using a U-BLOX Neo M8N GPS module built into the camera. The coverage of the SLP is shown in Fig. 1, representing a total distance of 79.4 km with a typical image spacing of 4 m. A representative area (not shown) south of the Mississippi River in Algiers, LA, was also collected, but only minor wind damage was observed. After processing, the imagery was uploaded to the Mapillary platform for public dissemination and the DesignSafe data repository (Pinelli et al. 2020) for long-term archival.
Performance Assessments
Performance assessments consisted of both rapid assessments and forensic load path assessments. Rapid assessments were used to capture ground-based images of each building’s elevation and any structural details that were readily available. Forensic load path assessments captured the same information as in the rapid assessments but included much more detailed information on the structural load path, including size and spacing of structural members, wood species of structural wood members, fastener lengths, diameters, and spacing. In many cases, team members were given access by homeowners to the interior of damaged and undamaged homes to conduct a more thorough inspection. Photographs and forensic details were collected using the Fulcrum data collection platform (Spatial Networks 2022), which facilitated the acquisition of geotagged photos, recorded audio, and other relevant metadata from surveyors’ mobile devices in combination with a standard survey form for text, single-choice and multichoice inputs. A total of 210 building performance assessments were conducted. Fig. 2 provides an overview of the assessments completed along the path of the tornado with different levels of severity as defined according to the StEER performance rating system (Kijewski-Correa et al. 2021), which is adapted from Vickery et al. (2006). The performance rating criteria are provided in Table 3.

| Damage statea | Short description | Presence of extent of failure in: | Fascia and/or soffit | ||||
|---|---|---|---|---|---|---|---|
| Roof or wall cover | Window or door | Roof or wall substrate | Roof structure | Wall structureb | |||
| 0 No damage | No visible exterior damage | 0% | No | No | No | No | No |
| 1 Minor damage | Damage confined to the envelope | and | 1 | No | No | No | |
| 2 Moderate damage | Load path is preserved, but significant repairs required | and | and the larger of 3 and 20% | 1 to 3 panels | No | No | |
| 3 Severe damage | Major impacts to the structural load path | the larger of 3 and 20% and | and | No | — | ||
| 4 Destroyed | Total loss. Structural load path compromised beyond repair | Yes | — | ||||
a
A building is considered to be in the damage state if any of the bolded damage criteria in the corresponding row are met.
b
Wall structure refers to the walls in the living area only. The ground floor of elevated structures often has breakaway walls that can be easily damaged by storm surges. This damage should be ignored in assigning the overall damage rating.
Unmanned Aerial Systems
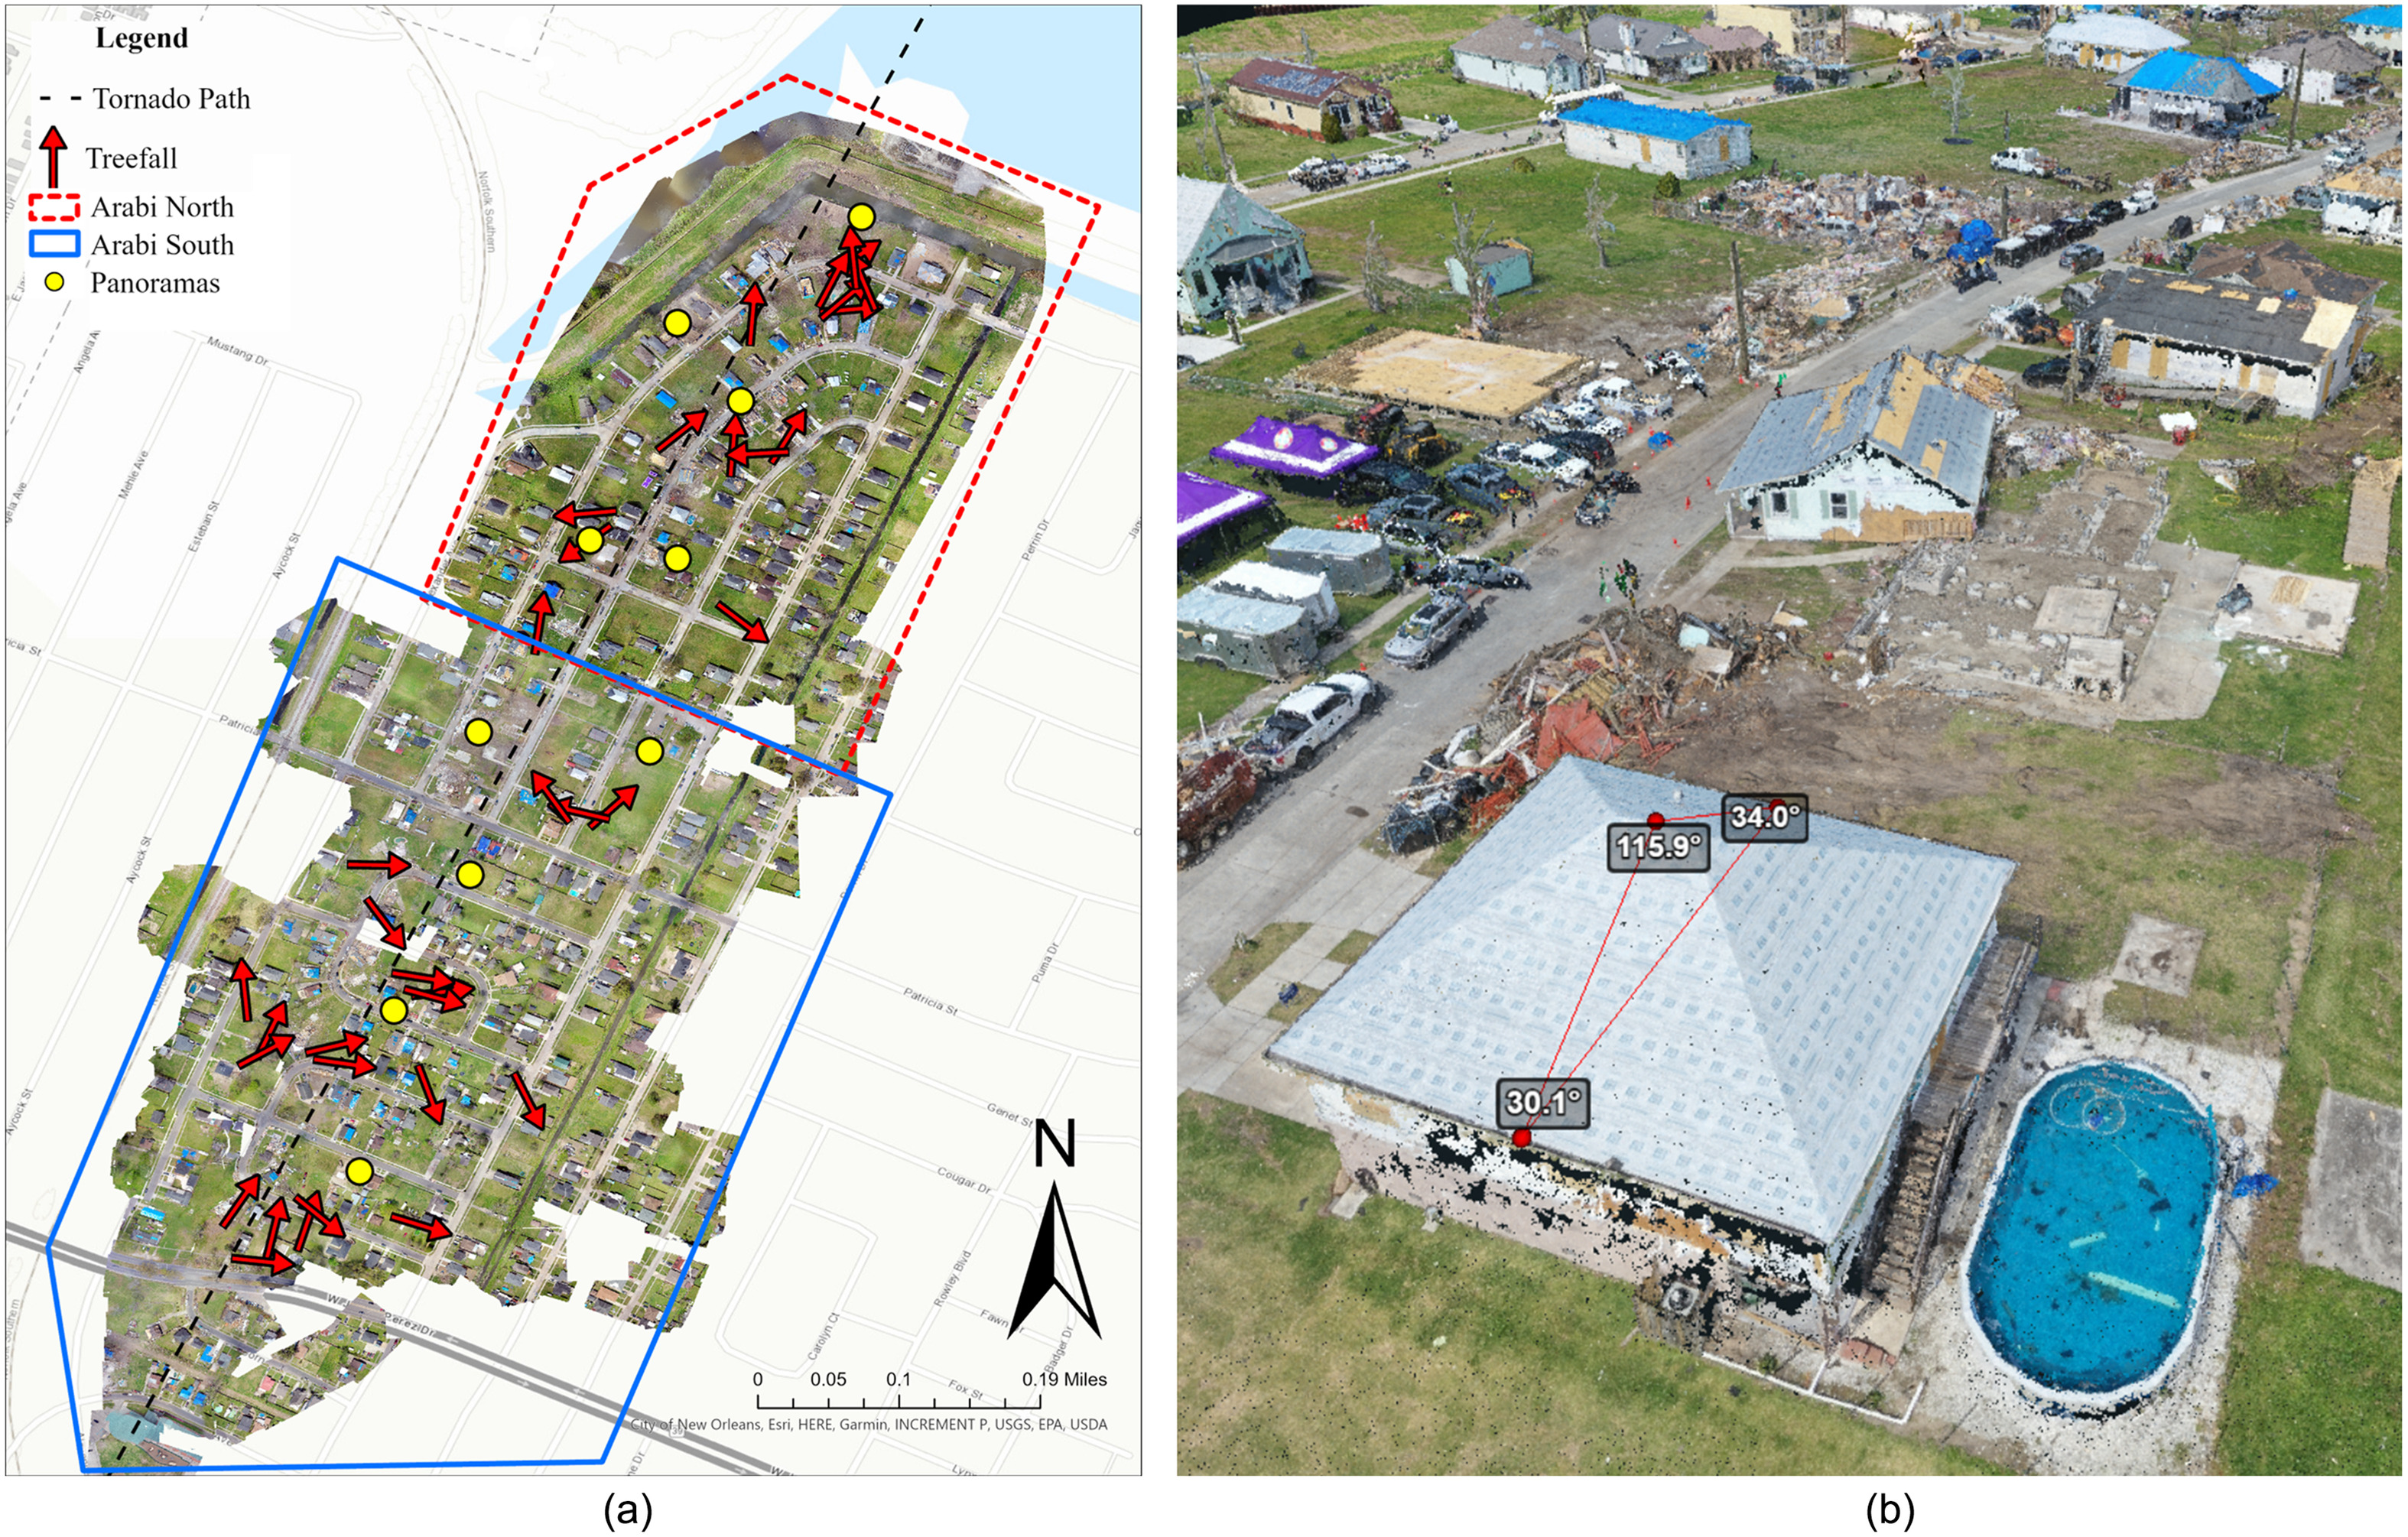
UAS was used to document approximately half of the track through Arabi, specifically north of Judge Perez Drive, where the heaviest damage was observed. The UAS coverage was split between the north (1,734 photographs) and south (1,321 photographs) sections (Fig. 3). Imagery was captured with two DJI Mavic Pro 2 at altitudes of 45 and 50 m, respectively. Panoramas () were also captured throughout the impacted area (Fig. 3). The high-resolution photographs captured by the UAS were suitable for the generation of orthomosaics in both the North and South sections with ground sample distances of 1.28 and 1.16 cm, respectively. The higher density of photographs in the North Arabi section, taken in a double-grid flight pattern, was also sufficient for the generation of a 3D point cloud using structure from motion techniques (Gomez and Purdie 2016). The resulting point cloud was published to the DesignSafe platform (Pinelli et al. 2020) and made accessible through a web browser using the Potree WebGL-based point cloud viewer. All raw and processed data are housed on the DesignSafe Data Depot.
Data Enhancement and Quality Control
After the field reconnaissance was completed, a team of data librarians consisting of trained undergraduate students from Auburn University performed the Data Enhancement and Quality Control protocols (Kijewski-Correa et al. 2021) to build out and standardize the data set of building performance assessments. Tasks included defining component-level damage ratios, building attributes such as year built, roof slope, roof shape, mean roof height, number of stories, first-floor elevation, and building construction details such as roof cover type, wall cladding type, and foundation type. The data librarians also merged duplicate assessments, ensured all assessments were precisely geolocated, and extracted building footprints for each performance assessment. Finally, using aerial imagery and surface-level panoramic imagery, the data librarians confirmed approximately 100 buildings with no damage along the edges of the tornado path to help condition the empirical fragility functions described later in this article. The data librarians sourced data from the photographs and field notes taken by the reconnaissance teams, the surface-level panoramas, and the point clouds processed from the UAS images, as well as online sources such as realtor sites and Google Earth (for historical aerial imagery). Flyover videos using UAS and posted to social media sites, typically captured by storm chasers within 12 h after the tornado, were also of assistance in determining the true posttornado condition of the buildings prior to any clean-up or repairs. The Microsoft Building Footprints data set (Microsoft 2023) was used as a base for collecting building footprints for each assessment.
The final data set contains 210 individual performance assessments, each containing up to 100 unique fields of information defining the performance, building attributes, structural details, and reconnaissance metadata. The full list of fields is available in Gutierrez Soto et al. (2023).
Near-Surface Wind Environment
Direct measurement of the near-surface wind environment of tornadoes remains a considerable challenge due to the infrequent occurrence of a tornado for any single location and the short duration and extreme intensity of tornadoes coupled with the sparsity of near-surface measurement instrumentation. Existing networks of near-surface wind measurements, such as the various mesonets (e.g., Brock et al. 1995; Schroeder et al. 2005), are not nearly dense enough to regularly sample tornadoes, and even when they are impacted, they are often damaged by the tornado (Roueche et al. 2019), although a few reliable measurements exist (Lombardo 2018). Fixed radar, including the WSR-88D network (Heiss et al. 1990), has broader coverage, but even at the lowest beam elevations (e.g., 0.5°), the beam heights are typically sampling tornadoes a kilometer or higher above the surface, and there is insufficient knowledge at present to reliably bring these wind speeds down to surface levels through modeling. Mobile radar units have been effective at sampling lower elevations but are less effective in treed areas and areas with significant topography, and even in the more ideal settings of the US plains, relatively few high-quality data sets exist. In light of all these challenges, indirect methods such as the enhanced Fujita (EF) Scale (Edwards et al. 2013; McDonald et al. 2012), which is damage-based, and directional patterns of wind indicators such as trees and signs (Chen and Lombardo 2019; Lombardo et al. 2015; Rhee and Lombardo 2018) are typically used for estimating tornado intensity, while direct measurements are rare. For the Arabi tornado, researchers conditioned a tornado wind field using directional patterns of felled trees to keep the estimates independent of the building damage, as no direct measurements were available. The nearest fixed radar (KLIX) was 40 km from the impacted areas, with the lowest beam height of 0.5 km (1,600 ft), and no automated surface observation station (ASOS) or other near-surface measurement stations were close to the tornado.
For the tree-fall method, the location and fall direction of 36 trees were recorded either on-site or using the orthomosaics generated from the photographs taken by the UAS. Most of the downed trees were in the southern half of the tornado path through Arabi. The Chen and Lombardo (2019) method was utilized to estimate wind speeds from tree-fall. A steady vortex model is assumed to move along the tornado path with a translation speed , meaning the model-generated tree-fall pattern on all transection lines is identical. In this way, the tree-fall patterns are condensed to a profile line defined by , which is the minimum distance from the location of the fallen tree to the tornado path, and , which is the angle of the fallen tree. For exploring the relationship between and , the modified Rankine vortex model is applied with various parameters (, ; ; ; ) for estimating the tree-fall transection profiles as shown (Chen and Lombardo 2019). The input parameters are defined as follows: is the ratio between the tree-fall critical speed to the vortex translational speed ; is the ratio between the maximum vortex rotational speed to the ; is the angle of the vortex rotational speed; is the maximum radius where the full rotational speed occurs, and is the modification parameter for Rankine Vortex profiles.
For each trial, one parameter combination is picked, and an estimated is generated for each input from the transection line. Then, the simulation error for this trial is the difference between the estimated and the practical distance obtained from the damage survey. The best-fit parameter combination with the minimum error is picked ( ; ; ; ) for the entire region. The peak wind speed was estimated through Eq. (1), based on the tree-fall model analysis, and for the whole area was approximately
(1)
Fig. 4 shows a cross section cut through the peak gust wind field. The maximum wind gust profile is skewed to the right, with the peak gust close to the radius to maximum wind speeds, because the best fit for was close to 90°, suggesting predominately tangential flow. With predominately tangential flow, the translational and maximum horizontal wind speeds align near the right radius to maximum winds.

Forensic Load Path Descriptions
Most structures impacted by the tornado were wood-frame, single-family residential buildings, and thus these structures also made up a majority of the performance assessments (192 out of 210). The structural load paths observed amongst these were consistent by era, broadly defined as pre-Katrina and post-Katrina, representing homes built prior to and after Hurricane Katrina (2005), respectively. The focus of this paper is on the post-Katrina homes due to their enhanced construction and relevance to tornado-resistant construction.
Influenced by the region being in a floodplain, and being in a hurricane-prone region with basic wind speeds of (145 mph), the post-Katrina homes had similar load paths (conceptually illustrated in Fig. 5), being constructed on elevated foundations, and utilizing steel straps to connect the roof to the walls and walls to the foundation. The homes were constructed atop concrete masonry piers anchored to continuous concrete footings [0.3 m (1 ft) wide by a depth that varied] by steel rebar extending from the footing into the cells of the masonry piers. The observed spacing of the piers varied between 1.2 m (4 ft) and 2.3 m (7.5 ft). A pressure-treated timber beam (14 cm by 14 cm) typically spanned across each masonry pier and was anchored to each pier using one 12.7-mm (0.5-in.) diameter A36 steel bolt embedded into a grouted cell of the masonry block pier, or in some cases by steel straps embedded into grouted cells of the masonry piers that wrapped over the beams and fastened with nails. (3.8 cm wide by 23.5 cm deep) or (3.8 cm wide by 28.6 cm deep) wood floor joists spanned across the timber beams, spaced 40.5 cm (16-in.) on center and connected to the timber beams by a galvanized steel hurricane strap (Simpson StrongTie H2.5A or equivalent). The plywood subfloor was nailed to the floor joists (exact nail size and spacing were not recorded). Light wood-frame stud walls were fastened to the subfloor with nails through the bottom plate into the subfloor and sometimes the floor joists underneath. Studs (typically ) were typically fastened to the bottom plate and the lower top plate by two nails (4 mm by 89 mm; 0.165 in. by 3.5 in.) into the end grain of the studs. The upper top plate was fastened to the lower top plate by nails at approximately 30 cm on the center, but the exact spacing varied. Engineered wood sheathing, usually 11.1 mm (0.44-in.) thick oriented strand board (OSB), was fastened to the exterior edge of the wall studs. In some cases, the OSB sheathing was continuous from the bottom of the rim joist to the upper top plate, but it was common for the OSB to only span from the lower of the top plates to the bottom edge of the bottom plate, with a separate sheathing panel covering the rim joist. The roof structure was either wood roof joists and rafters, or engineered wood trusses. When trusses were used, the individual truss members were observed to be . When roof joists and rafters were used, the size of the members varied according to the span, but they were typically or . The exact connection of the roof structure to the wall varied but typically consisted of a steel hurricane strap (either H2.5A or H8) in combination with three toe-nails. Both a hurricane strap and toe-nails are typically present in a connection because during construction, the toe-nails are used to initially set the roof framing member, and then the hurricane straps are installed at a later date. In rafter construction, the ridge was typically framed with a ridge board, with the rafters on one side end-nailed, and on the other side toe-nailed, to the ridge board. A collar tie was typically observed on every other rafter. Roof sheathing was either plywood or OSB panels [1.22 m by 2.43 m by 11.1 mm (4 ft by 8 ft by 0.44-in.) thick] and was nailed to the roof structure with a variety of fastener sizes and spacings. Ignoring some minor variations, the presented encompasses the majority of the load paths encountered in post-Katrina homes impacted by the tornado.

Failure Observations
Despite the use of anchor bolts and steel hurricane straps as described in the previous section (common indicators of wind-resistant construction) in both pre-Katrina and post-Katrina homes, failures were widespread throughout the tornado path regardless of the construction era.
Roof Sheathing
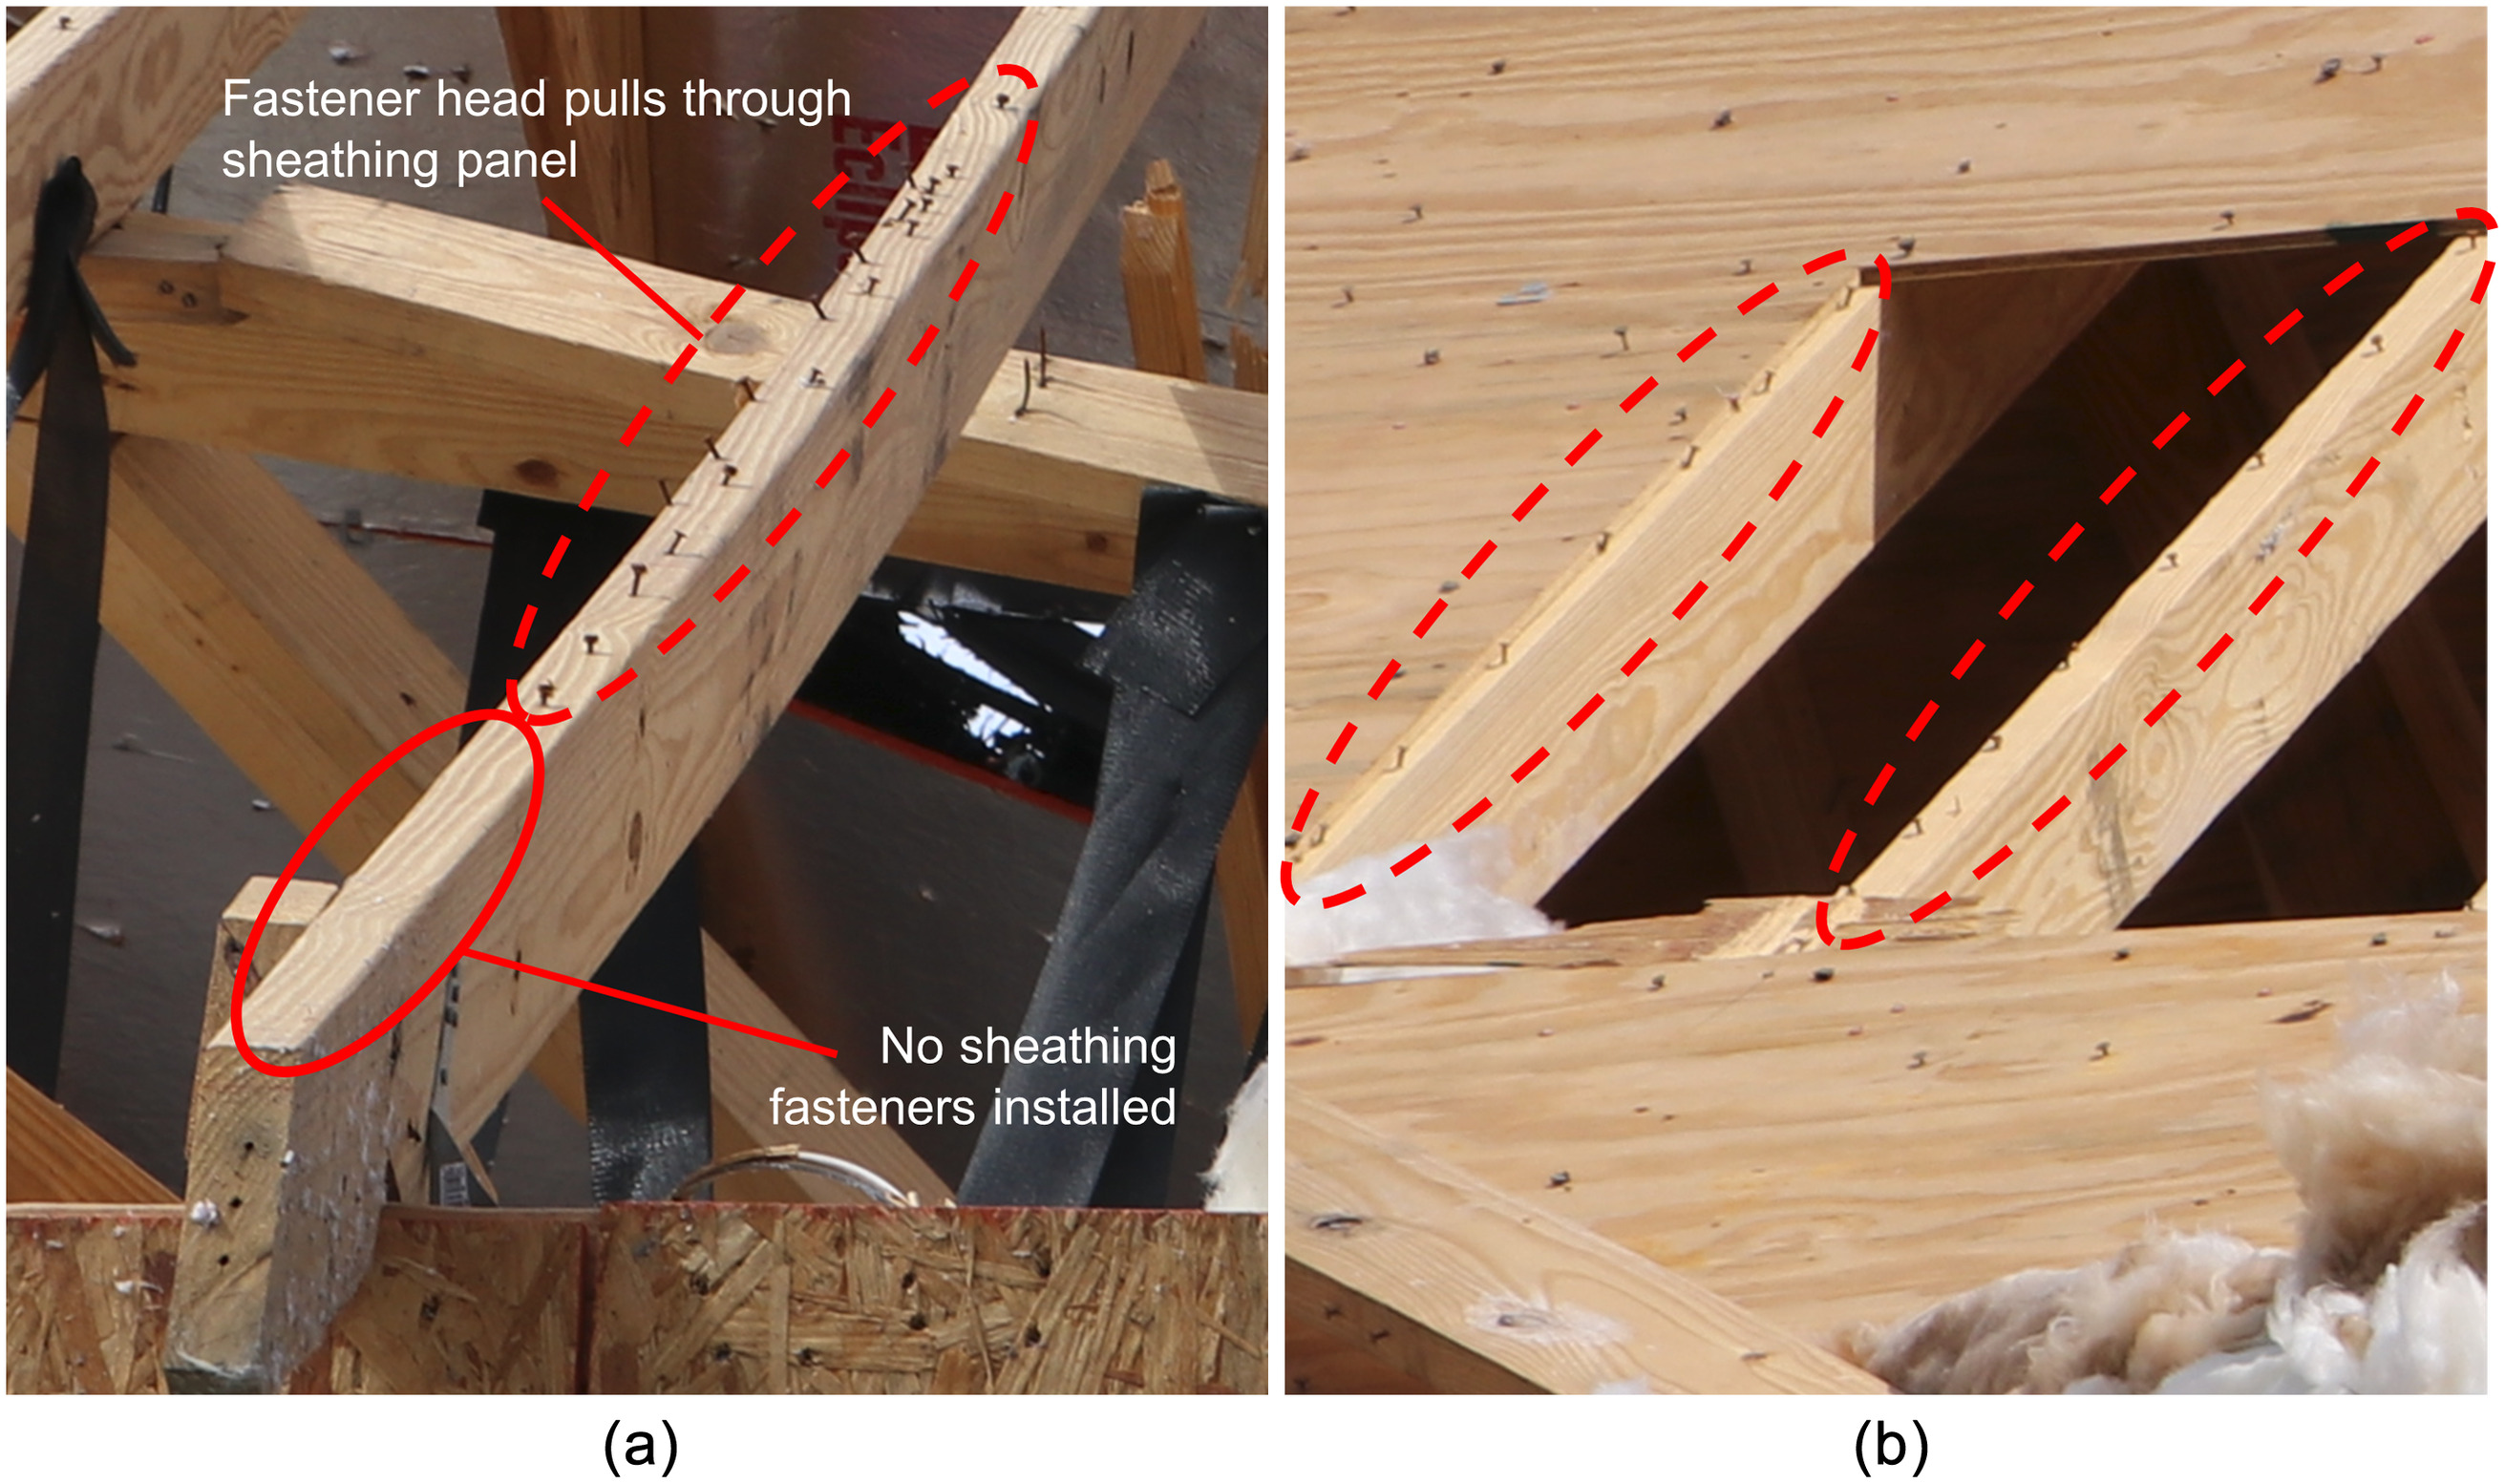
Roof sheathing failures were directly observed in 50 of the 192 homes (26%) investigated in which roof sheathing loss could be determined. Another 26 homes possibly experienced roof sheathing failures, but the damage was so extensive that the sheathing failure mechanism could not be directly observed. In several recently constructed homes (post-2020), it was noted that roof sheathing failures were predominantly driven by fastener head pull-through (Fig. 6). In several cases, these failure mechanisms were confirmed to be associated with ring-shank nails (2.87 mm shank diameter by 57 mm long), but it was not possible to confirm all cases. Fastener withdrawal from roof framing members was also observed but associated with smooth shank nails. The frequent head pull-through of the ring shank nails is not unexpected. Per the National Design Specifications (NDS), a ring shank nail with a 2.87 mm shank diameter and embedded 46 mm in a framing member with 0.5 specific gravity has a nominal withdrawal capacity of 1,362 N, while the nominal head pull-through capacity is 871 N for a nail head diameter of 6.3 mm. The nail withdrawal capacity is therefore expected to be 150% of the head pull-through capacity for the ring shank nails observed. This discrepancy can be made worse if the nails are overdriven, which was observed in both roof and wall sheathing. A larger-diameter head on the ring-shank nails, and the use of proper driving pressure, would better balance the withdrawal and pull-through resistances. As observed in the field, however, the roof sheathing capacity based on nail withdrawal was reduced by as much as 50% from the expected capacity due to the predominance of the fastener pull-through failure mechanism.
Other factors contributing to roof sheathing panel loss that were observed included missing nails in some sheathing panels [e.g., Fig. 6(a)], the use of staples (observed in a modular home), inconsistent fastener spacing, and fasteners that missed the framing members (referred to colloquially as shiners) and were not renailed.
Roof Structure
Roof structure failures of some kind were directly observed or inferred (from the complete destruction of the entire structure) in 51 of the 192 homes investigated (27%). While many of these failures were associated with failures of the roof-to-wall connections, failures of the wood members were also observed, indicating that in at least some cases, connections were sufficiently strong to enable the capacity of the wood framing members to be reached. A complete list of failure mechanisms observed included fracturing of roof framing members () with some or all roof-to-wall connections still intact, fastener withdrawal at the ridge board connection (), uplift failure of the hurricane strap [due to fastener withdrawal or shear failure at the strap to rafter interface ()], and separation of the upper top plate from the lower top plate (). These failure mechanisms are illustrated in Fig. 7. The roof-to-wall connection failures exemplify the link-within-a-link assembly of typical connections in light wood-frame structures. In other words, while roof-to-wall connections are typically treated as a single link in the vertical load path through the structure in traditional modeling studies (Ellingwood et al. 2004; Standohar-Alfano and van de Lindt 2016), in reality, they consist of an assembly of sub-connections and elements; some of which act compositely (in parallel), while others act in series, in combination forming the composite capacity of the connection. For example, the typical rafter-to-wall connection observed in Arabi consisted of an H2.5 or H8 strap acting in parallel with three toe-nails and in series with either the connection between the top plates or the exterior wall sheathing, depending on whether the exterior sheathing overlapped both top plates or not. The multiplicity of the connections within this connection likely contributes to the enhanced performance variability observed in the field relative to analytical studies (Maloney et al. 2018). Understanding the true failure mechanisms is also critical for proper education efforts. For example, the separation of the double top plates has been observed in other studies (Pilkington et al. 2021) and is typically associated with the use of H2.5 straps in combination with wall sheathing that does not overlap both top plates. In this configuration, the H2.5 fasteners only penetrate the upper of the top plates, while the exterior wall sheathing only overlaps the lower top plate, forcing the uplift forces to transfer through the fasteners connecting the top plates. These fasteners have weaker capacity than the sheathing overlap or the H2.5 as they resist pure withdrawal, and subsequently, this creates a structural fuse in the load path. A continuous load path could be achieved by overlapping the exterior wall sheathing with both top plates, or by using a metal strap that is long enough to extend to both top plates or to the vertical studs.

Diaphragm Failures
Only one failure was noted in the field investigation that appeared to be primarily diaphragm-related. This was a home that was under construction at the time of the tornado. All exterior and interior framing had been completed, and the home was dried in with exterior sheathing, roof shingles, windows, and doors, but no interior drywall had been installed. The home exhibited a soft-story collapse mode, with the roof structure (with most shingles still attached) still mostly within the original footprint of the building, but most exterior walls collapsed. No other obvious cases of diaphragm-related failures were observed throughout the tornado path.
Foundation Failures
Failure mechanisms were observed in the foundation and connections to and within it in 57 of the 192 homes investigated (30%). These failure mechanisms occurred at the connections of the bottom plate to the subfloor and (ideally) floor joists, between the floor joists and the sill plate (a timber post in most of the investigated homes), between the sill plate and the CMU piers, and between the CMU piers and the continuous footings. In nine of the 57 homes with foundation-related failures, the failure appeared to initiate at the foundation, suggesting the foundation was the weakest link in the load path. Another five homes were completely destroyed down to the foundation, but it was not possible to confirm whether the damage was progressive (roof to walls to the foundation) or if the foundation failed first in some way, compromising the superstructure above it. Of those with obvious failures at the foundation, specific failure mechanisms contributing to these damage states included lateral failure of all exterior walls at the bottom plate to subfloor interface, no continuous footing supporting the masonry piers (occurred in a remodeled building), failure of vertical and diagonal metal strap holdowns (observed in a modular home installed atop a slab-on-grade), lack of any positive anchorage between masonry piers and floor structure [observed in four homes constructed prior to Hurricane Katrina (2005)], and separation of the timber beams from the supporting masonry piers due to many missing fasteners in the connecting steel straps. Each of these failures could be attributed to pre-IRC construction (specifically, no positive anchorage at the foundation) or to unique circumstances such as being a modular home or having undergone substantial remodeling with apparently poor construction quality. In post-IRC homes, the foundation was generally not a source of failure, with only one exception [Figs. 8(a and b)] where poor construction practices were noted.

Outside of these foundation-specific failures, one of the prominent failure mechanisms was the failure of the wall structure at the bottom plate due to out-of-plane suction pressures acting on the wall surface (Fig. 9). The connection between the bottom plate and floor joists was observed to use (2) 12d nails (76 mm long by 3.25 mm diameter) spaced 0.3 m or 0.4 m apart depending on the floor joist spacing. In several homes, the weakness of this nailed connection was mitigated by continuously overlapping the wall sheathing across the exterior studs, bottom plate, and rim joist. However, in most cases, the sheathing was discontinuous across this joint, creating a structural fuse in the load path at this connection and contributing to premature failure.

Fragility Analysis
To illustrate the impact of various weak links in the structural load path on the overall system performance, a fragility analysis is performed for an illustrative benchmark building. The chosen benchmark building is a 9.1 m by 18.3 m single-story home with a hip roof and roof slope (30°), representing a typical home in the Arabi reconnaissance data set. The structural system is taken to be wood-frame, while other details of the structural load path are varied to represent the field observations. The fragility analysis considers two independent limit states, the first being the failure of a single roof sheathing panel, and the second being the failure of any connection within an idealized vertical load path other than roof sheathing. The failure limit state distribution is defined in Eq. (2) as follows:where = random variable representing the uplift wind load; = random variable representing the resistance of various load path elements; and = random variable representing the self-weight of the elements. The random variable for uplift wind load, , is expressed as a pressure for the roof sheathing analysis, or a force per unit length along the house perimeter for the remainder of the vertical structural load path. While lateral wind loads would contribute to uplift forces and member failures, particularly at the foundation level, their contribution is ignored in this study for simplicity and since the purpose is to provide relative comparisons between various load path options. Subsequently, the resulting fragility functions likely overestimate the true capacity.
(2)
In Eq. (2), W is obtained using the ASCE 7 provisions in two ways, once using the requirements of ASCE 7-16 (straight-line wind provisions that would have been applicable to the most recently constructed homes in Arabi, LA) (ASCE 2017) and a second time using the ASCE 7-22 tornado provisions (ASCE 2022). While the tornado provisions have not been adopted in Arabi and therefore do not apply to the homes affected by the tornado, they are used here as a best estimate of tornado-induced wind loads on a typical building. W can be defined then as follows:where = terrain and height adjustment factors; = directionality adjustment factor; = topographic factor; = elevation factor; = wind speed in (an independent variable in the fragility analysis); =tornado pressure coefficient adjustment factor; and and = external and internal pressure coefficients for components and cladding. The or Tor subscript found in many of these variables for indicate that these parameters have been modified in ASCE 7-22 from their original values based on straightline winds to account for tornado effects, including the atmospheric pressure deficit, nonmonotonic vertical velocity profile, and vertical wind component. For the sheathing failure limit state, the sheathing panel area was used to evaluate the taken from Chapter 30 Components and Cladding, while for the vertical load path analysis, the gust effect factor is a separate variable and is taken from Chapter 27 Main Wind Force Resisting System provisions of ASCE 7.
(3)
(4)
The details of G and R in Eq. (2) differ between the sheathing and vertical load path analysis frameworks. For the sheathing failure limit state, G is the gravity load contributed primarily by the weight of the roof covering (assumed to be asphalt shingles). The resistance R of the panel is taken from Datin et al. (2011), specifically utilizing the capacities for 8d common and 8d ring-shank nails at , , and spacing in a combined lognormal distribution to account for the variability encountered in the field reconnaissance. An alternative configuration is also considered in which the resistances from Datin et al. (2011) are adjusted to account for the overdriving of the fasteners as observed in the field using Eq. (5)where = adjusted sheathing resistance; and = unadjusted sheathing resistance from Datin et al. (2011); = overdrive factor, defined as , where is the thickness of the sheathing panel considering the overdriven fastener, and is the nominal thickness of the panel (taken to be 11.1 mm). is defined as a normally distributed random variable with a mean of 0.85 and a COV of 0.2, truncated within the range of [0.7 1.0]. The sheathing fastener configurations considered are summarized in Table 4. Roof sheathing fragilities are developed via Monte Carlo simulation at different levels of the wind gust velocity (V) as an intensity measure. Failure of any panel constitutes the failure of the roof.
(5)
| Configuration ID | Fasteners | Overdriven nails |
|---|---|---|
| C-0 | 8d common nails (3.32 mm diameter by 63.5 mm long) | Not considered |
| C-1 | Considered | |
| RS-0 | 8d ring-shank nails (2.87 mm diameter by 60.3 mm long) | Not considered |
| RS-1 | Considered | |
| CRS-0 | Equal distribution of 8d common and ring-shank nails | Not considered |
| CRS-1 | Considered |
Roof sheathing is considered in a separate fragility analysis because the sheathing resistance model is formulated differently from the other elements in the vertical load path and because the wind loads are derived from ASCE 7 for Component and Cladding with wind load statistics as given in Table 5. The remainder of the typical load path illustrated in Fig. 5 is modeled as a load chain with connection resistances expressed in terms of force per unit length of wall and wind loads derived from ASCE 7 Main Wind Force Resisting System approaches. A more detailed description of this resistance modeling approach is given in Rittelmeyer and Roueche (2022). The main steps in the approach are as follows. (1) Uplift resistance of individual connections is taken as the sum of connection capacity and cumulative dead load, where capacities are computed either from LRFD-based strength equations provided in applicable design specifications or from a comparable mechanics-based model. (2) Capacities of parallel connections, such as the stud-to-plate and overlapping wall sheathing connections, are summed to form a load chain of connections in series. (3) After consolidating parallel connections, the system-level uplift resistance of the load path is taken as the resistance of the weakest connection in series. Rather than developing fragility functions separately for each load path connection, the use of a combined limit state applied to the whole load path (excluding roof sheathing) as a series system offers the advantage of evaluating the effective impact of various configurations on building performance. As the failure observations surveyed in the preceding section indicate, system-level performance is often limited by characteristic weaknesses, typically in the roof-to-wall or wall-to-foundation connection. Wherever the characteristic weakness is present, the system-level fragility closely resembles what the component-level fragility for that connection would be in isolation.
| Source | Wind load parameter | Nominal value | Bias | Mean | Standard deviation | Bounds |
|---|---|---|---|---|---|---|
| ASCE 7-16 Chapter 30 | Ground elevation factor, | 1.00 | 1.00 | 1.00 | 0.00 | None |
| Topographic factor, | 1.00 | 1.00 | 1.00 | 0.00 | None | |
| Exposure coefficient, | 0.85 | 0.93 | 0.79 | 0.11 | None | |
| Wind directionality factor, | 0.85 | 1.01 | 0.86 | 0.14 | [0, 1.00] | |
| Internal pressure coefficient, | 0.84 | 0.00 | 0.15 | [, 0.46] | ||
| External pressure coefficient, | Varies | 0.95 | Varies | COV: 0.12 | None | |
| ASCE 7-22 Chapter 32 | Tornado exposure coefficient, | 1.00 | 1.00 | 1.00 | 0.10 | None |
| Tornado directionality factor, | 0.75 | 1.01 | 0.76 | 0.08 | [0, 1.00] | |
| Vertical adjustment factor, | 1.10 | 1.00 | 1.10 | 0.11 | None | |
| Internal pressure coefficient, | 0.84 | 0.00 | 0.15 | [, 0.46] | ||
| External pressure coefficient, | Varies | 0.90 | Varies | COV: 0.15 | None |
The input parameter set used to compute connection resistances is summarized in Table 6, which contains probability distributions for the nondeterministic parameters in the roof, wall, and floor systems of the characteristic load path in Fig. 5. Within this resistance framework, distributions may be continuous or discrete and numerical or categorical. Certain parameters are coupled, such as wood species and specific gravity. Some categorical parameters control connection configurations by selecting from a defined list of possible fastener options. Discrete distributions may be weighted according to the relative frequency of each outcome. Distributions are assigned to be representative of actual structural observations in Arabi in terms of the set of possible values and relative probabilities of occurrence.
| Parameter | Distribution | Units | Value range |
|---|---|---|---|
| Roof wood species | Discrete | “Douglas Fir-Larch,” “Hem-Fir,” “Southern Pine,” “Spruce-Pine-Fir” | |
| Roof specific gravity | Normal | Mean: 0.50, 0.43, 0.55, 0.42 | |
| Coefficient of variation: 0.12 | |||
| Sheathing specific gravity | Normal | Mean: 0.42, 0.50 | |
| Coefficient of variation: 0.10 | |||
| Roof sheathing thickness | Discrete | in. (mm) | , , , [11, 13, 14, 16] |
| Roof cover weight | Normal | (kPa) | Mean: 2.00 [0.096] |
| Coefficient of variation: 0.10 | |||
| Roof-to-wall connection type | Discrete | “Toe-nails,” “H2.5,” “H8” | |
| Roof-to-wall toe-nail connection | Discrete | “3-10d common,” “3-16d Box” | |
| Wall and floor wood species | Discrete | “Douglas Fir-Larch,” “Hem-Fir,” | |
| “Southern Pine,” “Spruce-Pine-Fir” | |||
| Wall specific gravity | Normal | Mean: 0.50, 0.43, 0.55, 0.42 | |
| Coefficient of variation: 0.12 | |||
| Wall sheathing thickness | Discrete | in. (mm) | , , , [11, 13, 14, 16] |
| Wall cladding weight | Normal | (kPa) | Mean: 5.00 [0.24] |
| Coefficient of variation: 0.10 | |||
| Double top plate connection | Discrete | “10d box,” “2-10d box,” “0.131 in. diam.,” “2-0.131 in. diam.” | |
| Wall sheathing nail edge spacing | Discrete | in. (cm) | 6, 8, 12 [15.2, 20.3, 30.5] |
| Wall sheathing overlap | Discrete | “True,” “False” | |
| [Upper top plate] | |||
| Wall stud to plate connection | Discrete | “2-16d common,” “2-16d box” | |
| End-grain strength reduction factor | Normal | Mean: 0.625 | |
| Coefficient of variation: 0.10 | |||
| Distribution bounds: [0.50, 0.75] | |||
| Subfloor thickness | Discrete | in. (mm) | , , , [11, 13, 14, 16] |
| Floor finish weight | Normal | (kPa) | Mean: 4.00 [0.19] |
| Coefficient of variation: 0.10 | |||
| Bottom plate to floor connection | Discrete | “2-16d common,” “3-16d box,” “4-0.131 in. diam.,” “2-0.131 in. diam.” | |
| Wall sheathing overlap (sill) | Discrete | “True,” “False” | |
| Sill to pier anchor bolt diameter | Discrete | in. (mm) | , , [9.5, 12.7, 15.9] |
| Weights: [5%, 90%, 5%] | |||
| Anchor bolt cell grouting index | Discrete | “Fully grouted joint,” “Partially grouted joint” | |
| Anchor bolt partial grouting factor | Normal | Mean: 0.70 | |
| Coefficient of variation: 0.50 | |||
| Distribution bounds: [0, 1] | |||
| Masonry pier grouting index | Discrete | “Fully grouted,” “Shell-grouted only” | |
| Masonry pier mortar type | Discrete | “Masonry cement,” “Cement-lime or mortar-cement” | |
| Concrete masonry | Normal | () | Mean: 125 [19.6] |
| Specific weight | Coefficient of variation: 0.05 |
Load path fragility is evaluated using the wind load provisions of ASCE 7-16 and the tornado provisions of ASCE 7-22 and using the Main Wind Force Resisting System (specifically Chapter 27) approaches for both. Load statistics for both models are presented in Table 7. The tornado provisions of ASCE 7-22 include several amplification factors to account for the higher wind pressures that can be experienced in tornadoes compared to straightline winds for a given wind speed, such as the atmospheric pressure deficit, nonmonotonic velocity profile, and vertical winds.
| Source | Wind load parameter | Nominal value | Bias | Mean | Standard deviation | Bounds |
|---|---|---|---|---|---|---|
| ASCE 7-16 Chapter 27 | Ground elevation factor, | 1.00 | 1.00 | 1.00 | 0.00 | None |
| Topographic factor, | 1.00 | 1.00 | 1.00 | 0.00 | None | |
| Exposure coefficient, | 0.85 | 0.93 | 0.79 | 0.11 | None | |
| Wind directionality factor, | 0.85 | 1.01 | 0.86 | 0.14 | [0, 1.00] | |
| Internal pressure coefficient, | 0.84 | 0.00 | 0.15 | [, 0.46] | ||
| Gust-effect factor, | 0.85 | 0.98 | 0.83 | 0.08 | None | |
| External pressure coefficient, | 0.88 | 0.08 | None | |||
| ASCE 7-22 Chapter 32 | Tornado exposure coefficient, | 1.00 | 1.00 | 1.00 | 0.10 | None |
| Tornado directionality factor, | 0.80 | 1.01 | 0.81 | 0.13 | [0, 1.00] | |
| Vertical adjustment factor, | 1.10 | 1.00 | 1.10 | 0.11 | None | |
| Internal pressure coefficient, | 0.84 | 0.00 | 0.15 | [, 0.46] | ||
| Tornado gust-effect factor, | 0.85 | 0.98 | 0.83 | 0.08 | None | |
| External pressure coefficient, | 0.88 | 0.08 | None |
The load path configurations considered in the vertical load path fragility analysis focus on the roof-to-wall connection type (toe-nail, H2.5 with toe-nail, and H8 with toe-nail) and whether the wall sheathing overlaps both stud wall top plates or only the lower top plate or whether wall sheathing is continuous across the wall-to-floor connection. The various configurations are summarized in Table 8.
| Configuration ID | Roof-to-wall connector | Wall sheathing overlap | |
|---|---|---|---|
| Upper top plate | Wall-to-foundation | ||
| T-0-0 | Toe-nails | No | No |
| H25-0-0 | H2.5 + Toe-nails | No | No |
| H8-0-0 | H8 + Toe-nails | No | No |
| T-0-1 | Toe-nails | No | Yes |
| H25-0-1 | H2.5 + Toe-nails | No | Yes |
| H8-0-1 | H8 + Toe-nails | No | Yes |
| T-1-0 | Toe-nails | Yes | No |
| H25-1-0 | H2.5 + Toe-nails | Yes | No |
| H8-1-0 | H8 + Toe-nails | Yes | No |
| T-1-1 | Toe-nails | Yes | Yes |
| H25-1-1 | H2.5 + Toe-nails | Yes | Yes |
| H8-1-1 | H8 + Toe-nails | Yes | Yes |
Fragility curves resulting from the roof sheathing and load path analyses are presented in Figs. 10 and 11, in which Monte Carlo simulation results based on 50,000 model runs for each configuration have been fitted to a lognormal CDF with a logarithmic mean and standard deviation as listed in the Supplemental Materials. The roof sheathing fragility results in Fig. 10(a), based on the ASCE 7-16 load model, indicate upper and lower bound median failure wind speeds of 89 and for the limit state of at least one panel failure. Including a factor to account for overdriven fasteners reduces median failure wind speeds by about 9%. Results based on the ASCE 7-22 load model, shown in Fig. 10(b), represent an average reduction in median failure wind speed of 16% relative to the ASCE 7-16 cases, with upper and lower bounds of 74 and . Model results are also compared to empirical fragilities in Fig. 10: an upper-bound curve based on observed roof substrate damage and a lower-bound curve based on observed roof substrate damage but excluding roof structure damage.
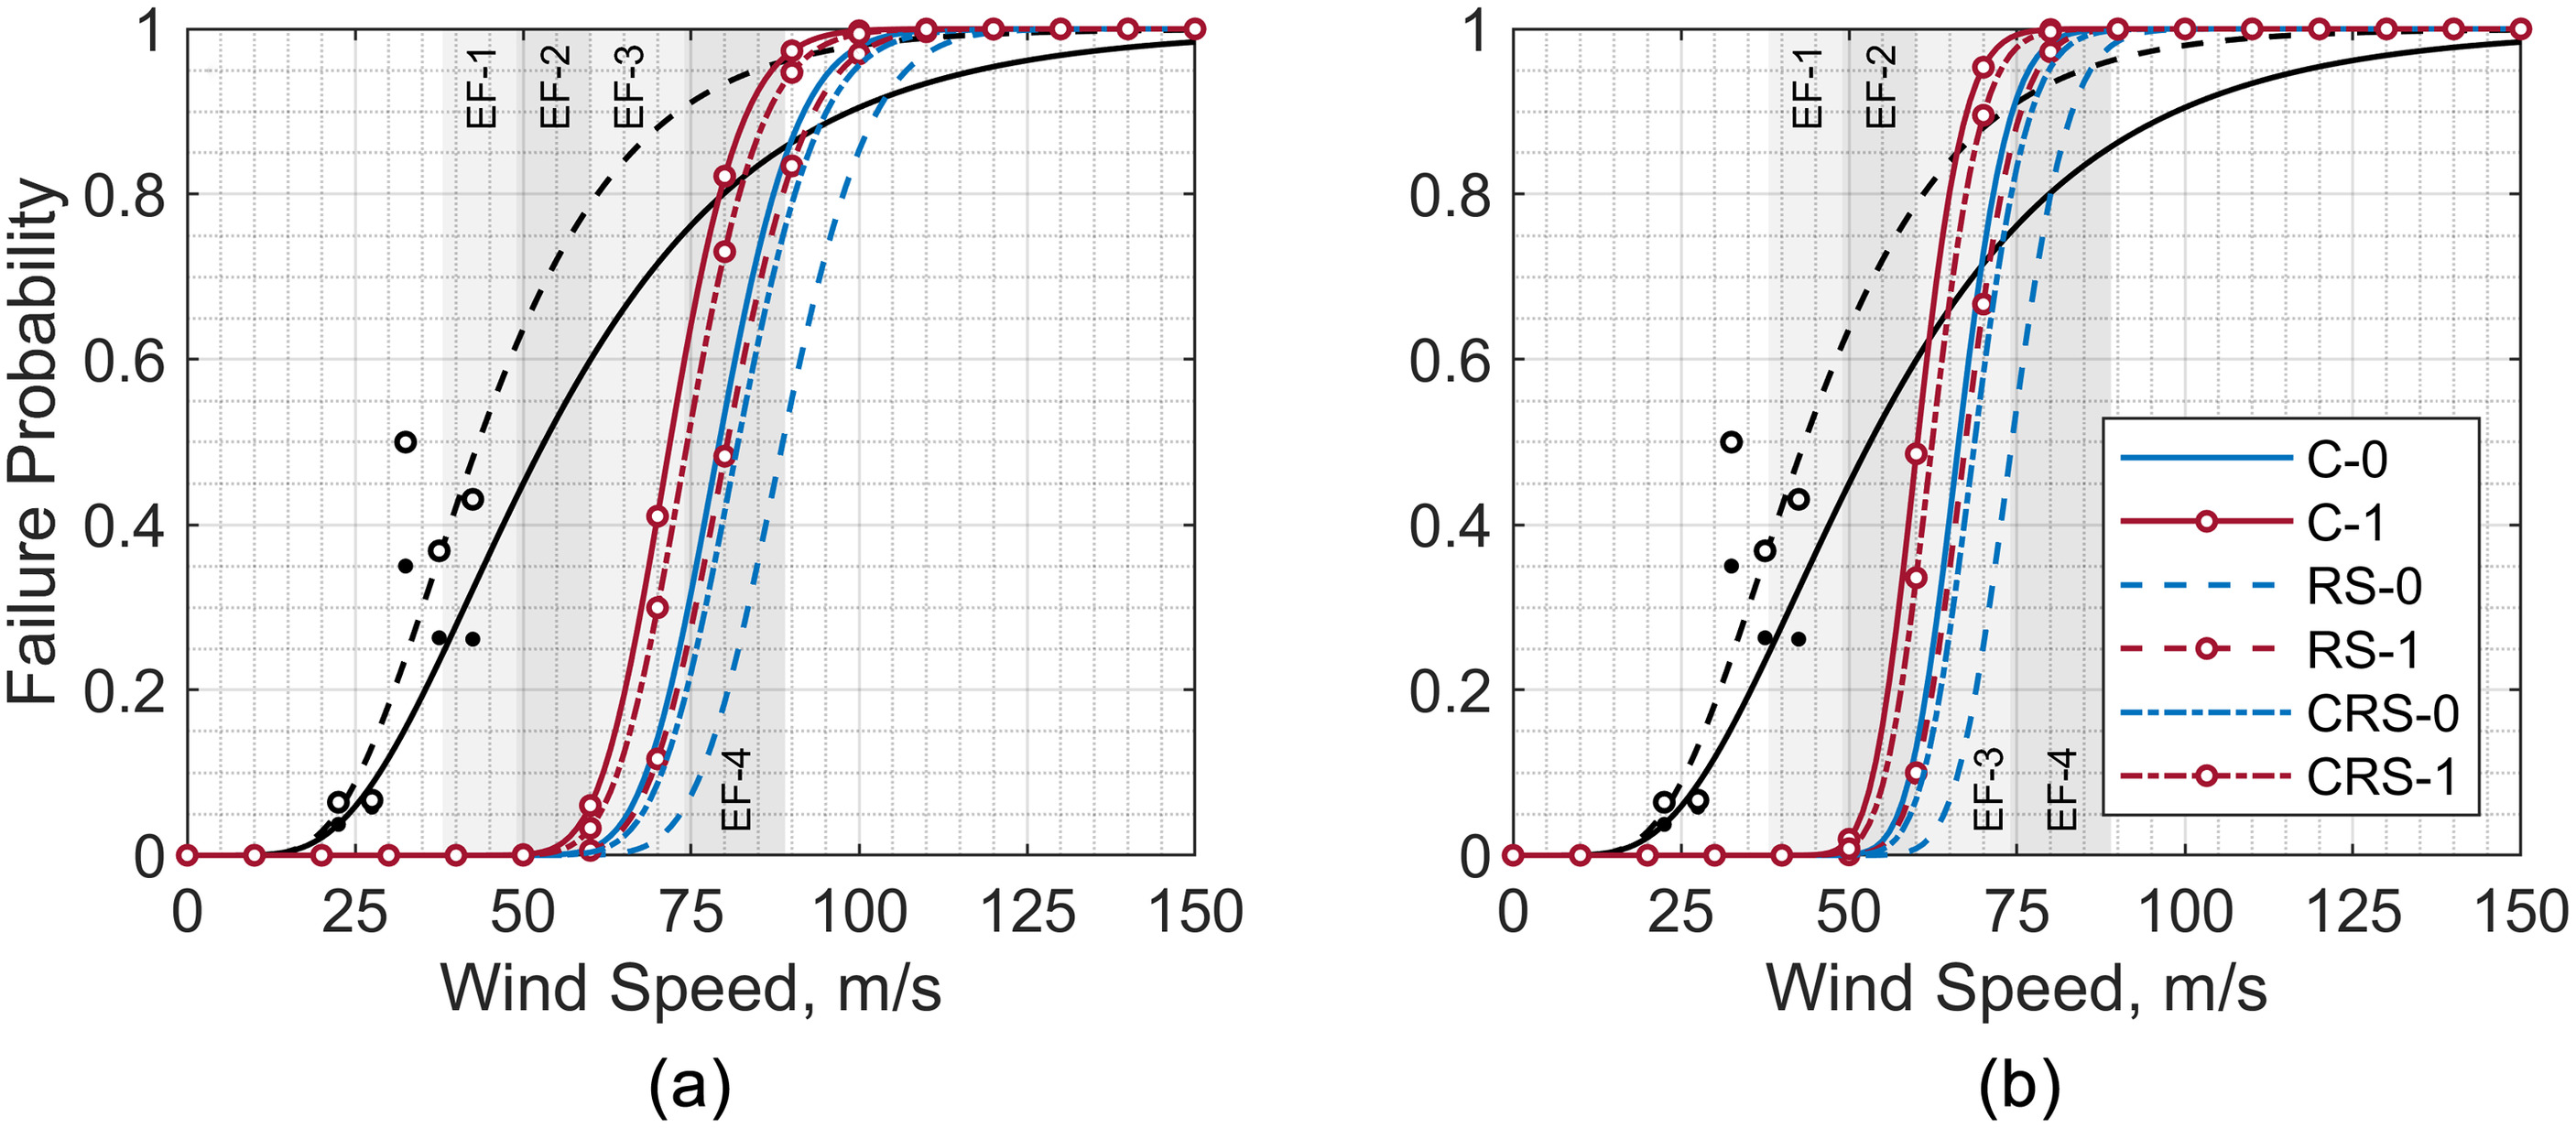
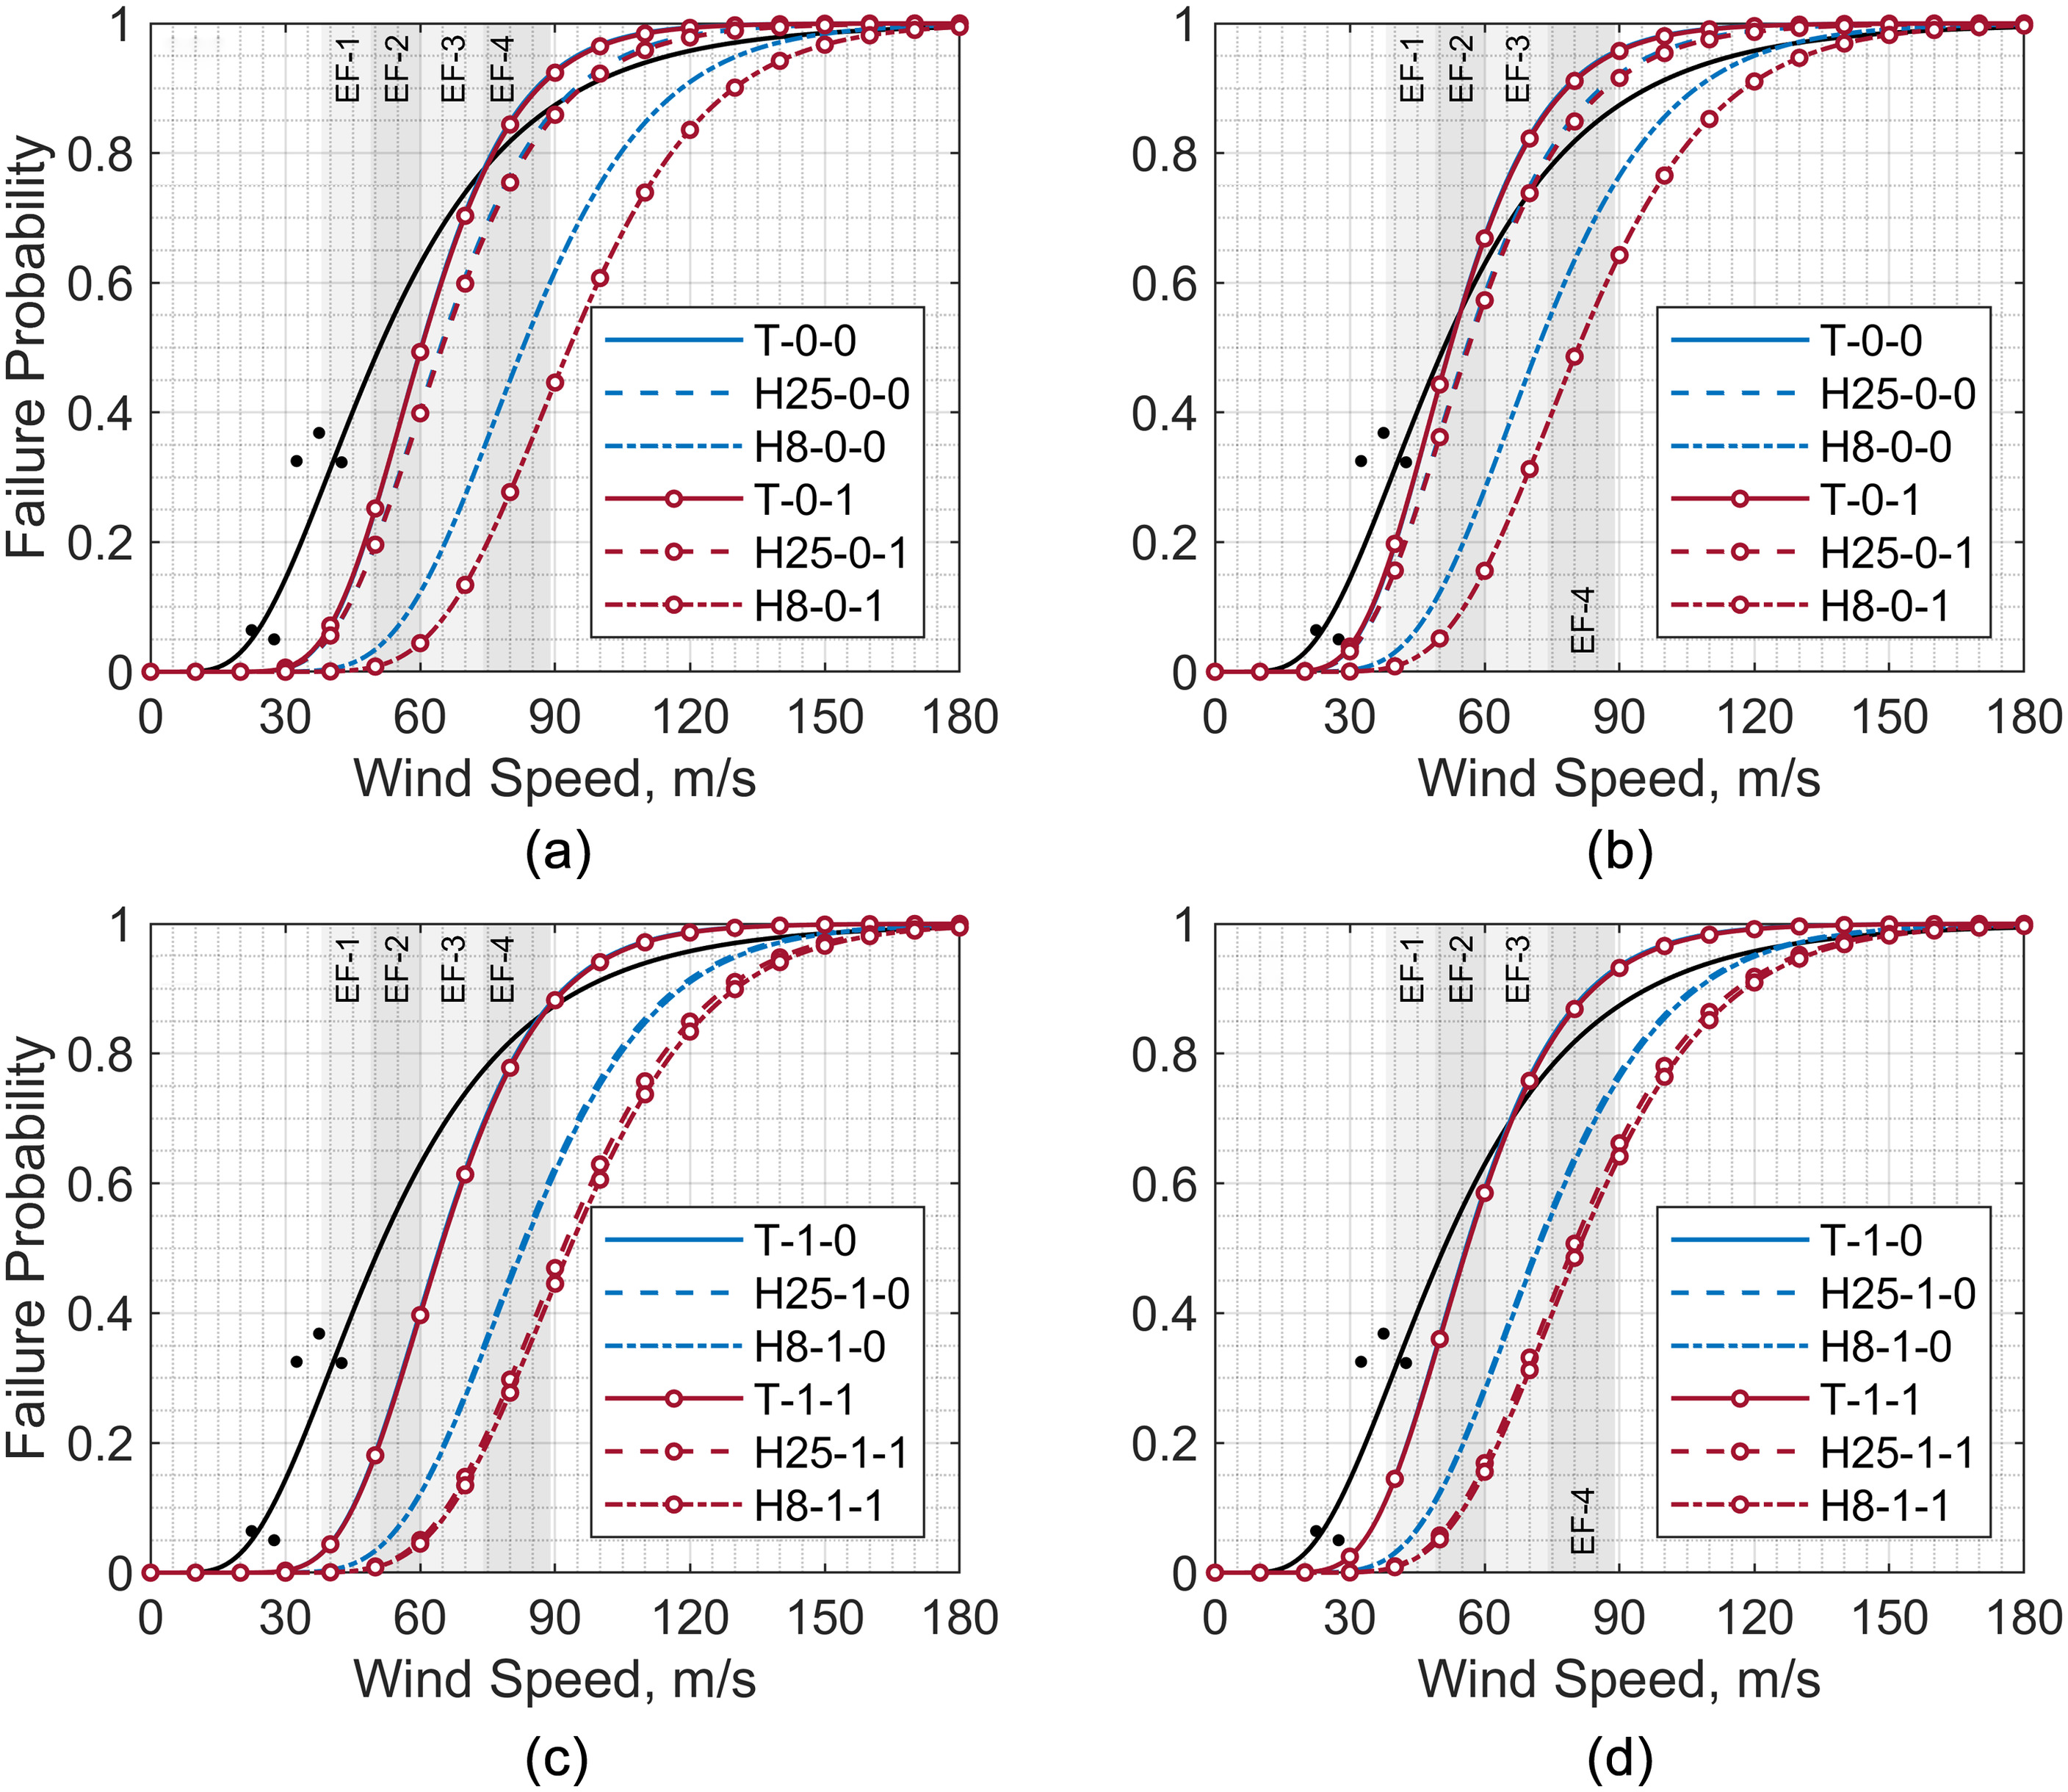
Results of the load path fragility analysis in Fig. 11 expectedly demonstrate higher variance than those of the roof sheathing analysis. The ASCE 7-16 load model produces upper and lower bound median failure wind speeds of 93 and , while the ASCE 7-22 loading reduces median failure wind speeds by 14% on average and leads to upper and lower bounds of 81 and . Across all configurations considered, the toe-nailed roof-to-wall connection is consistently a limiting link in the load path; continuous sheathing across the wall-to-foundation connection (Case T-0-1) does not meaningfully improve system performance, while overlapping wall sheathing at the upper top plate (Cases T-1-0 and T-1-1) improves performance slightly. The addition of an H2.5 hurricane tie strengthens the roof-to-wall connection but only marginally increases load path resistance by 7% (as measured by the expected failure wind speed) if the double-top plate connection remains unreinforced by overlapping wall sheathing. Because the H8 hurricane tie also strengthens the double top plate connection, configurations that include an H8 substantially improve performance relative to H2.5 cases in the absence of a top plate sheathing overlap (e.g., Case H8-0-0 improves the expected failure wind speed by 30% relative to H25-0-0) and marginally improve performance otherwise (e.g., Cases H8-1-0 and H25-1-0). Cases H8-0-0, H25-1-0, and H8-1-0 are indistinguishable for the same reason since the limiting link for these configurations is in the wall-to-foundation connection, which in these cases is not reinforced by continuous sheathing. The fragility fit parameters for all cases are available in the Supplementary Materials.
For all combinations and limit states considered, the analytical fragility modeling revealed that median failure wind speeds when considering ASCE 7-16 straightline wind loads were around 15% higher than when considering ASCE 7-22 tornado load provisions. In other words, the tornado provisions tend to produce higher wind loads and thus lower failure wind speeds when compared to straightline wind loads.
To facilitate a comparison between the analytical fragility functions and the field observations, empirical fragility functions were also generated, using the damage observed to individual homes in the reconnaissance study and the tree-fall-conditioned wind field described earlier. The limit states were chosen to correspond to the analytical fragility functions and consisted of (1) uplift of at least one roof sheathing panel, or (2) any roof structure or wall structure damage, where the structure is defined as broken or missing roof or wall framing elements (e.g., roof trusses, rafters, wall studs). During the field study, roof sheathing was assumed to be damaged if it was removed from the roof structure, and the damage ratio was defined as the area of missing roof sheathing divided by the total roof sheathing area. Since it is possible that the roof sheathing remained attached to the roof structure, but large sections of the roof structure itself failed, the upper and lower bounds of the roof sheathing damage were used for the limit state. The lower bound assumed that the true roof sheathing damage area is the difference between the total roof sheathing damage area and the roof structure damage area (i.e., only the roof sheathing missing from portions of the roof structure that remained was counted). The upper bound assumed that all missing roof sheathing was truly damaged. Given these limit states, the empirical fragility functions were fitted using a generalized linear model with a probit link function, as described in Roueche et al. (2017).
The empirical and analytical fragility functions overall lack agreement, both for sheathing failure (Fig. 10) and system failure (Fig. 11) limit states. In all comparisons, the empirical fragility functions are shifted to the left of the analytical functions, suggesting that the structures failed at lower wind speeds than those predicted by the analytical model. The empirical fragility functions also have higher variability than the analytically derived functions. The discrepancy between the empirical and analytical fragility functions could be attributed to one or more of the following causes that relate to both loads and resistance:
1.
The tornado wind field may not be well conditioned to the true tornado wind field. There were few felled trees () in the path of the tornado, and most were in the southern half of the tornado path, away from where the most significant damage was observed. If the tornado increased in intensity as it encountered the less dense housing in the northern half of the path, the tree-fall model would not be able to account for the increase in intensity. The relatively sparse treefall increases uncertainty in the wind field model conditioning and makes the results more sensitive to variance in the true critical tree-fall wind speed.
2.
The steady-state, parametric wind field modeling approach does not capture localized phenomena such as subvortices, vortex wandering, and flow channeling. The impact these phenomena have would be even more pronounced for small-diameter tornadoes affecting a relatively small number of structures and wind indicators.
3.
The resistance model only considers the uplift capacity of the vertical load path and assumes all loads are vertically oriented. In reality, wall surfaces would be subjected to strong out-of-plane loads in combination with the uplift loads, which could induce premature failures relative to the uplift-only model.
4.
The analytical model only considers one archetype structure when a variety of geometries (roof shapes, roof slopes, footprint area, number of stories) were impacted by the tornado and may not capture all structural defects, e.g., construction errors and deteriorated members. If these effects were significant, the true fragilities could be expected to have higher variability than the current analytical fragility functions and may be shifted left or right along the intensity axis depending on how well the chosen benchmark building represents the full population.
5.
The analytical wind load model, based on minimum design load provisions with a constant predefined loading pattern and assuming static loading conditions, may not adequately capture spatial and temporal variations associated with the true wind load effects induced by a translating and dynamic tornado.
Discussion and Conclusions
This study investigated the impacts of a strong tornado, rated EF-3 by the National Weather Service, that struck Arabi, LA, on March 22, 2022. The study integrated rapid imaging techniques, forensic damage assessments, and tree-fall conditioned wind field models to contextualize the performance of mostly modern (post-2005) light wood-frame structures constructed to hurricane-resistant building codes that were impacted by the tornado. The observed levels of damage, caused by a tornado, are unfortunately not rare in the United States, but the juxtaposition of the observed damage levels in a hurricane-prone region with enhanced construction techniques has important implications for understanding and mitigating tornado damage risks elsewhere. Further, the study pilots a framework for developing both empirical and analytical fragility functions for a tornado tuned to the specific load path observations from the forensic investigations that can be a model for future tornado assessments. The major findings from these efforts are summarized as follows:
1.
Despite the use of hurricane-resistant construction techniques that are commonly recommended for damage mitigation, including hurricane straps, anchor bolts, and ring-shank nails for roof sheathing, structural damage at these interfaces was still observed throughout the tornado path in both pre-IRC and post-IRC homes. Roof structure (e.g., rafters, trusses), roof sheathing, and wall-to-foundation interface failures were observed in 27%, 26%, and 30% of the structures investigated, respectively. The failures were traced in multiple instances to structural fuses that led to premature failure, such as overdriven nails and insufficient nail-head diameters in the case of roof sheathing, or failure to provide a continuous load path between the upper and lower wall top plates or between the wall bottom plate and foundation. The observations confirm the importance of providing a continuous, engineered load path rather than focusing on one or two individual connections within the load path.
2.
The study demonstrates the complexity of the vertical load path in light wood-frame construction. Broadly focusing on roof sheathing, roof-to-wall ties, and the presence of anchor bolts at the foundation oversimplifies the load path and the potential failure mechanisms within it. More posttornado investigations are needed with detailed evaluations of the load path in order to properly identify the true failure mechanisms and focus mitigation efforts. Further, risk assessments based simply on identifying whether isolated mitigation hardware (e.g., hurricane straps and anchor bolts) is present will likely overestimate the true capacities.
3.
Analytical fragility modeling showed that common construction defects can reduce the structural capacity of structures using wind-resistant construction techniques. Overdriving ring-shanked nails reduces the expected failure wind speeds by about 10%. Adding an H2.5 roof-to-wall connection without tying the double top plates together only improves the system resistance by 7%, while using an H8 or other construction technique that effectively ties the entire roof-to-wall connection assembly together can improve the system performance by nearly 30%.
4.
The analytical fragility modeling also revealed that for the archetypes considered, the ASCE 7-22 tornado provisions on average produced wind loads that were about 15% higher than the straightline wind provisions in ASCE 7-16.
5.
Agreement between estimates of the wind speeds in the Arabi tornado using multiple methods was mixed. In this study, estimation methods included the EF Scale, tree-fall patterns, and analytical fragility functions derived from the load path observations, but the estimates lacked close agreement. The analytical fragility functions suggested peak wind speeds (based on median failure wind speeds) in the high EF-3 to EF-4 range for the failure mechanisms considered, which agreed reasonably well with the high EF-3 intensity estimate from the National Weather Service based on the application of the EF Scale. The parametric wind field model conditioned to tree-fall patterns estimated that maximum horizontal wind speeds were , equivalent to an EF-1 tornado, although limited felled trees were available to condition the model, enhancing the uncertainty of this method. While the likelihood of consensus between the three wind speed estimation methods for this specific tornado was limited due to the few felled trees, the study nonetheless provides a framework for such consensus studies in the future. Until direct measurements of near-surface tornado wind speeds become more feasible, relying upon multiple wind speed estimation methods to arrive at a consensus estimate is recommended.
6.
The study found the benefits of tiered and mixed technology reconnaissance studies in combination with the use of shared data from the public in developing more complete and accurate building performance data sets. Early drone flights by storm chasers captured aerial views of the complete tornado path through Arabi, archiving the undisturbed posttornado conditions. The use of a StEER scout team with rapid panoramic imaging capabilities allowed ground-level views of the posttornado conditions over the entire impacted region to be captured in a relatively short amount of time. Panoramic imagery along 80 km of roads through the impacted region was captured in one day. Having the imagery already collected allowed forensic engineering teams to focus more explicitly on detailed load-path assessments. Remote data librarians were then able to synthesize the data from all sources into a standardized data set for further analysis and archival.
The findings of this study are limited by several factors. The relatively few felled trees heighten the uncertainty and potential biases in the tree-fall-conditioned wind speed estimates. Further, the analytical fragility modeling was limited to a single aerodynamic archetype and only considered the vertical load path while neglecting the contributions of lateral loads toward failure. The wind load analysis was also based on static wind load design provisions, rather than wind tunnel data or computational fluid dynamics simulations tailored to the event. Nonetheless, the study has broader applicability beyond this specific tornado event for future tornado assessments and tornado risk mitigation efforts.
Data Availability Statement
All data and code generated or used during the study are available in the Natural Hazards Engineering Research Infrastructure DesignSafe platform in accordance with funder data retention policies. (PRJ-3443, doi: https://doi.org/10.17603/ds2-pdfb-d686).
Acknowledgments
This work was sponsored in part by the National Science Foundation under grant CAREER-1944149 and research grants CMMI-1841667 and 2103550. Any opinions, findings, and conclusions or recommendations expressed in this material are those of the authors and do not necessarily reflect the views of the National Science Foundation. The work was also partially funded by the National Oceanic and Atmospheric Administration through Grant Nos. NA19OAR4590213, NA19OAR4590212, and NA19OAR4590214. The authors acknowledge and appreciate the contributions of the following undergraduate students who served as Data Librarians in curating the reconnaissance data: Hannah Bartels, Morgan Aldridge, Andrew Golson, Fox Harris, JD Holt, and Cason Stevens. The authors also gratefully acknowledge Daphne LaDue (University of Oklahoma) for assisting with the field reconnaissance, and specifically engaging homeowners to facilitate access to the interior of homes for more detailed load path assessments. And finally, we gratefully acknowledge the homeowners and their willingness to support the study despite the recent impacts.
References
Adhikari, P., H. Mahmoud, A. Xie, K. Simonen, and B. Ellingwood. 2020. “Life-cycle cost and carbon footprint analysis for light-framed residential buildings subjected to tornado hazard.” J. Build. Eng. 32 (Nov): 101657. https://doi.org/10.1016/j.jobe.2020.101657.
ASCE. 2017. Minimum design loads and associated criteria for buildings and other structures. Reston, VA: ASCE.
ASCE. 2022. Minimum design loads and associated criteria for buildings and other structures. Reston, VA: ASCE.
Ashley, W. S., and S. M. Strader. 2016. “Recipe for disaster: How the dynamic ingredients of risk and exposure are changing the tornado disaster landscape.” Bull. Am. Meteorol. Soc. 97 (5): 767–786. https://doi.org/10.1175/BAMS-D-15-00150.1.
Ashrafi, A. 2021. “Experimental simulation of tornado-like vortices and their impact on high-rise buildings.” Ph.D. dissertation, Dept. of Civil and Environmental Engineering, Univ. of Western Ontario.
AWC (American Wood Council). 2018. Wood frame construction manual for one- and two-family dwellings. Leesburg, VA: American National Standards Institute.
Berg, R. 2013. Tropical cyclone report: AL092012 Hurricane Isaac. Miami: Tropical Cyclone Report.
Bezabeh, M. A., A. Gairola, G. T. Bitsuamlak, M. Popovski, and S. Tesfamariam. 2018. “Structural performance of multi-story mass-timber buildings under tornado-like wind field.” Eng. Struct. 177 (Dec): 519–539. https://doi.org/10.1016/j.engstruct.2018.07.079.
Brock, F. V., K. C. Crawford, R. L. Elliott, G. W. Cuperus, S. J. Stadler, H. L. Johnson, and M. D. Eilts. 1995. “The Oklahoma mesonet: A technical overview.” J. Atmospheric Ocean Technol. 12 (1): 5–19. https://doi.org/10.1175/1520-0426(1995)012%3C0005:TOMATO%3E2.0.CO;2.
Case, J., P. Sarkar, and S. Sritharan. 2014. “Effect of low-rise building geometry on tornado-induced loads.” J. Wind Eng. Ind. Aerodyn. 133 (Oct): 124–134. https://doi.org/10.1016/j.jweia.2014.02.001.
Ceferino, L., H. Ibrahim, S. Javadinasab Hormozabad, T. Kijewski-Correa, S. Pilkington, D. Roueche, I. Robertson, and D. Prevatt. 2020. StEER - Hurricane zeta event briefing. Austin, TX: DesignSafe-CI. https://doi.org/10.17603/ds2-67r3-2y51 v1.
Chen, G., and F. T. Lombardo. 2019. “An analytical pattern-based method for estimation of a near-surface Tornadic wind field.” J. Wind Eng. Ind. Aerodyn. 194 (Nov): 103999. https://doi.org/10.1016/j.jweia.2019.103999.
Chen, Q., Z. Tang, X. Wu, D. Zuo, and D. James. 2022. “Effects of openings and translation speed on tornado-like loading of a low-rise building model.” In Proc., 14th Americas Conf. on Wind Engineering. Lubbock, TX: National Wind Institute, Texas Tech Univ.
Chen, Q., Z. Tang, X. Wu, D. Zuo, and D. James. 2023. “Laboratory study of tornado-like loading on a low-rise building model.” J. Wind Eng. Ind. Aerodyn. 238 (Jul): 105443. https://doi.org/10.1016/j.jweia.2023.105443.
Datin, P. L., D. O. Prevatt, and W. Pang. 2011. “Wind-uplift capacity of residential wood roof-sheathing panels retrofitted with insulating foam adhesive.” J. Archit. Eng. 17 (4): 144–154. https://doi.org/10.1061/(ASCE)AE.1943-5568.0000034.
Edwards, R., J. G. LaDue, J. T. Ferree, K. Scharfenberg, C. Maier, and W. L. Coulbourne. 2013. “Tornado intensity estimation: Past, present, and future.” Bull. Am. Meteorol. Soc. 94 (5): 641–653. https://doi.org/10.1175/BAMS-D-11-00006.1.
Ellingwood, B. R., D. V. Rosowsky, Y. Li, and J. H. Kim. 2004. “Fragility assessment of light-frame wood construction subjected to wind and earthquake hazards.” J. Struct. Eng. 130 (12): 1921–1930. https://doi.org/10.1061/(ASCE)0733-9445(2004)130:12(1921).
Fan, F., and W. Pang. 2019. “Stochastic track model for tornado risk assessment in the U.S.” Front. Built Environ. 5 (Mar): 37. https://doi.org/10.3389/fbuil.2019.00037.
Ghosh, S., B. F. Bigelow, A. Smith, and O. Omole. 2023. “A cost-benefit analysis of FORTIFIED™ home designation in Oklahoma.” Cityscape: J. Policy Dev. Res. 25 (1): 303–314.
Gomez, C., and H. Purdie. 2016. “UAV- based photogrammetry and geocomputing for hazards and disaster risk monitoring–A review.” Geoenviron. Disasters 3 (1): 23. https://doi.org/10.1186/s40677-016-0060-y.
Gutierrez Soto, M., et al. 2023. 21-22 March 2022 Tornado outbreak field assessment structural team dataset. Austin, TX: DesignSafe-CI. https://doi.org/10.17603/DS2-PDFB-D686.
Haan, F. L., V. K. Balaramudu, and P. P. Sarkar. 2010. “Tornado-induced wind loads on a low-rise building.” J. Struct. Eng. 136 (1): 106–116. https://doi.org/10.1061/(ASCE)ST.1943-541X.0000093.
Heiss, W. H., D. L. McGrew, and D. Sirmans. 1990. “Nexrad: Next generation weather radar (WSR-88D).” Microwave J. 33 (1): 79–89.
Honerkamp, R., G. Yan, D. Han, R. Feng, Z. Li, and T. Li. 2022. “Tornado-induced structural damage based on reconnaissance surveys of the 2019 Jefferson City, Missouri, Tornado and Previous Notable Tornadoes.” Nat. Hazards Rev. 23 (4): 05022008. https://doi.org/10.1061/(ASCE)NH.1527-6996.0000574.
Hughes, W., W. Zhang, and Z. Ding. 2022. “Multiobjective optimization for hurricane retrofit to improve coastal community structural and socioeconomic resilience.” Nat. Hazards Rev. 23 (4): 04022033. https://doi.org/10.1061/(ASCE)NH.1527-6996.0000590.
IBHS (Insurance Institute for Business & Home Safety). 2021. Rating the states–Hurricane states. Richburg, SC: IBHS.
ICC (International Code Council). 2014. Standard for residential construction in high-wind regions. ICC 600-2014. Dubai, UAE: ICC.
Jaffe, A. L., and G. A. Kopp. 2021. “Internal pressure modelling for low-rise buildings in tornadoes.” J. Wind Eng. Ind. Aerodyn. 209 (Feb): 104454. https://doi.org/10.1016/j.jweia.2020.104454.
Kameshwar, S., and J. E. Padgett. 2014. “Multi-hazard risk assessment of highway bridges subjected to earthquake and hurricane hazards.” Eng. Struct. 78 (Nov): 154–166. https://doi.org/10.1016/j.engstruct.2014.05.016.
Kawaguchi, M., T. Tamura, and W. Mashiko. 2020. “A numerical investigation of building damage during the 6 May 2012 Tsukuba tornado using hybrid meteorological model/engineering LES method.” J. Wind Eng. Ind. Aerodyn. 204 (Sep): 104254. https://doi.org/10.1016/j.jweia.2020.104254.
Kijewski-Correa, T., D. B. Roueche, K. M. Mosalam, D. O. Prevatt, and I. Robertson. 2021. “StEER: A community-centered approach to assessing the performance of the built environment after natural hazard events.” Front. Built Environ. 7 (May): 636197. https://doi.org/10.3389/fbuil.2021.636197.
Knabb, R., J. Rhome, and D. Brown. 2006. Tropical cyclone report: AL122005 Hurricane Katrina, 43. Miami: National Hurricane Center.
Kopp, G. A., and C.-H. Wu. 2020. “A framework to compare wind loads on low-rise buildings in tornadoes and atmospheric boundary layers.” J. Wind Eng. Ind. Aerodyn. 204 (Sep): 104269. https://doi.org/10.1016/j.jweia.2020.104269.
Liang, D. 2001. Improved reliability and economic modeling for new and retrofitted low -rise structures subjected to extreme wind hazards. New York: State Univ. of New York at Buffalo.
Link, L. E. 2010. “The anatomy of a disaster, an overview of Hurricane Katrina and New Orleans.” Ocean Eng. 37 (1): 4–12. https://doi.org/10.1016/j.oceaneng.2009.09.002.
Liu, Z., Y. Cao, J. Cao, Y. Wang, and S. Cao. 2021. “Numerical study of tornado-borne debris on a low-rise building through large eddy simulation.” J. Fluids Struct. 106 (Oct): 103379. https://doi.org/10.1016/j.jfluidstructs.2021.103379.
Lombardo, F. T. 2018. “Engineering analysis of a full-scale high-resolution tornado wind speed record.” J. Struct. Eng. 144 (2): 04017212. https://doi.org/10.1061/(ASCE)ST.1943-541X.0001942.
Lombardo, F. T., D. B. Roueche, and D. O. Prevatt. 2015. “Comparison of two methods of near-surface wind speed estimation in the 22 May, 2011 Joplin, Missouri Tornado.” J. Wind Eng. Ind. Aerodyn. 138 (Mar): 87–97. https://doi.org/10.1016/j.jweia.2014.12.007.
Maloney, T., B. Ellingwood, H. Mahmoud, N. Wang, Y. Wang, and P. Lin. 2018. “Performance and risk to light-framed wood residential buildings subjected to tornadoes.” Struct. Saf. 70 (Jan): 35–47. https://doi.org/10.1016/j.strusafe.2017.10.004.
Marshall, T. P. 2002. “Tornado damage survey at Moore, Oklahoma.” Weather Forecast. 17 (3): 582–598. https://doi.org/10.1175/1520-0434(2002)017%3C0582:TDSAMO%3E2.0.CO;2.
Masoomi, H., M. R. Ameri, and J. W. van de Lindt. 2018. “Wind performance enhancement strategies for residential wood-frame buildings.” J. Perform. Constr. Facil. 32 (3): 04018024. https://doi.org/10.1061/(ASCE)CF.1943-5509.0001172.
McDonald, J. R., K. C. Mehta, D. A. Smith, and J. A. Womble. 2012. “The enhanced Fujita scale: Development and implementation.” In Proc., Forensic Engineering 2009: Pathology of the Built Environment, 719–728. Reston, VA: ASCE. https://doi.org/10.1061/41082(362)73.
Mehta, K. C. 2013. “Development of the EF-scale for Tornado intensity.” J. Disaster Res. 8 (6): 1034–1041. https://doi.org/10.20965/jdr.2013.p1034.
Microsoft. 2023. “Global Building Footprints.”Accessed January 19, 2024. https://github.com/microsoft/GlobalMLBuildingFootprints.
Narancio, G., D. Romanic, J. Chowdury, H.-P. Hong, and H. Hangan. 2023. An appraisal of tornado-induced load provisions in ASCE/SEI 7-22 and 7-16 for residential low-rise buildings. London: Civil and Environmental Engineering Publications.
NOAA (National Oceanic and Atmospheric Administration). 2020. New Orleans Hurricane Katrina flood depth. Ann Arbor, MI: Inter-university Consortium for Political and Social Research. https://doi.org/10.3886/E122921V1-137160.
NOAA (National Oceanic and Atmospheric Administration). 2022. Storm Events Database—Event 1014021. New Orleans, LA: NOAA National Centers for Environmental Information.
NOAA (National Oceanic and Atmospheric Administration). 2023. Average annual number of tornadoes per state, 1993-2022. Norman, OK: NOAA Storm Prediction Center.
Padgett, J. E., and S. Kameshwar. 2016. “Supporting life cycle management of bridges through multi-hazard reliability and risk assessment.” In Multi-hazard approaches to civil infrastructure engineering, 41–58. Cham, Switzerland: Springer.
Pilkington, S., et al. 2021. StEER: 10 December 2021 midwest tornado outbreak joint preliminary virtual reconnaissance report and early access reconnaissance report (PVRR-EARR). Austin, TX: DesignSafe-CI. https://doi.org/10.17603/DS2-2B2K-WS96.
Pinelli, J.-P., M. Esteva, E. M. Rathje, D. Roueche, S. J. Brandenberg, G. Mosqueda, J. Padgett, and F. Haan. 2020. “Disaster risk management through the DesignSafe cyberinfrastructure.” Int. J. Disaster Risk Sci. 11 (6): 719–734. https://doi.org/10.1007/s13753-020-00320-8.
Prevatt, D., et al. 2021. StEER: Hurricane Ida joint preliminary virtual reconnaissance report-early access reconnaissance report (PVRR-EARR). Austin, TX: DesignSafe-CI. https://doi.org/10.17603/DS2-W6KM-FE51.
Prevatt, D. O., J. W. van de Lindt, E. W. Back, A. J. Graettinger, S. Pei, W. Coulbourne, R. Gupta, D. James, and D. Agdas. 2012. “Making the case for improved structural design: The Tornado outbreaks of 2011.” Leadersh. Manage. Eng. 12 (4): 254–270. https://doi.org/10.1061/(ASCE)LM.1943-5630.0000192.
Ramseyer, C., L. Holliday, and R. Floyd. 2016. “Enhanced residential building code for tornado safety.” J. Perform. Constr. Facil. 30 (4): 04015084. https://doi.org/10.1061/(ASCE)CF.1943-5509.0000832.
Razavi, A., and P. P. Sarkar. 2021. “Effects of roof geometry on tornado-induced structural actions of a low-rise building.” Eng. Struct. 226 (Jan): 111367. https://doi.org/10.1016/j.engstruct.2020.111367.
Rhee, D. M., and F. T. Lombardo. 2018. “Improved near-surface wind speed characterization using damage patterns.” J. Wind Eng. Ind. Aerodyn. 180 (Sep): 288–297. https://doi.org/10.1016/j.jweia.2018.07.017.
Rittelmeyer, B. M., and D. B. Roueche. 2022. “Global sensitivity analysis framework for vertical load path resistance in wood-frame residential structures.” In Proc., 14th Americas Conf. on Wind Engineering, 9. Lubbock, TX: National Wind Institute—Texas Tech Univ.
Roueche, D., et al. 2019. StEER—3 March 2019 Tornadoes in the Southeastern US: Field assessment structural team (FAST) early access reconnaissance report (EARR). Austin, TX: DesignSafe-CI. https://doi.org/10.17603/ds2-eb6e-tr31.
Roueche, D., A. Bagheri Jeddi, T. Do, D. Prevatt, and M. Alam. 2023. Texas and Louisiana March 2022 Tornado Outbreak Event Briefing. Austin, TX: DesignSafe-CI. https://doi.org/10.17603/DS2-9XVM-6667.
Roueche, D. B., F. T. Lombardo, and D. O. Prevatt. 2017. “Empirical approach to evaluating the tornado fragility of residential structures.” J. Struct. Eng. 143 (9): 04017123. https://doi.org/10.1061/(ASCE)ST.1943-541X.0001854.
Roueche, D. B., D. O. Prevatt, and F. L. Haan. 2020. “Tornado-induced and straight-line wind loads on a low-rise building with consideration of internal pressure.” Front. Built Environ. 6 (Feb): 18. https://doi.org/10.3389/fbuil.2020.00018.
Sabareesh, G. R., M. Matsui, and Y. Tamura. 2019. “Vulnerability of roof and building walls under a translating tornado like vortex.” Front. Built Environ. 5 (Apr): 53. https://doi.org/10.3389/fbuil.2019.00053.
Sandink, D., G. Kopp, S. Stevenson, and N. Dale. 2019. Increasing high wind safety for Canadian homes: A foundational document for low-rise residential and small buildings. Toronto: Institute for Catastrophic Loss Reduction.
Schroeder, J. L., W. S. Burgett, K. B. Haynie, I. Sonmez, G. D. Skwira, A. L. Doggett, and J. W. Lipe. 2005. “The west Texas Mesonet: A technical overview.” J. Atmos. Ocean. Technol. 22 (2): 211–222. https://doi.org/10.1175/JTECH-1690.1.
Simmons, K. M., P. Kovacs, and G. A. Kopp. 2015. “Tornado damage mitigation: Benefit–cost analysis of enhanced building codes in Oklahoma.” Weather Clim. Soc. 7 (2): 169–178. https://doi.org/10.1175/WCAS-D-14-00032.1.
Spatial Networks. 2022. Fulcrum App for Android and iOS (Release Version 3.0). St. Petersburg, FL: Spatial Networks.
Standohar-Alfano, C. D., and J. W. van de Lindt. 2016. “Tornado risk analysis for residential wood-frame roof damage across the United States.” J. Struct. Eng. 142 (1): 04015099. https://doi.org/10.1061/(ASCE)ST.1943-541X.0001353.
Stoner, M., and W. Pang. 2021. “Tornado hazard assessment of residential structures built using cross-laminated timber and light-frame wood construction in the US.” Nat. Hazards Rev. 22 (4): 04021032. https://doi.org/10.1061/(ASCE)NH.1527-6996.0000490.
Sutter, D., D. DeSilva, and J. Kruse. 2009. “An economic analysis of wind resistant construction.” J. Wind Eng. Ind. Aerodyn. 97 (3): 113–119. https://doi.org/10.1016/j.jweia.2009.01.002.
Verma, S., R. Panneer Selvam, Z. Tang, and D. Zuo. 2022. “Comparison of Tornado-induced pressures on building from CFD model with TTU experimental measurements.” J. Wind Eng. Ind. Aerodyn. 228 (Sep): 105076. https://doi.org/10.1016/j.jweia.2022.105076.
Vickery, P. J., P. F. Skerlj, J. Lin, L. A. Twisdale, M. A. Young, and F. M. Lavelle. 2006. “HAZUS-MH hurricane model methodology. II: Damage and loss estimation.” Nat. Hazards Rev. 7 (2): 94–103. https://doi.org/10.1061/(ASCE)1527-6988(2006)7:2(94).
Wang, J., and S. Cao. 2021. “Characteristics of tornado wind loads and examinations of tornado wind load provisions in ASCE 7–16.” Eng. Struct. 241 (Aug): 112451. https://doi.org/10.1016/j.engstruct.2021.112451.
Wang, M., S. Cao, and J. Cao. 2020. “Tornado-like-vortex-induced wind pressure on a low-rise building with opening in roof corner.” J. Wind Eng. Ind. Aerodyn. 205 (Oct): 104308. https://doi.org/10.1016/j.jweia.2020.104308.
Wood, R., et al. 2020. StEER—3 March 2020 Nashville Tornadoes: Early Access Reconnaissance Report (EARR). Austin, TX: DesignSafe-CI. https://doi.org/10.17603/DS2-2ZS2-R990.
Information & Authors
Information
Published In

Journal of Structural Engineering
Volume 150 • Issue 5 • May 2024
Copyright
This work is made available under the terms of the Creative Commons Attribution 4.0 International license, https://creativecommons.org/licenses/by/4.0/.
History
Received: Jul 14, 2023
Accepted: Nov 13, 2023
Published online: Feb 20, 2024
Published in print: May 1, 2024
Discussion open until: Jul 20, 2024
ASCE Technical Topics:
- Buildings
- Continuum mechanics
- Design (by type)
- Disaster risk management
- Disasters and hazards
- Dynamic loads
- Dynamics (solid mechanics)
- Engineering fundamentals
- Engineering mechanics
- Field tests
- Frames
- Load factors
- Natural disasters
- Residential buildings
- Solid mechanics
- Structural design
- Structural dynamics
- Structural engineering
- Structural members
- Structural systems
- Structures (by type)
- Tests (by type)
- Tornadoes
- Wind engineering
- Wind loads
- Wind speed
- Wood frames
Authors
Metrics & Citations
Metrics
Citations
Download citation
If you have the appropriate software installed, you can download article citation data to the citation manager of your choice. Simply select your manager software from the list below and click Download.
Cited by
- Sajad Javadinasab Hormozabad, Nathan Jacobs, Mariantonieta Gutierrez Soto, Reinforcement Learning for Integrated Structural Control and Health Monitoring, Practice Periodical on Structural Design and Construction, 10.1061/PPSCFX.SCENG-1455, 29, 3, (2024).
- Amanda Melendez, Mariantonieta Gutierrez Soto, Flood Resilience Quantification Framework of Rural Communities: Case Study of Harlan County, Kentucky, Natural Hazards Review, 10.1061/NHREFO.NHENG-1949, 25, 4, (2024).