Experimental and Numerical Study of Fire Endurance of Bonded Posttensioned Concrete Slabs
Publication: Journal of Structural Engineering
Volume 149, Issue 12
Abstract
The vulnerability of posttensioned (PT) slabs to fire has prompted researchers to conduct tests and devise means for numerical analysis. In this study, bonded PT slabs with varying cover thicknesses were subjected to fire tests with a numerical model developed based on the results. The test results demonstrate that current codes governing cover thickness adequately address fire resistance. The structural behavior of PT slabs was analyzed based on thermal responses for concrete and steel. Numerical modeling of heat transfer and coupled thermomechanical analyses was validated by comparison with fire test results. To investigate the influence of cover thickness on fire resistance performance, a parametric study to develop a numerical means of analysis was conducted and evaluated. With a load level of up to 40% of nominal flexural capacity at the specified cover thickness of 45 mm or larger, current codes were proven to be adequate to ensure the target safety. The authors hope that identified influencing factors of fire resistance performance of PT slabs and the proposed numerical modeling method may be helpful in design of bonded PT concrete slabs with unrestrained conditions.
Introduction
Fire poses a severe threat to human life, structures, and natural habitats. According to World Fire Statistics (Brushlinsky et al. 2021), 27–57 countries annually reported 2.5–4.5 million number of fires with 17,000–62,000 fire-related fatalities between 1993 and 2019. In 2019, residential structure fires accounted for 22.4% of all fires in 24 countries and 83.6% of fire deaths in 16 countries. Thus, passive and active fire protection approaches utilizing fire suppression systems, prescriptive fire designs, fire-resistant materials, and development of performance-based codes have been studied (e.g., Kodur et al. 2019; Purkiss and Li 2014).
To empirically examine the fire resistance performance of structures, fire testing methods (ASTM 2020; ISO 1999; Ryan and Robertson 1959) are defined in terms of specimen dimensions, furnace temperature, measurement settings, loading conditions, and conditions of acceptance. Prescriptive design codes (ACI 2014; ICC 2017), which specify the minimum duration of fire resistance, consider variables including aggregate type, restraint condition, and fire resistance ratings.
Given the increase in demand for posttensioned (PT) concrete structures, which utilize diverse components such as prestressing steel, anchorage systems, ducts and sheathing, and coating systems, additional factors for fire resistance are emphasized and are being researched (Bailey and Ellobody 2009; Gales et al. 2011).
Bailey and Ellobody (2009) conducted eight fire tests on bonded PT concrete slabs with different types of ducts, aggregate, and axial restraint conditions. Fire test results indicated that larger thermal expansion of Thames gravel aggregates than of limestone aggregates contributed to increased vertical deflection, resulting in diminished fire resistance performance. Specimens subjected to axial restraint experienced a longitudinal restraining force causing an induced moment and accompanying arch action that reduced vertical deflection at the center of the specimen, resulting in increased fire endurance time.
Gales et al. (2011) conducted 19 stress relaxation tests on unbonded posttensioning steel to evaluate the possibility of steel fracture due to localized heating. Variables considered included length ratio of the heating region, initial prestress level, and soak temperature and time. Test results suggested that strands with longer heating lengths experienced greater prestress relaxation but required increased recovery at the cooling stage, whereas strands with shorter heating lengths underwent less thermal expansion but were more susceptible to steel rupture. In addition, the effect of creep deformation was significant within the temperature range 300°C–400°C, indicating the importance of considering creep strain when modeling, given that the critical temperature denoted for prestressing steel is 426°C in ICC (2017) and 350°C in EN 1992-1-2 (CEN 2004).
Recently, as tunnel fires have become a concern in structural engineering, their risk and structural damage aspects have been explored. Hua et al. (2022) experimentally investigated the parameters (polypropylene fibers used in concrete, posttensioning restraint level, and fire intensity and duration) that may influence the structural performance of a tunnel during and after fire exposure. They described the following effects of three components: (1) polypropylene fibers reduced concrete spalling; (2) a lower level of restraint achieved by posttensioning damaged specimens more quickly, and the restraint level was assumed to be influenced by the ground’s hardness; and (3) quick fires caused the least amount of damage, and traveling fire did not significantly differ from other tests. Jeanneret et al. (2020) reported that the importance of slow travelling fire might be critical when evaluating the ultimate stage of structure with prestressing steel rupture. Experimental results determined the thermal boundaries for prestressing steel types AS/NZ 4672 and BS 5896, and revealed that severe stress relaxation or steel rupture occurred between 340°C and 400°C.
Fire tests have the benefit of showing structural and fire resistance behavior on real structures, but drawbacks include cost and environmental limitations. Additionally, it is difficult to examine mechanical-thermal alteration properties within the specimen due to the high temperatures present. Numerical and finite-element analyses have been developed to address these difficulties. These analyses typically are performed in three steps: (1) numerical modeling; (2) heat transfer analysis; and (3) thermomechanical analysis (Biondini and Nero 2011; Gao et al. 2013; Lim et al. 2004a; Raut and Kodur 2011). For numerical modeling of PT structures, Kang et al. (2015) developed a nonlinear finite-element analysis model for bonded and unbonded PT members that addresses topics such as interaction between reinforcement and concrete coupled with prestressing procedures. Kang and Huang (2012) analyzed attributes for PT members used in Abaqus software by calibrating input model properties such as dilation angle and viscosity parameter with suggested default input property values and modeling methods for anchorage constraint conditions and element type. For thermomechanical analysis, heat transfer analysis is required to obtain time-series temperature data of meshed elements. Raut and Kodur (2011) defined fire temperature and performed heat transfer analysis. The temperature for each segment using heat transfer analysis and fire-induced axial restraint was evaluated using the moment–curvature relationship.
Nonlinear numerical modeling methods were developed to evaluate the influencing factors of conventionally reinforced concrete slabs under fire and to enhance the accuracy of finite-element analysis. Wang et al. (2013) proposed a transient strain model of concrete and analyzed the three-stage response mode and fire resistance of RC slabs. The effects of concrete transient strain, steel creep strain, and concrete and steel thermal strains, which are the indicators of fire resistance of slabs, were presented. Lim et al. (2004b) performed thermal and structural analyses of a discrete Kirchhoff quadrilateral shell element. The debonding of the steel decking resulted in difficulty in predicting behavior of composite slabs, whereas the analysis result revealed the membrane action at the initial phase of fire exposure of two-way slabs. Kodur and Bhatt (2018) discussed the fire behavior of fiber-reinforced polymer-strengthened concrete slabs. The numerical approach succeeded in predicting the response of slabs in terms of capacity, strains, and deflections.
In this study, fire tests and nonlinear numerical modeling were conducted to investigate the thermal-structural behavior of bonded PT slabs. The modeling of the bonded PT slabs was verified using the fire test results. Parametric studies were performed and the effects of variables such as concrete cover thickness and heating time were evaluated, which have not been investigated thoroughly.
Experimental Program
Test Specimens
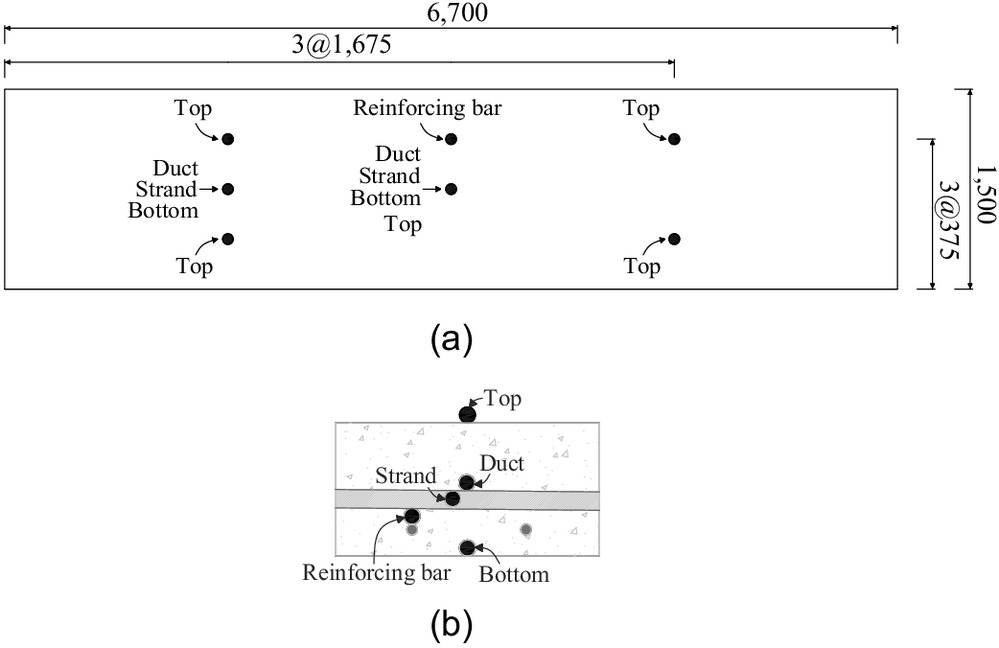
The experimental program was conducted by performing fire tests on two bonded PT concrete slabs, designated B250 and B280. The dimensions and tendon profile of the slabs were determined with reference to ACI 216.1 (ACI 2014) or ICC (2017), ACI 318 (ACI 2019), and ASTM E119 (ASTM 2020). All slabs were designed to resist a 6-m-long fire test. Each slab was 6,700 mm in length and 1,500 mm in width.
To meet the minimum cover thickness standards for specified fire resistance endurance times (2 and 3 h) in ACI 216.1 (ACI 2014) or ICC (2017), the slab height and cover thickness for the fire test were 250 and 45 mm, respectively, and 280 and 60 mm, respectively. Reinforcement for each slab consisted of two 13-mm-diameter bars for lower longitudinal reinforcement, two bars for upper longitudinal reinforcement, and stirrups at a spacing of 275 mm along the length of the slab for transverse reinforcement. Six additional hairpin bars and stirrups were installed at both ends of the slab to resist posttensioning stresses. KS D 3504 steel with a yield strength () of 400 MPa was used for the bars and stirrups. The tendon profile was parabolic, with a minimum cover thickness at the slab center. Six seven-wire strands were installed in the slab, with two strands placed in each of the three metal ducts. KS D 7002 steel was used for the strands. Based on tensile strength tests, the yield strength (), ultimate strength (), and elastic modulus () of the steel strands were 1,670, 1,896, and 200,000 MPa, respectively. Fig. 1 shows front and cross-sectional views, anchorage details, and the tendon profile of the B250 slab.

Pouring of concrete was accomplished using a single batch, with a target compressive strength of 40 MPa. Concrete mix proportions per are provided in Table 1. Siliceous aggregate was used in the mix. The concrete was steam-cured due to the low temperature. A high moisture content was observed at fire testing.
| Specimen type | Cement () | Fine aggregate () | Coarse aggregate () | Water-reducing agent () | Water () | Water–cement ratio (%) | Slump (mm) | Concrete strength at jacking date (MPa) | Concrete strength at fire test date (MPa) |
|---|---|---|---|---|---|---|---|---|---|
| B250 | 468 | 783 | 953 | 4.8 | 165 | 35.3 | 150 | 26.2 | 42.0 |
| B280 | 468 | 783 | 953 | 4.8 | 165 | 35.3 | 150 | 26.2 | 46.3 |
When the test specimens were subjected to jacking and fire testing, the average compressive cylinder strengths for concrete were examined using the method specified in ASTM C 39 (ASTM 2014). The cylinder test results are presented in Table 1.
Jacking of each strand was conducted at Day 23 after the curing of the concrete. At the time of jacking, the compressive strength of the concrete was 26.2 MPa. For jacking, a hydraulic single-strand jack was employed, and the following locations of strands were jacked to distribute tensile stresses uniformly and prevent damage to the slabs: (1) the outermost strand on the left and right; (2) the two center strands; and (3) the two strands. All strands were jacked to 200 kN () at the live ends, and the pressure change of the hydraulic jack was utilized for checking the tensile force variations.
Instrumentation
The slabs were equipped with a LVDT and Type K thermocouples. For monitoring vertical deflection, a single-wire LVDT was installed from the hydraulic jack to the center of each slab. Using the LVDT, deflection and deflection rate were monitored to ensure acceptance conditions specified in ASTM E119 (ASTM 2020). Each slab was instrumented with 15 thermocouples, and the furnace was self-equipped with thermocouples to monitor the fire temperature. Thermocouples were located along the reinforcing bar, strand, and concrete to measure variation of temperatures during the fire tests. Fig. 2 shows locations of installed thermocouples.
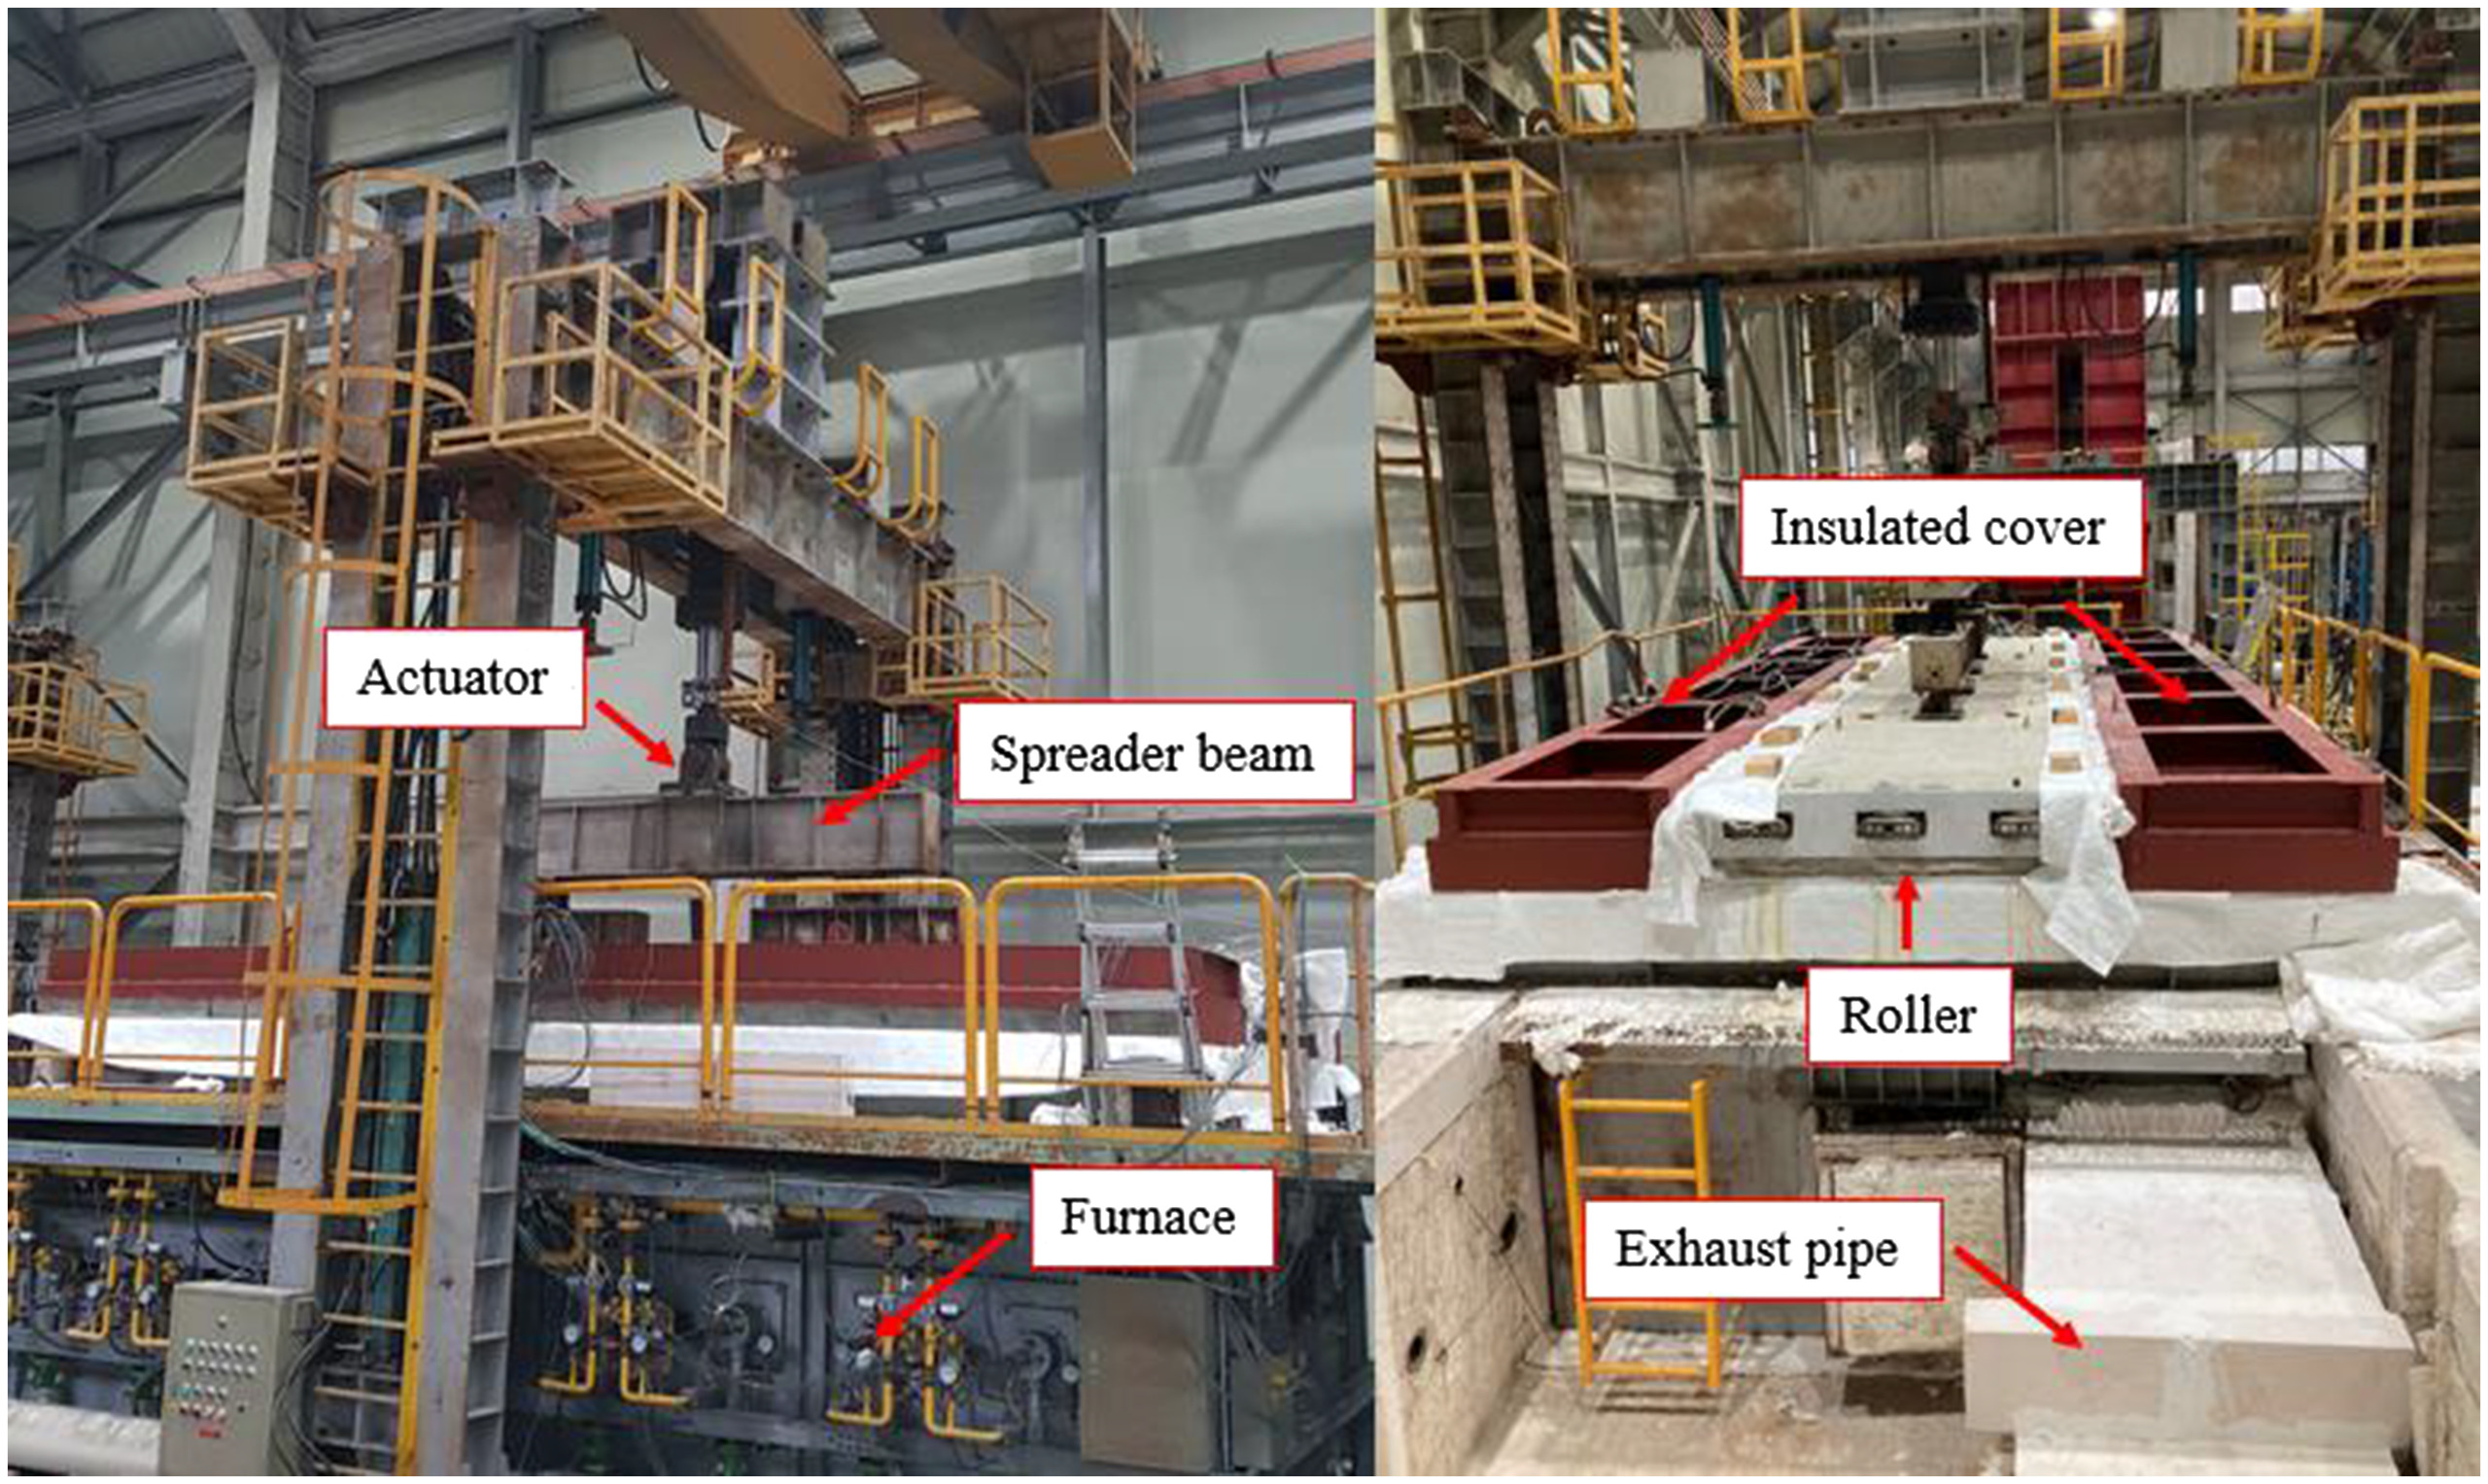
Test Settings and Procedure
The exhaust pipe, furnace, inside column, insulated cover, roller, spreader beam, and hydraulic jack comprised the fire test setup. The dimensions of the furnace were , with a column erected within the furnace to protect the furnace by limiting the deflection of slabs after a fire-damaged collapse. During the fire tests, the exhaust pipe and insulated cover were installed to maintain the inside pressure of the furnace and block heat penetration. An actuator, composed of a spreader beam and a hydraulic jack, was located at the center of the slab. Four steel plates were attached at the bottom of the spreader beam at 525-mm intervals to distribute applied loads. Until the end of the fire tests, 120 kN (including the self-weight of the slab) was applied continuously to the slab using an actuator. Based on analytical calculation, the ratios of moment demand to capacity for the 250- and 280-mm-thick slabs were 40% and 37.5%, respectively. Axial restraint conditions were set to be free, with the slabs simply supported on the circular cylinder rollers at a span length of 6,200 mm. Fire test settings are shown in Fig. 3.
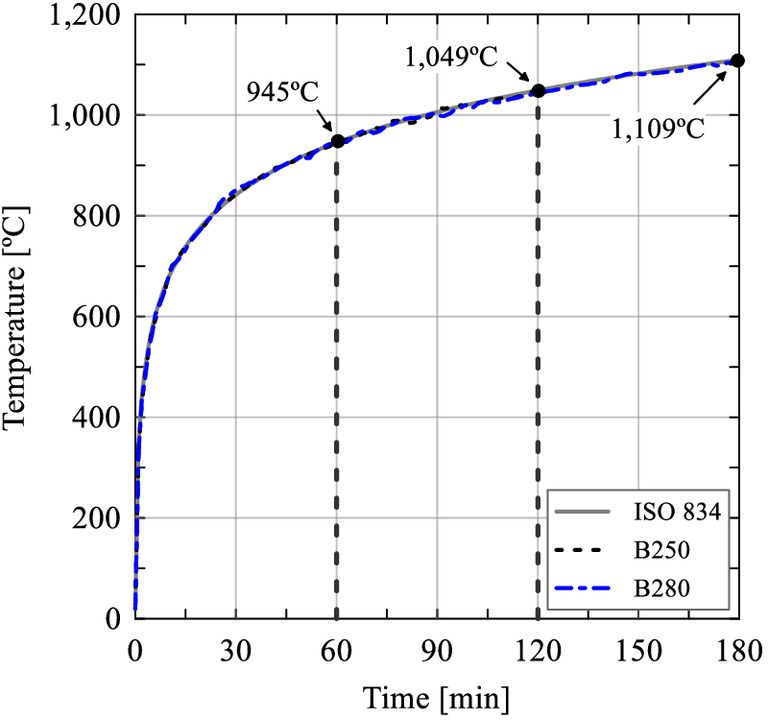
Testing employed two steps: (1) application of the vertical load for 10 min prior to heating of the slab; and (2) application of the fire load for the designed duration (2 and 3 h). Furnace temperature followed the ISO 834 (ISO 1999) standard time–temperature curve. Fig. 4 shows the ISO 834 curve (ISO 1999) and the measured furnace temperatures using Type K thermocouples for every fire test. Failure criteria for slabs were when the deflection, deflection rate, or strand temperature exceeded the acceptance condition specified in ASTM E119 (ASTM 2020).
Fire Test Results
Fire tests of 2- and 3-h duration were conducted on B250 and B280, respectively. All slabs endured the intended fire endurance time, leaving additional fire resistance performance. This study investigated the fire resistance performance of two slabs in terms of thermal response, structural response, and the propagation of concrete cracks.
Thermal Response
Fig. 5 shows the thermal responses of B250 and B280. Each slab was subjected to fire in accordance with the ISO 834 temperature curve (ISO 1999). The measured temperature at the bottom of the slabs demonstrated that the inner pressure of the furnace and the intensity of heat corresponded to the designated fire.

Previous studies (Dwaikat and Kodur 2010; Kodur 2000; Zheng et al. 2010) indicated that high-strength concrete used in PT concrete is susceptible to spalling when subjected to fire. Spalling of the concrete surface reduces sectional area and facilitates heat penetration to the detriment of the structure.
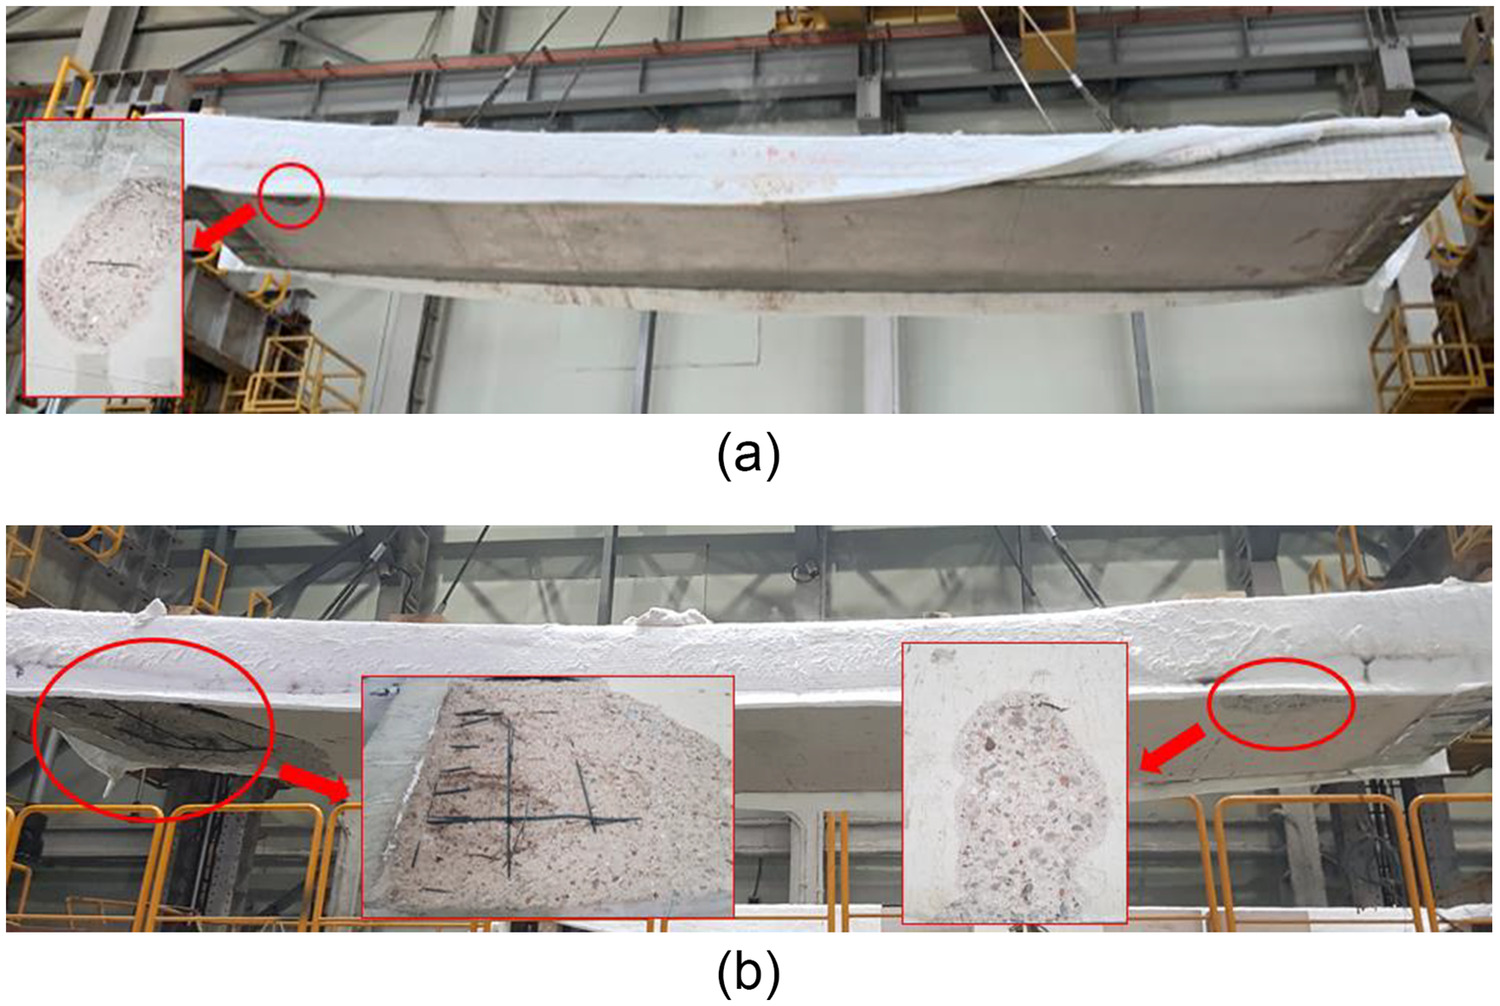
After completing fire tests, the bottom of each slab was examined. Negligible concrete spalling was observed; concrete spalling was limited to the depth of the location of the reinforcing bars (Fig. 6).
The temperature of the strand steadily increased during the initial phase but stabilized when temperatures reached 120°C and 200°C for B250 and B280, respectively. Observation of temperature variation is also shown in measured data of the duct, which stabilized at temperatures of 120°C and 90°C, respectively. The perceived reason for the plateau period is the evaporation of free water within the concrete (Raut and Kodur 2011). The temperature of the duct remained steady after reaching 100°C–120°C, but the strand temperature decreased after reaching its peak. It is thought that this was caused by the evaporation of free water within the concrete. The steam flowed along the path of the duct, creating constant temperature layer along the duct, even though grout filled the duct. The outside region of the strand (duct) maintained its temperature in the range 100°C–120°C, and the temperature of the strand decreased from 150°C–200°C to close to that of the duct.
In contrast, the temperature of the reinforcing bar constantly increased. The reinforcing bar was below the tendon, and therefore was less prone to the effect of water evaporation. The top of the slabs was affected by the fire the least. After 2 h of exposure to fire, there was a temperature rise of 20°C and 10°C in B250 and B280, respectively. It is assumed that the low thermal conductivity of concrete contributed to the slight increase in temperature at the top. B280 experienced less of an increase as the slab height expanded.
The effect of cover thickness was investigated by comparing the strand temperature increase rate of B250 and B280. The B250 strand temperature increased from 14.5°C to 100°C between 16 and 37 min after the fire test began. In the case of B280, the strand temperature increased from 7.5°C to 100°C between 25 and 58 min. The temperature rise rate of B250 and B280 was and , respectively.
In PT concrete structures, the tendon is primarily responsible for flexural performance of the member. EN 1993-1-2 (CEN 2005) specifies degradation of tensile strength and elastic modulus of prestressing steel at elevated temperatures, and ASTM E119 (ASTM 2020) notes that the critical temperature of cold-drawn prestressing steel is 427°C. The rate of temperature increase of the steel has a substantial effect on the fire resistance performance of the PT concrete structure. Because increasing cover thickness implies increasing the slab thickness, the target fire endurance time and the slab size should be in balance.
Structural Response
All slabs satisfied ASTM E119 (ASTM 2020) acceptance criteria for deflection and deflection rate. The variation of deflection and deflection rate for B250 and B280 is shown for each stage in Fig. 7. The deflection rate curve was filtered using the moving average method (Dumont et al. 2016) to reduce the noise caused by use of the wire LVDT.
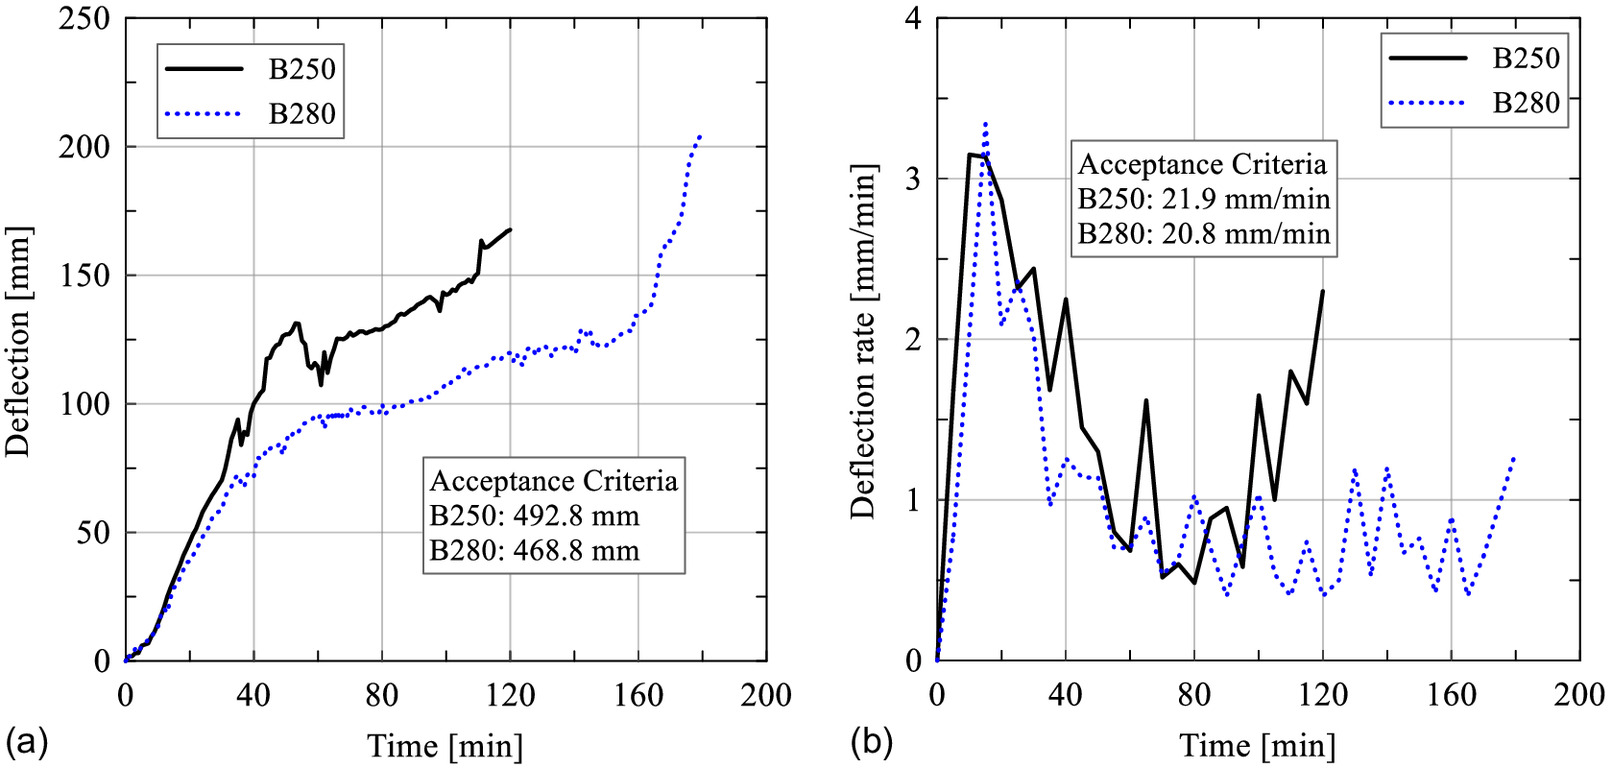
During the first stage, all slabs experienced a rapid increase in deflection; at 45 min, the deflection of B250 and B280 was 120 and 85 mm, respectively. The temperature at the bottom of the concrete increased to 885°C at 45 min, which is the temperature at which concrete significantly loses strength and stiffness (CEN 2004), whereas strand temperature increased slightly. Thus, the first stage of rapid deflection increase was deemed to be the result of concrete strength and stiffness degradation along the bottom layer.
In the second stage, the deflection rate increase slowed; the deflection of B250 was 170 mm at 120 min, and that of B280 was 135 mm at 160 min. The concrete temperature rate increase slowed, but the strand temperature increased from 100°C to 200°C. The experiment showed that the increase in temperature above 100°C of the strand began to damage the PT system, with a steadily increasing rate until reaching 200°C (Fig. 5). As per Eurocode 2 (CEN 2004), the stiffness and strength of both reinforcing steel and prestressing steel start to degrade at 100°C. The elevated temperature of the reinforcing bars and prestressing strands resulted in member deflection, although slower than that in the first stage. The dominant reason for the steady increase of deflection was the degradation of the steel material properties. Additionally, the results imply that eventual structural failure is highly dependent on the steel system.
For B250, two stages of deflection variation occurred, whereas B280 had an additional stage. In the third stage, the deflection of B280 increased by 70 mm (from 135 to 205 mm) in only 20 min. Although the strand temperature slightly decreased during this third stage, the sustained load and heat resulted in yielding of the strand and rapid deflection. The measurement of the strand temperature may have been interrupted by the evaporation of free water within the concrete. According to the numerical study, which is discussed subsequently, the strand temperature may have risen over 300°C, resulting in rapid deflection. The three-stage tendency is evident in the deflection rate curve [Fig. 7(b)].
The effect of cover thickness also is shown in Fig. 7. At 40, 80, and 120 min, the recorded deflection for B250 was 100, 130, and 170 mm, respectively, whereas for B280, the recorded deflection was 70, 100, and 120 mm, respectively. The first- and second-stage average deflection rates for B250 were 2.5 and , respectively. The first-, second-, and third-stage average deflection rates for B280 were 1.8, 0.6, and , respectively. The greater vertical deformations for B250 were attributed to heat experienced due to thinner cover thickness, which accelerated loss of strength and stiffness.
Propagation of Concrete Cracks
After completion of the fire tests, the concrete slabs were inspected for cracks and spalling. Fig. 6 shows fire-damaged surface. Fig. 8 shows photos of the propagated cracks found. In B250, minor cracks formed near the center primarily. Thermal shrinkage cracks associated with evaporation of free water were observed on the front surface [Fig. 8(a)]. Propagation of these cracks ceased near the bottom layer of the concrete, indicating that the strands and bar reinforcement sufficiently withstood the induced tensile stresses and loads (heat and static load). Thermal shrinkage cracks and concrete crushing were observed along the width of the top surface [Fig. 8(b)].
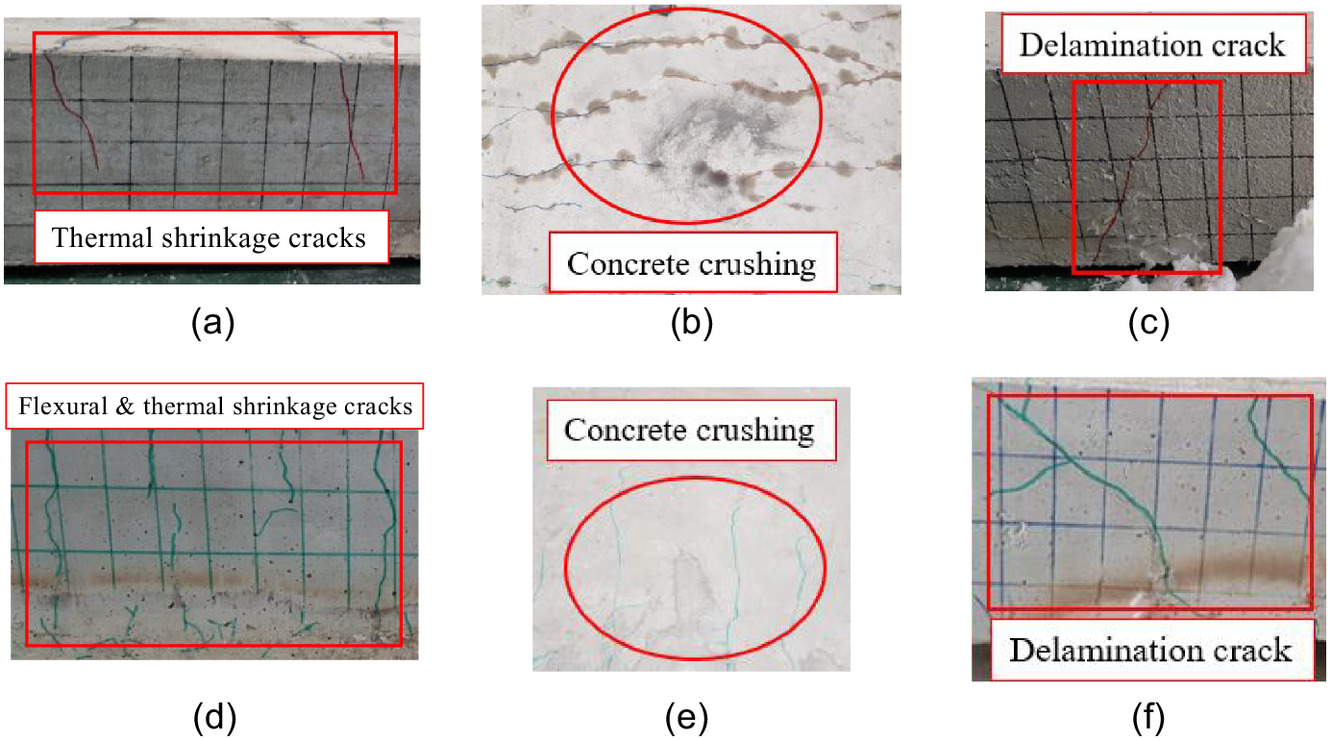
With the increase of heating time, cracks in B280 expanded throughout the specimen surface. Flexural cracks spread from central to support regions and formed links between the top and bottom layers [Fig. 8(d)]. The extent of concrete spalling damage shown in Fig. 6(b) was comparable to that in B250, with a maximum penetration depth of 85 mm. The spalling extent just outside the anchorage zone of the jacking end was limited by the presence of lower reinforcement in B250. However, with accompanying delamination cracks, there was greater damage in B280 due to the the greater cover to reinforcement (50 versus 35 mm).
Delamination cracks were observed at the support regions for all slabs [Figs. 8(c and f)]. Degraded concrete tensile strength (by heat load) and increasing tendon tensile stresses (static load) were assumed to be the reason for the delamination cracks. Additionally, the tendon profile [Fig. 1(e)] had negative curvature at the support regions, trying to split concrete. This delamination crack did not result in the delamination (blow-out) of concrete in the case of B250 (implying that delamination stress influence was insignificant), whereas there was delamination (blow-out) of concrete just outside the anchorage zone for B280 [Fig. 6(b)]. The depth of the delaminated (blown-out) concrete was 135 mm. Delamination (blow-out) with accompanying structural damage facilitated heat penetration and tendon weakening. Because no specimen failed beyond the specified fire endurance time, critical damage tied to concrete delamination was not present in this study.
Numerical Analysis Program
Numerical analysis was performed using finite-element analysis software Abaqus version 6.14. Heat transfer coupled with thermomechanical analysis was performed and compared with the fire test results. The procedure was as follows: (1) numerical modeling; (2) heat transfer analysis; and (3) coupled thermomechanical analysis.
Numerical Modeling
Fire responses (thermal and mechanical) of PT concrete slabs at elevated temperatures are highly dependent on the material properties. Previous studies (ASCE 1992; Bastami et al. 2010; CEN 2004, 2005; Kodur 2014) of property variation estimation for temperature-dependent relationships have been conducted from room temperature (20°C) to high temperatures (600°C–1,000°C). The mechanical and thermal properties defined in the numerical modeling are presented herein.
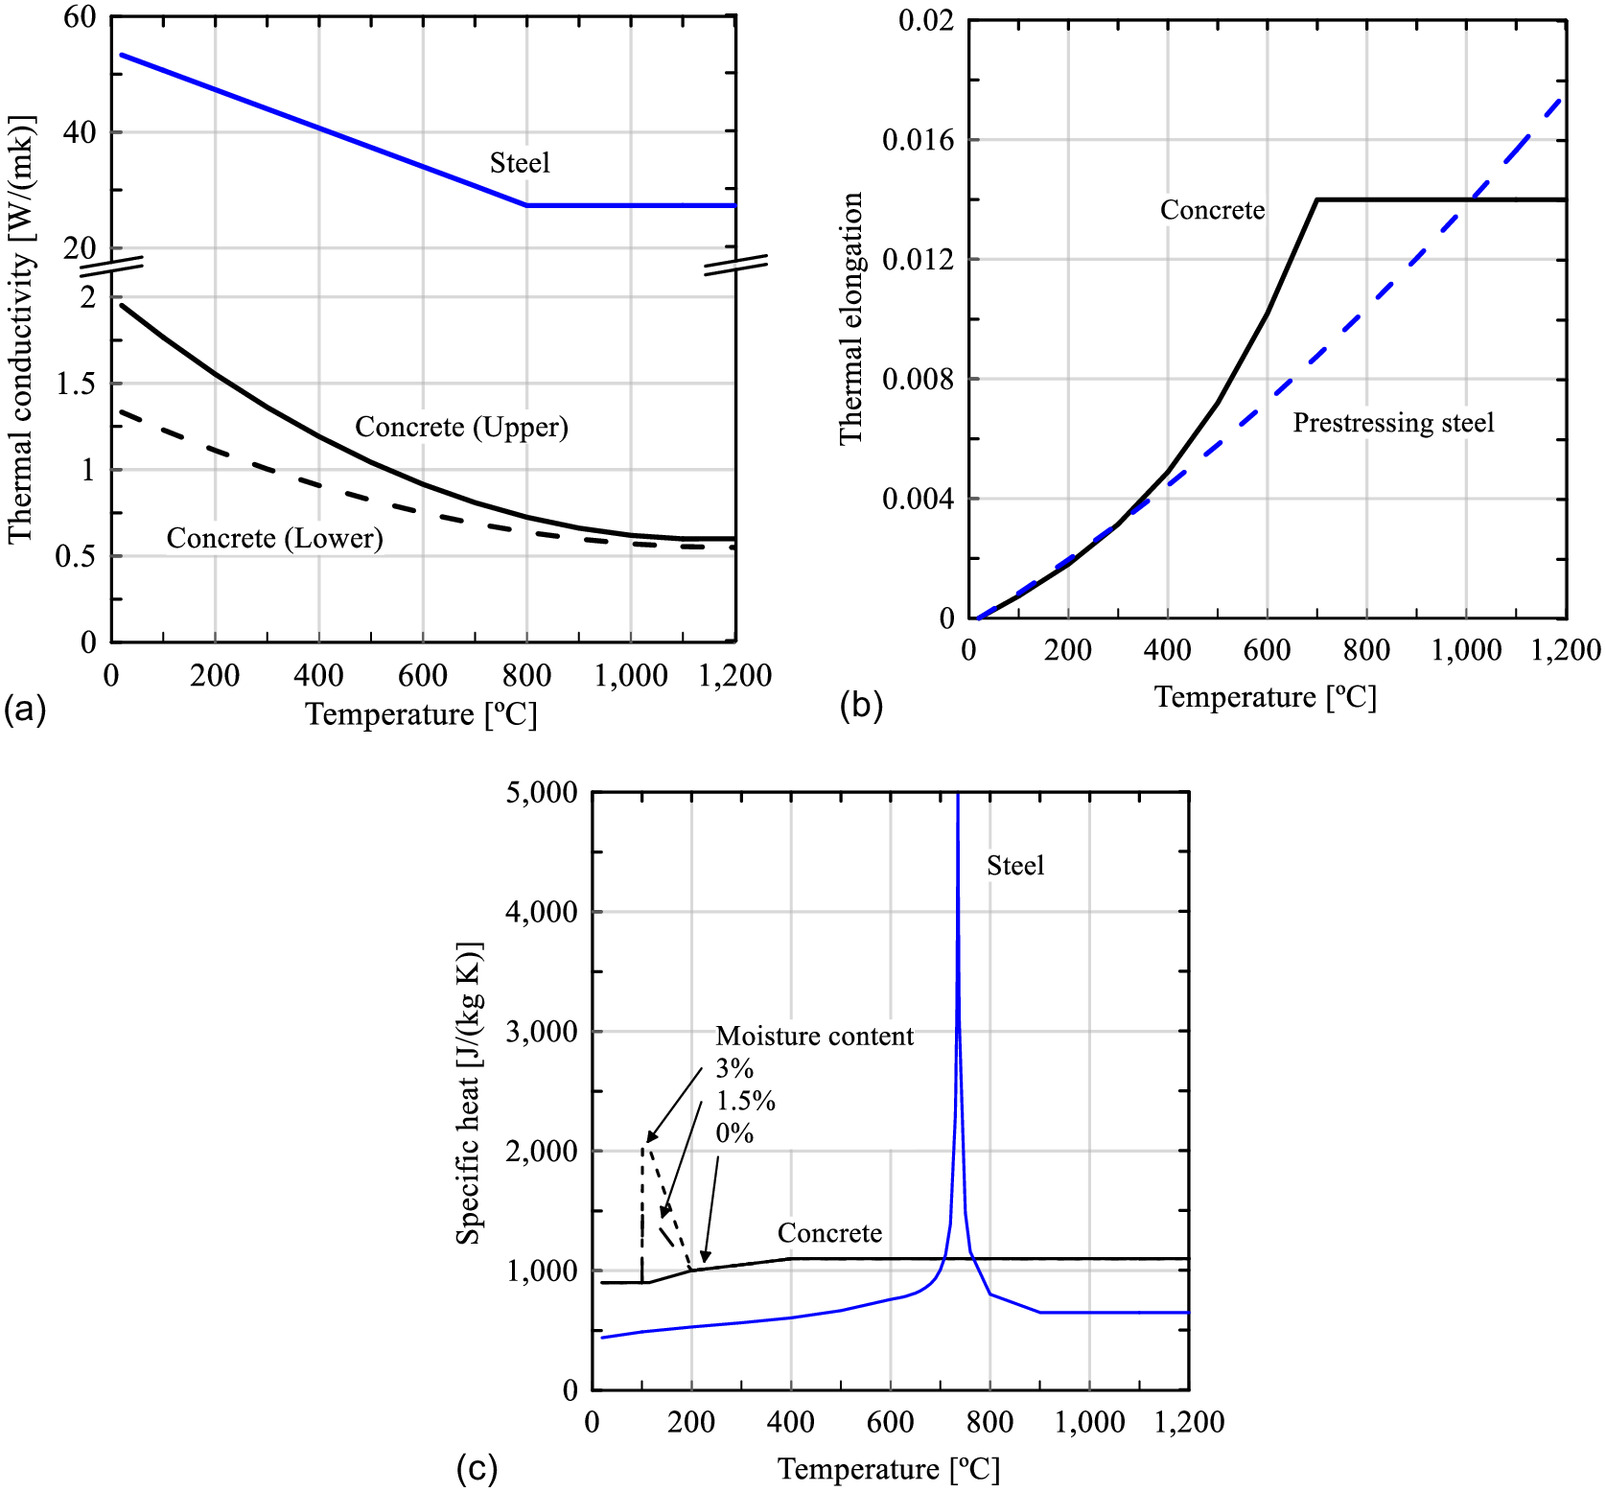
For numerical modeling, thermal properties defined for both concrete and steel (reinforcing bar and strand) were density, thermal conductivity, thermal elongation, and specific heat. Thermal elongation of both materials was defined based on ASCE (1992), with other thermal parameters derived from Eurocode 2 (CEN 2004) for concrete and from Eurocode 3 (CEN 2005) for steel. Due to high moisture within the concrete induced by low temperatures during curing, specific heat modeling followed a 3% moisture content curve and thermal conductivity followed the lower limit provided by Eurocode 2 (CEN 2004). Fig. 9 shows the thermal properties of the concrete and steel at different temperatures.
Mechanical properties defined for both concrete and steel were elasticity and plasticity. The stress–strain relationship, elastic modulus, and Poisson’s ratio parameters followed the model defined in Eurocode 2 (CEN 2004). Although an explicit thermal creep model might enhance the accuracy of the numerical model, the implicit creep model considered in Eurocode 2 (CEN 2004) was assumed to be adequate in this fire analysis. Plasticity models for concrete and steel were a damaged plasticity constitutive model and a plasticity model, respectively. Dilation angle, eccentricity, ratio of initial equibiaxial compressive yield stress to initial uniaxial compressive yield stress (), ratio of second stress invariant on the tensile meridian (), and viscosity were primary factors of the damaged plasticity model. Table 2 presents input values calibrated by Kang and Huang (2012) for numerical modeling of PT concrete structures. Based on Eurocode 2 (CEN 2004), compressive and tensile stress–strain curves of concrete and steel in plastic region were defined with temperature range from 20°C to 1,000°C.
| Dilation angle (degrees) | Eccentricity | Viscosity | ||
|---|---|---|---|---|
| 50 | 0.1 | 1.16 | 0.67 | 0.005 |
Source: Data from Kang and Huang (2012).
Heat Transfer Model
Heat transfer analysis was performed prior to coupled thermomechanical analysis, and the results were compared with the fire test results to validate the numerical modeling. In performing heat transfer analysis, the meshed element type for concrete was an eight-node linear heat transfer brick (DC3D8), and the meshed element type for steel (reinforcing bar and strand) was a two-node heat transfer link (DC1D2). The PT model’s temperature field was generated using three modes of heat transfer: conduction, convection, and radiation.
Conduction is defined as the transfer of heat through the body of a structure, whereas convection and radiation are defined as the transfer of heat at the structure’s surface with surrounding conditions (Gao et al. 2013). In the fire test, the heat generated from the furnace was transmitted to the structure by heat convection and radiation, with accompanying heat conduction from the heated surface to the whole region of the slab. Heat convection and radiation also occurred at surfaces exposed to the outside air, which decreased the slab’s temperature.
The temperature gradient in heat conduction is described by Fourier’s differential equation (Purkiss and Li 2014)where = specific heat capacity; = conductivity; = inherently generated heat; and = density. In the heat transfer analysis, the parameters for concrete and steel were defined as previously mentioned, and was negligible ().
(1)
The temperature gradient in heat convection and radiation is described by the Robin boundary condition (Purkiss and Li 2014)where = convective heat transfer coefficient; = outward normal direction of member surface; = measured fire temperature in furnace; = absolute zero temperature (); is the Stefan–Boltzmann constant []; = heat emissivity of fire; and = heat emissivity of exposed surface. According to EN 1991-1-2 (CEN 2002), the value of is defined as for a fire-exposed surface and for an air-exposed surface, is 1.0, and is 0.8.
(2)
Coupled Thermomechanical Model
Coupled thermomechanical analysis was performed in three steps: (1) prestressing; (2) loading; and (3) heating. The coupled temperature displacement mechanism was used for analyzing temperature and stress fields together. The assigned meshed element type for concrete was an eight-node thermally coupled brick (C3D8T), and the meshed element type for steel (reinforcing bar and strand) was a two-node three-dimensional (3D) thermally coupled truss (T3D2T). The strand and steel were embedded in the concrete for the fully bonded condition as in the experiments.
Loads at each stage were maintained until the end of the numerical analysis. In the prestressing stage, the tensile force in the strand was applied using the predefined field. An effective prestress load of was defined for all strands, and boundary conditions were set to be pinned at both ends, accepting only -direction displacement. Loading followed the prestressing stage. At the bottom surface, at which supports were located during the fire test, boundary conditions were adjusted to be pin and roller. Using the nodal force option, 30 kN of vertical force was applied at each of the four points at which real loads were spread on the slab. In the final heating stage, the parameters used in heat transfer analysis were defined identically. The heating load was applied using the bottom surface temperatures in the fire tests.
The performance metrics of the numerical model were set to be the temperature field in the heat transfer analysis and deflection in the coupled thermomechanical analysis. In the heat transfer analysis, by measuring the variation of temperature at the bottom and in the reinforcing bars, three modes (conduction, convection, and radiation) were adjusted to match the experimental data. In the coupled thermomechanical analysis, concrete thermal expansion and damaged plasticity were calibrated to achieve appropriate deflection data.
Numerical Analysis Results
Heat Transfer Analysis
Fig. 10 shows results of the heat transfer analysis with differing mesh intervals. The validity of the model was established by comparison with the fire test results. The narrow interval in the direction of height significantly affected the accuracy of the numerical analysis, whereas the effects of the interval in the direction of length and width were minor (Fig. 10).
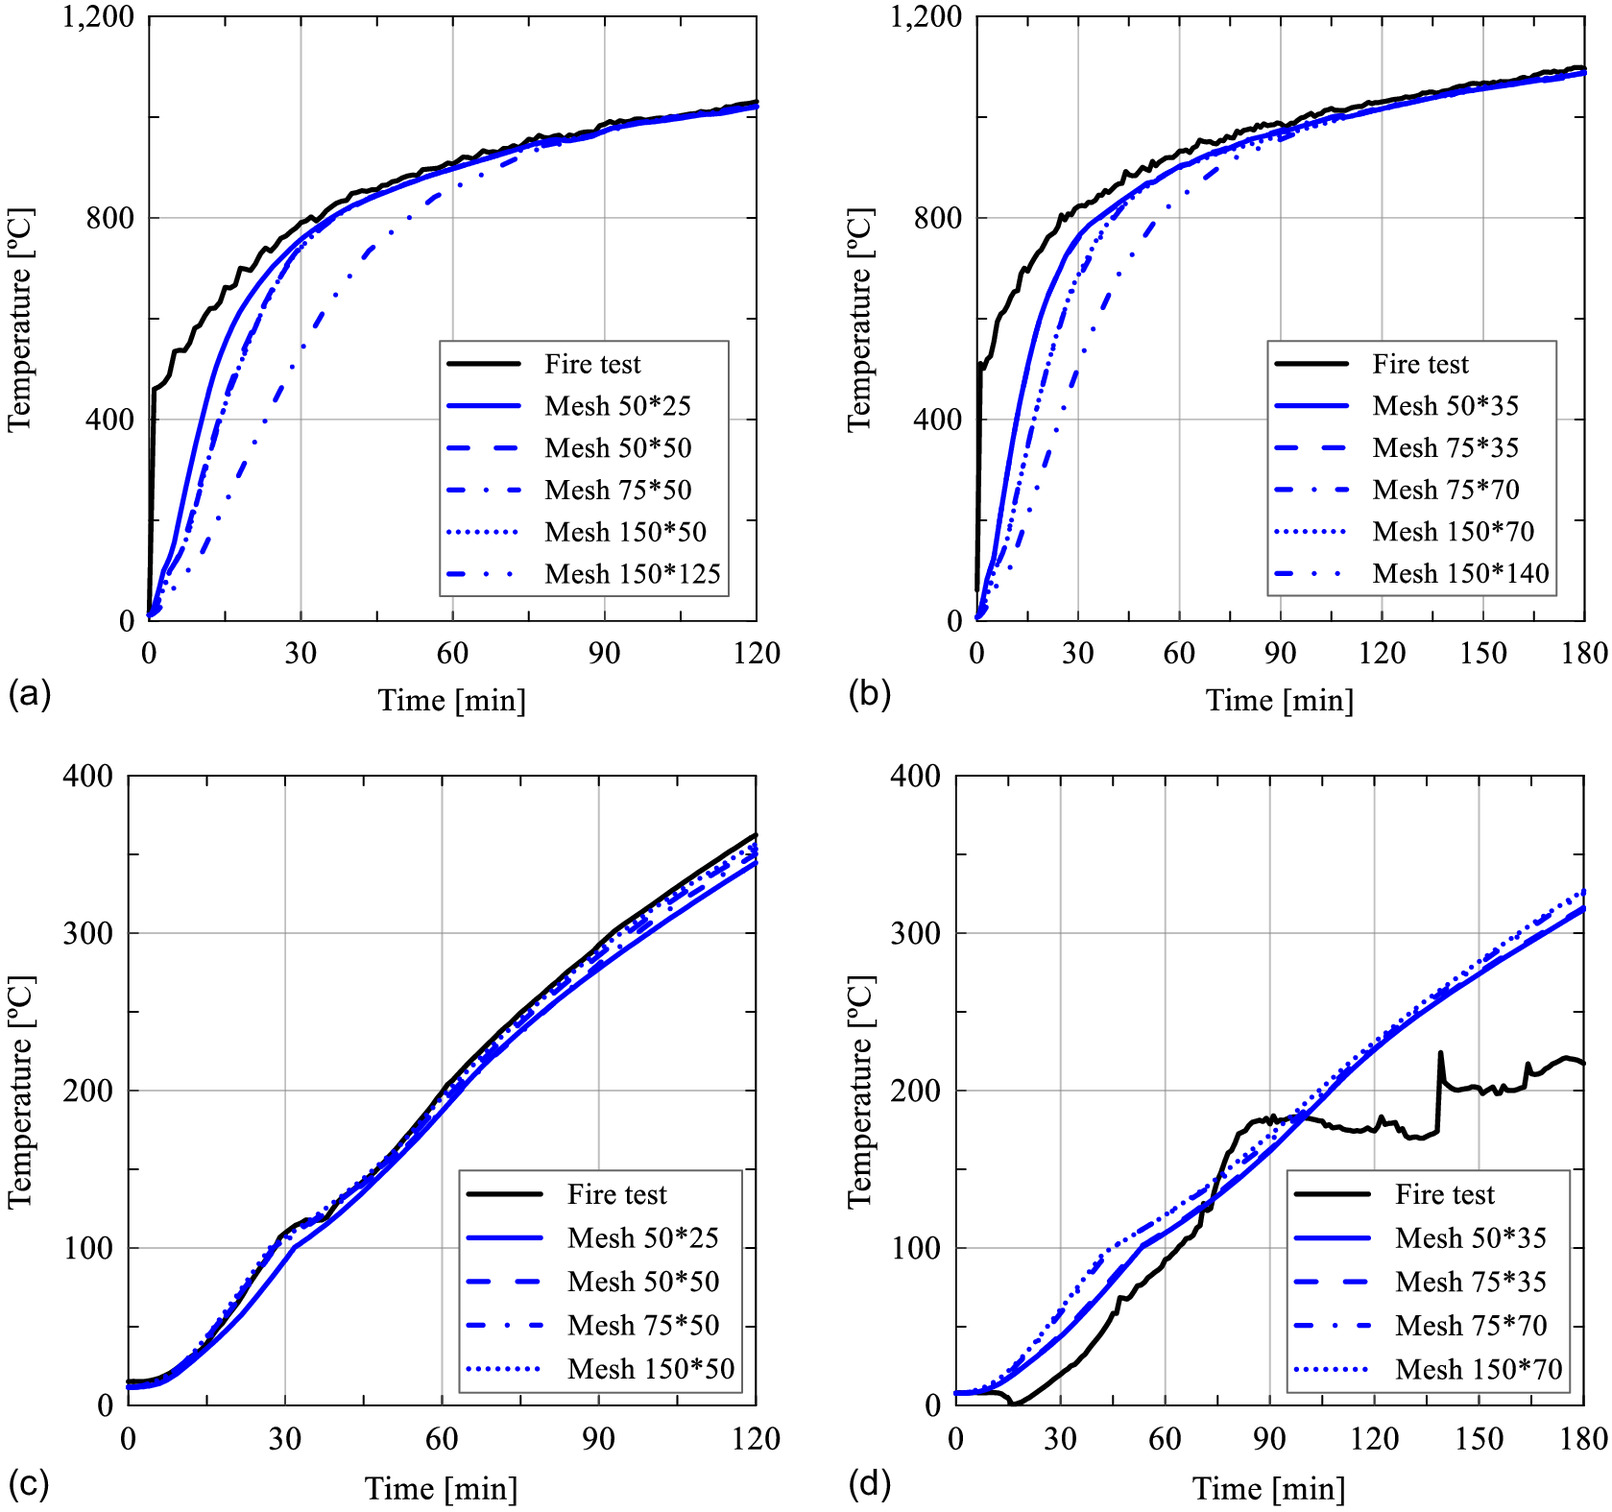
At the concrete bottom surface for B250, the element meshed with a interval converged after 80 min of analysis, whereas the element meshed with a interval converged from the initial phase. This was attributed to the distribution of the heating load, by which the bottom surface was totally heated. At the location of the reinforcing bar, the element mesh interval resulted in minor differences. The analysis results of B250 matched well with the fire test results.
B280 had irregular fluctuations in the end stage, making comparison difficult. Fluctuation at the tendon location in the fire test of B280 was estimated to be the result of evaporation of free water. Excluding the factor of evaporation, the temperature at the reinforcing bar would have increased within the heat transfer analysis.
Considering accuracy and analysis time, mesh intervals of and were selected for the coupled thermomechanical analysis of B250 and B280, respectively.
Coupled Thermomechanical Analysis
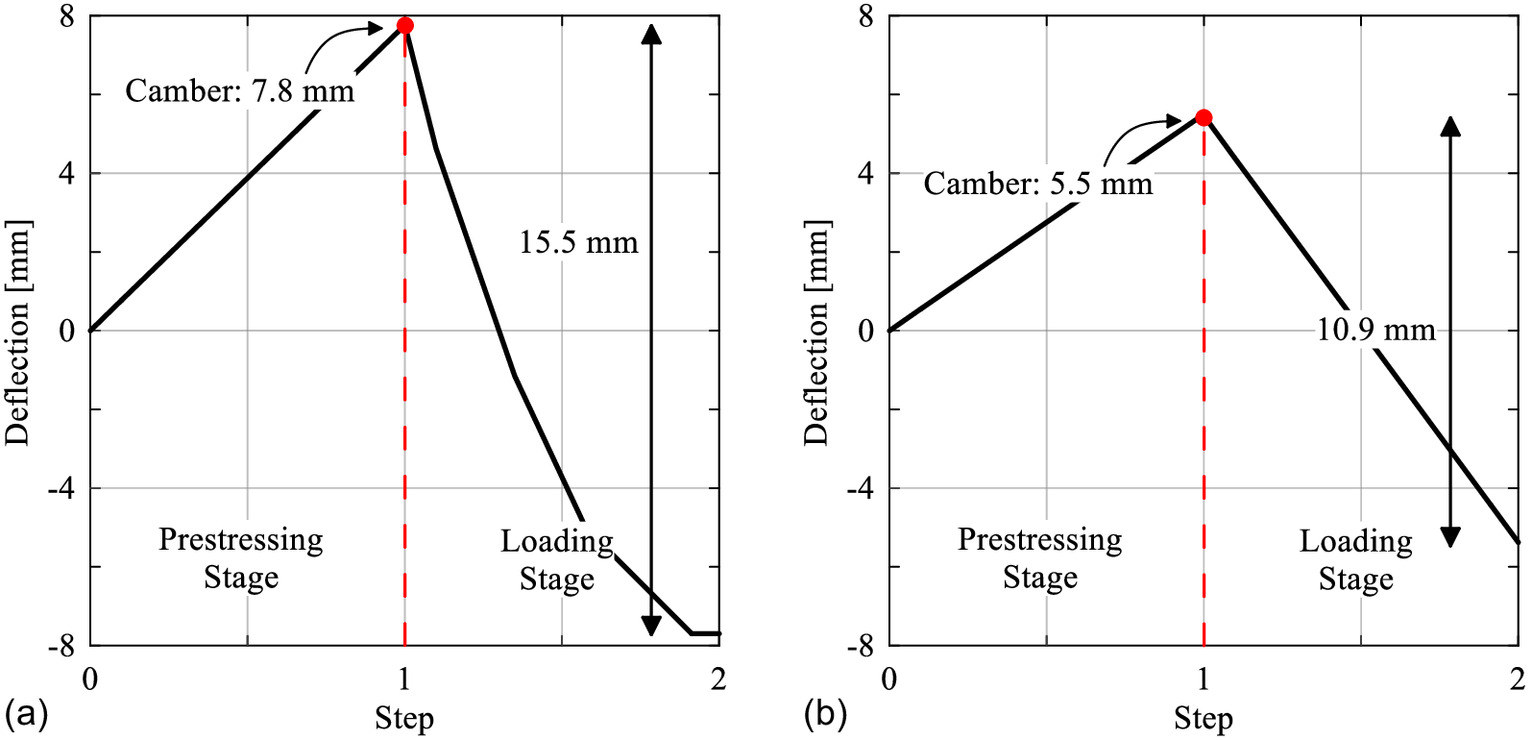
Fig. 11 shows the numerical analysis results from the prestressing to the loading stages. In the prestressing stage, the camber calculated at the center of B250 and B280 was 7.8 and 5.5 mm, respectively. The resulting vertical load deflection of the slab for B250 and B280 was 15.5 and 10.9 mm, respectively, which corresponded to fire test results of 16.2 and 12.1 mm, respectively. In B280, the development of camber and deflection was linear, and there was no change in slope in each stage, indicating that the member maintained its linear behavior without cracking. B250 experienced a slope variation in the loading stage. The trend remained linear, implying that the member just began to crack.
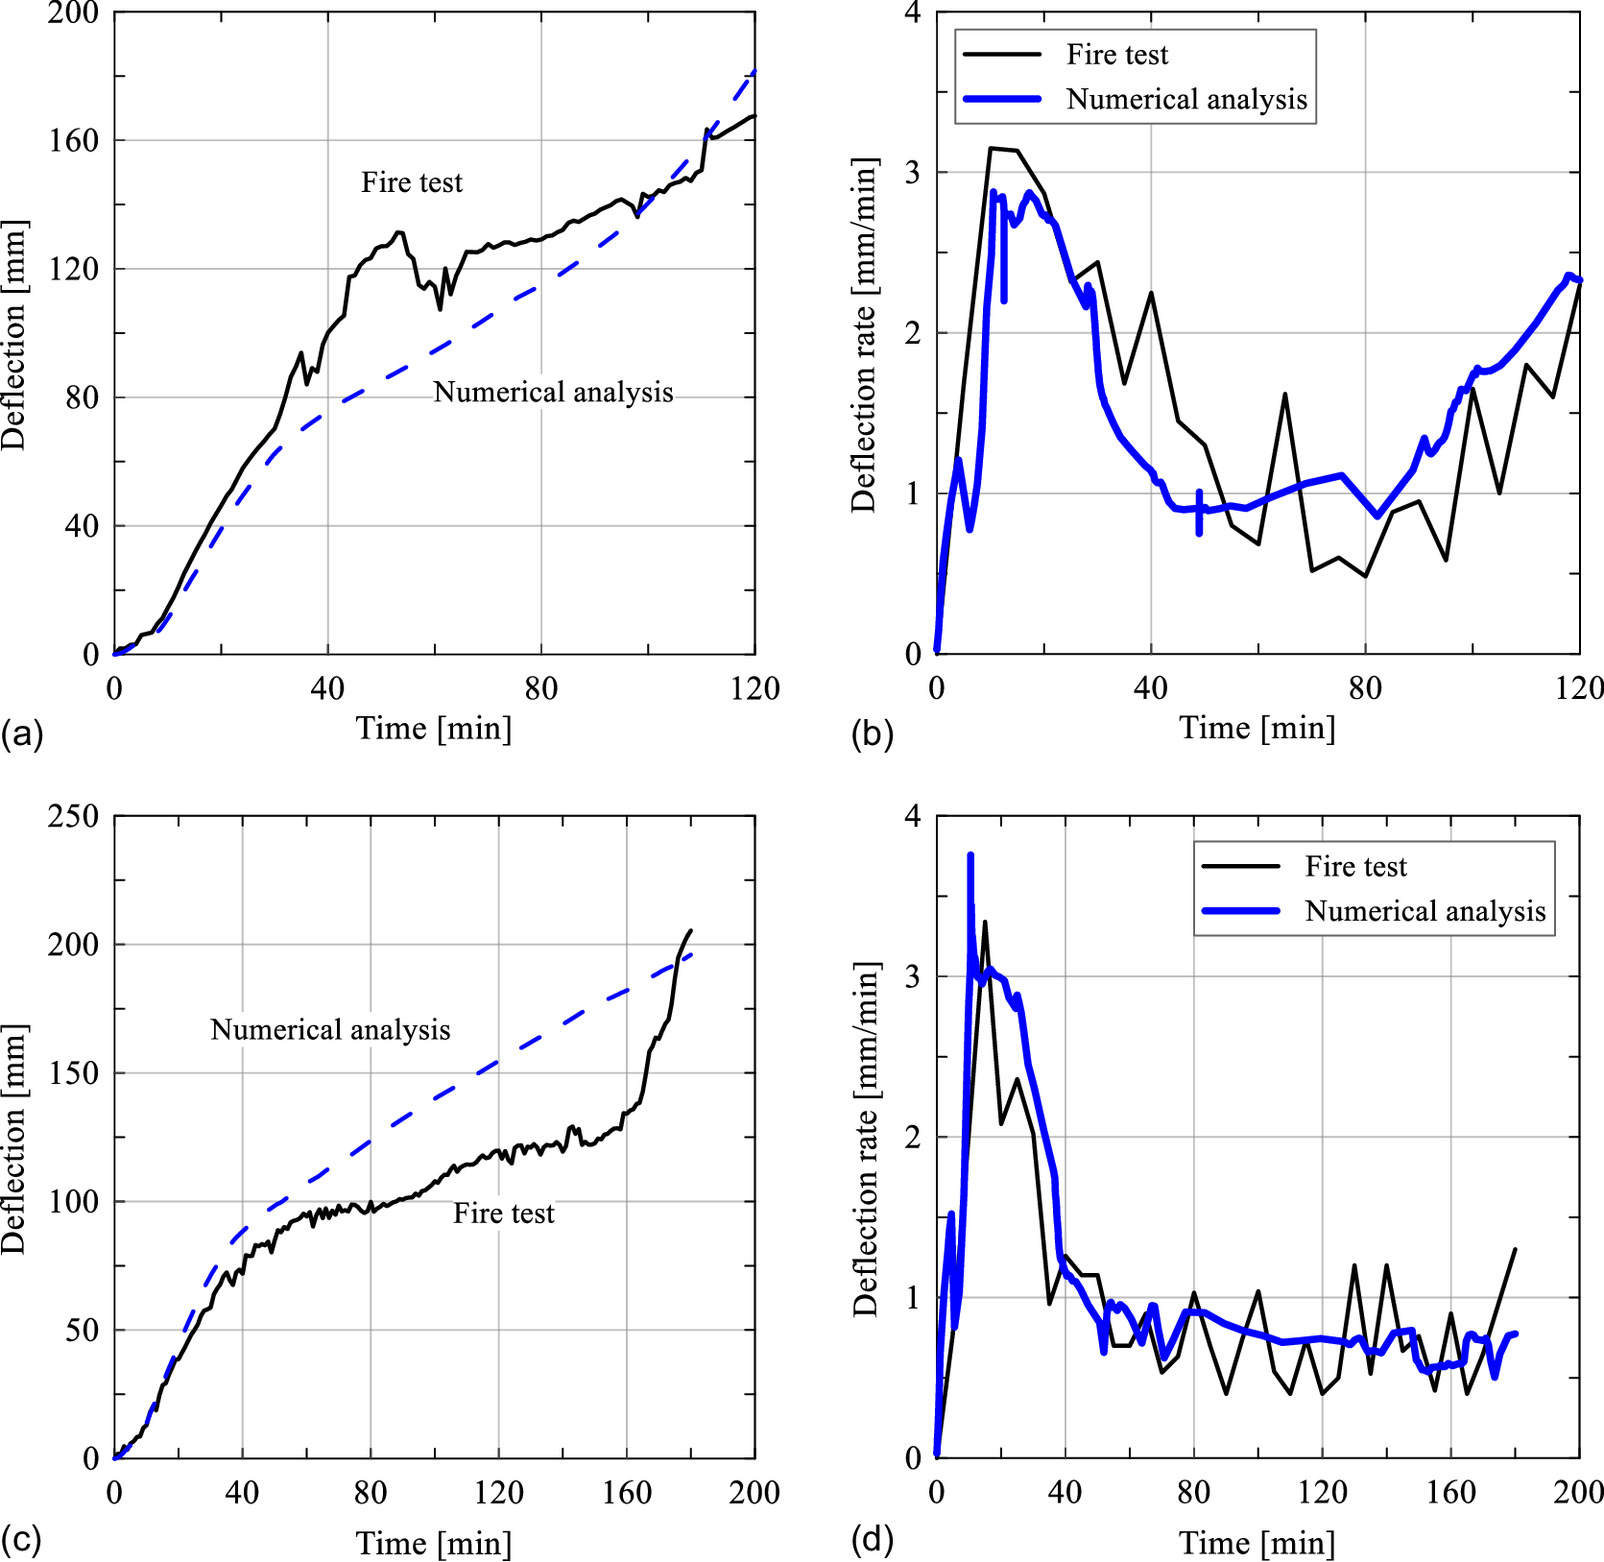
After synchronizing test and numerical analysis results for prestressing and loading stages, the heating stage was prepared. Fig. 12 shows time–deflection curves and time-deflection rate curves of B250 and B280. In both the numerical analysis and the fire test, the initial rapid increase in deflection was estimated identically, but subsequent stagnant growth was computed slightly differed. This difference may be attributed to the wire LVDT used in the fire tests, which can be disrupted by vibrations due to steam or wind. Nevertheless, the ultimate deflection corresponded properly and the rate of increase appeared to be constant, as shown by the time-deflection curve [Figs. 12(b and d)]. Therefore, the numerical analysis method was deemed to be valid.
Parametric Study
The developed numerical model was applied to evaluate the fire resistance performance of PT slabs by varying the cover thickness for fire endurance duration in a parametric study. In the parametric study, the effect of water evaporation, which reduced the temperature of the strand, was eliminated. The strand temperature was assumed to be the same as that of the concrete at the same height. Table 3 summarizes the parametric model conditions. The models were labeled FEA45, FEA60, and FEA70 based on the design cover thickness, which corresponded to levels for 2- and 3-h fire endurance in ICC (2017) and Eurocode 2 (CEN 2004), respectively. The heating period was extended to 240 min (4 h), and temperature and deflection were used to test the fire resistance performance.
| Model | Dimensions (mm) | Cover thickness (mm) | Load level (%) | Heating period (min) | Number of tendons | Initial strand tensile stress (MPa) | Input fire scenario | Boundary condition |
|---|---|---|---|---|---|---|---|---|
| FEA45 | 45 | 40 | — | — | — | — | — | |
| FEA60 | 60 | 37.5 | 240 | 6 | 1,116 | ISO 834 standard fire curve | Unrestrained (simply supported) | |
| FEA70 | 70 | 35 | — | — | — | — | — |
Table 4 presents the temperature of the strand at time steps of 60, 120, 180, and 240 min, respectively. The parametric study results are shown graphically in Fig. 13. Time–strand temperature curves for each model are depicted in Fig. 13(a). At 180 min, the strand temperature of FEA45 exceeded the critical temperature of tensile steel (427°C), reaching 434°C, resulting in considerable deflection of FEA45 [Fig. 13(b)] and early termination. The deflection rate of FEA45 increased dramatically at 170 min [Fig. 13(c)]. However, the analysis result indicates that the current fire design code is well satisfied, with 50 min of safe capacity given that a cover thickness of 45 mm is the specified value for the target fire endurance time of 120 min.
| Model | Time (min) | |||
|---|---|---|---|---|
| 60 | 120 | 180 | 240 | |
| FEA45 | 176 | 339 | 434 | — |
| FEA60 | 130 | 264 | 359 | 428 |
| FEA70 | 111 | 225 | 311 | 379 |
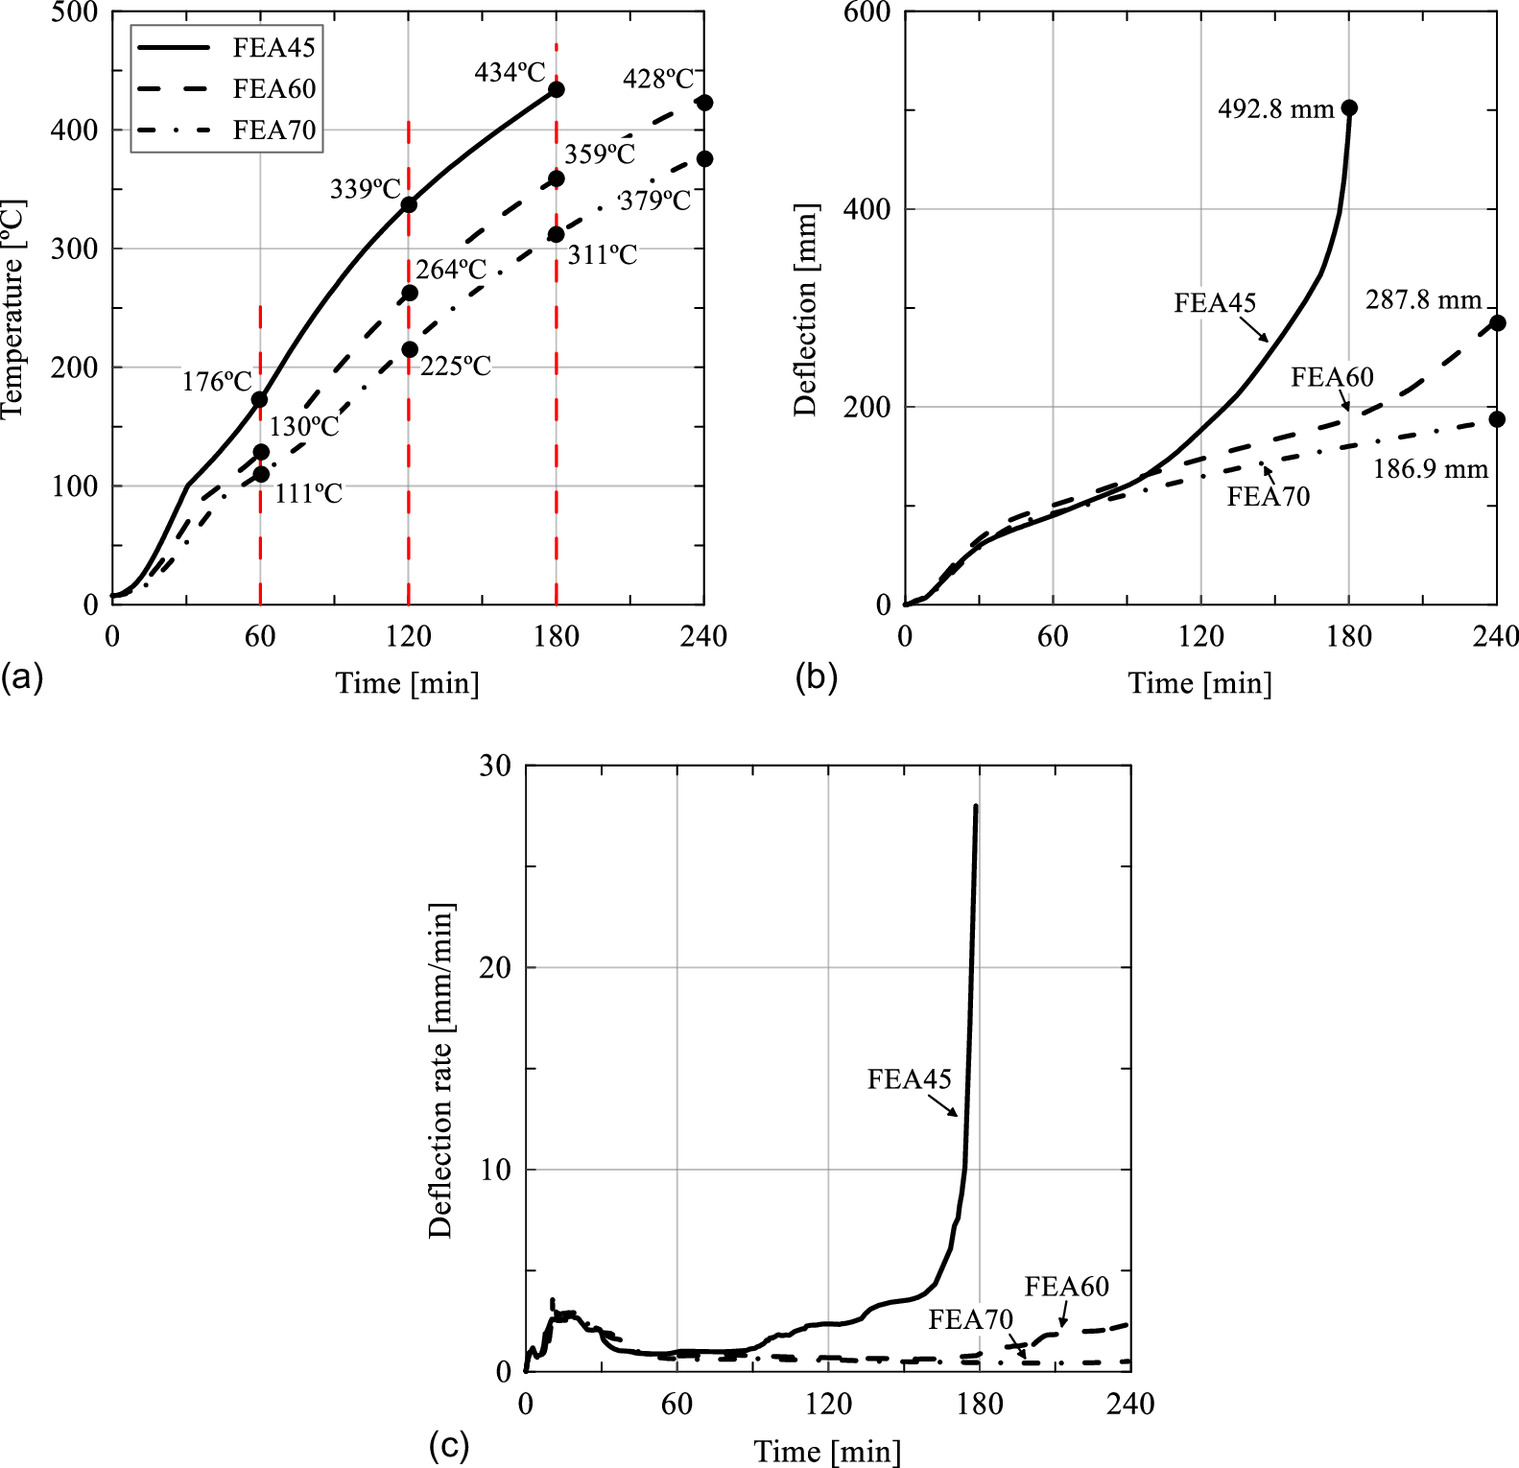
The results of the parametric study are summarized in Table 5. The numerical model and method employed in the analysis indicate applicability to evaluation of fire resistance performance of PT slabs.
| Model | Analysis run time (min) | Tendon end temperature (°C) | Deflection (mm) |
|---|---|---|---|
| FEA45 | 180 | 434 | 492.8 |
| FEA60 | 240 | 428 | 287.8 |
| FEA70 | 240 | 379 | 186.9 |
Conclusions
In this study, the fire resistance performance of bonded PT slabs was investigated through fire testing and numerical modeling. Thermal and structural PT slab behavior was assessed by time-series analysis. The influence of cover thickness at the tendons was compared. A procedure for designing a 3D numerical model for heat transfer with coupled thermomechanical analyses was introduced. Model validity was verified by comparing the analysis result with the fire test result.
In addition, a parametric study was conducted to analyze the fire resistance performance of PT slabs with differing cover thicknesses and extended heating time. Based on the fire test results and numerical analysis, the following conclusions were drawn:
1.
The structural performance of PT slabs subjected to fire is influenced by the temperature change in the concrete and steel, as well as by the loads sustained. Heat-degraded mechanical properties due to a rapid increase in the concrete temperature had a substantial effect on deflection. The thermal insulation performance provided by increased concrete cover delayed heat transmission to the tendon, resulting in lesser strand temperature increases and smaller initial deflection. Sustained heat and loading advanced strand yielding, which culminated in significant deflection.
2.
PT slabs exposed to fire exhibited three types of cracking (delamination, flexural, and thermal shrinkage) along with concrete crushing. Placement of tendons and reinforcing bars had a substantial effect on delaying propagation of flexural cracks, which is essential for fire resistance performance.
3.
The proposed numerical modeling method for heat transfer coupled with thermomechanical analysis was proved to be capable of predicting the thermal and structural responses of bonded PT slabs. Fire resistance performance comparison is possible for adjustment of dimensions and loading conditions, as well as boundary conditions.
4.
The effect of cover thickness was investigated in fire tests and a parametric study. With an increase in cover thickness from 45 to 60 mm (corresponding to the load level of up to 40% of nominal flexural capacity), the strand temperature rise rate in the fire test was reduced from 4.1°C to 2.8°C (31.7% decrease), and the deflection rate at time steps of 40 and 80 min decreased by 36.0 and 33.3%, respectively. In the numerical analysis, it was found that the cover thickness identified had a fire safety capacity of about 180 min for the specified fire endurance (2 and 3 h). A strand temperature of 427°C was discovered to be the bifurcation point for slab collapse.
Notation
The following symbols are used in this paper:
- specific heat capacity [];
- elastic modulus of prestressing reinforcement (MPa);
- ultimate strength of prestressing reinforcement (MPa);
- yield strength of prestressing reinforcement (MPa);
- ratio of second stress invariant to tensile meridian;
- conductivity [];
- outward normal direction of member surface;
- inherently generated heat ();
- measured fire temperature in furnace (°C);
- absolute zero temperature (°C);
- heat emissivity of fire;
- heat emissivity of exposed surface;
- density ();
- Stefan–Boltzmann constant ();
- initial equibiaxial compressive yield stress (MPa); and
- initial uniaxial compressive yield stress (MPa).
Data Availability Statement
All data, models, and code generated or used during the study appear in the published article.
Acknowledgments
This work was supported by the National Research Foundation of Korea (2021R1A5A1032433). The authors express their gratitude and appreciation for the partial support provided by the Institute of Construction and Environmental Engineering at Seoul National University.
References
ACI (American Concrete Institute). 2014. Code requirements for determining fire resistance of concrete and masonry construction assemblies. ACI 216.1. Farmington Hills, MI: ACI.
ACI (American Concrete Institute). 2019. Building code requirements for structural concrete and commentary. ACI 318. Farmington Hills, MI: ACI.
ASCE. 1992. Structural fire protection. New York: ASCE.
ASCE. 1999. “Structural fire protection. In ASCE manuals and reports on engineering practiceNew York: ASCE.
ASTM. 2014. Standard test method for compressive strength of cylindrical concrete specimens. ASTM C39. West Conshohocken, PA: ASTM.
ASTM. 2020. Standard test methods for fire tests of building construction and materials. ASTM E119. West Conshohocken, PA: ASTM.
Bailey, C. G., and E. Ellobody. 2009. “Fire tests on bonded post-tensioned concrete slabs.” Eng. Struct. 31 (3): 686–696. https://doi.org/10.1016/j.engstruct.2008.11.009.
Bastami, M., F. Aslani, and M. E. Omran. 2010. “High-temperature mechanical properties of concrete.” Int. J. Civ. Eng. 8 (4): 337–351.
Biondini, F., and A. Nero. 2011. “Cellular finite beam element for nonlinear analysis of concrete structures under fire.” J. Struct. Eng. 137 (5): 543–558. https://doi.org/10.1061/(ASCE)ST.1943-541X.0000307.
Brushlinsky, N. N., M. Ahrens, S. V. Sokolov, and P. Wagner. 2021. World fire statistics. Paris: International Association of Fire and Rescue Services.
CEN (European Committee for Standardization). 2002. Eurocode 1: Actions on structures. General rules. Actions on structures exposed to fire. EN 1991-1-2. Brussels, Belgium: CEN.
CEN (European Committee for Standardization). 2004. Eurocode 2: Design of concrete structures. General rules. Structural fire design. EN 1992-1-2. Brussels, Belgium: CEN.
CEN (European Committee for Standardization). 2005. Eurocode 3: Design of concrete structures. General rules. Structural fire design. EN 1993-1-2. Brussels, Belgium: CEN.
Dumont, F., E. Wellens, T. Gernay, and J.-M. Franssen. 2016. “Loadbearing capacity criteria in fire resistance testing.” Mater. Struct. 49 (11): 4565–4581. https://doi.org/10.1617/s11527-016-0807-7.
Dwaikat, M. B., and V. K. R. Kodur. 2010. “Fire induced spalling in high strength concrete beams.” Fire Technol. 46 (1): 251–274. https://doi.org/10.1007/s10694-009-0088-6.
Gales, J., L. Bisby, and M. Gillie. 2011. “Unbonded post tensioned concrete slabs in fire—Part I—Experimental response of unbonded tendons under transient localized heating.” J. Struct. Fire Eng. 2 (3): 139–154. https://doi.org/10.1260/2040-2317.2.3.139.
Gao, W. Y., J.-G. Dai, J. G. Teng, and G. M. Chen. 2013. “Finite element modeling of reinforced concrete beams exposed to fire.” Eng. Struct. 52 (Jul): 488–501. https://doi.org/10.1016/j.engstruct.2013.03.017.
Hua, N., N. E. Khorasani, A. Tessari, and R. Ranade. 2022. “Experimental study of fire damage to reinforced concrete tunnel slabs.” Fire Saf. J. 127 (Jan): 103504. https://doi.org/10.1016/j.firesaf.2021.103504.
ICC (International Building Code). 2017. 2018 International Building Code. Country Club Hills, IL: ICC.
ISO. 1999. Fire-resistance tests–elements of building construction—Part 1: General requirements. ISO 834-1. Geneva: ISO.
Jeanneret, C., J. Gales, P. Kotsovinos, and G. Rein. 2020. “Acceptance criteria for unbonded post-tensioned concrete exposed to travelling and traditional design fires.” Fire Technol. 56 (3): 1229–1252. https://doi.org/10.1007/s10694-019-00927-4.
Kang, T. H.-K., and Y. Huang. 2012. “Nonlinear finite element analyses of unbonded post-tensioned slab-column connections.” PTI J. 8 (1): 4–19.
Kang, T. H.-K., Y. Huang, M. Shin, J. D. Lee, and A. S. Cho. 2015. “Experimental and numerical assessment of bonded and unbonded post-tensioned concrete members.” ACI Struct. J. 112 (6): 735–748. https://doi.org/10.14359/51688194.
Kodur, V. 2014. “Properties of concrete at elevated temperatures.” ISRN Civ. Eng. 2014 (2): 1–15. https://doi.org/10.1155/2014/468510.
Kodur, V., P. Kumar, and M. M. Rafi. 2019. “Fire hazard in buildings: Review, assessment and strategies for improving fire safety.” PSU Res. Rev. 4 (1): 1–23. https://doi.org/10.1108/PRR-12-2018-0033.
Kodur, V. K. R. 2000. “Spalling in high strength concrete exposed to fire: Concerns, causes, critical parameters and cures.” In Proc., Advanced Technology in Structural Engineering, 1–9. Reston, VA: ASCE. https://doi.org/10.1061/40492(2000)180.
Kodur, V. K. R., and P. P. Bhatt. 2018. “A numerical approach for modelling response of fiber reinforced polymer strengthened concrete slabs exposed to fire.” Comput. Struct. 187 (Jun): 226–240. https://doi.org/10.1016/j.compstruct.2017.12.051.
Lim, L., A. Buchanan, P. Moss, and J.-M. Franssen. 2004a. “Computer modeling of restrained reinforced concrete slabs in fire conditions.” J. Struct. Eng. 130 (12): 1964–1971. https://doi.org/10.1061/(ASCE)0733-9445(2004)130:12(1964).
Lim, L., A. Buchanan, P. Moss, and J.-M. Franssen. 2004b. “Numerical modelling of two-way reinforced concrete slabs in fire.” Eng. Struct. 26 (8): 1081–1091. https://doi.org/10.1016/j.engstruct.2004.03.009.
Purkiss, J. A., and L. Y. Li. 2014. Fire safety engineering design of structures. 3rd ed. Boca Raton, FL: CRC Press.
Raut, N. K., and V. K. R. Kodur. 2011. “Response of high-strength concrete columns under design fire exposure.” J. Struct. Eng. 137 (1): 69–79. https://doi.org/10.1061/(ASCE)ST.1943-541X.0000265.
Ryan, J. V., and A. F. Robertson. 1959. “Proposed criteria for defining load failure of beams, floors, and roof constructions during fire tests.” J. Res. Natl. Bur. Stand. Sect. C Eng. Instrum. 63 (2): 121–124. https://doi.org/10.6028/jres.063C.017.
Wang, Y., Y.-L. Dong, and G.-C. Zhou. 2013. “Nonlinear numerical modeling of two-way reinforced concrete slabs subjected to fire.” Comput. Struct. 119 (Apr): 23–36. https://doi.org/10.1016/j.compstruc.2012.12.029.
Zheng, W. Z., X. M. Hou, D. S. Shi, and M. X. Xu. 2010. “Experimental study on concrete spalling in prestressed slabs subjected to fire.” Fire Saf. J. 45 (5): 283–297. https://doi.org/10.1016/j.firesaf.2010.06.001.
Information & Authors
Information
Published In

Journal of Structural Engineering
Volume 149 • Issue 12 • December 2023
Copyright
This work is made available under the terms of the Creative Commons Attribution 4.0 International license, https://creativecommons.org/licenses/by/4.0/.
History
Received: Jan 10, 2023
Accepted: May 15, 2023
Published online: Oct 12, 2023
Published in print: Dec 1, 2023
Discussion open until: Mar 12, 2024
Authors
Metrics & Citations
Metrics
Citations
Download citation
If you have the appropriate software installed, you can download article citation data to the citation manager of your choice. Simply select your manager software from the list below and click Download.