Residual Performance of Reinforced Concrete Beams Damaged by Low-Velocity Impact Loading
Publication: Journal of Structural Engineering
Volume 149, Issue 3
Abstract
With the advancement of material science and infrastructure design technology, there is an increased need to reflect various loading scenarios in the design of civil infrastructures, including extreme loads such as impact and blast. However, structural behavior under extreme loads has been observed to be very different from that under static loads due to the high-rate loading condition. Therefore, extensive experimental and analytical studies have been conducted to explain the structural behavior under impact loading. From these efforts, various discussions have been presented on the impact behavior and the evaluation of the impact resistance of structures. However, despite the fact that the repair or reinforcement of structures damaged by impact loads is a critical issue, studies of the residual performance of impact-damaged structures are insufficient. This paper presents an experimental study to improve the understanding of the residual performance of impact-damaged structures. A total of 29 RC beams were tested under static loads to examine the effect of impact-damage on the residual behavior of RC beams. Of these, 8 RC beams were intact, and the other 21 RC beams suffered impact loading through drop weight impact tests and were damaged prior to the static flexural tests. The residual performance was evaluated by comparing the maximum load capacity, flexural stiffness, and displacement ductility of impact-damaged beams and intact beams. The comparison indicated that the flexural stiffness and displacement ductility of the impact-damaged RC beams decreased significantly, whereas their flexural strengths did not exhibit a significant difference. Predictive models for flexural stiffness and displacement ductility of the impact-damaged beams were suggested from the test results, and through these, the residual performance of the impact-damaged structure could be evaluated.
Introduction
Recently, large infrastructure projects have become common worldwide, primarily owing to advances in material science, design technology, and construction methods. Consequently, impact loads due to accidents, such as vehicle and ship collisions with infrastructure, have resulted in significant property damage and injuries. Therefore, social demands to ensure the safety of infrastructure against impact loads have increased, and impact resistance has become a critical consideration in the design of infrastructure projects. Therefore, extensive studies have been conducted on the impact behavior of RC structures under low-velocity impact tests.
For static flexural failure–type RC beams, several studies conducted drop weight impact tests to distinguish the impact failure mechanism from the static failure mechanism (Adhikary et al. 2012, 2014, 2015a; Kishi et al. 2001; Hwang et al. 2020; Saatci and Vecchio 2009; Soleimani et al. 2007). The impact behaviors of static shear failure type RC beams were investigated using a drop weight impact test (Bhatti et al. 2011; Kishi et al. 2002). To simulate the RC gallery impact behavior during rockfall, a RC slab test was conducted (Schellenberg et al. 2007). Some methods have been suggested to explain the impact mechanism based on a mass–spring–damper model and effective length (Cotsovos 2010; Fujikake et al. 2009). Several studies have suggested deflection predictions to evaluate impact resistance (Ahn 2021; Kishi and Mikami 2012; Tachibana et al. 2010; Zhan et al. 2015; Yu et al. 2021). However, structures damaged by impact loads do not always collapse; therefore, rescue or rehabilitation work for impact-damaged structures is required. Hence, it is essential to evaluate the residual capacity and performance of damaged structures before performing rescue or repair work.
Adhikary et al. (2015b) examined the residual behavior of RC beams by performing drop weight impact tests and static flexural tests on 30 RC beams. They performed a parametric study using the finite-element method, and concluded that both the flexural strength and secant stiffness of most RC beams tended to decrease due to impact damage; however, in some cases, flexural strength increased due to strain hardening. Moreover, the effect of the transverse reinforcement ratio was investigated in the range of 0.11% to 0.56%. The result indicated that a relatively higher stirrup quantity caused higher residual resistance due to their confinement effect. Liu et al. (2017) conducted static flexural tests on four RC beams, including three impact-damaged beams. Based on the test results, the flexural strength and secant stiffness of the impact-damaged beams increased at a low impact energy level but decreased with an increase in impact energy. Dok et al. (2020) carried out static flexural tests using four RC beams, including three impact-damaged beams. The test results revealed that the flexural strength was not significantly different, and the flexural stiffness of the impact-damaged beam was lower than that of the undamaged beam. Moreover, the displacement ductility also decreased with an increase in the impact energy. Despite the efforts of these previous studies, except for one test case conducted by Dok et al. (2020), the impact energy level used in the previous studies was less than 10 kJ, which is low compared with that of actual accidents, such as rockfalls, which can have impact energies above 50 kJ (Yu et al. 2021). Furthermore, there have been insufficient experiments on the residual performance of RC members subjected to impact loads. Liu et al. (2017) and Dok et al. (2020) conducted only four tests. As previously mentioned, the results for some residual behaviors, such as the residual flexural strength and stiffness observed in previous studies, contradict with each other. Therefore, further experiments on the residual performance of impact-damaged beams should be performed by considering actual impact events to confirm that the investigations in previous studies are general residual behaviors under high impact energy levels.
This study performed an experimental investigation to examine the residual performance of impact-damaged RC structures with high impact energy. Static flexural tests were performed on 29 RC beams, including 21 impact-damaged RC beams and 8 intact RC beams. Consequently, the flexural behavior of the beams, including the maximum load capacity, flexural stiffness, and displacement ductility, was observed. The residual performance of the impact-damaged RC beams was analyzed by comparing the behavior of the impact-damaged RC beams with that of undamaged RC beams.
Experimental Program
Test Specimens
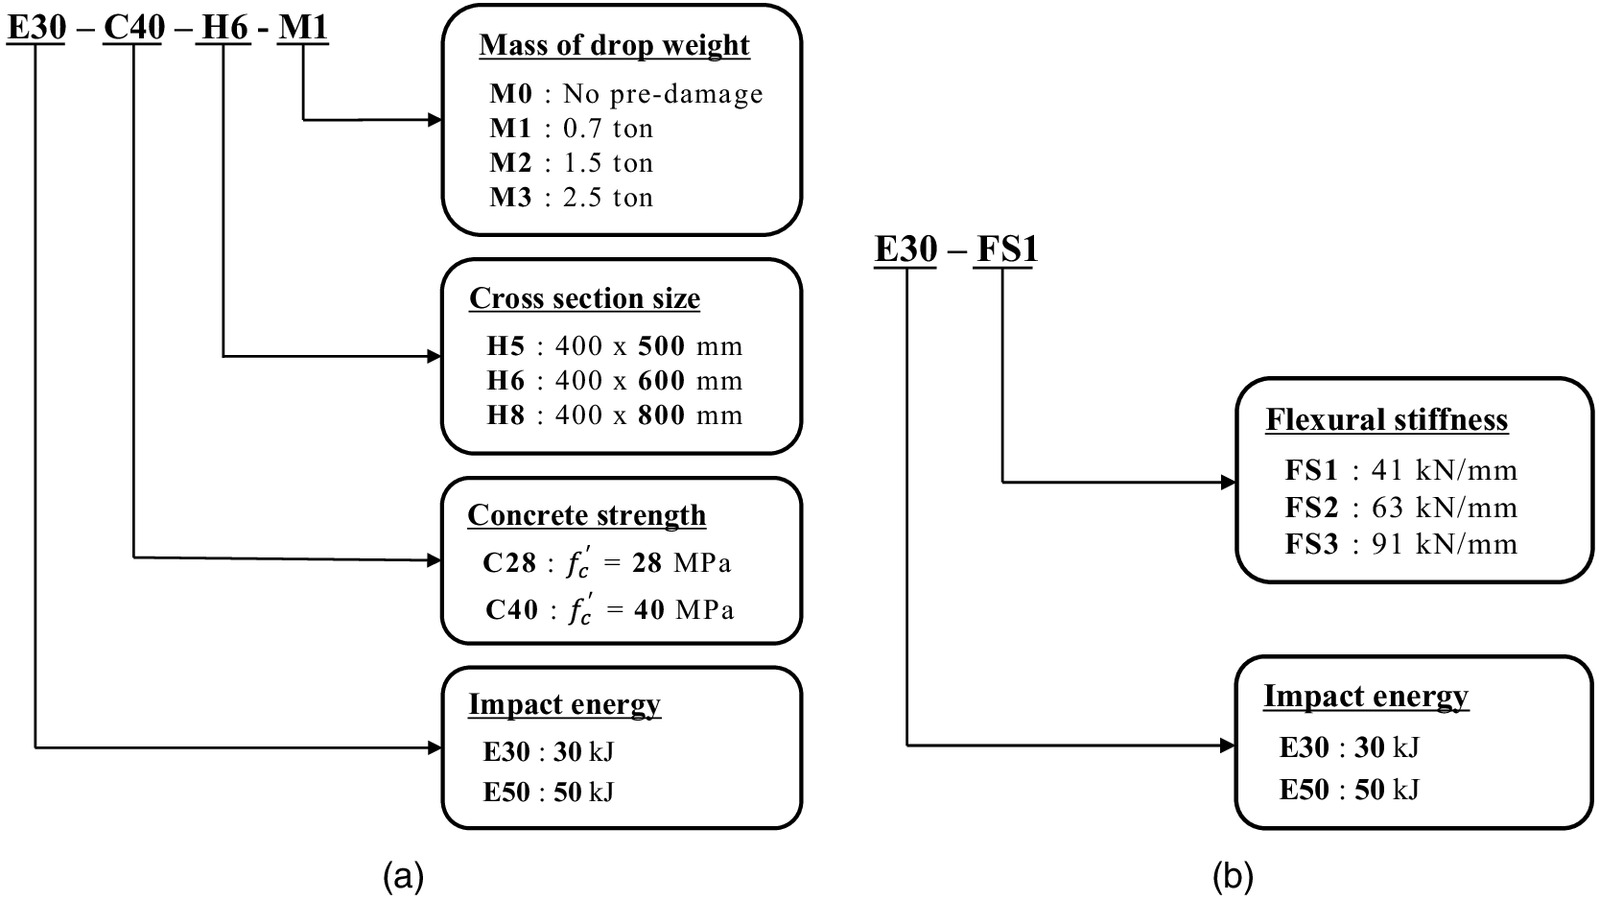
A total of 21 RC beams were utilized for the drop weight impact tests. Fifteen of those (Specimen groups 1–5) were tested by Yu et al. (2021) to investigate the impact behavior and propose a predictive formula for the maximum deflection of RC beams subjected to impact loads. The other nine beams (Specimen groups 6–8) were tested by Ahn (2021) to examine the effect of flexural stiffness on the impact behavior and improve the predictive formula proposed in Yu et al. (2021). Previous studies (Chen and May 2009; Tachibana et al. 2010) revealed that the variability in the results of drop weight impact tests was not significant. Based on this finding, one specimen was produced and tested for each case in the drop weight impact tests. The details and test results of these impact tests were presented by Yu et al. (2021) and Ahn (2021). Specimen groups 1–5 were designated in terms of impact energy (E: 30 and 50 kJ), concrete strength (C: 28 and 40 MPa), cross-section height (H: 500, 600, and 800 mm), and mass of the drop weight (M1: 0.7 ton, M2: 1.5 ton, and M3: 2.5 ton). Moreover, five intact beams were considered in the static flexural tests, designated M0. Specimen groups 6–8 were denoted in the order of impact energy (E: 30 and 50 kJ) and flexural stiffness (FS1: , FS2: , and FS3: ). The remaining three intact beams were employed for the static flexural tests, and the designation did not contain an impact energy term. The impact energy was calculated as the kinetic energy of drop weight when the drop weight collided with the beam. Depending on the impact energy and mass of the drop weights, the impact velocity was determined to be in the range . The details of designation of test specimens are shown in Fig. 1.
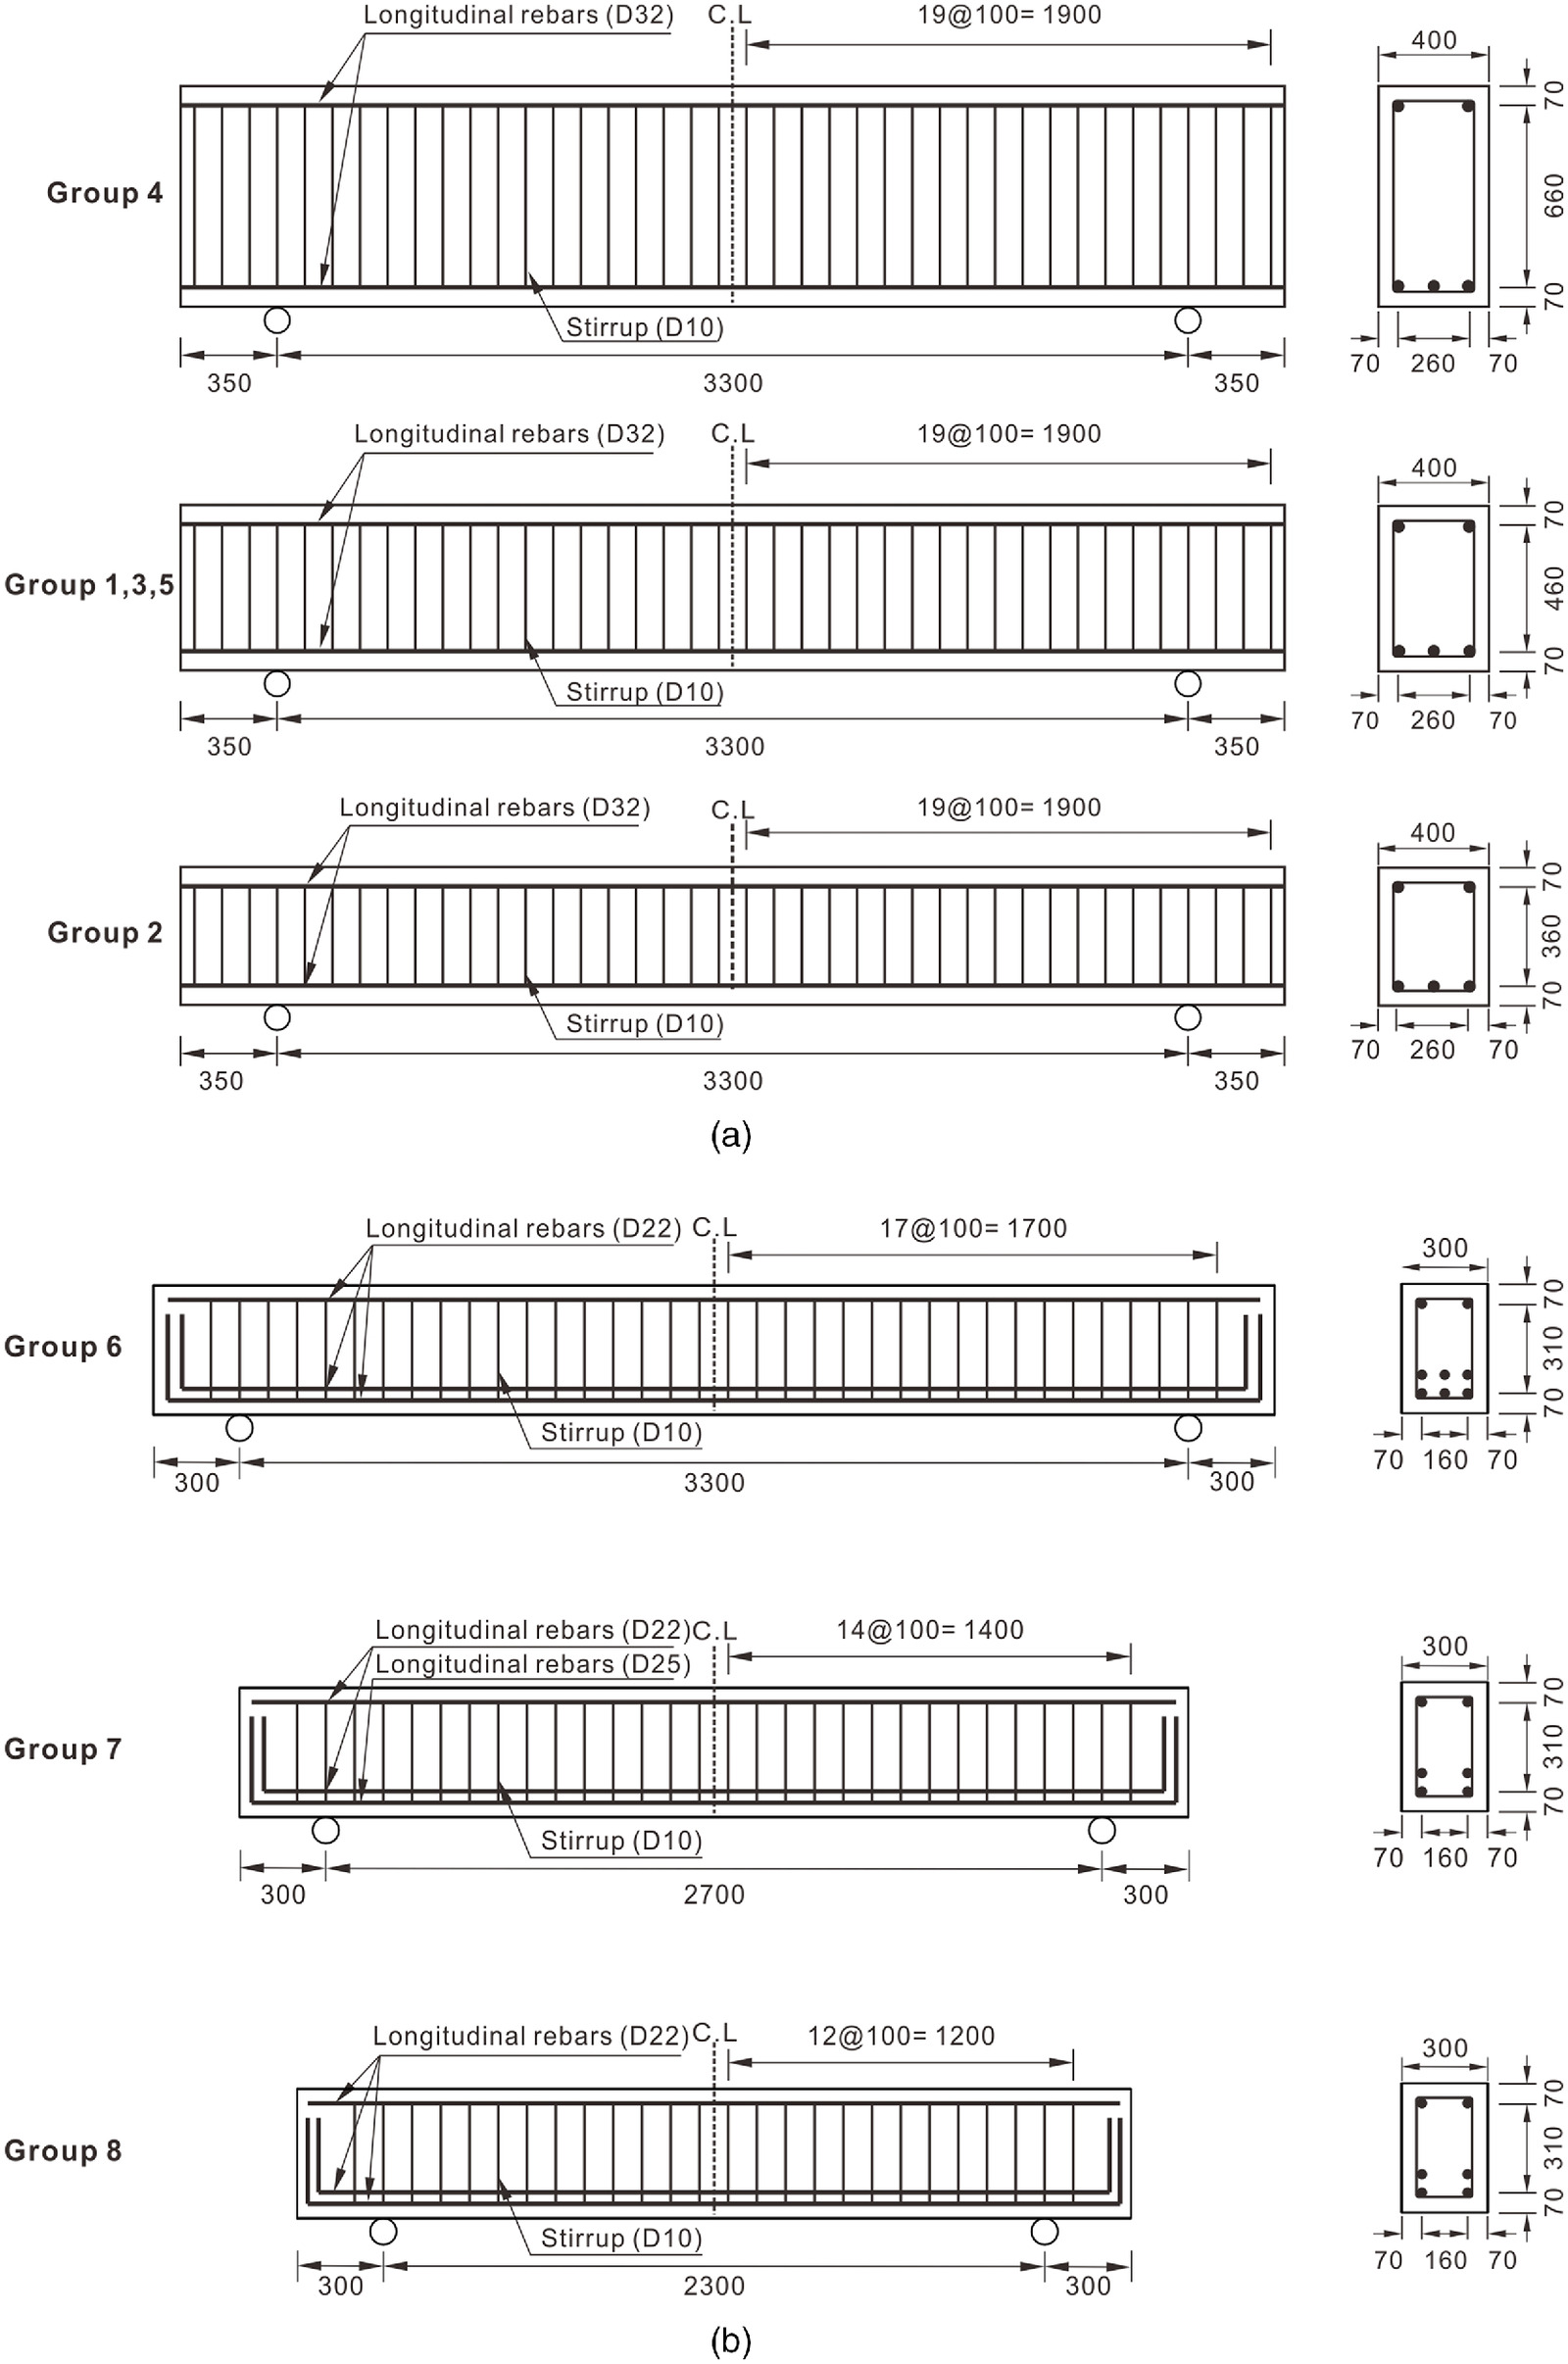
The test specimens in each group were fabricated using the same batch. Fig. 2 shows the details of the specimens, including the reinforcement layout. The stirrups used in this study satisfied the minimum and maximum reinforcement ratios suggested by ACI 318-19 (ACI 2019). The designed static flexural and shear capacities were calculated in accordance with ACI 318-19. The flexural capacity ranged from 420 to 930 kN, and the shear capacity ranged from 640 to 1,350 kN. Therefore, all beams were designed to exhibit flexural failure mode under a static state. The ratio of shear capacity to flexural capacity was determined to range from 1.4 to 1.9, referring to previous studies (Adhikary et al. 2015b; Fujikake et al. 2009; Kishi et al. 2001; Kishi and Mikami 2012; Saatci and Vecchio 2009; Tachibana et al. 2010; Zhan et al. 2015). Consequently, the layout of the flexural rebar and stirrups in Fig. 2 was used. The material properties obtained from the standard concrete cylinder tests and reinforcing bar coupon tests in the laboratory are summarized in Tables 1 and 2, where is the compressive strength of concrete, is the elastic modulus of concrete, and are the yield strength and ultimate tensile strength of the reinforcing bars, respectively, and and are the yield strain and fracture strain of the reinforcing bars, respectively.
| Group | Specimen ID | , test age (MPa) | (MPa) |
|---|---|---|---|
| 1 | E30-C40-H6-M0 | 41.7 | 18,934 |
| E30-C40-H6-M1 | 37.6 | 17,459 | |
| E30-C40-H6-M2 | 40.3 | 19,739 | |
| E30-C40-H6-M3 | 38.1 | 18,356 | |
| 2 | E30-C40-H5-M0 | 44.4 | 21,213 |
| E30-C40-H5-M1 | 38.8 | 19,712 | |
| E30-C40-H5-M2 | 38.4 | 20,419 | |
| E30-C40-H5-M3 | 42.1 | 20,473 | |
| 3 | E30-C28-H6-M0 | 29.0 | 16,352 |
| E30-C28-H6-M1 | 27.0 | 17,505 | |
| E30-C28-H6-M2 | 22.5 | 19,214 | |
| E30-C28-H6-M3 | 26.5 | 17,156 | |
| 4 | E30-C28-H8-M0 | 29.2 | 17,459 |
| E30-C28-H8-M1 | 27.1 | 17,726 | |
| E30-C28-H8-M2 | 28.3 | 18,387 | |
| E30-C28-H8-M3 | 32.3 | 18,876 | |
| 5 | E50-C40-H6-M0 | 45.6 | 20,404 |
| E50-C40-H6-M1 | 45.3 | 20,160 | |
| E50-C40-H6-M2 | 42.1 | 20,286 | |
| E50-C40-H6-M3 | 43.6 | 20,313 | |
| 6 | FS1 | 56.5 | 27,045 |
| E30-FS1 | 54.6 | 27,546 | |
| E50-FS1 | 55.0 | 26,172 | |
| 7 | FS2 | 53.0 | 27,918 |
| E30-FS2 | 56.2 | 28,617 | |
| E50-FS2 | 55.6 | 25,167 | |
| 8 | FS3 | 55.9 | 26,635 |
| E30-FS3 | 53.2 | 26,968 | |
| E50-FS3 | 53.0 | 24,795 |
| Group | Type | Diameter (mm) | (MPa) | () | (MPa) | () |
|---|---|---|---|---|---|---|
| Longitudinal rebar | ||||||
| 1,3,4,5 | D32 | 31.8 | 430 | 2.17 | 603 | 188 |
| 2 | D32 | 31.8 | 645 | 4.36 | 804 | 228 |
| 6,8 | D22 | 22.2 | 553 | 2.83 | 678 | 85 |
| 7 | D22 | 22.2 | 553 | 2.83 | 678 | 85 |
| D25 | 25.4 | 562 | 2.80 | 687 | 118 | |
| Stirrup | ||||||
| 1–5 | D10 | 9.53 | 460 | 2.55 | 570 | 137 |
| 6–8 | D10 | 9.53 | 461 | 2.30 | 587 | 95 |
Test Program
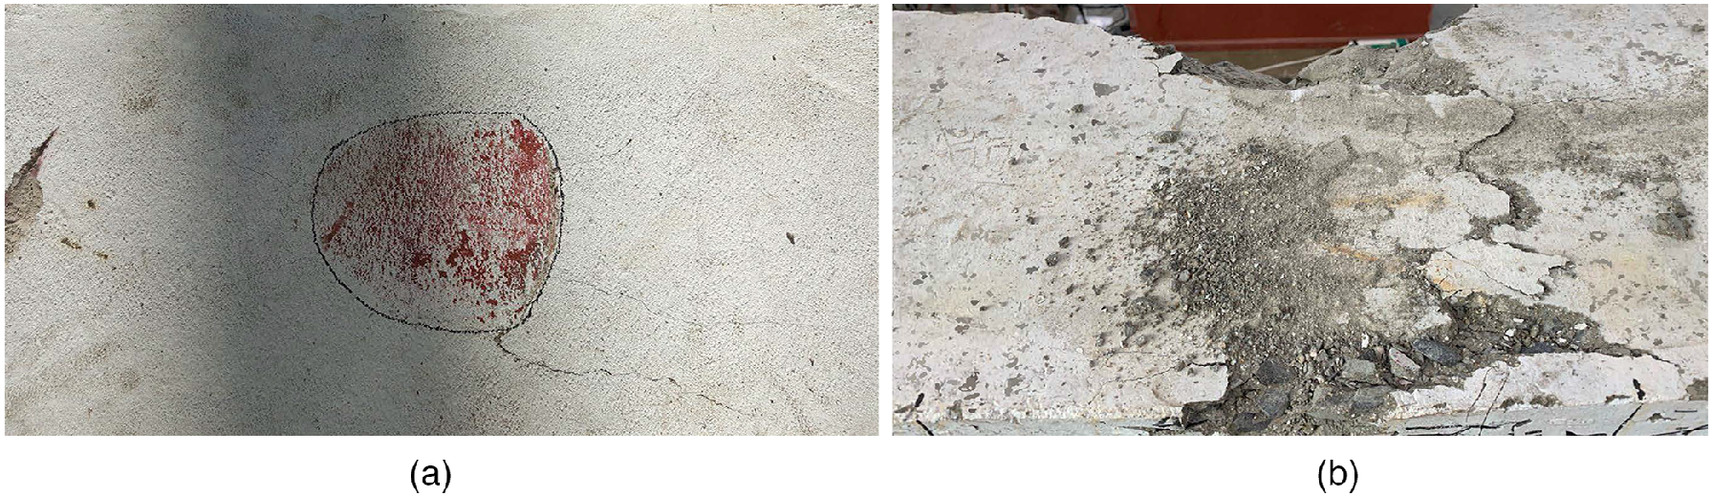
In the first stage of the experimental work, drop weight impact tests were conducted on RC beams at two impact energy levels: 30 and 50 kJ. Further details of the drop weight impact tests were presented by Yu et al. (2021) and Ahn (2021). Following the drop weight impact tests, static flexural tests were performed to evaluate the residual performance of the impact-damaged beams. The damaged beams were placed in a four-point flexural-test setup. Except for two cases, the local damage on the top of the beams was not severe in the impact tests of Groups 1–5 (Yu et al. 2021) [Fig. 3(a)]. In the cases of E50-C40-H6-M1 and E50-C40-H6-M2 in Group 5, concrete spalling occurred at the top surface, and this damaged surface was located at the loading points of the flexural test. Therefore, the top surface was flattened using mortar so that the load was applied normally during the flexural test. Concrete spalling occurred primarily in Groups 6–8 (Ahn 2021) [Fig. 3(b)]; however, in these cases, no flattening work was conducted so that the effect of local damage on the residual performance could be examined comprehensively. The distances between the loading points for Groups 1–5 and Groups 6–8 were 300 and 250 mm, respectively, for the shear span–depth ratio range from 2.1 to 4.1 to ensure dominant flexural behavior and constant moment in the middle of the beam. The midspan deflection of the beams was measured using two LVDTs. The load was controlled by the displacement at a speed of , and the test was terminated when crushing occurred at the top of the concrete.
Test Results and Discussion
As a result of the drop weight impact tests, diagonal cracks were observed to form a shear plug, playing an important role in the behavior, even though all specimens were designed as a flexural critical beam under a static state. Moreover, it was observed that the maximum impact force ranged from 2,180 to 6,134 kN, and the residual deflection ranged from 3.8 to 35.8 mm. In this study, the impact force was calculated by multiplying the acceleration by the drop weight mass. Acceleration was measured using accelerometers mounted on the drop weight. The residual deflection was determined as the displacement that converged after the impact test was terminated. A detailed description was presented by Yu et al. (2021) and Ahn (2021). Residual behaviors, such as load–deflection curves and crack patterns, were observed in the static flexural tests. In the static flexural test, flexural behavior and a flexural failure mode were observed in all beams regardless of the impact damage. Thus, the residual performance of the beam was evaluated in various aspects by considering the flexural capacity, stiffness, and displacement ductility.
The global behavior, such as deflection and rotation, is dominant under low-velocity impact loads. In particular, design codes, such as UFC 3-340-02 (Department of Defense 2008) and ACI 349-13 (ACI 2014), regulate the rotation angle or ductility through deflection to ensure structural safety. In addition, local damage, such as spalling in the impact region can affect the concrete compressive performance of the beam, which causes a decrease in the residual performance. Therefore, this study evaluated the residual performance by considering the effect of residual deflection and local damage, which is discussed in detail in the following sections. The transverse reinforcement ratios of Groups 1–5 and Groups 6–8 were 0.36% and 0.48%, respectively. According to Adhikary et al. (2015b), the difference between these transverse reinforcement ratios barely affects residual performance. Therefore, the effect of the transverse reinforcement ratio on the residual performance was not discussed in this study.
Failure Modes
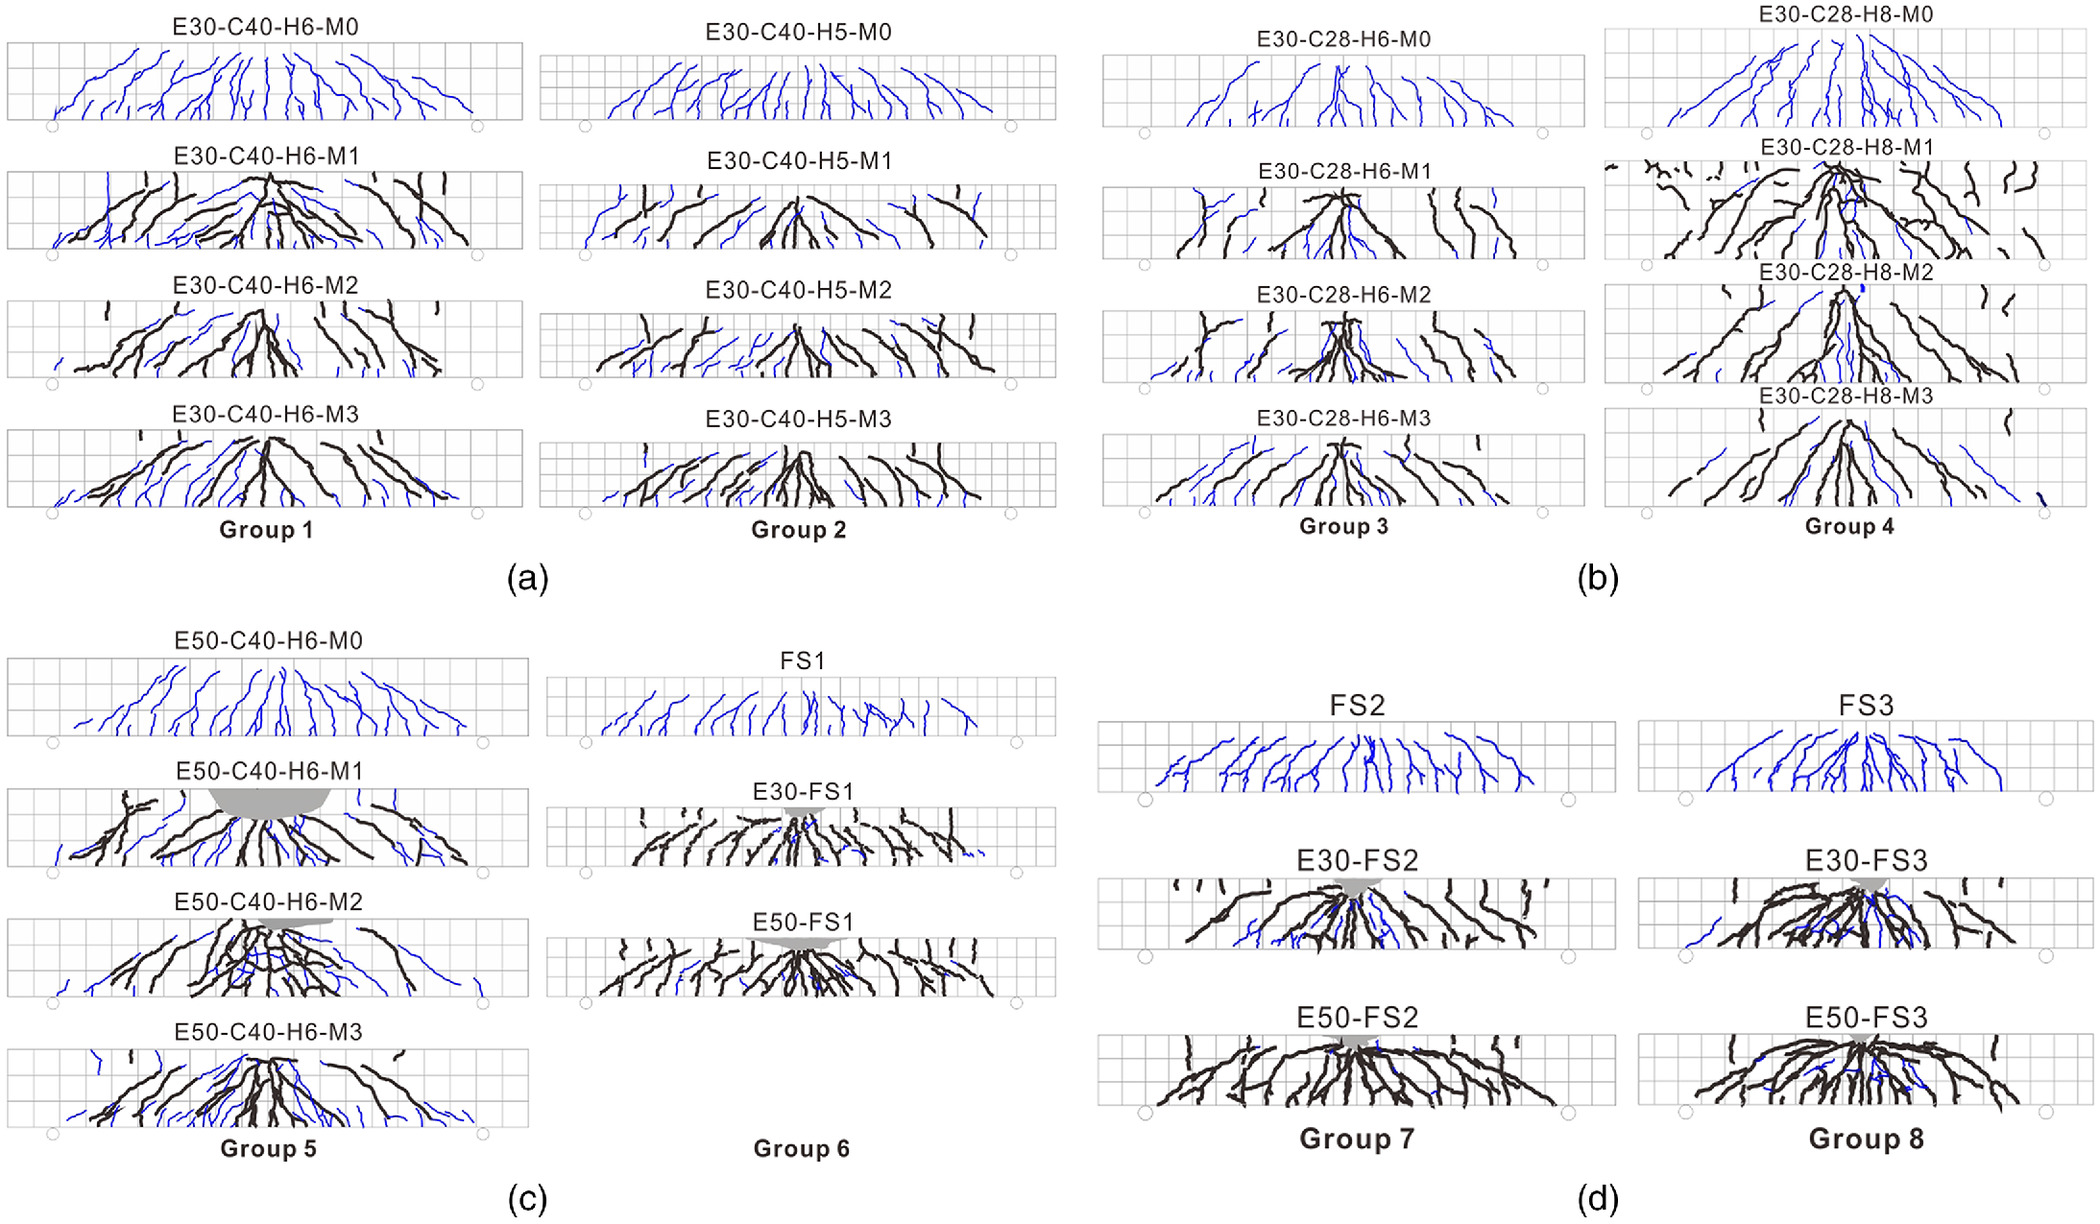
Fig. 4 depicts crack patterns that were examined in both the drop weight impact test and the static flexural test. Two kinds of lines are used to represent cracks to distinguish the cracks observed in the impact test and static flexural test. Thick lines represent the cracks generated in the drop weight impact tests, and thin lines represent cracks developed in the static flexural tests. Shaded areas indicate a spalling region due to the impact loads. For all impact-damaged beams, the main diagonal cracks developed from the top center of the beam, i.e., the impact region, downward, forming a shear plug during the impact test. Subsequently, diagonal cracks were generated parallel to the main diagonal cracks along with vertical flexural cracks (Yu et al. 2021; Ahn 2021). In the static flexural test, all the beams exhibited ductile flexural critical behaviors; however, different crack patterns were observed depending on the impact damage. For the undamaged beams, flexural cracks were generated at the bottom center of the beam. These cracks propagated vertically through the height of the beam, and subsequently, flexure-shear cracks were observed between the center and the support. In the impact-damaged beams, the existing cracks propagated further, and there were relatively few newly generated cracks. Most cracks were observed as propagation or as an increase in the width of the main diagonal cracks that formed the shear plugs.
Flexural Capacity
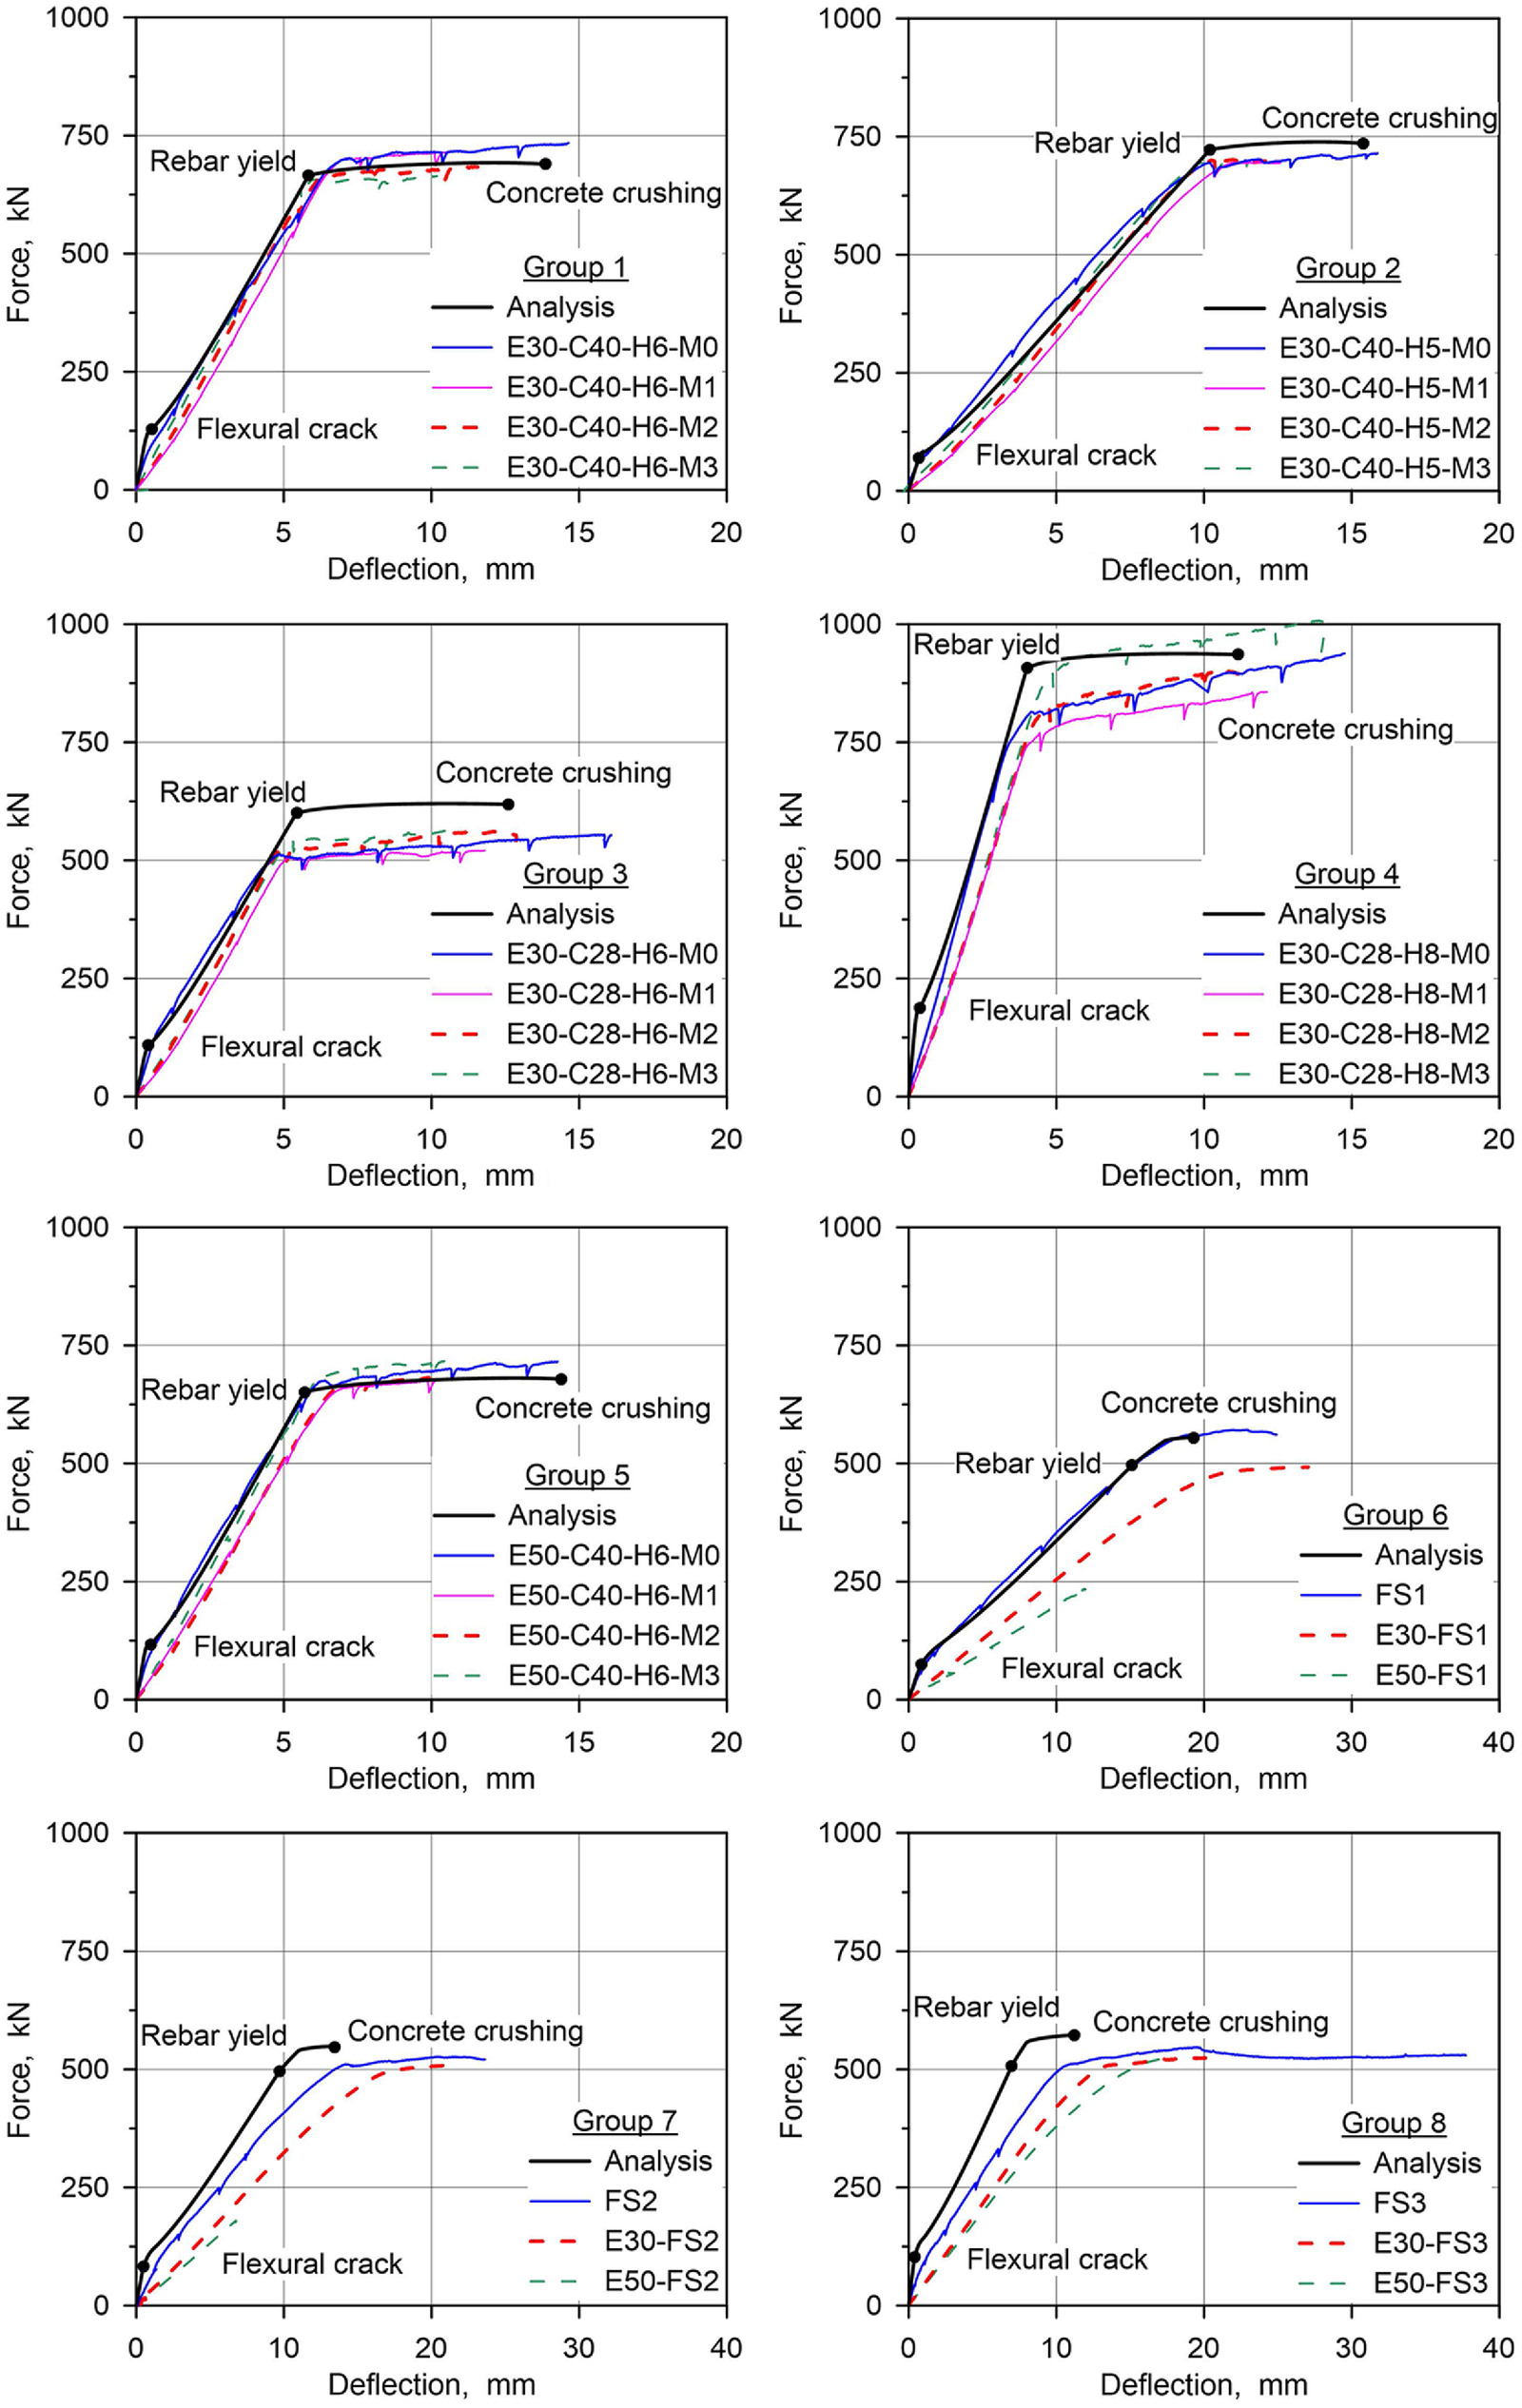
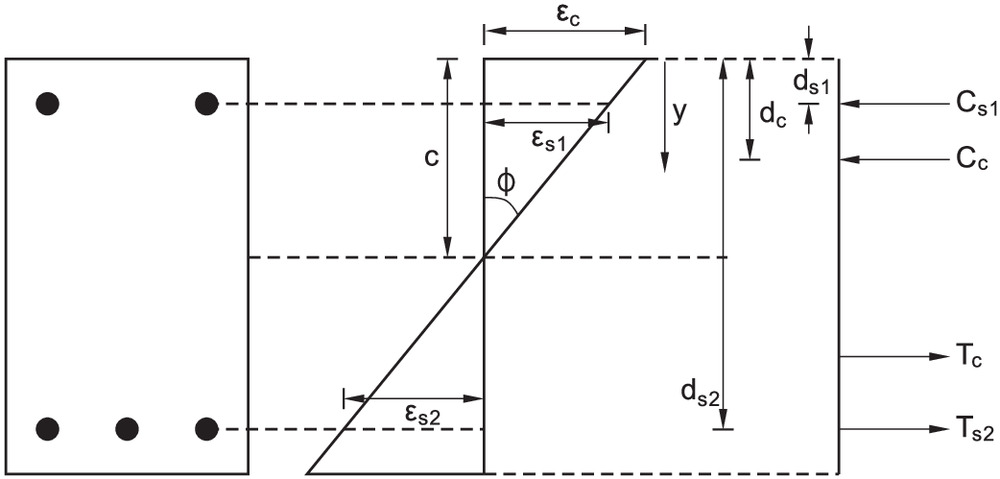
The relationships between the applied load and the central deflection of all specimens in each group are presented in Fig. 5. Two test cases, E50-FS1 and E50-FS2, ended before reaching the maximum load capacity because the hydraulic actuator was overturned and verticality could not be maintained during loading because of the unflattening surface conditions, which was caused by local damage that had been generated in the impact test [Fig. 3(b)]. Analysis indicated the behavior of an intact beam that was predicted using the strain-compatibility method. This analysis was compared with test results to check whether the static tests were performed normally. The moment–curvature relationships of the sections along the span length were derived through strain-compatibility analysis. It was assumed that the normal strain changed linearly with the depth of the section (Fig. 6). The moment and curvature were computed using Eqs. (1) and (2), respectively, whereas the strain at the extreme concrete compression fiber was changed from zero to the ultimate strain, which was determined to be 0.003 in accordance with ACI 318-19where = moment at the section; = width of cross section; = depth of member; = normal stress at a concrete fiber; = compressive force in concrete; = force of longitudinal compression reinforcement; = distance from extreme compression fiber to centroid of longitudinal compression reinforcement; = tensile force in concrete; = longitudinal tension reinforcement force; = distance from extreme compression fiber to centroid of longitudinal tension reinforcement; = curvature; = strain at extreme concrete compression fiber; = strain of longitudinal compression reinforcement; = strain of longitudinal tension reinforcement; = distance from extreme compression fiber to centroid of a concrete fiber; and = distance from extreme compression fiber to neutral axis.
(1)
(2)
The stress–strain relationship for concrete under compression was obtained from Thorenfeldt (1987). Tension stiffening of the concrete was considered using a linear model. By comparing the analysis results with the test results, it was assumed that the tensile stress of concrete is reduced to zero at a total strain of 6 times the strain at first cracking. For the reinforcing bar, the stress–strain relationship obtained from the coupon tests was used in this analysis. In this analysis, beam failure was assumed when the strain at the extreme concrete compression fiber at the center of the beams reached the ultimate strain. Thereafter, the load–displacement relationship of a member was obtained from the calculated moment and curvature using Eqs. (3) and (4). The moment at a certain distance from the support was obtained from the bending moment diagram. Thereafter, the curvature corresponding to the moment value at the location was acquired from the moment–curvature relations and was used to calculate the displacementwhere = concentrated load; = maximum moment in span length; = distance from center of concentrated load to center of support; = central displacement; and = infinitesimal span length.
(3)
(4)
The load–deflection curve of the analysis revealed the typical behavior of a flexural critical RC beam under static loads. The slope decreased after the flexural cracks, and a linear relationship was observed up to the rebar yield. Admittedly, the stiffness of the analysis was slightly larger than that of the intact beams in Groups 7 and 8. However, the analysis results revealed a similar maximum load capacity to the intact beams of the tests. These results confirmed that static flexural tests were conducted appropriately. The load–deflection curves of the damaged beams were different from those of the undamaged beams. As previously mentioned, cracks were generated during the impact tests. Therefore, the initial stiffness of the impact-damaged beam was smaller than that of the undamaged beam, and there was no change in its stiffness until the applied load reached the yielding point. For Groups 3 and 4, the maximum load capacity of the test was lower than that of the analysis. Because Groups 1, 3, 4, and 5 were designed to use the same grade and size of rebar, the rebar properties were obtained from the coupon test using the same samples, and these were applied in the analysis. However, the maximum load capacity identified in Groups 3 and 4 was less than that in the analysis of the intact beam in the groups. Assuming that the yield strength of the rebars in the analysis was approximately 10% less than the yield strength from the coupon test, the maximum load capacity of the analysis was similar to that of the test. Accordingly, it is thought that rebars of different lots from the rebar coupons were used mistakenly in Groups 3 and 4 during the manufacture; thus, the maximum load capacity of Groups 3 and 4 was smaller than that in the analysis of the intact beam of the groups. However, each beam in the same group exhibited similar curves in Groups 3 and 4. Therefore, the authors concluded that there was no problem using the results of Groups 3 and 4 to evaluate the residual performance.
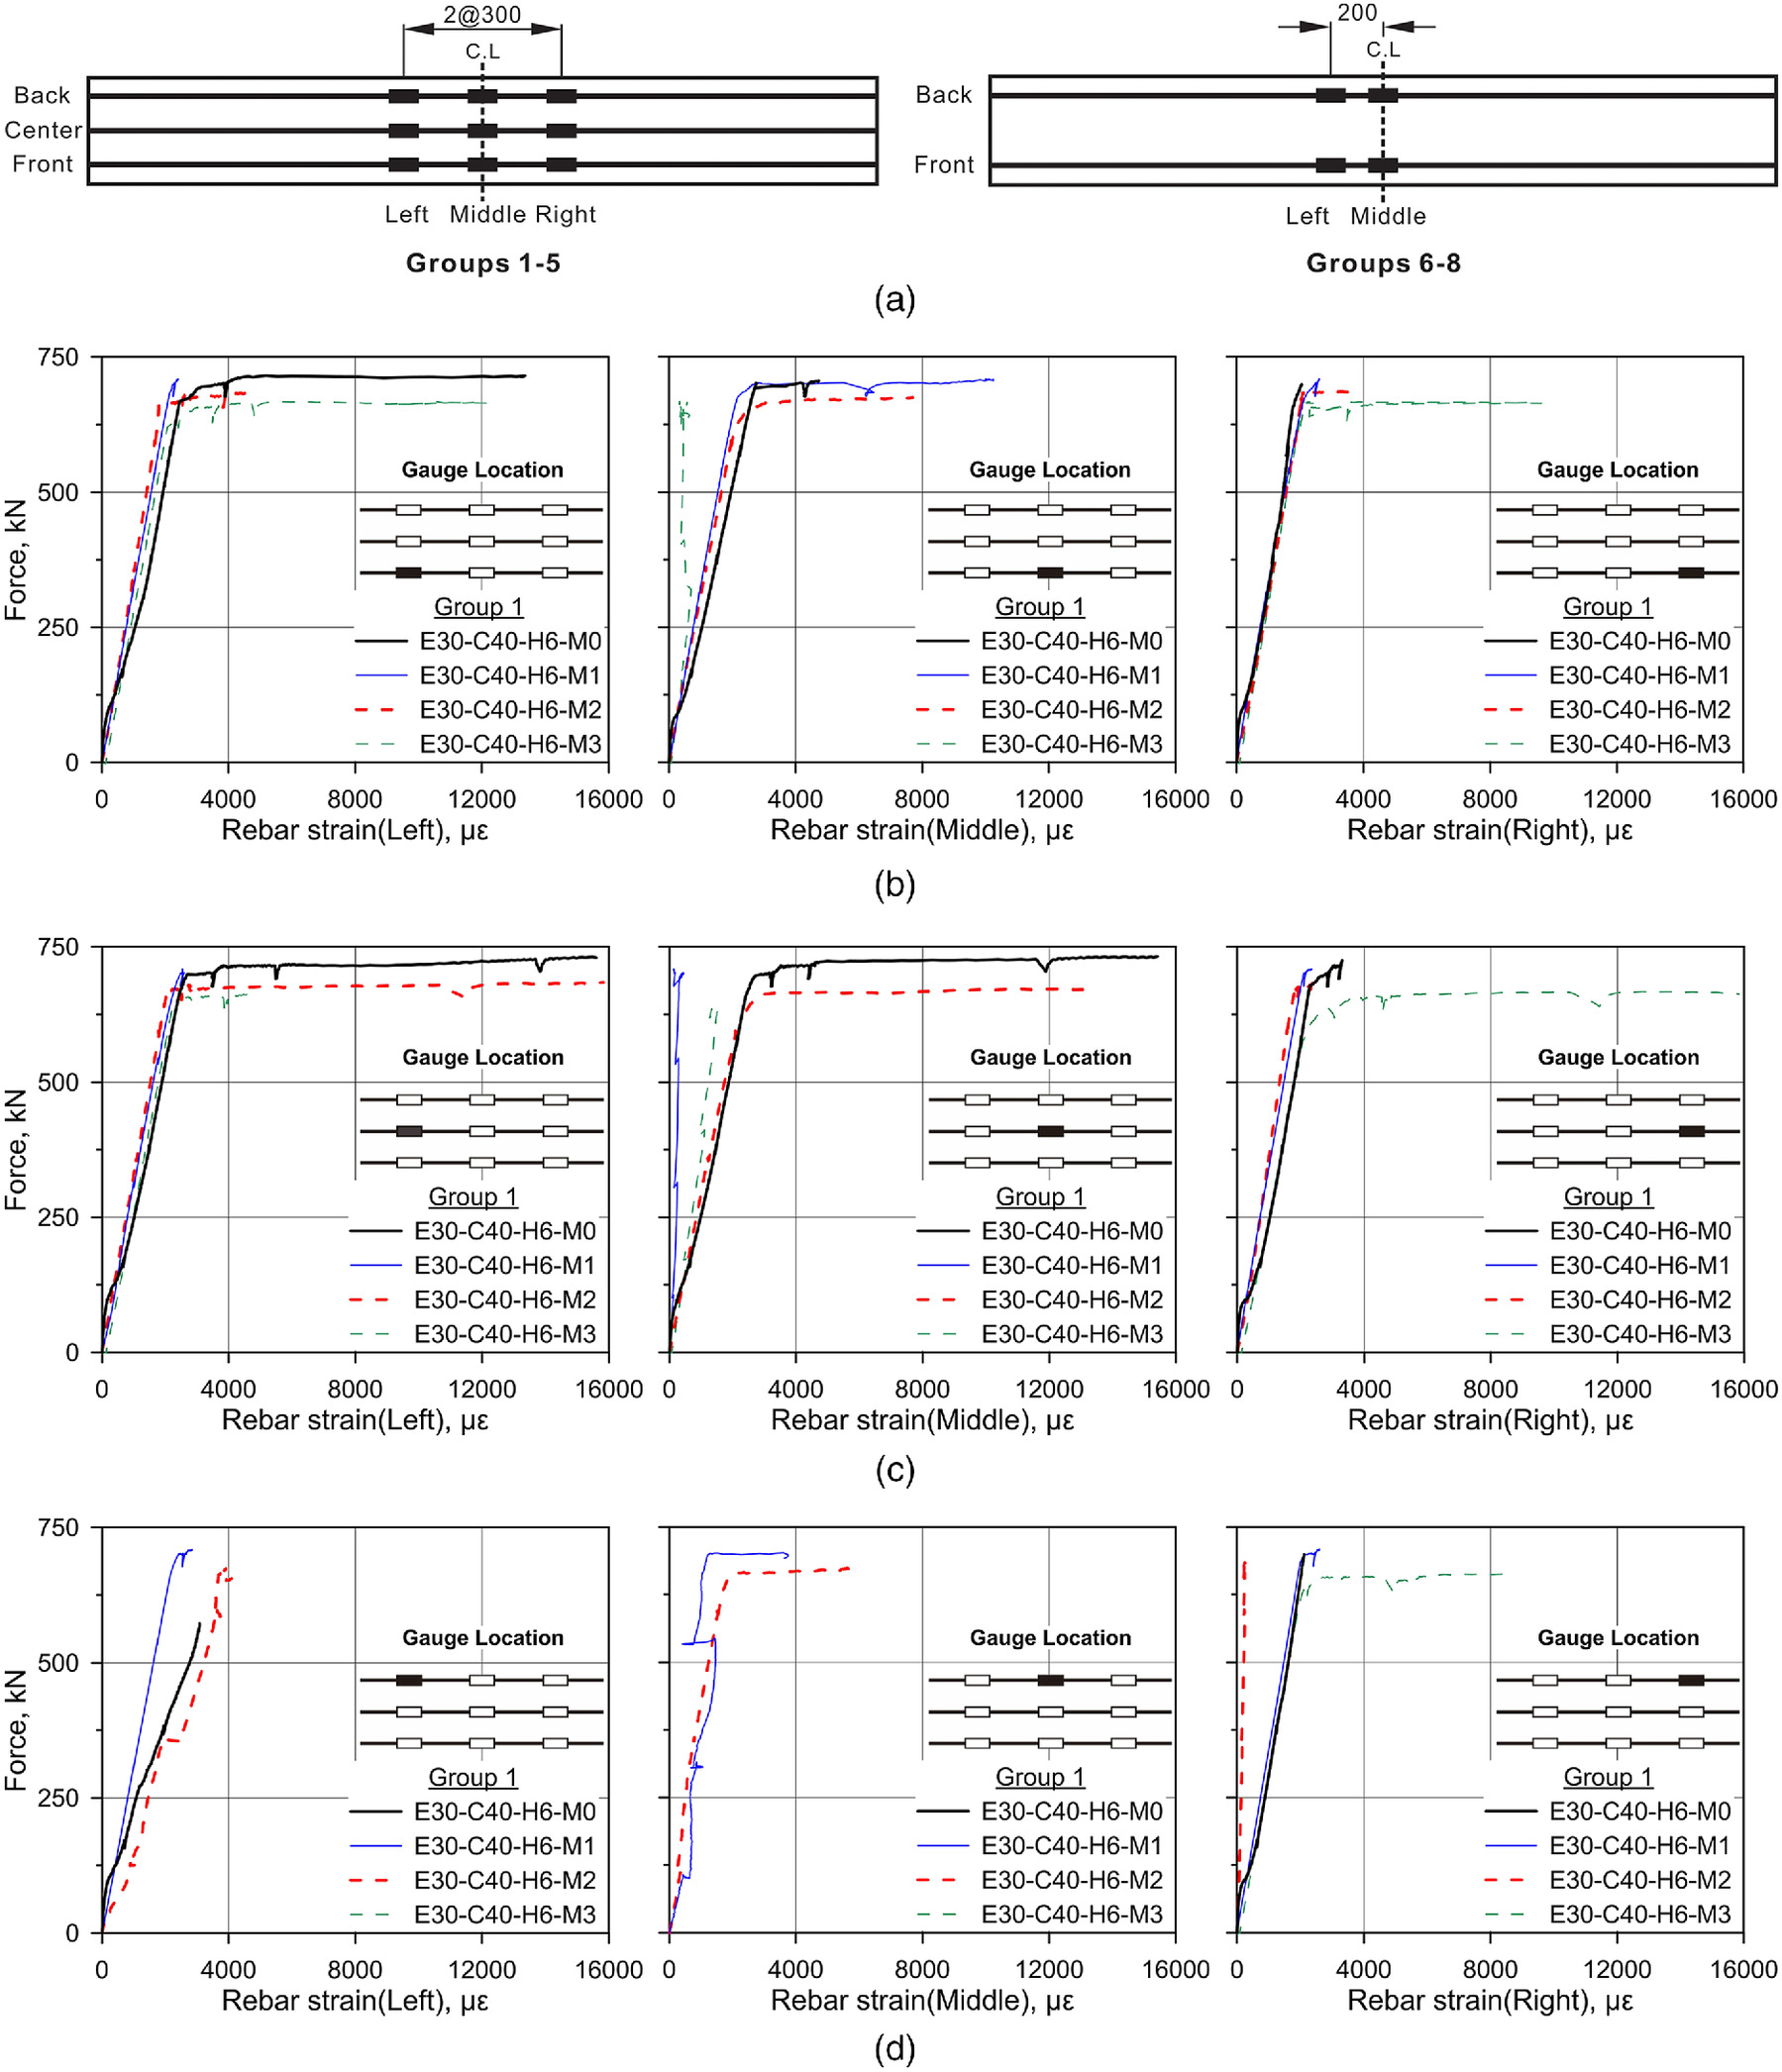
Table 3 presents the maximum load capacities of the static flexural tests; refers to the ratio of the maximum load capacity of the damaged beam to that of the undamaged beam in the same group. The maximum load capacities in the same group were not significantly different from each other regardless of the impact damage (Table 3). Some impact-damaged beams of Groups 3, 4, and 5 exhibited a slightly larger maximum load than that of the undamaged beam. For flexural failure–type RC beams under static loads, the maximum load capacity is most affected by the performance of the flexural reinforcing bars. Therefore, it can be inferred that the maximum load capacities were not affected significantly by the impact damage because the performance of the flexural reinforcing bars was barely reduced by the impact load. This inference was confirmed by examining the rebar strain measured during the impact and static flexural tests, as follows.
| Group | Specimen ID | Maximum load capacity | |
|---|---|---|---|
| Value (kN) | |||
| 1 | E30-C40-H6-M0 | 735 | — |
| E30-C40-H6-M1 | 715 | 0.97 | |
| E30-C40-H6-M2 | 684 | 0.93 | |
| E30-C40-H6-M3 | 663 | 0.90 | |
| 2 | E30-C40-H5-M0 | 715 | — |
| E30-C40-H5-M1 | 696 | 0.97 | |
| E30-C40-H5-M2 | 702 | 0.98 | |
| E30-C40-H5-M3 | 697 | 0.98 | |
| 3 | E30-C28-H6-M0 | 553 | — |
| E30-C28-H6-M1 | 521 | 0.94 | |
| E30-C28-H6-M2 | 562 | 1.02 | |
| E30-C28-H6-M3 | 564 | 1.02 | |
| 4 | E30-C28-H8-M0 | 938 | — |
| E30-C28-H8-M1 | 856 | 0.91 | |
| E30-C28-H8-M2 | 900 | 0.96 | |
| E30-C28-H8-M3 | 1,004 | 1.07 | |
| 5 | E50-C40-H6-M0 | 716 | — |
| E50-C40-H6-M1 | 680 | 0.95 | |
| E50-C40-H6-M2 | 683 | 0.95 | |
| E50-C40-H6-M3 | 726 | 1.01 | |
| 6 | FS1 | 571 | — |
| E30-FS1 | 493 | 0.86 | |
| E50-FS1 | — | — | |
| 7 | FS2 | 527 | — |
| E30-FS2 | 509 | 0.97 | |
| E50-FS2 | — | — | |
| 8 | FS3 | 547 | — |
| E30-FS3 | 528 | 0.97 | |
| E50-FS3 | 524 | 0.96 | |
Note: = ratio of maximum load capacity of damaged beam to that of undamaged beam.
The rebar strains were measured at the center and 200 or 300 mm from the center of the beam [Fig. 7(a)]. The strains near the midspan instantaneously were several times higher than the yield strain during the drop weight impact tests. The residual strains measured after the impact tests are listed in Table 4. Gauges that did not function after the impact load tests were excluded. Strain values ranging from hundreds to approximately 35,000 με were recorded. Comparing the residual strains of the flexural bars at the same longitudinal location showed that there were cases that exhibited similar values with differences within hundreds of microstrains; however, in some cases, large differences of thousands of microstrains or more were observed. Therefore, it is uncertain whether the strain values accurately represented the actual rebar strains. However, residual deflections were observed in all cases after the impact tests, which indicated that residual strains also were generated in the flexural bars; thus, it is reasonable that residual strains occurred in the flexural bars. Figs. 7(b–d) show the strains of the three flexural rebars near the center of the beams of Group 1 observed during the static flexural tests. For the impact-damaged beams, some strain gauges did not work because they were damaged during the impact test. However, it can be confirmed that rebar strains in the same group during the static flexural test were similar regardless of the impact damage. This trend also was observed in the other groups.
| Group | Specimen ID | Residual strain | |||
|---|---|---|---|---|---|
| Location | Left | Middle | Right | ||
| 1 | E30-C40-H6-M1 | Back | 655 | 1,059 | 5,088 |
| Center | 2,667 | 3,976 | 854 | ||
| Front | 2,006 | 4,482 | 596 | ||
| E30-C40-H6-M2 | Back | 291 | 697 | 284 | |
| Center | 973 | 11,522 | 636 | ||
| Front | 477 | 1,399 | 91 | ||
| E30-C40-H6-M3 | Back | 442 | 2,471 | 463 | |
| Center | 415 | 3,976 | 4,492 | ||
| Front | 257 | 2,731 | 387 | ||
| 2 | E30-C40-H5-M1 | Back | 442 | 2,471 | 463 |
| Center | 415 | 3,976 | 4,492 | ||
| Front | 257 | 2,731 | 387 | ||
| E30-C40-H5-M2 | Back | 1,018 | 2,868 | 936 | |
| Center | 14,250 | 9,610 | 6,619 | ||
| Front | 7,817 | 9,022 | 487 | ||
| E30-C40-H5-M3 | Back | 951 | 4,853 | 659 | |
| Center | — | 6,757 | 1,050 | ||
| Front | 810 | — | 1,077 | ||
| 3 | E30-C28-H6-M1 | Back | 143 | 4,527 | 317 |
| Center | 381 | 465 | 5,018 | ||
| Front | 5,018 | 4,655 | 4,495 | ||
| E30-C28-H6-M2 | Back | 1,720 | 4,804 | 633 | |
| Center | 1,706 | 11,343 | 4,030 | ||
| Front | 25,503 | 18,745 | 1,348 | ||
| E30-C28-H6-M3 | Back | — | 2,270 | 1,489 | |
| Center | 814 | 553 | 2,431 | ||
| Front | 1,412 | 8,186 | 711 | ||
| 4 | E30-C28-H8-M1 | Back | 398 | 569 | — |
| Center | 555 | 12,172 | 402 | ||
| Front | 243 | 6,114 | 5,272 | ||
| E30-C28-H8-M2 | Back | 3,724 | 675 | 4,407 | |
| Center | 6,315 | 204 | — | ||
| Front | 4,305 | — | 4,979 | ||
| E30-C28-H8-M3 | Back | 12,655 | — | — | |
| Center | 4,786 | 6,592 | 6,598 | ||
| Front | 6,820 | 4,238 | 8,853 | ||
| 5 | E50-C40-H6-M1 | Back | 798 | 10,073 | 1,581 |
| Center | 4,696 | 7,419 | — | ||
| Front | 2,790 | 963 | 693 | ||
| E50-C40-H6-M2 | Back | 2,246 | 4,772 | 15,949 | |
| Center | — | — | — | ||
| Front | 3,404 | 4,194 | 4,998 | ||
| E50-C40-H6-M3 | Back | 205 | 173 | 3,336 | |
| Center | — | 3,502 | 10,436 | ||
| Front | 368 | 659 | — | ||
| 6 | E30-FS1 | Back | 5,375 | — | — |
| Front | 10,143 | 12,118 | — | ||
| E50-FS1 | Back | 1,263 | 30,636 | — | |
| Front | — | — | — | ||
| 7 | E30-FS2 | Back | 3,659 | 411 | — |
| Front | — | — | — | ||
| E50-FS2 | Back | 28,480 | 35,626 | — | |
| Front | — | 26,535 | — | ||
| 8 | E30-FS3 | Back | 620 | 4,123 | — |
| Front | 2,551 | 2,958 | — | ||
| E50-FS3 | Back | — | — | — | |
| Front | — | — | — | ||
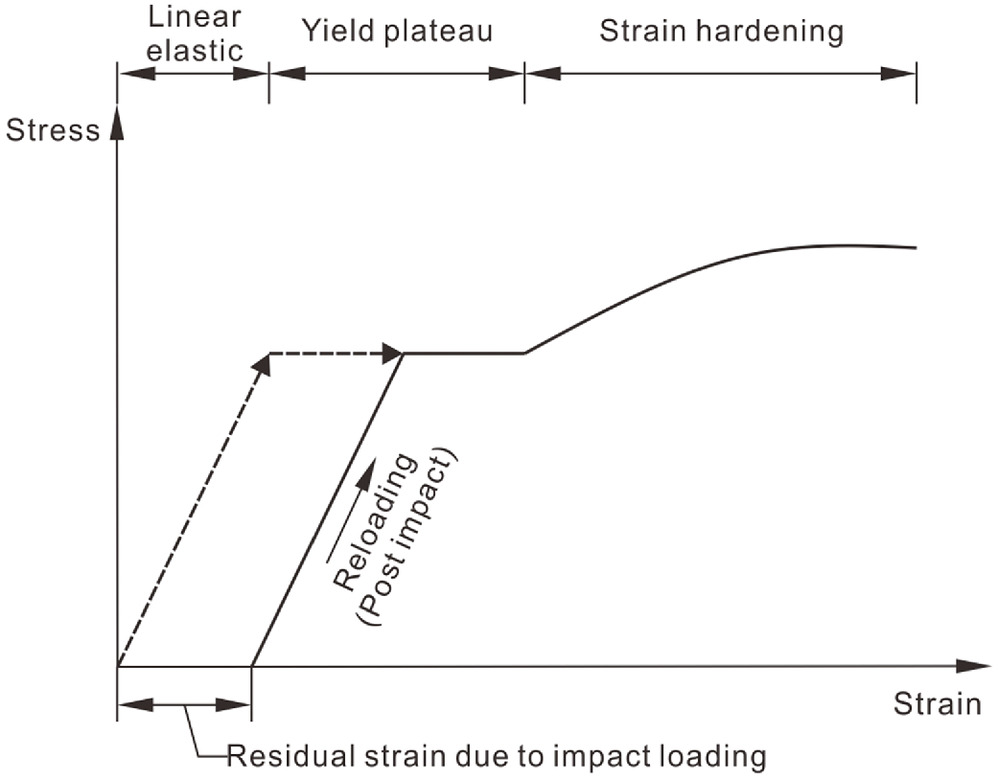
Considering both the residual rebar strains after the impact test (Table 4) and the maximum rebar strains during the static flexural test, the final rebar strains were lower than the strain required for strain hardening in all the cases. Therefore, the behavior of the flexural rebar in the impact and static tests can be assumed, as shown in Fig. 8, where the behavior of the flexural rebars of the undamaged beams is expressed as dashed lines. The flexural rebar of the impact-damaged beams behaved along the reloading path, a solid line in Fig. 8. Consequently, it was confirmed from the rebar strain data that the maximum load capacity of the damaged beam was similar to that of the intact beam, because the performance of the flexural reinforcing bar was not affected significantly by impact damage in the test cases in this study.
As mentioned in the Introduction, the results of previous studies (Adhikary et al. 2015b; Liu et al. 2017; Dok et al. 2020) on the load capacity of damaged beams were different. Adhikary et al. (2015b) examined the reduction in load capacity with an increase in the impact energy. The load capacity of some damaged beams was found to be similar to or larger than that of intact beams due to strain hardening of the rebars. However, the load capacity of the other damaged beams tended to decrease by up to approximately 40% as the impact energy increased. This may have been due to the permanent compressive deformation at the top of the beam caused by the residual deflection. Residual deflection above a certain level may cause permanent compressive deformation that cannot be ignored, and beam crushing may have occurred before the beam reached sufficient flexural strength. Liu et al. (2017) reported that the load capacity increased by up to 10% at a low impact energy level, but the load capacity decreased by up to 3% at a high impact energy level. Liu et al. (2017) stated that this phenomenon was due to the strain hardening of the flexural rebar. Dok et al. (2020) stated that there was no significant difference in the residual flexural strength because of the minimal changes in the flexural rebar strength and lever arm length in the static tests.
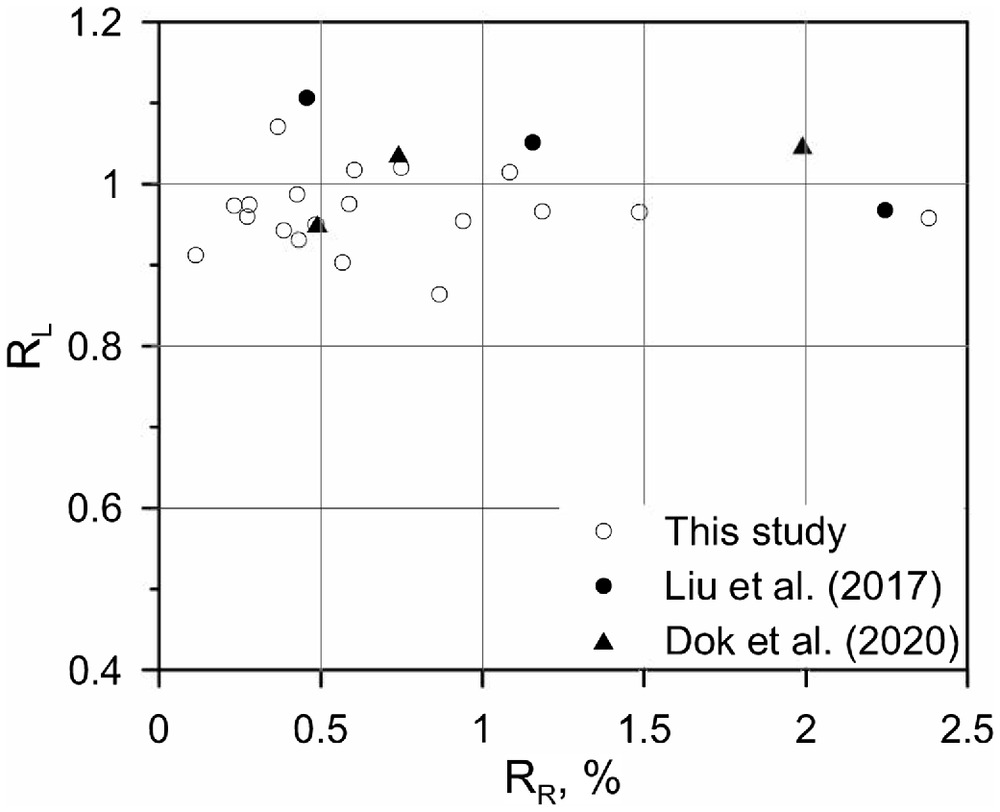
Considering all these results, including those of this study, it is crucial to evaluate the residual strain of flexural reinforcing bars after the application of impact loads to evaluate the load capacity of the damaged beam. However, it is challenging to measure the rebar strain in actual structures. Instead, the residual deflection due to impact loading can be considered to be an indicator of the rebar residual strain. Fig. 9 shows the relationship between and the residual deflection ratio () in this and previous studies (Liu et al. 2017; Dok et al. 2020). Parameter is the ratio of the residual deflection measured after the impact test to the span length. Adhikary et al. (2015b) did not state the residual deflection; therefore, it cannot be included in Fig. 9. When the was less than 2.5%, the was within a similar range and did not decrease significantly with an increase in the . In conclusion, the residual load capacity of the damaged beam was dominated primarily by the postimpact performance of the flexural rebars, and the residual load capacity maintained its original performance within a 10% difference at .
Flexural Stiffness
To evaluate the stiffness of the damaged beams, Dok et al. (2020) used the flexural stiffness, whereas Adhikary et al. (2015b) and Liu et al. (2017) used the seant stiffness. The flexural stiffness was evaluated from 75% of the yield load and the corresponding deflection. The secant stiffness was calculated by joining the origin to the peak load point.
The flexural stiffness value was used in this study, and the results are summarized in Table 5, where the flexural stiffness ratio () is defined as the ratio of the flexural stiffness of the damaged beam to that of the undamaged beam of the same group. The flexural stiffness of the impact-damaged beam was 18% lower, on average, than that of the intact beam (Table 5). The reduction in stiffness was due to local damage around the impact area (Fig. 3). Local damage is influenced by numerous factors, such as the material and geometry of the impactor and specimen, the impact energy, and the impact velocity. Therefore, this study used the ratio of the maximum impact force to the static flexural strength as an indicator of local damage, because this ratio is a comprehensive result of the mentioned factors and is related directly to local damage. It was confirmed that the concrete spalling area in the experiment tended to increase with the increase in the ratio of the maximum force to the static flexural strength, and therefore it was verified that this ratio can be used as an indicator of local damage. Fig. 10(a) presents the relationship between the in Table 5 and the ratio of the maximum impact force to maximum load capacity. Fig. 10(a) confirms that the of each group tended to decrease with an increase in the ratio of the maximum impact force to the maximum load capacity. Overall, the data had a similar trend. The correlation coefficient between the ratios was calculated to measure the linear correlation between the two variables. The values ranged between and 1.0. A value of 1.0 indicates a perfect positive linear relationship and indicates a perfect negative linear relationship. The correlation coefficient between the and the ratio of the maximum impact force to maximum load capacity was , which implies a moderate inverse relationship between these two variables (Ratner 2009).
| Group | Specimen ID | Flexural stiffness | |
|---|---|---|---|
| Value () | |||
| 1 | E30-C40-H6-M0 | 147 | — |
| E30-C40-H6-M1 | 103 | 0.70 | |
| E30-C40-H6-M2 | 110 | 0.75 | |
| E30-C40-H6-M3 | 115 | 0.78 | |
| 2 | E30-C40-H5-M0 | 77 | — |
| E30-C40-H5-M1 | 67 | 0.86 | |
| E30-C40-H5-M2 | 72 | 0.92 | |
| E30-C40-H5-M3 | 74 | 0.96 | |
| 3 | E30-C28-H6-M0 | 117 | — |
| E30-C28-H6-M1 | 96 | 0.82 | |
| E30-C28-H6-M2 | 103 | 0.88 | |
| E30-C28-H6-M3 | 103 | 0.88 | |
| 4 | E30-C28-H8-M0 | 223 | — |
| E30-C28-H8-M1 | 187 | 0.84 | |
| E30-C28-H8-M2 | 187 | 0.84 | |
| E30-C28-H8-M3 | 194 | 0.87 | |
| 5 | E50-C40-H6-M0 | 115 | — |
| E50-C40-H6-M1 | 93 | 0.80 | |
| E50-C40-H6-M2 | 92 | 0.80 | |
| E50-C40-H6-M3 | 106 | 0.92 | |
| 6 | FS1 | 31 | — |
| E30-FS1 | 24 | 0.75 | |
| E50-FS1 | — | — | |
| 7 | FS2 | 38 | — |
| E30-FS2 | 30 | 0.79 | |
| E50-FS2 | — | — | |
| 8 | FS3 | 48 | — |
| E30-FS3 | 40 | 0.82 | |
| E50-FS3 | 34 | 0.72 | |
Note: = ratio of flexural stiffness of damaged beam to that of undamaged beam.
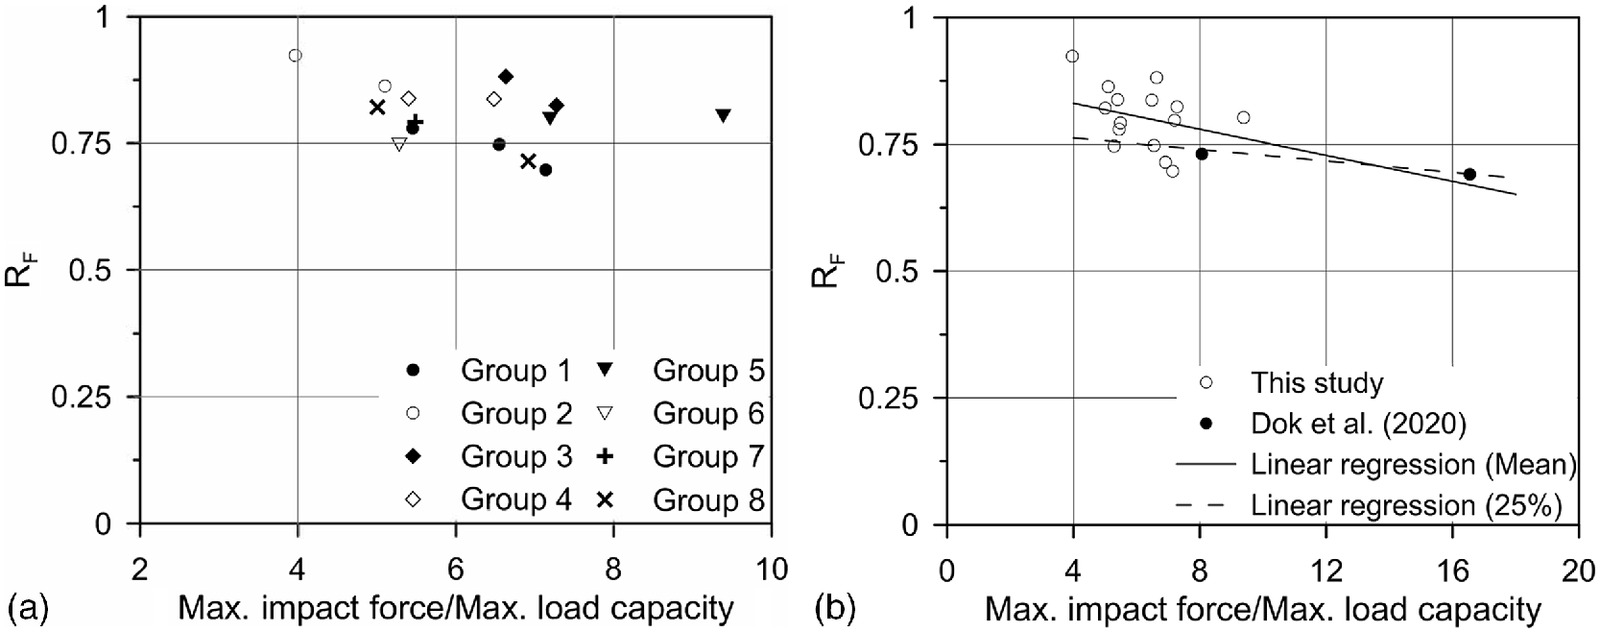
Two previous studies (Adhikary et al. 2015b; Liu et al. 2017) used secant stiffness values, and there was no information on the stiffness value. Therefore, the results of this study were compared with those of Dok et al. (2020) [Fig. 10(b)]. The results of Dok et al. (2020) had a similar trend with respect to the ratio of the maximum impact force to the maximum load capacity. In addition, as previously mentioned, the top surfaces of the E50-C40-H6-M1 and E50-C40-H6-M2 specimens in Group 5 were flattened using mortar; however, those of Groups 6–8 were not flattened. However, the of all data exhibited consistent trends. Furthermore, the of the E50-C40-H6-M1 and E50-C40-H6-M2 specimens was smaller than that of the E50-C40-H6-M3 specimen. Therefore, the flattening was found to have little effect on the flexural stiffness reduction due to the local damage of the damaged beams.
Eq. (5) is proposed to estimate the conservatively. It was difficult to draw a definitive regression model because of the limited amount of test data within the test range of Dok et al. (2020) and this study. Therefore, a quantile regression method with a simple linear model was used to derive Eq. (5), which provides a conservative estimation of the . When the general linear regression method was used to estimate the mean value, a nonconservative evaluation of the was found [Fig. 10(b)]. However, when using Eq. (5), which is a quantile regression model, to estimate the 25% value, the ratio of the test value to the predicted value was 1.07, on average, which is a more conservative prediction. Therefore, it is expected that Eq. (5) can be applied to evaluate the flexural stiffness ratio of impact-damaged RC memberswhere = predicted flexural stiffness ratio; = maximum impact force; and = maximum load capacity. Eq. (5) is valid for a range of between 4 and 16.
(5)
Displacement Ductility
The displacement ductility was calculated as the ratio of the maximum displacement to the displacement corresponding to the onset of yielding of the flexural rebar (Table 6). Moreover, the ratio of displacement ductility () was calculated as the ratio of the displacement ductility of the damaged beam to that of the undamaged beam in the same group. From these ratios, it was found that the displacement ductility of the impact-damaged beams was reduced by as much as 31%, on average, compared with that of the undamaged beams. The residual deflection and local damage due to the impact load can be considered to be the causes of the reduction in displacement ductility. The residual deflection caused a permanent compressive deformation at the top of the beam. Local damage accompanied the localized deformation at the top of the beam around the impact area, thus reducing the performance of the top fiber of the impact-damaged beam (Fig. 3). Because of both effects, when the strain at the top fiber reached the ultimate strain, the neutral axis of the impact-damaged beam had to move toward the bottom to generate a similar level of compressive force to that of the undamaged beam. Consequently, the maximum curvature of the impact-damaged beam was smaller than that of the undamaged beams, thereby reducing their displacement ductility. Therefore, it can be inferred that the displacement ductility of the impact-damaged beams decreased because of both effects.
| Group | Specimen ID | Displacement ductility | |
|---|---|---|---|
| Value | |||
| 1 | E30-C40-H6-M0 | 2.93 | — |
| E30-C40-H6-M1 | 1.53 | 0.52 | |
| E30-C40-H6-M2 | 1.84 | 0.63 | |
| E30-C40-H6-M3 | 1.73 | 0.59 | |
| 2 | E30-C40-H5-M0 | 1.72 | — |
| E30-C40-H5-M1 | 1.23 | 0.72 | |
| E30-C40-H5-M2 | 1.30 | 0.76 | |
| E30-C40-H5-M3 | 1.17 | 0.68 | |
| 3 | E30-C28-H6-M0 | 3.40 | — |
| E30-C28-H6-M1 | 1.93 | 0.57 | |
| E30-C28-H6-M2 | 2.08 | 0.61 | |
| E30-C28-H6-M3 | 1.87 | 0.55 | |
| 4 | E30-C28-H8-M0 | 3.50 | — |
| E30-C28-H8-M1 | 2.64 | 0.75 | |
| E30-C28-H8-M2 | 2.38 | 0.68 | |
| E30-C28-H8-M3 | 2.60 | 0.74 | |
| 5 | E50-C40-H6-M0 | 2.30 | — |
| E50-C40-H6-M1 | 1.47 | 0.64 | |
| E50-C40-H6-M2 | 1.36 | 0.59 | |
| E50-C40-H6-M3 | 1.74 | 0.76 | |
| 6 | FS1 | 1.36 | — |
| E30-FS1 | 1.37 | 1.00 | |
| E50-FS1 | — | — | |
| 7 | FS2 | 1.70 | — |
| E30-FS2 | 1.38 | 0.81 | |
| E50-FS2 | — | — | |
| 8 | FS3 | 1.86 | — |
| E30-FS3 | 1.71 | 0.92 | |
| E50-FS3 | 1.26 | 0.68 | |
Note: = ratio of displacement ductility of damaged beam to that of undamaged beam.
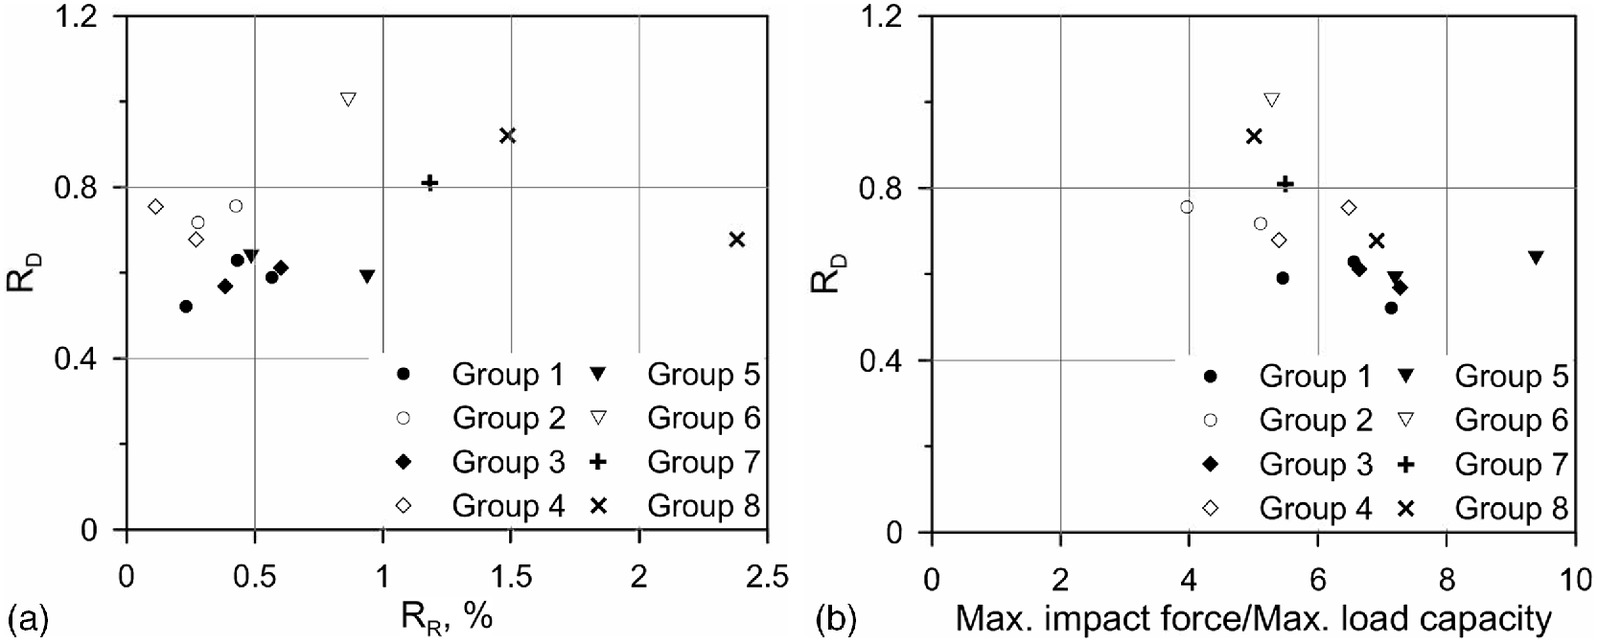
The relationships between the reduction in displacement ductility and residual deflection and between the reduction in displacement ductility and local damage were examined. Fig. 11(a) presents the relationship between the and . Fig. 11(b) shows the relationship between the ratio of the maximum impact force to the maximum load capacity and the . The did not change with respect to the [Fig. 11(a)]. In contrast, the exhibited a decreasing trend with an increase in the ratio of the maximum impact force to the maximum load capacity. In particular, the correlation coefficient between the and the ratio of the maximum impact force to the maximum load capacity was calculated to be . The result indicates that the ratio of the maximum impact force to the maximum load capacity tended to be inversely proportional to the , and also had a moderate linear relationship. Among previous studies (Adhikary et al. 2015b; Liu et al. 2017; Dok et al. 2020), only Dok et al. (2020) reported the displacement ductility value. Therefore, the results of this study were compared with those of Dok et al. (2020) (Fig. 12). The results of Dok et al. (2020) exhibited a similar trend with respect to the ratio of the maximum impact force to the maximum load capacity. From these results, it can be concluded that the local damage, not the residual deflection, has a significant effect on the reduction in displacement ductility. As previously mentioned, the relationship between the displacement ductility and maximum impact force of the overall data was consistent. Furthermore, the of the E50-C40-H6-M1 and E50-C40-H6-M2 specimens, which were flattened at the top surface, were smaller than that of the E50-C40-H6-M3 specimen. Therefore, the flattening of the top surface is inferred to have little effect on the local damage, and this finding is similar to the result for the flexural stiffness.
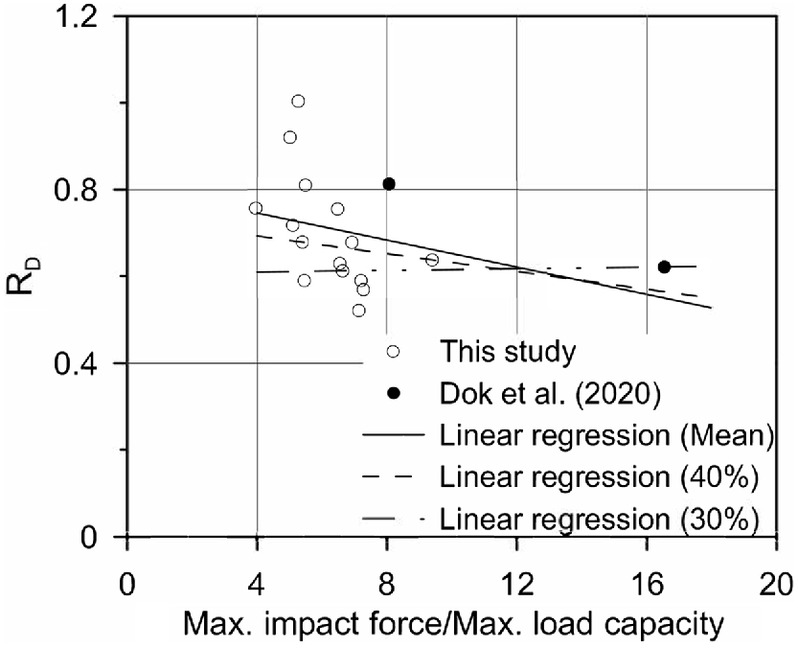
Eq. (6) was derived using the same method as Eq. (5) to predict conservatively the . However, for displacement ductility, a quantile regression was conducted to estimate the 40% value, because below the 40% value, the estimation line deviated too far from the trend of the test data (Fig. 12). In the case of Eq. (6), the ratio of the test value to the predicted value was 1.09, which ensures conservative predictions. Therefore, Eq. (6) can be used to evaluate the postimpact displacement ductility of RC members subjected to impact loadingwhere = predicted displacement ductility ratio. Eq. (6) is valid for a range of between 4 and 16.
(6)
Conclusions
This study investigated the residual behavior of RC beams damaged by impact loads by conducting static flexural tests using both impact-damaged and intact beams. The residual performance of the impact-damaged RC beams was evaluated by examining the residual behaviors, including the maximum load capacity, flexural stiffness, and displacement ductility, and the results were compared with those of the intact beams. The main results of this study are as follows:
1.
Intact RC beams exhibited a typical crack pattern with flexural failure. In contrast, the impact-damaged RC beams exhibited remarkable diagonal shear cracks under impact loads. After the impact test, the existing diagonal cracks were further widened in the static flexural test, and a few new cracks were observed in the damaged beams.
2.
The maximum load capacity of the damaged beams did not differ significantly from that of the intact beams in the residual deflection ratio range of up to 2.5%. This was because the maximum load capacity of the damaged beams was affected primarily by the postimpact performance of the flexural rebars, and the postimpact performance of the rebars did not decrease significantly in the corresponding deflection ratio range. This was confirmed from the flexural rebar strain values measured during impact and static flexural tests.
3.
The flexural stiffness and displacement ductility of the damaged beams were reduced compared with those of the intact beams. The relationships between these two values and the ratio of the maximum impact force to the maximum load capacity were investigated to examine the effect of local damage on the reduction in residual performance. Consequently, it was confirmed that local damage affected the reduction in flexural stiffness and displacement ductility. Conservative prediction equations for the flexural stiffness ratio and displacement ductility ratio were proposed using the quantile regression method, and they can be applied for up to 16.
As mentioned previously, it was found that the load capacity of impact-damaged beams could be similar to that of intact beams, depending on the performance of the flexural rebar after impact loading. However, excessive deflection and brittle failure can occur due to reduced flexural stiffness and displacement ductility. Therefore, an evaluation of the appropriate residual performance should be conducted. For this, conservative equations to estimate residual performance were suggested. If it is determined that the degree of damage does not affect the performance of the beam significantly, it is expected that the reuse of the damaged beams will be possible as it is or after proper reinforcement to mitigate the effect of the damage. However, the proposed equations and investigations were verified only within the range of the experiments in this study. Therefore, further experimental studies are recommended to improve the predictive accuracy of equations and to obtain more general conclusions.
Notation
The following symbols are used in this paper:
- distance from center of concentrated load to center of support;
- width of cross section;
- compressive force in concrete;
- force of longitudinal compression reinforcement;
- distance from extreme compression fiber to neutral axis;
- infinitesimal span length;
- distance from extreme compression fiber to centroid of longitudinal compression reinforcement;
- distance from extreme compression fiber to centroid of longitudinal tension reinforcement;
- elastic modulus of concrete;
- applied concentrated load;
- maximum impact force;
- maximum load capacity;
- normal stress at a concrete fiber;
- compressive strength of concrete;
- yield strength for reinforcing bars;
- ultimate tensile strength for reinforcing bars;
- depth of member;
- moment by concentrated loads;
- maximum moment in a span length;
- prediction of displacement ductility ratio;
- prediction of flexural stiffness ratio;
- tensile force in concrete;
- force of longitudinal tension reinforcement;
- distance from extreme compression fiber to centroid of a concrete fiber;
- central displacement;
- strain at extreme concrete compression fiber;
- fracture strain of reinforcing bars;
- strain of longitudinal compression reinforcement;
- strain of longitudinal tension reinforcement;
- yield strain of reinforcing bars; and
- curvature.
Data Availability Statement
All data, models, and code generated or used during the study appear in the published article.
Acknowledgments
This work was supported by a National Research Foundation of Korea (NRF) grant funded by the Korea government (Grant No. NRF-2020R1A2B5B0200201012), a Korea Agency for Infrastructure Technology Advancement (KAIA) grant funded by the Ministry of Land, Infrastructure and Transport of the Korean Government (Grant No. 22DPSC-C163238-02), and the Institute of Construction and Environmental Engineering at Seoul National University. The tests in this work were conducted with the assistance of the Extreme Performance Testing Center at Seoul National University.
References
ACI (American Concrete Institute). 2014. Code requirements for nuclear safety-related concrete structures. ACI 349-13. Farmington Hills, MI: ACI.
ACI (American Concrete Institute). 2019. Building code requirements for structural concrete. ACI 318-19. Farmington Hills, MI: ACI.
Adhikary, S. D., B. Li, and K. Fujikake. 2012. “Dynamic behavior of reinforced concrete beams under varying rates of concentrated loading.” Int. J. Impact Eng. 47 (Jun): 24–38. https://doi.org/10.1016/j.ijimpeng.2012.02.001.
Adhikary, S. D., B. Li, and K. Fujikake. 2014. “Effects of high loading rate on reinforced concrete beams.” ACI Struct. J. 111 (3): 651–660. https://doi.org/10.14359/51686579.
Adhikary, S. D., B. Li, and K. Fujikake. 2015a. “Low velocity impact response of reinforced concrete beams: Experimental and numerical investigation.” Int. J. Prot. Struct. 6 (1): 81–111. https://doi.org/10.1260/2041-4196.6.1.81.
Adhikary, S. D., B. Li, and K. Fujikake. 2015b. “Residual resistance of impact-damaged reinforced concrete beams.” Mag. Concr. Res. 67 (7): 364–378. https://doi.org/10.1680/macr.14.00312.
Ahn, H. 2021. “Effect of flexural stiffness on impact behavior of RC beam subjected to low-velocity impact loading.” Masters’ thesis, Dept. of Civil and Environmental Engineering, Seoul National Univ.
Bhatti, A. Q., N. Kishi, and H. Mikami. 2011. “An applicability of dynamic response analysis of shear-failure type RC beams with lightweight aggregate concrete under falling-weight impact loading.” Mater. Struct. 44 (1): 221–231. https://doi.org/10.1617/s11527-010-9621-9.
Chen, Y., and I. M. May. 2009. “Reinforced concrete members under drop-weight impacts.” Proc. Inst. Civ. 162 (1): 45–56. https://doi.org/10.1680/stbu.2009.162.1.45.
Cotsovos, D. M. 2010. “A simplified approach for assessing the load-carrying capacity of reinforced concrete beams under concentrated load applied at high rates.” Int. J. Impact Eng. 37 (8): 907–917. https://doi.org/10.1016/j.ijimpeng.2010.01.005.
Department of Defense. 2008. Structures to resist the effects of accidental explosions. UFC 3-340-02. Washington, DC: Unified Facilities Criteria.
Dok, G., N. Caglar, A. Ilki, and C. Yilmaz. 2020. “Effect of impact loading on residual flexural capacity of high-strength reinforced concrete beams.” Structures 27 (Oct): 2466–2480. https://doi.org/10.1016/j.istruc.2020.08.054.
Fujikake, K., B. Li, and S. Soeun. 2009. “Impact response of reinforced concrete beam and its analytical evaluation.” J. Struct. Eng. 135 (8): 938–950. https://doi.org/10.1061/(ASCE)ST.1943-541X.0000039.
Hwang, H. J., F. Yang, L. Zang, J. W. Baek, and G. Ma. 2020. “Effect of impact load on splice length of reinforcing bars.” Int. J. Concr. Struct. Mater. 14 (1): 1–17. https://doi.org/10.1186/s40069-020-00414-z.
Kishi, N., and H. Mikami. 2012. “Empirical formulas for designing reinforced concrete beams under impact loading.” ACI Struct. J. 109 (4): 509–519. https://doi.org/10.14359/51683870.
Kishi, N., H. Mikami, K. G. Matsuoka, and T. Ando. 2002. “Impact behavior of shear-failure-type RC beams without shear rebar.” Int. J. Impact Eng. 27 (9): 955–968. https://doi.org/10.1016/S0734-743X(01)00149-X.
Kishi, N., O. Nakano, K. G. Matsuoka, and T. Ando. 2001. “Experimental study on ultimate strength of flexural-failure-type RC beams under impact loading.” In Proc., 16th Int. Conf. on Structural Mechanics in Reactor Technology, 1–7. Washington, DC: International Association for Structural Mechanics in Reactor Technology.
Liu, H., K. Hu, J. Huo, and Y. Liu. 2017. “Experimental study on flexural behavior of impact-damaged reinforced concrete beams.” In Proc., 7th China-Japan-US Trilateral Symp. on Lifeline Earthquake Engineering, 69–76. Reston, VA: ASCE. https://doi.org/10.1061/9780784480342.010.
Ratner, B. 2009. “The correlation coefficient: Its values range between +1/−1, or do they?” J. Target Meas. Anal. Market. 17 (2): 139–142. https://doi.org/10.1057/jt.2009.5.
Saatci, S., and F. J. Vecchio. 2009. “Effects of shear mechanisms on impact behavior of reinforced concrete beams.” ACI Struct. J. 106 (1): 78–86. https://doi.org/10.14359/56286.
Schellenberg, K., A. Volkwein, A. Roth, and T. Vogel. 2007. “Large-scale impact tests on rock fall galleries.” In Proc., 7th Int. Conf. on Shock & Impact Loads on Structures, 497–504. Singapore: CI-Premier.
Soleimani, S. M., N. Banthia, and S. Mindess. 2007. “Behavior of RC beams under impact loading: Some new findings.” In Proc., 6th Int. Conf. on Fracture Mechanics of Concrete and Concrete Structures, 867–874. London: Taylor & Francis.
Tachibana, S., H. Masuya, and S. Nakamura. 2010. “Performance based design of reinforced concrete beams under impact.” Nat. Hazards Earth Syst. Sci. 10 (6): 1069–1078. https://doi.org/10.5194/nhess-10-1069-2010.
Thorenfeldt, E. 1987. “Mechanical properties of high-strength concrete and applications in design.” In Proc., Symp. Proc., Utilization of High-Strength Concrete, 149–159. Norway, Europe.
Yu, Y., S. Lee, and J.-Y. Cho. 2021. “Deflection of reinforced concrete beam under low-velocity impact loads.” Int. J. Impact Eng. 154 (Aug): 103878. https://doi.org/10.1016/j.ijimpeng.2021.103878.
Zhan, T., Z. Wang, and J. Ning. 2015. “Failure behaviors of reinforced concrete beams subjected to high impact loading.” Eng. Fail. Anal. 56 (Oct): 233–243. https://doi.org/10.1016/j.engfailanal.2015.02.006.
Information & Authors
Information
Published In

Journal of Structural Engineering
Volume 149 • Issue 3 • March 2023
Copyright
This work is made available under the terms of the Creative Commons Attribution 4.0 International license, https://creativecommons.org/licenses/by/4.0/.
History
Received: May 26, 2022
Accepted: Oct 18, 2022
Published online: Dec 30, 2022
Published in print: Mar 1, 2023
Discussion open until: May 30, 2023
ASCE Technical Topics:
- Beams
- Concrete
- Concrete beams
- Continuum mechanics
- Dynamic loads
- Dynamics (solid mechanics)
- Engineering fundamentals
- Engineering materials (by type)
- Engineering mechanics
- Flexural strength
- Impact loads
- Load tests
- Material mechanics
- Material properties
- Materials engineering
- Reinforced concrete
- Solid mechanics
- Static loads
- Statics (mechanics)
- Stiffening
- Strength of materials
- Structural behavior
- Structural dynamics
- Structural engineering
- Structural members
- Structural systems
- Tests (by type)
Authors
Metrics & Citations
Metrics
Citations
Download citation
If you have the appropriate software installed, you can download article citation data to the citation manager of your choice. Simply select your manager software from the list below and click Download.