Novel Method for Segment Identification in Water Distribution Network through Node-Based Adjacency Matrix
Publication: Journal of Pipeline Systems Engineering and Practice
Volume 14, Issue 4
Abstract
With the deterioration growth of water pipes, the frequency of identifying segments and unintended isolation in water distribution networks is expected to increase, because it can help identify the number of nodes that cannot be supplied and their locations when a failure occurs. Therefore, a methodology for identifying segments and unintended isolation was developed and verified using examples. In addition, a case study was conducted to confirm that the proposed methodology could be applied to actual fields. The proposed method only requires the node-based adjacency matrix for identification, where the connectivity of the current network can be intuitively understood with the constructed matrices. Moreover, this methodology is easy to adopt using the single row-first search method. The proposed framework is compatible with the data storage format of hydraulic analysis software. Finally, the proposed methodology can be used in various research on configuring and analyzing water distribution networks.
Introduction
A water distribution network (WDN) consists of interconnected pipes, valves, and other auxiliary facilities. Among the elements, valves are used for various purposes. The control valve is installed to block the flow of water when an inappropriate event, such as leaks, breakage, or water quality problems, occurs in WDNs. Control valves, mainly the gate valve expressed as a type of valve, are fully opened at normal conditions and closed only when necessary. Ideally, control valves should be installed at both ends of all pipes to ensure that the WDN ends with only one element loss. Control valves installed at both ends of the pipe make it possible to minimize the range of impact of an inappropriate event.
However, in practice, installing control valves at both ends of all pipes is challenging owing to financial limitations. Thus, control valves are installed depending on the WDN construction budget or according to the appropriate spacing. Standards that present design criteria for WDN, such as those of the American Water Works Association (AWWA) (AWWA 1986) and the Korean Ministry of the Environment (MOE) (MOE 2021), recommend installing control valves at intervals of 150 to 200 m, exceptional special cases. In addition, rules centered on junctions (nodes), such as the and valving rules, regularize the control valve installation. The valving rule involves placing the same number () of valves as the number of nodes, whereas the valving rule involves placing one valve less than the number of nodes (AWWA 1986).
Because the control valves are not installed at both ends of all pipes in WDN, leakage or breakage of pipes not only simply causes the disconnection of pipes from the WDN but also causes the disconnection of nodes according to the or valving rules. Herein, the concept of a segment appears. A segment represents minimum intended isolation, an area intentionally isolated by control valves. A segment helps identify the number of nodes without water supply and locations due to the disconnection of pipes (Walski 1993, 2020). Fig. 1 shows the conceptual diagram of a segment.
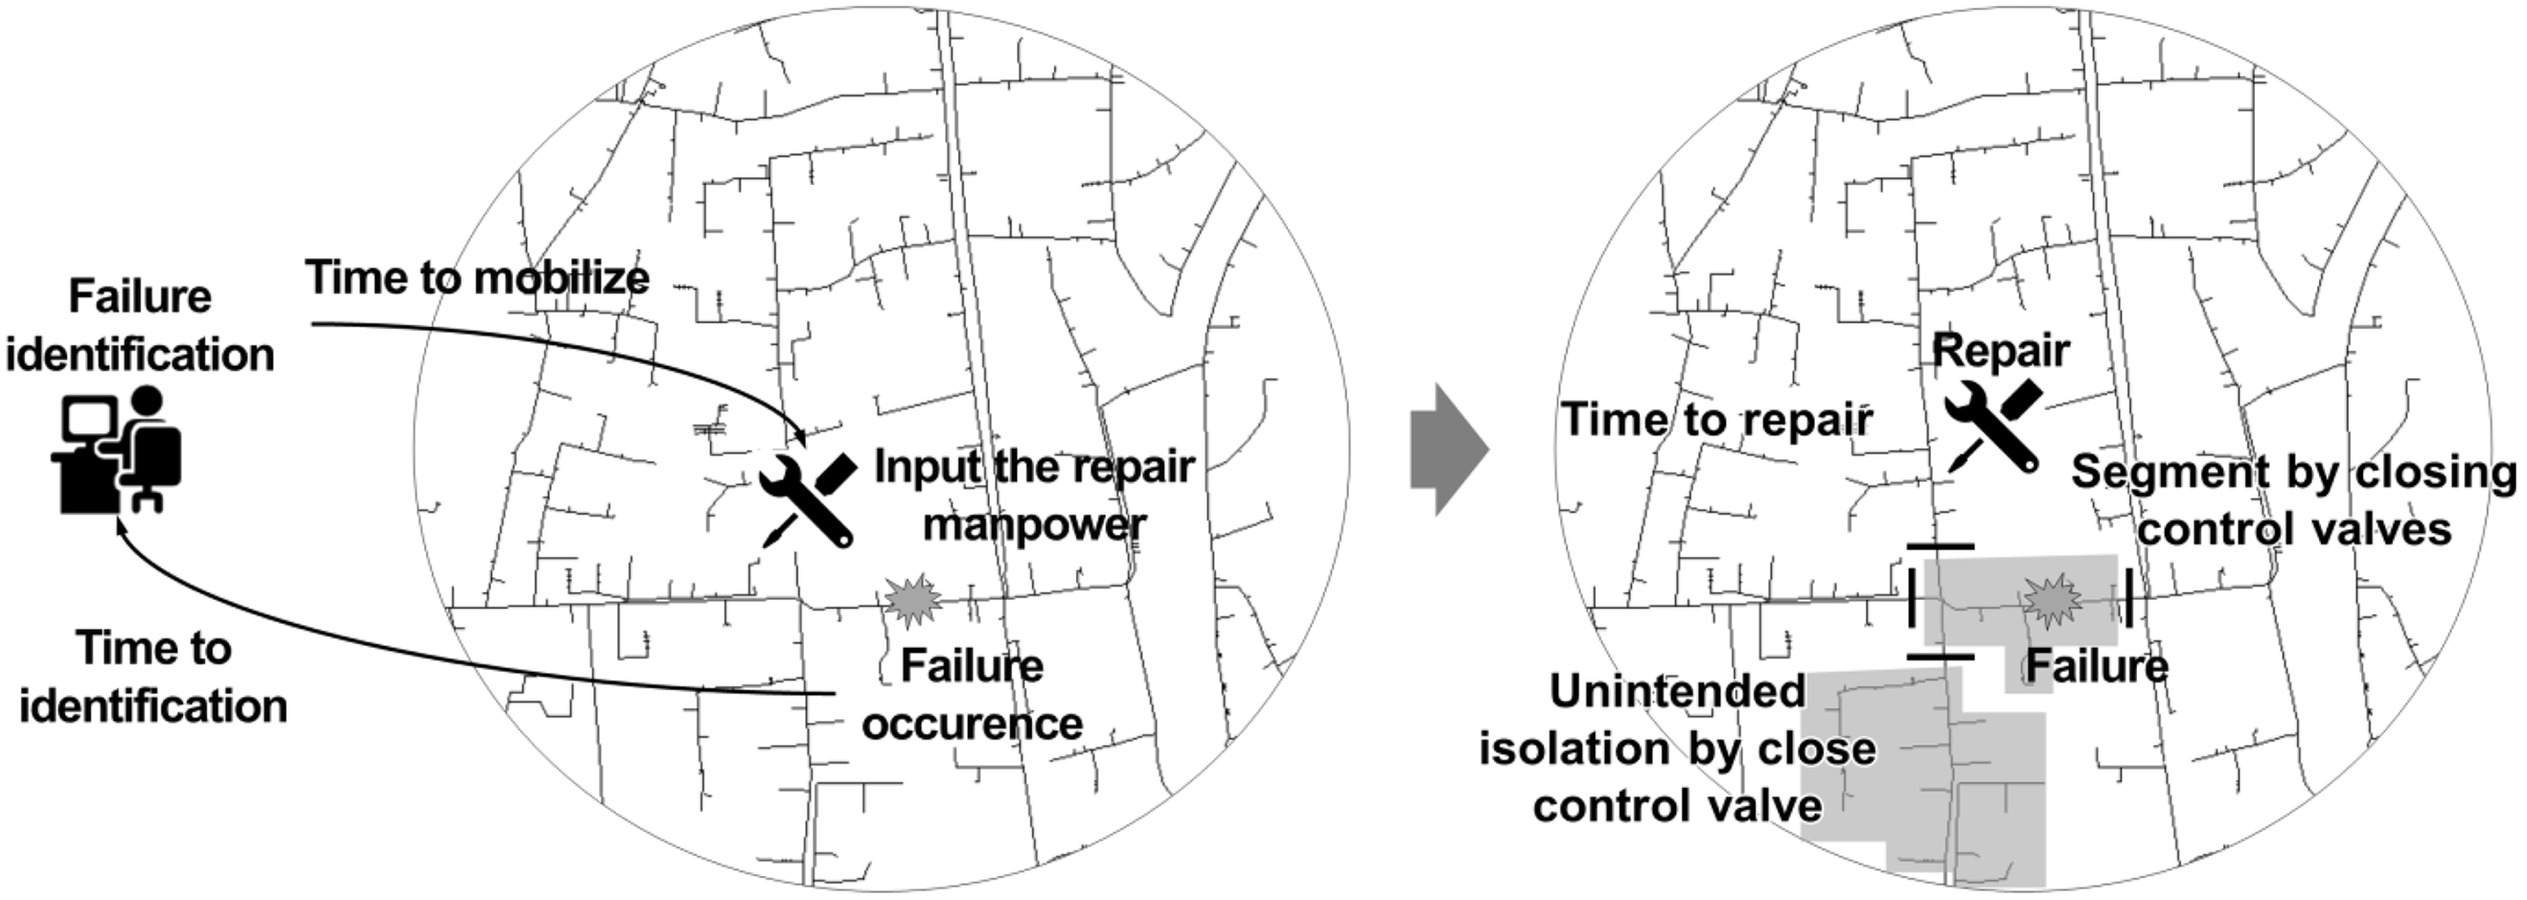
By applying and extending the concept of segment, the WDN manager can recognize the unavailable supply area and devise countermeasures in inappropriate events. In previous studies, segments have been used in various studies to determine the scope of potential water-supply cutoff and analyze the reliability of the WDN in situations associated with breakage, leakage, or maintenance of water pipes (Choi and Koo 2015; Diao et al. 2016; Liu and Kang 2021). Furthermore, closing control valves to make segments to restore failed or broken water pipes may create areas without water supply. Areas without water supply unintentionally created in forming segments are defined as unintentionally isolated areas (Jun and Loganathan 2007). Unintended isolation has also been used in the studies mentioned previously because it has always been connected with the concept of a segment.
With the concept of a segment, various events occurring in the real system can be simulated more realistically. For example, suppose managers identify the segment in advance. In that case, they can decide exactly which valves to close when a water supply must be cut off to repair a leak or when a contaminant enters the network and needs to be stopped from spreading. However, to identify the segment in advance and simulate the events as realistically as possible, there should be rules for the computer to recognize how pipes or valves are connected to the WDN. In particular, this rule should be developed in advance to build a digital-twin system based on near-real-time simulation. Therefore, various methodologies have been developed for identifying segments. Because the WDN consists of vertices or nodes and edges or lines, it can be regarded as a graph. Accordingly, graph theory was used in previous studies determining the segments separated by the control valves installed in the WDN. Graph theory allows a structure defined by nodes and pipes to be expressed as a mathematical matrix or in diagrammatic form for achieving the desired calculation results.
Jun and Loganathan (2007) proposed a methodology to determine segments and unintended isolation. Three incidence matrices between a node and a pipe were used for identifying segments. After a segment was determined, the matrix between the segment and the valve was constructed. By considering the connection of the segment with the water source in the segment–valve matrix, the unintended isolation was identified. The proposed methodology is characterized by requiring input data-file conversion of a hydraulic analysis program such as EPANET to identify the locations of the control valves, in addition to the separate depiction of the node–pipe incidence matrix, node–node adjacency matrix, segment–valve matrix, and the alternate execution of the row-search and column-search recursive functions. Giustolisi and Savic (2010), Creaco et al. (2010), and Alvisi et al. (2011) proposed a methodology to identify segments according to the connection matrix for nodes, water sources, and water pipes. These previous methodologies have the advantages of identifying segments and checking whether water is supplied; however, they have the limitation that hypothetical water sources should be simulated repeatedly to determine the unintended isolation.
Gao (2014) proposed a methodology to identify segments through the node and the adjacency matrix for the node by installing additional control valves paired with the placed control valves. The methodology uses Warshall’s algorithm to obtain faster results and requires the separation of the reconstruction of the matrix between segments to determine the unintended isolation. Mahmoud et al. (2017) proposed a revised segment determination methodology considering the data storage format of EPANET. The incidence matrix between the nodes and pipes and the adjacency matrix between the pipes were used to identify the segments and unintended isolation. Liu and Kang (2021), Huang et al. (2020), and Abdel-Mottaleb and Walski (2021) separated segments using a segment–valve graph. This methodology included partitioning the pipes into shorter pipes considering the valves on the pipes, which has the advantage of clearly defining the locations of the control valves. Hernandez and Ormsbee (2021) presented a methodology using the incidence matrix for nodes and pipes and the adjacency matrix between segments to determine the segments and unintended isolation. Jeong et al. (2021) proposed a methodology to solve the limitations of the unintended isolation identification algorithm proposed by Jun and Loganathan (2007). In particular, the unintended isolation can be interpreted in a distorted way when a segment consists of a pipe only.
An adjacency matrix shows the relationships between nodes in a graph with nodes and pipes. In contrast, an incidence matrix indicates the relationships between the nodes and pipes. If both the adjacent matrix and the incidence matrix are used to identify a segment, it is hard to discern the connection status of a specific node and pipe. This is because comparing and repeatedly checking the two matrices is necessary. Therefore, the analysis efficiency can be increased by using only one of the adjacency matrix or the incidence matrix to determine the connection status of nodes and pipes. In addition, in most commercial hydraulic analysis programs for WDNs, such as EPANET, the role of a control valve is simulated by selecting Open or Close in the properties of the water pipes. Here, a throttle control valve is often used to depict control valves. This method assumes that the control valves are at the center of the water pipes.
However, in a real WDN, the control valves are often adjacent to a node (either a start or end node), and in some cases, the control valves are placed at both ends of the pipes. Because the hydraulic analysis program cannot accurately express the position of the valve, previous studies have complicatedly modeled this situation, e.g., creating new connections by partitioning existing pipes and adding a node and pipe. Because most hydraulic analysis programs consider a valve as a pipe, the valve is also expressed with a start node and an end node. Therefore, it is necessary to use the data input/output form similar to that of the hydraulic analysis program to obtain results linked with hydraulic analysis.
The previously proposed methodologies for identifying segments and unintended isolation in WDNs have strengths and weaknesses. Based on these previous approaches, this study strives to develop a methodology for conveniently determining segments and unintended isolation without comparing many matrices. The proposed methodology only uses the node–node adjacency matrix and row-first search without employing node–pipe incidence matrices or other matrices, e.g., segment–valve or segment–segment. Furthermore, a new rule is applied considering the linkage with the hydraulic analysis program to identify the control valve locations.
This paper explains and verifies the proposed methodology using a simple WDN. Next, this paper analyzes the developed methodology by applying it to large-scale WDNs and by comparing it with the method used in previous studies. Through analysis, the strengths of the developed methodology are explained.
Method for Segment and Unintended Isolation Identification
To identify segments and unintended isolation, the adjacent matrix , describing the components of the WDN, is constructed. Moreover, the matrices and are used as auxiliaries to explain the configuration of . In what follows, the subscript in the and matrices denotes a matrix indicating the name of each pipe and valve, and the subscript denotes a matrix describing this with a numerical expression.
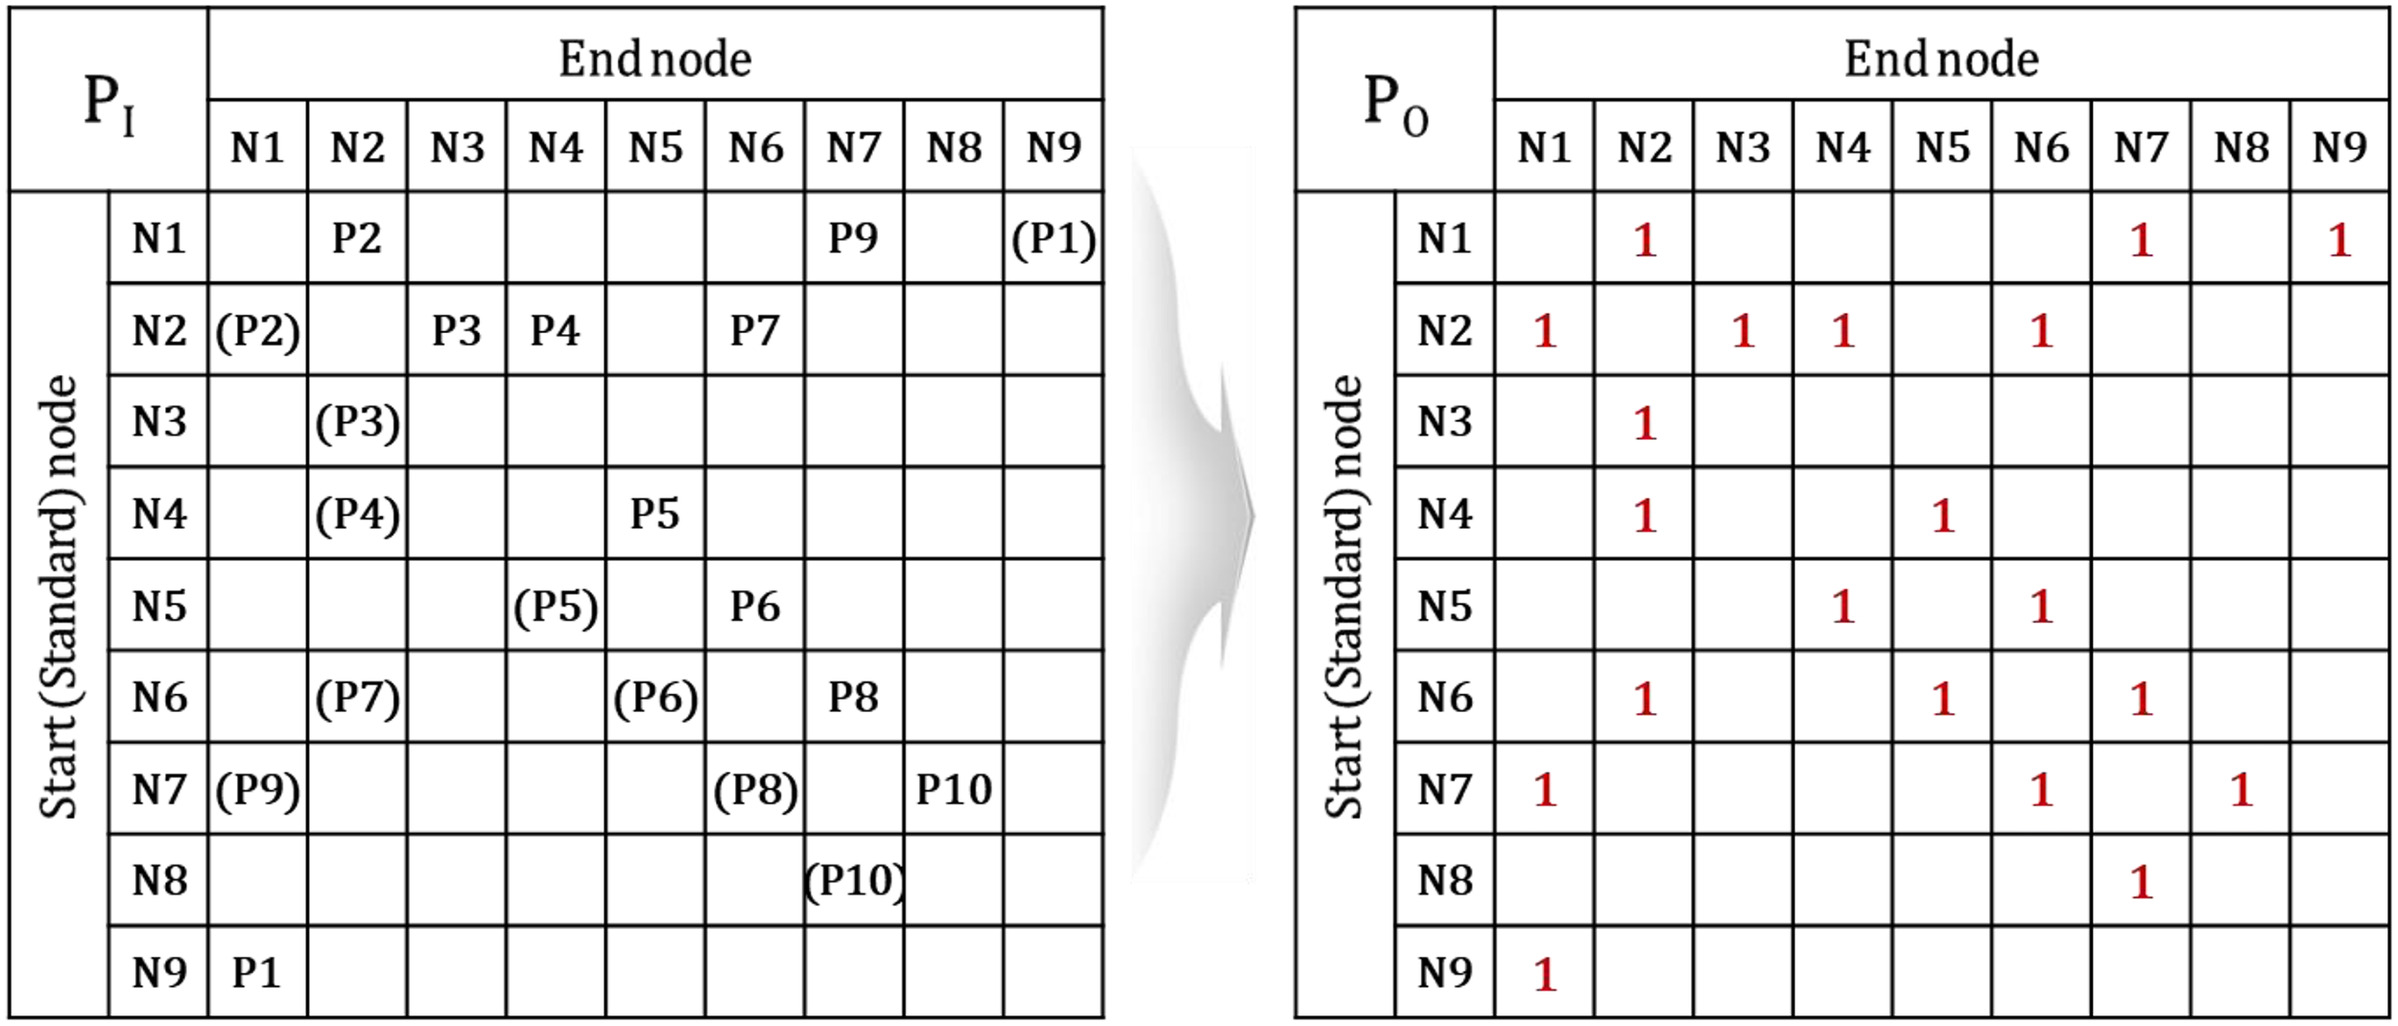
Adjacency Matrix P
The adjacency matrix is defined as a matrix indicating a connected water pipe between nodes. First, the ID of a pipe is entered in the cell (an intersection point of a row and a column) of the matrix. Subsequently, 1 is assigned to construct the adjacent matrix when the pipe ID is observed in the adjacent matrix . Alternatively, 0 is assigned to the adjacent matrix when the pipe ID is not entered in .
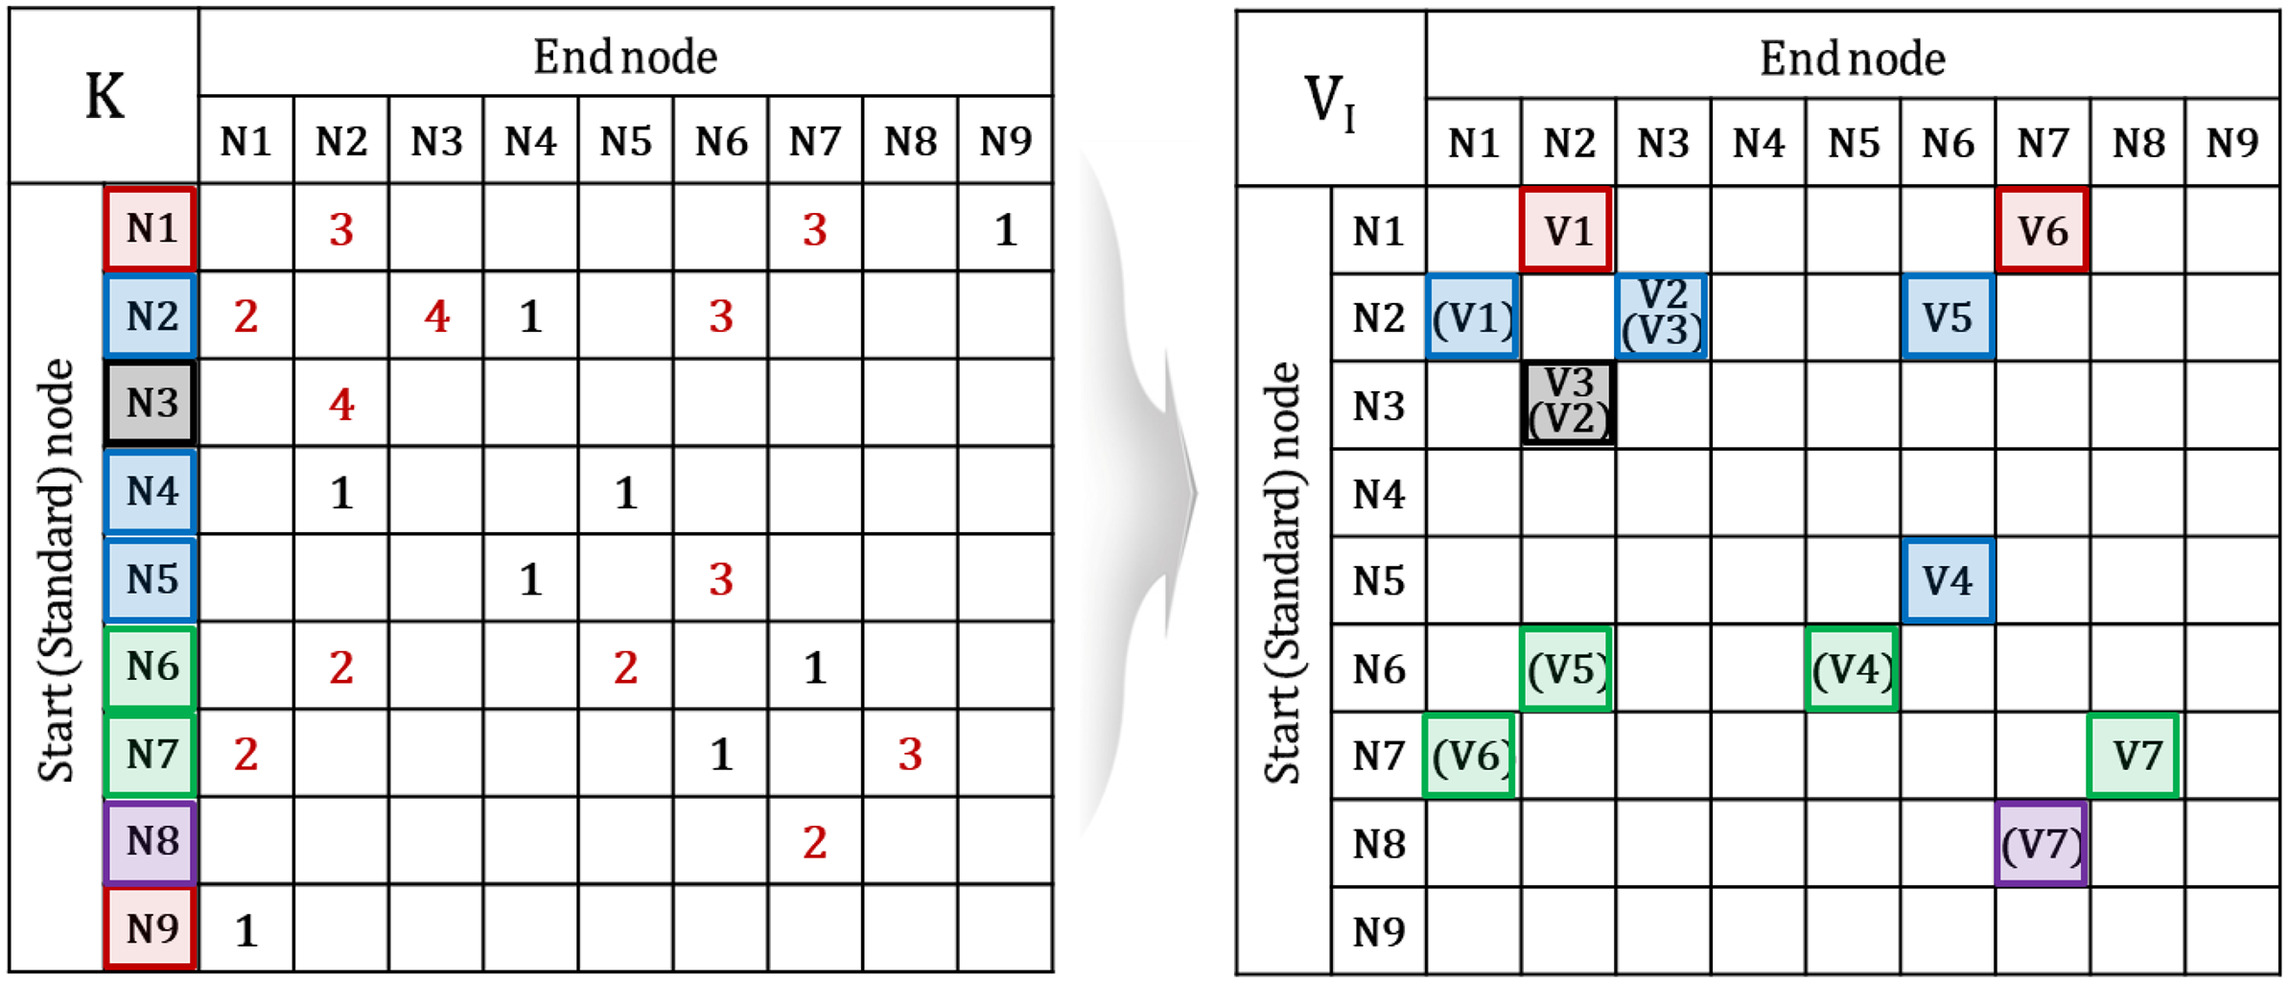
Adjacency Matrix V
The adjacency matrix indicates connected valves. First, the matrix is constructed by entering the valve ID in the matrix cell. Subsequently, a cell value of 2 is assigned if the valve is placed near the start node, and a cell value of 1 is assigned if the valve is placed away from the start node. All other cell entries are set as 0 to construct the adjacency matrix to indicate the valve locations. If the control valves are placed at both ends of a single water pipe, 3 (the sum of 1 and 2) is assigned in the matrix.
Adjacency Matrix K
The adjacency matrix is obtained by summing the adjacency matrices and (), and its cell values have the following meanings:
•
0 = two nodes are not connected.
•
1 = two nodes are connected by a pipe, and no valve is placed on the pipe.
•
2 = two nodes are connected by a pipe, and a valve is placed on the pipe connecting the two nodes. The valve is placed away from the start node.
•
3 = two nodes are connected by a pipe, and a valve is placed on the pipe connecting the two nodes. The valve is placed near the start node.
•
4 = two nodes are connected by a pipe, and the valves are placed at both ends of the pipe connecting the two nodes.
Segment Identification
The segment is determined by searching in the order of nodes, pipes, and valves. Fig. 2 shows the detailed process of searching nodes, pipes, and valves, which are the components of a segment.
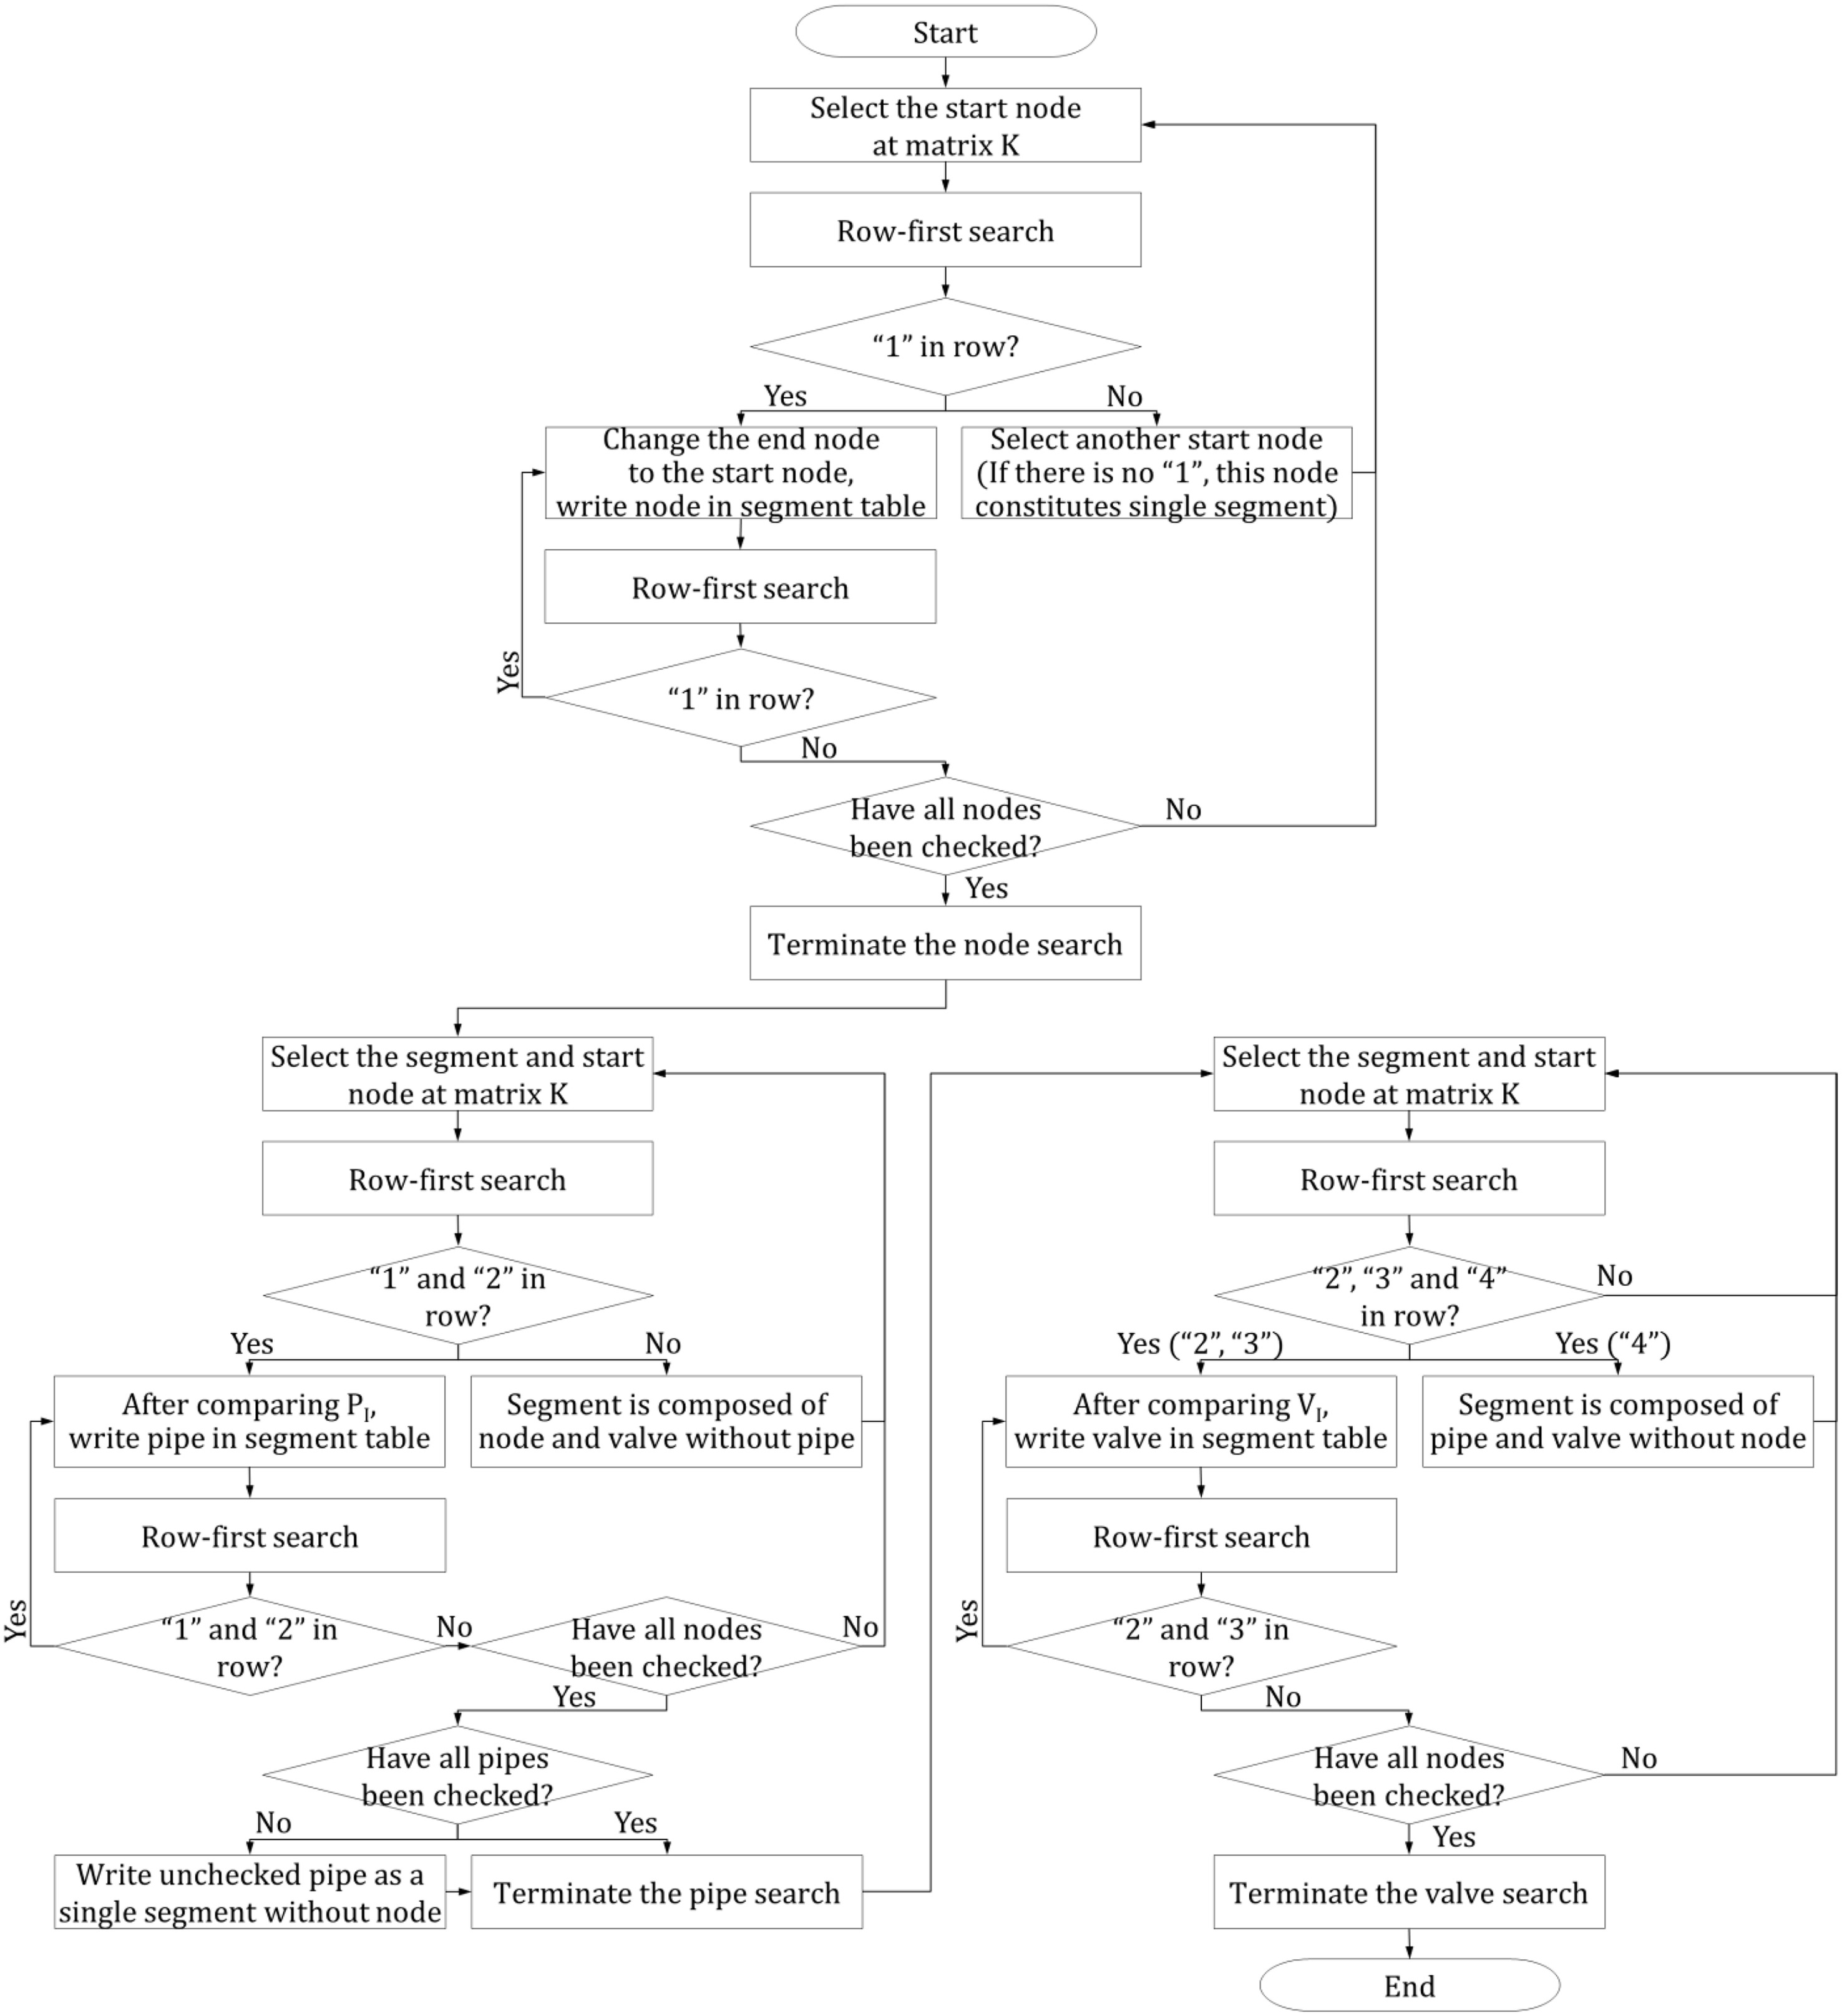
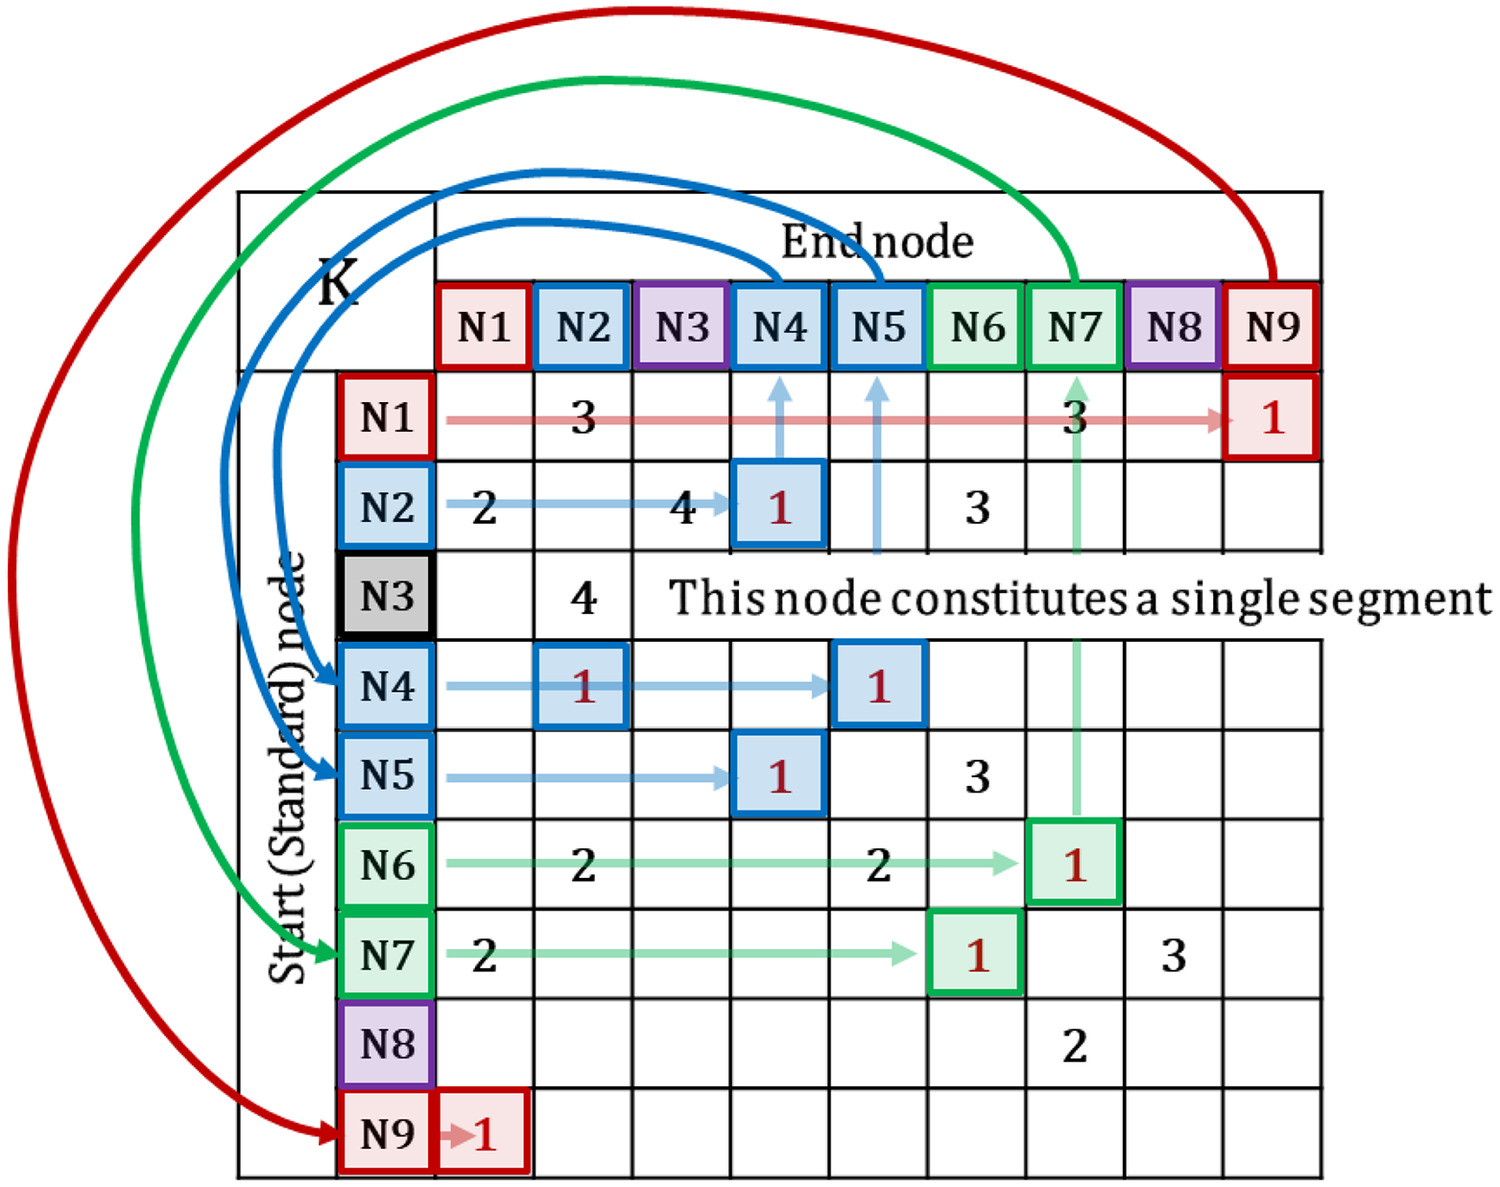
Nodes that are part of a segment are identified as follows. First, start by searching for 1 from the start row of the adjacency matrix . If 1 is identified during this process, make an entry of the start node where 1 is found in the segment table as a node forming a segment. Subsequently, after checking the end node of the column where various 1s have been searched, start searching from the end node that has been checked (here, the end node becomes the start node). If 1 is found, add the corresponding start node to the segment table. Repeat this process and end the search when various 1s are no longer found owing to overlapped nodes. The node found during the search can be regarded as the node forming a segment. Once a single segment is completely constructed, select a new node that has not been searched and repeat the same process to create a segment. If various 1s are not found for a specific node, this node can be considered a segment consisting of only nodes and valves without pipes, similar to Segment 3 in Table 1.
| Segment | Nodes | Pipes | Valves |
|---|---|---|---|
| 1 | {N1, N9} | {P1} | {V1, V6} |
| 2 | {N2, N4, N5} | {P2, P4, P5} | {V1, V2, V4, V5} |
| 3 | {N3} | — | {V3} |
| 4 | — | {P3} | {V2, V3} |
| 5 | {N6, N7} | {P6, P7, P8, P9} | {V4, V5, V6, V7} |
| 6 | {N8} | {P10} | {V7} |
Pipes that form a segment are identified as follows. According to the nodes in a single segment, start searching for 1 and 2 in the row of the adjacent matrix to find the pipe forming a segment. When 1 and 2 are found in the row search based on the nodes within a segment, record the ID of the corresponding pipe in the segment table by comparing the searched cell and the adjacent matrix . As stated previously, if 1 and 2 are not found for a specific node, the node is a segment comprising only nodes and valves without a pipe. After finishing the search for all nodes, compare the information of all pipes forming the network with the pipe data recorded in the segment table. If a pipe forming the network is found but is not recorded in the segment table, the pipe is a segment comprising only pipes and valves without nodes, because valves are placed at the start and endpoints of the pipe.
Valves that form a segment are identified as follows. According to the nodes in a single segment, start searching for 2, 3, and 4 in the row of the adjacent matrix to find the valve forming a segment. When 2, 3, and 4 are found in the row search based on the nodes within a segment, record the ID of the corresponding pipe in the segment table by comparing the searched cell and adjacent matrix . Segment identification of the target pipe network is completed when the search for the valve forming a segment is ended.
Fig. 2 is configured orderly to find the node, pipe, and valve for the convenience of explanation. However, this order need not be followed in the implementation process. For example, the segment table can be constructed immediately according to rules for finding nodes and pipes by searching for 1 in the adjacent matrix and finding pipes and valves by searching for 2.
Unintended Isolation Identification
This study proposes a methodology to identify unintended isolation by searching for a connection with the water source. This is a part of the methodology presented by Jun and Loganathan (2007). The procedure for identifying unintended isolation is illustrated in Fig. 3.
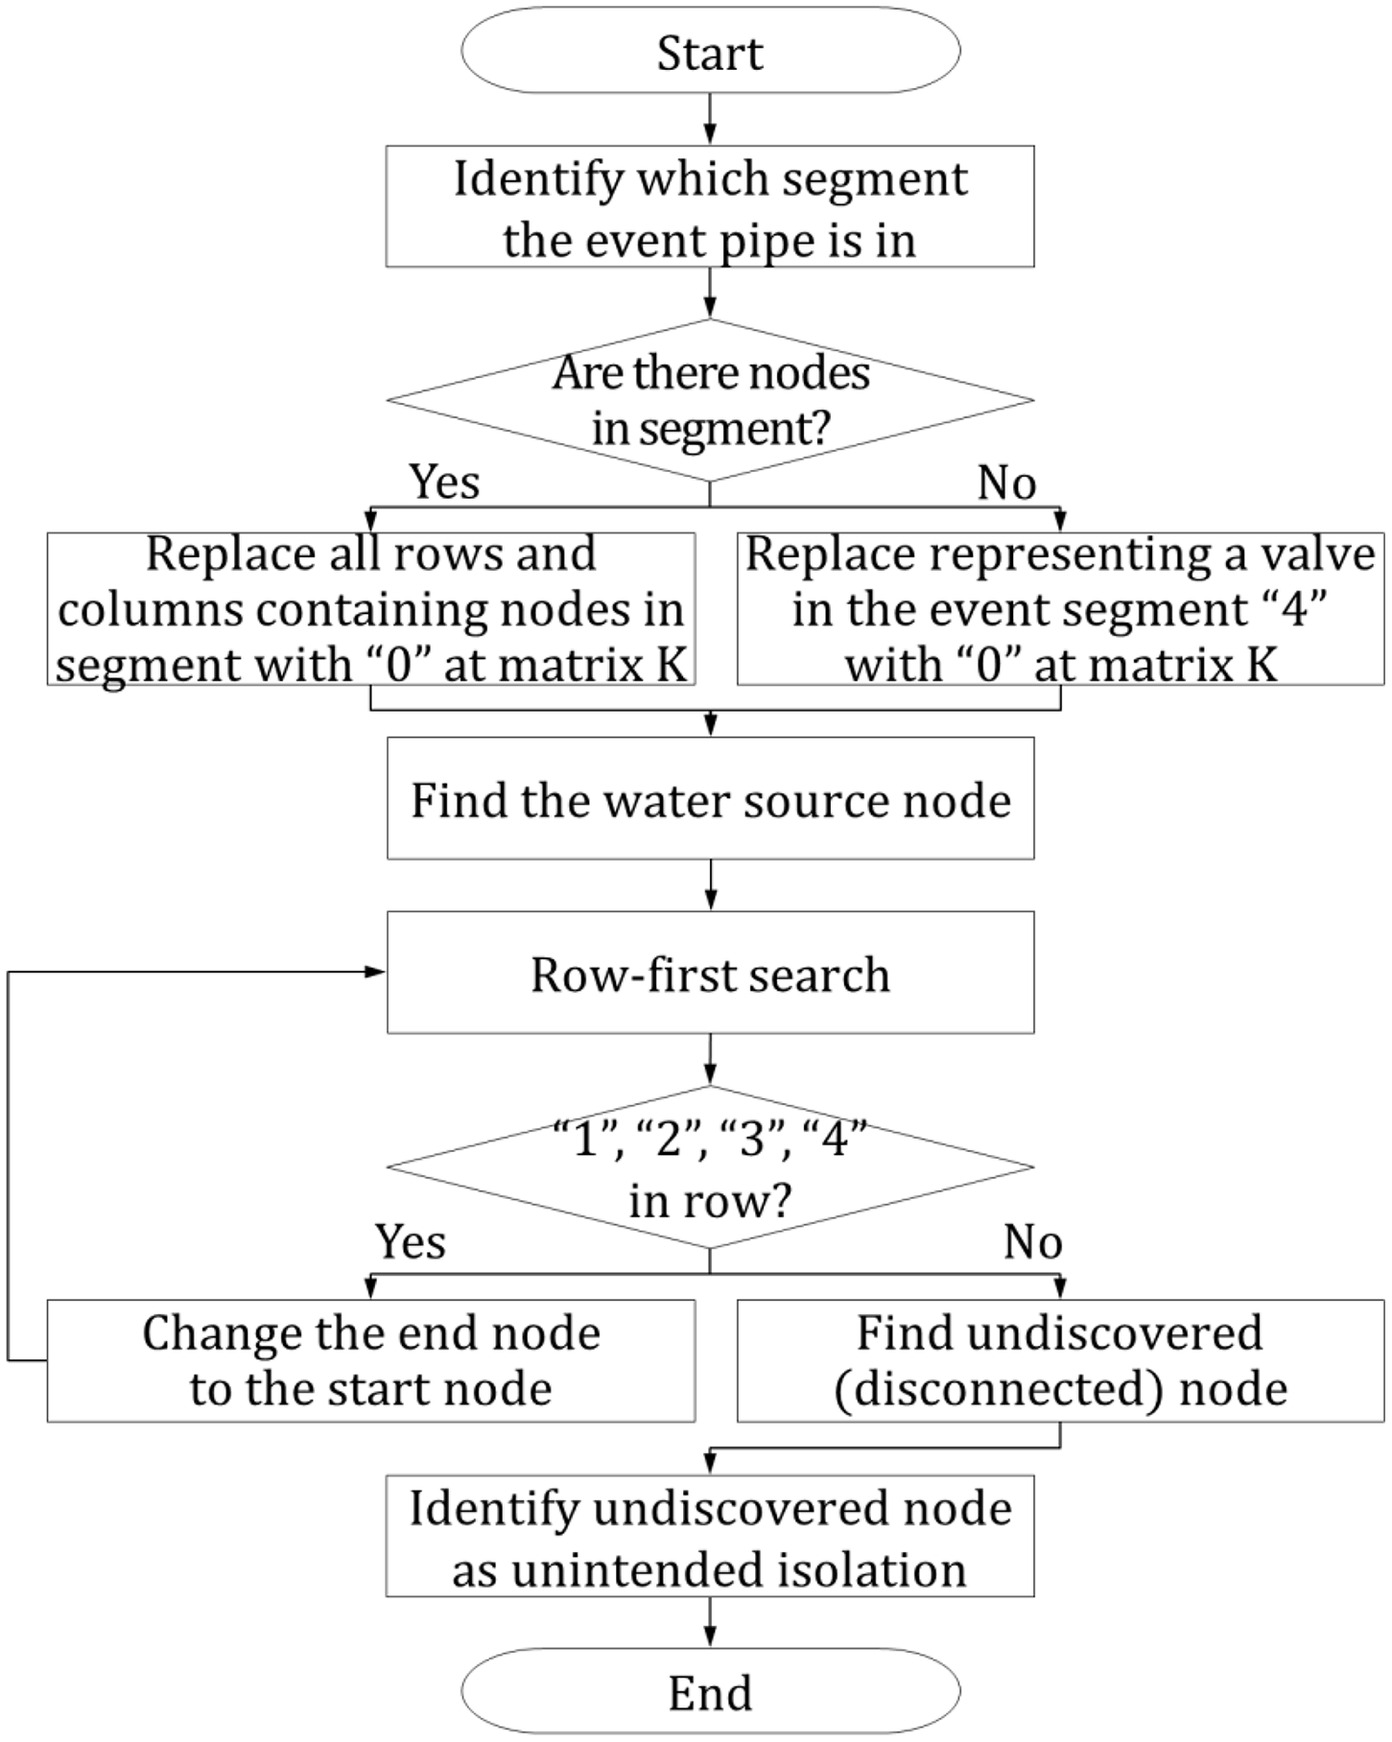
The unintended isolation is determined as follows. First, the segment containing the pipe with failure and breakage is determined. Subsequently, if a node is included in the identified segment, replace the values in all rows and columns of the corresponding node in the adjacent matrix with 0. If the identified segment does not include a node, check the valve (expressed as 4 in the adjacent matrix ) within the segment and replace it with 0.
After the replacement, start a row search for 1, 2, 3, and 4 based on the water source. If any of the four values is found, check the end node of the searched column. Then, start a row search from the end node that has been checked (the end node becomes the start node). Repeat this process until no more searches can be performed. The node not found in the search is the unintended isolation, i.e., an area unintentionally isolated by blocking a segment.
Illustrative Example
Segment Identification
Fig. 4 shows the example WDN used for illustrative purposes. The WDN consists of one water source (N9), eight demand nodes (N1–N8), and 10 pipes (P1–P10). Moreover, it comprises six segments divided by seven valves (V1–V7). In the WDN, some segments consist of a single node or a single pipe, and unintended isolation can be formed by blocking a segment in the event of pipe breakage.

First, the adjacency matrix was constructed to determine a segment, and the adjacency matrices and were constructed as auxiliaries. The adjacency matrices and for this WDN example are shown in Fig. 5, and the adjacency matrices and are shown in Fig. 6. The adjacency matrix was constructed using the two auxiliary matrices, as shown in Fig. 7. For convenience, 0 is omitted in figures.


Once the adjacency matrix was completed, the nodes, pipes, and valves constituting the segment were searched in sequence using the segment identification algorithm. Fig. 8 shows the search process for the nodes constituting the segment, and Figs. 9 and 10 show the corresponding processes for the pipes and valves, respectively. When the search was completed, a complete segment table was obtained, as presented in Table 1. Components corresponding to the same segment are indicated in the figures.

The identified segments for the verification example have the following implications. For instance, in case of breakage at P2, Segment 2 is intentionally blocked by shutting off valves V1, V2, V4, and V5 to restore the breakage and connection. Consequently, water cannot be supplied to the demand nodes N2, N4, and N5 in Segment 2.
Unintended Isolation Identification
For example, if Segment 2 is blocked at P2 or Segment 4 is blocked at P3 due to breakage, an area may be unintentionally isolated. The methodology to identify the unintended isolation is verified through the two examples shown in Fig. 11.

In Case A, the segment containing P2 (Segment 2 in Table 1) was blocked due to the breakage of P2. Fig. 12 shows the search results for connecting with the water sources based on the water sources after replacing the values of the nodes to 0 contained in Segment 2 in the adjacent matrix , i.e., N2, N4, and N5.

In Case B, the segment containing P3 (Segment 4 in Table 1) is blocked due to the breakage of P3. However, for P3, there is no node in Segment 4; hence, the value of the adjacency matrix , 4, is replaced with 0 for V2 and V3, i.e., the valves included in the segment. Fig. 13 shows the search results for connecting with the water sources after the replacement is completed.

In both cases, N3, which was not found in the search (not linked to the water sources), was identified as unintended isolation, as in the results shown in Fig. 11.
Case Studies
To check whether the developed methodology can be applied to actual networks and, at the same time, how much computational cost was required depending on the size of the pipe network, the developed methodology was applied to two actual large-scale WDNs in South Korea. Table 2 describes the characteristics of the WDNs for the two case studies.
| Items | WDN Y | WDN K |
|---|---|---|
| Total length of pipe (km) | 191.15 | 683.32 |
| Number of pipes | 8,727 | 58,452 |
| Number of nodes | 9,202 | 61,055 |
| Number of valves | 460 | 2,454 |
| Number of other facilities | 1 purification plant | 2 purification plants |
| 6 water tanks | 16 water tanks | |
| 7 pump stations | 8 pump stations | |
| Scale of water supply | for 22,000 people (in 2019) | for 240,000 people (in 2020) |
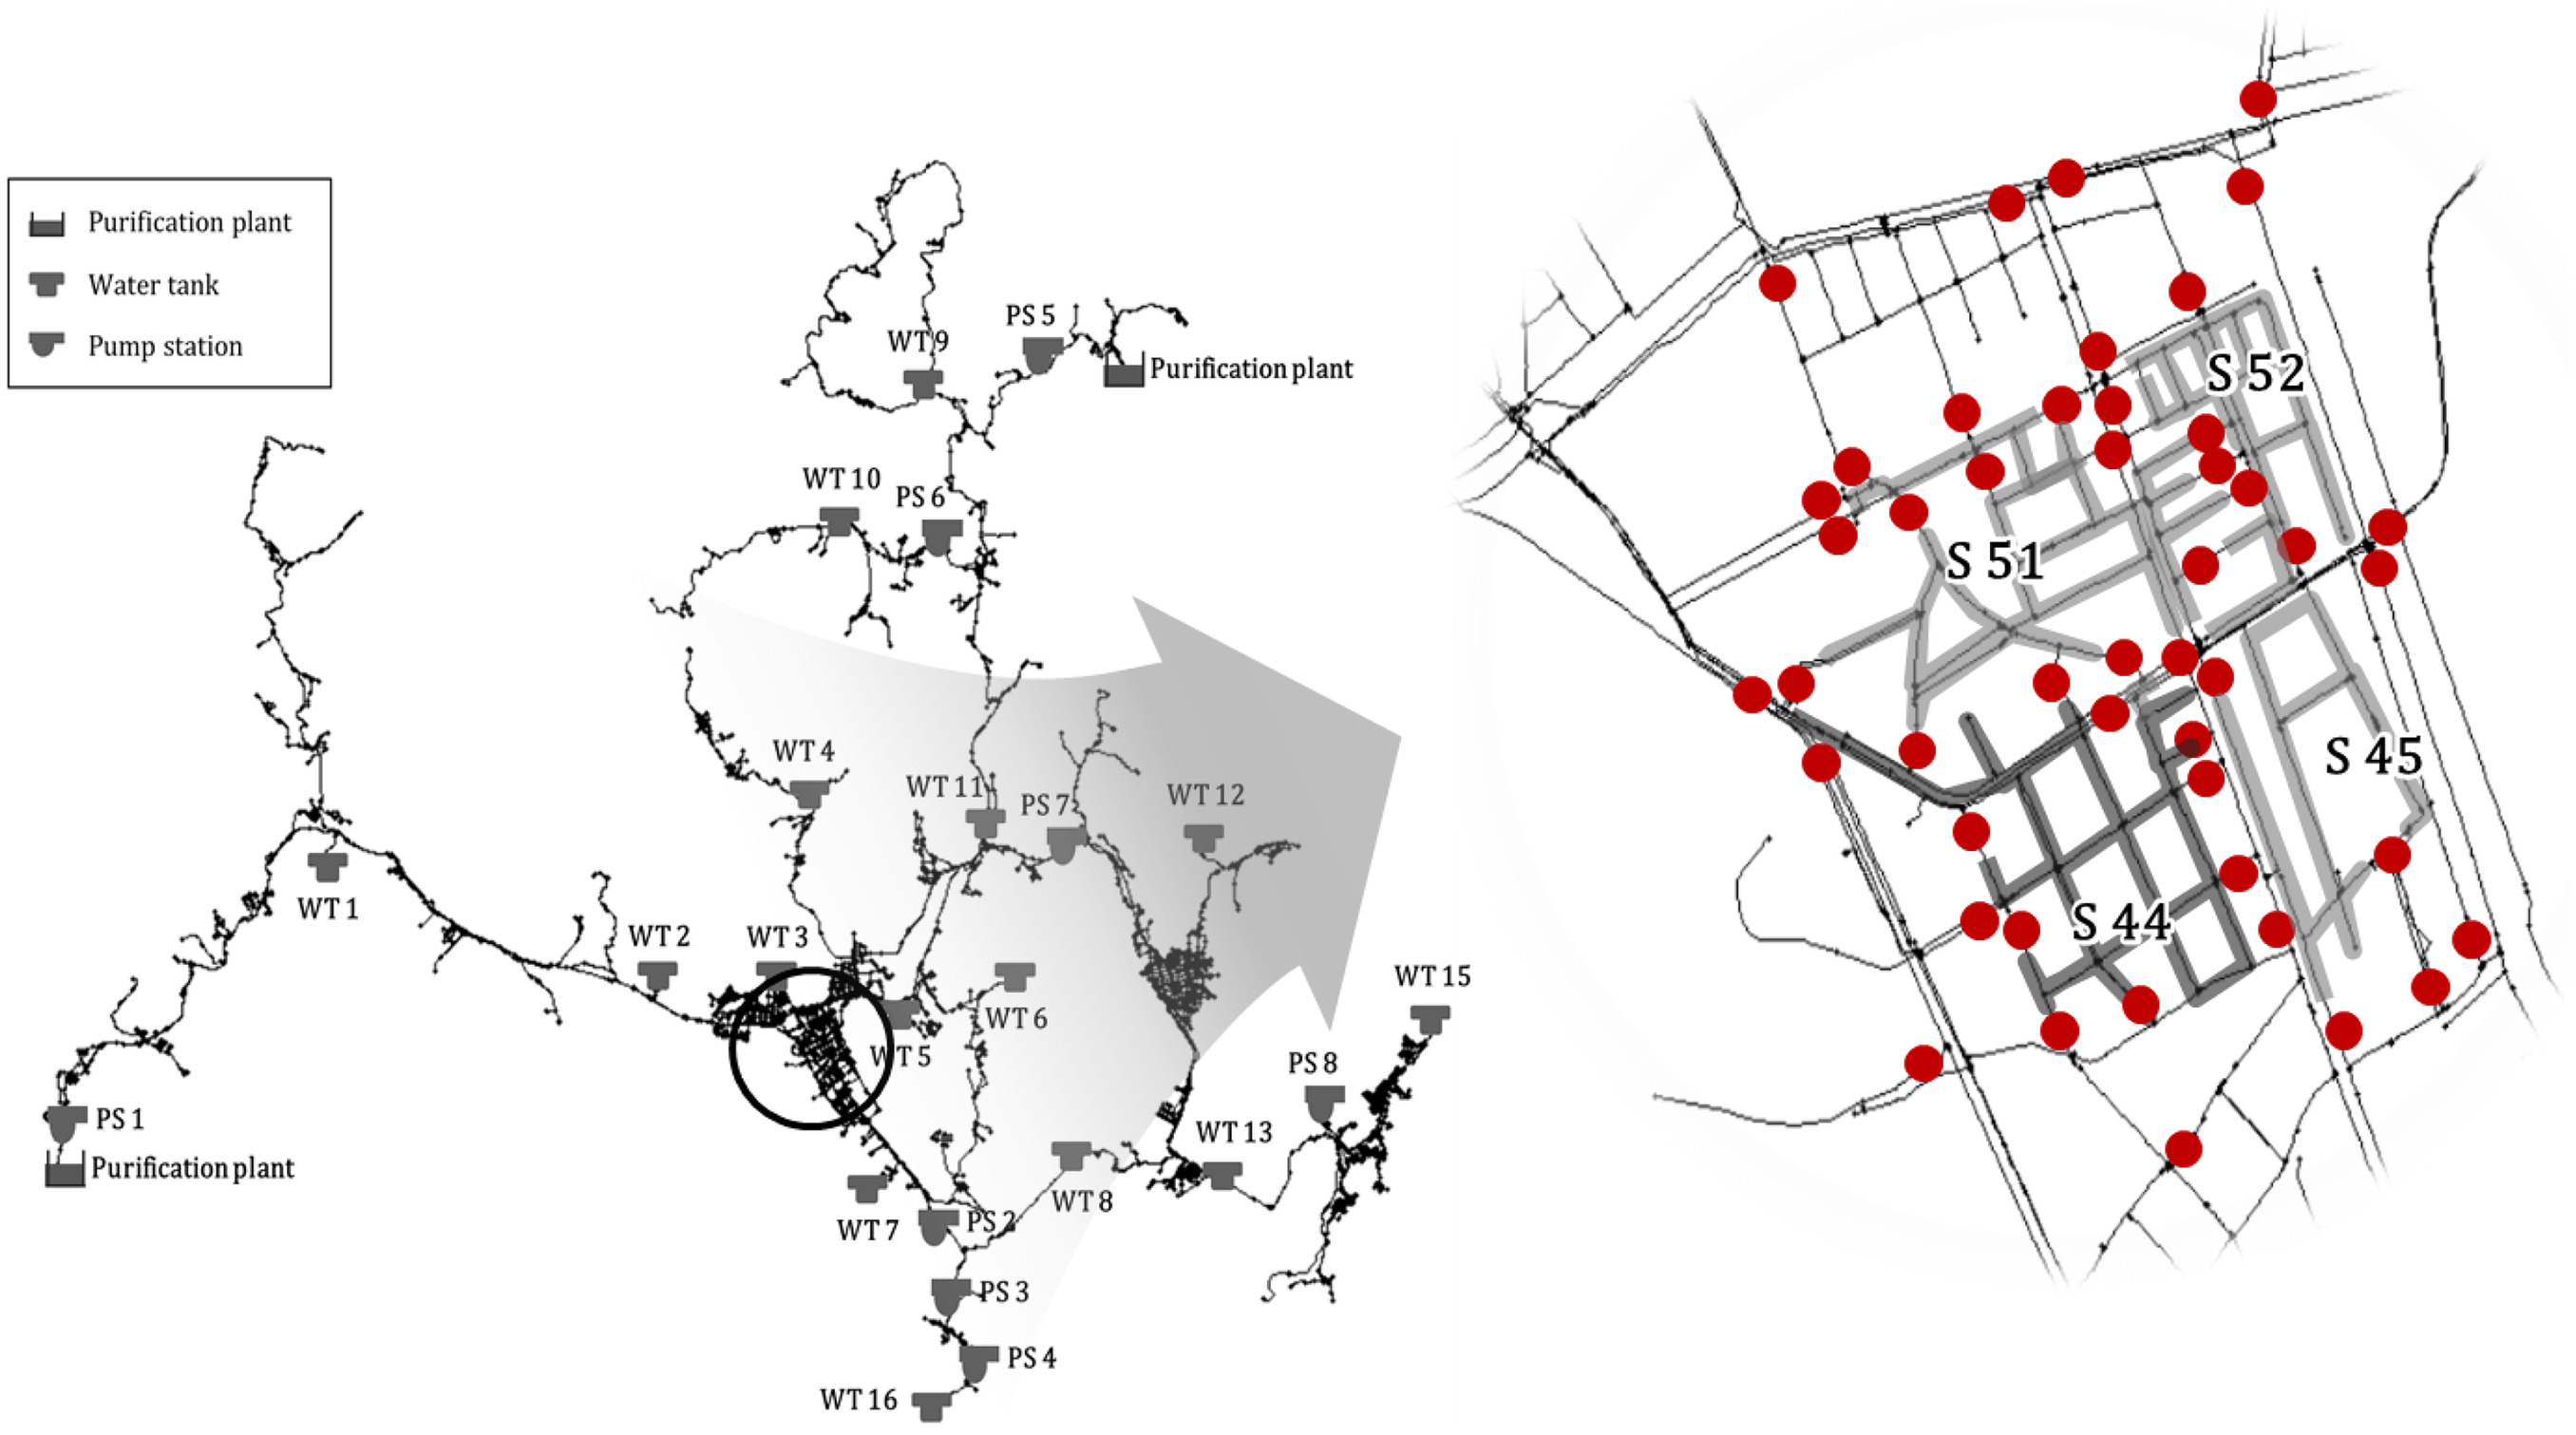
The analyzed WDN Y supplies an average of of tap water per day to approximately 22,000 people. The number of WDN transmission, distribution, and service pipes is 8,727 with 9,202 nodes, including 1 purification plant, 6 water tanks, 7 pump stations, and 460 valves. In addition, WDN K is a system that supplies an average of of tap water per day to approximately 240,000 people. WDN K contains 58,452 pipes and 61,055 nodes, including 2 purification plants, 26 water tanks, 8 pump stations, and 2,454 valves.
The manual identification of segments for large-scale WDNs is inefficient. Therefore, in this study, the proposed methodology was implemented using C++ code supported by Microsoft Visual Studio 2019. The model was developed using the EPANET 2.2 toolkit to link the model with the hydraulic analysis of the WDN in the future. In particular, the EPANET .inp file was used as input data. Moreover, when the position of the valve was expressed on the network diagram, the data could be used automatically. In contrast, when the position of the valve was not expressed in the network diagram, a .csv file containing the start and end nodes could be used separately.
The analysis time includes all processes from inputting the EPANET .inp file to outputting the .csv format output file. On the other hand, the unintentional isolation zone depends on which pipe is disconnected by segments. Therefore, the analysis time was divided into the case of specifying one pipe and the case of performing analysis on all pipes. The creation of unintentional isolation by segment formation causes the shape of the original network to be changed. In this case, it is necessary to check the situation in which the water may not be normally supplied due to the decrease in water pressure. Therefore, after confirming unintentional isolations, pressure driven hydraulic analysis was performed using the pipe network diagram with the amount of water demand entered, and the analysis time included the process of confirming areas where the water supply was impossible.
Table 3 presents the results of segment identification for the two case studies. The code was executed in an AMD Ryzen 7 CPU with 3.20 GHz and 32 GB RAM running in Windows. This study analyzed the same WDNs for comparison using the methodology proposed by Jun and Loganathan (2007), which was developed first among automated algorithms to identify segments and was used in various studies. The results of identifying the segments using the model developed in this study were the same as that of the model proposed by Jun and Loganathan (2007).
| Results | WDN Y | WDN K |
|---|---|---|
| Number of segments | 304 | 1,278 |
| Developed model | ||
| Total analysis time (s) | 13,497 | 40,585 |
| Segments identification (s) | 452 | 605 |
| Specified unintended isolation identification (average) (s) | 49 | 41 |
| All unintended isolation identification (s) | 13,045 | 39,980 |
| Method proposed by Jun and Loganathan (2007) | ||
| Total analysis time (s) | 15,959 | 42,992 |
| Segments identification (s) | 735 | 1,986 |
| Specified unintended isolation identification (average) (s) | 56 | 43 |
| All unintended isolation identification (s) | 15,224 | 41,006 |
Through these results, it was confirmed that the newly developed model worked well in the actual WDN. The total time spent for segment identification of WDN Y was 13,497 s. In more detail, 304 segment identification required 452 s, and unintended isolation identification required 13,045 s. For the WDN K case, 1,278 segment identification required 605 s, and unintended isolation identification required 39,980 s. In all processes, it was found that the analysis time was shorter than when using the Jun and Loganathan (2007) methodology. Figs. 14 and 15 show the studied WDN Y and WDN K diagram and the identified segment of the downtown area, respectively.

This result shows that it is possible to identify segments in a short time, even in a WDN with more than 50,000 nodes and pipes. The following discussions are based on a WDN with over 50,000 nodes and pipes. Consider the case in which segments of the target area are not identified in advance and are required to identify. When a leak, breakage, or water quality problem suddenly occurs, and the valve in WDN must be closed, the segments can be checked within 10 min using the developed model. Furthermore, in case of all segments have been identified in advance, the WDN manager can immediately know which valves should be closed when an event occurs. However, it is also necessary to identify the unintentionally isolated area caused by closing the valves. Using the developed model, unintended isolation can be identified within 1 min. Being able to see segments and unintended isolation within 10 and 1 min implies that a WDN manager can immediately plan an emergency response. There is sufficient time to respond at this speed for one particular WDN, even if the water supply system is operated in near-real-time using sensor data in units of 1 min.
On the other hand, identifying segments can also be used to reduce the range at which water cannot be supplied when an accident and restore process occurs. In the case of WDN Y, the size of one segment is relatively small. However, in the case of WDN K, the size of one segment is relatively large even though a much larger number of valves are used. In other words, it can be determined that the area where there is a high probability not to be supplied water is WDN K. In such cases, it is necessary to determine where to place the valves to reduce the size of segment. At this time, the segment identification methodology proposed in this study can be used to determine what is the best alternative.
Table 4 presents the results of comparing the advantages and disadvantages of the methodology developed in this study with the previously proposed methods. The results of applying the developed methodology to actual WDNs confirm that the methodology operates at relatively higher speed than previously proposed method; thus, it is practical for actual field implementation.
| Method | Advantages | Disadvantages |
|---|---|---|
| Previously proposed method by Jun and Loganathan (2007) | • Easy to construct the matrix due to only using 0 and 1. | • To identify the configuration of WDN, two or more matrices must be constructed. |
| • The analysis speed is relatively slow in a large-scale WDN. | ||
| Newly developed method in this study | • All analyses are possible with only one node–node adjacency matrix. | • Because use of multiple numbers, construction of the matrix is relatively hard. |
| • The analysis speed is relatively fast in a large-scale WDN. | • Attention should be paid to the feedback process in the rules. |
In addition, previous methodologies required repeated comparisons of several matrices to determine whether or not segments were formed. However, the method proposed in this study can be said to be more efficient by using only one matrix. Compared with the previous methods expressed using only 0 or 1 in the matrices, the rules of the method proposed in this study may feel somewhat complicated. In particular, in the procedure diagram of Fig. 2, it is necessary to pay special attention to the feedback process in the upper stage after the procedure is terminated in the middle. However, if the rules are applied accurately, the methodology developed in this study, which has advantages in terms of convenience as well as reduction of analysis time, can be used.
Conclusion
As water pipes deteriorate incrementally, the frequency of leaks, breakages, or water quality problems in the WDN increases. Considering the deterioration growing trend, the frequency of checking segments and unintended isolation is expected to increase. In this study, a methodology for identifying segments and unintended isolation was developed and illustrated through an example. The approach was applied to two actual WDNs and was compared with the method proposed by Jun and Loganathan (2007). The identification time of the methodology executed in C++ exhibited a level capable of responding in near-real-time. In the proposed methodology, the adjacency matrix , in which the connectivity of the current WDN could be easy to understand, was used for segment identification. This methodology is convenient because a single row-first search method is used and is compatible with the data storage format of hydraulic analysis software.
Recently, the concepts of segments and unintended isolation have been used in various studies for examining the risk, resilience, robustness, vulnerability, and reliability of WDNs. Even the field of partitioning the WDN to form new district metered areas uses the concept of segments. The proposed segment and unintended isolation identification methodology can be used in numerous ways to configure and analyze WDNs.
Data Availability Statement
Some or all data, models, or code that support the findings of this study are available from the corresponding author upon reasonable request.
Acknowledgments
The Korea Ministry of Environment supported this work titled as “Project for Developing Innovative Drinking Water and Wastewater Technologies” (2020002700016).
References
Abdel-Mottaleb, N., and T. Walski. 2021. “Evaluating segment and valve importance and vulnerability.” J. Water Resour. Plann. Manage. 147 (5): 04021020. https://doi.org/10.1061/(ASCE)WR.1943-5452.0001366.
Alvisi, S., E. Creaco, and M. Franchini. 2011. “Segment identification in water distribution systems.” Urban Water J. 8 (4): 203–217. https://doi.org/10.1080/1573062X.2011.595803.
AWWA (American Water Works Association). 1986. Introduction to water distribution principles and practices of water supply operation. Denver: AWWA.
Choi, T., and J. Koo. 2015. “A water supply risk assessment model for water distribution network.” Desalin. Water Treat. 54 (4–5): 1410–1420. https://doi.org/10.1080/19443994.2014.892440.
Creaco, E., M. Franchini, and S. Alvisi. 2010. “Optimal placement of isolation valves in water distribution systems based on valve cost and weighted average demand shortfall.” Water Resour. Manage. 24 (15): 4317–4338. https://doi.org/10.1007/s11269-010-9661-5.
Diao, K., C. Sweetapple, R. Farmani, G. Fu, S. Ward, and D. Butler. 2016. “Global resilience analysis of water distribution systems.” Water Res. 106 (Dec): 383–393. https://doi.org/10.1016/j.watres.2016.10.011.
Gao, T. 2014. “Efficient identification of segments in water distribution networks.” J. Water Resour. Plann. Manage. 140 (6): 04014003. https://doi.org/10.1061/(ASCE)WR.1943-5452.0000395.
Giustolisi, O., and D. Savic. 2010. “Identification of segments and optimal isolation valve system design in water distribution networks.” Urban Water J. 7 (1): 1–15. https://doi.org/10.1080/15730620903287530.
Hernandez, E., and L. Ormsbee. 2021. “Segment identification procedure for water distribution systems.” J. Water Resour. Plann. Manage. 147 (5): 04021013. https://doi.org/10.1061/(ASCE)WR.1943-5452.0001363.
Huang, Y., F. Zheng, Z. Kapelan, D. Savic, H. Duan, and Q. Zhang. 2020. “Efficient leak localization in water distribution systems using multi-stage optimal valve operations and smart demand metering.” Water Resour. Res. 56 (10): e2020WR028285. https://doi.org/10.1029/2020WR028285.
Jeong, G., G. Lim, and D. Kang. 2021. “Identification of unintended isolation segments in water distribution networks using a link-by-link adjacency matrix.” J. Water Resour. Plann. Manage. 147 (2): 06020013. https://doi.org/10.1061/(ASCE)WR.1943-5452.0001323.
Jun, H., and G. Loganathan. 2007. “Valve-controlled segments in water distribution systems.” J. Water Resour. Plann. Manage. 133 (2): 145–155. https://doi.org/10.1061/(ASCE)0733-9496(2007)133:2(145).
Liu, J., and Y. Kang. 2021. “Segment-based resilience response and intervention evaluation of water distribution systems.” J. Water Supply: Res. Technol. AQUA 71 (1): 100–119. https://doi.org/10.2166/aqua.2021.133.
Mahmoud, H., Z. Kapelan, and D. Savic. 2017. “Segment identification in water distribution systems by using network topological matrices.” In Vol. 15 of Proc., 5th Int. Conf. on Computing and Control for the Water Industry (CCWI), 5–7. Sheffield, UK: Univ. of Sheffield.
MOE (Korean Ministry of Environment). 2021. Korean design standard for water supply system. Sejong, Republic of Korea: MOE.
Walski, T. 1993. “Water distribution valve topology for reliability analysis.” Reliab. Eng. Syst. Saf. 42 (1): 21–27. https://doi.org/10.1016/0951-8320(93)90051-Y.
Walski, T. 2020. “Discussion of ‘Graph-theoretic surrogate measure to analyze reliability of water distribution system using Bayesian belief network-based data fusion technique’ by Ngandu Balekelayi and Solomon Tesfamariam.” J. Water Resour. Plann. Manage. 146 (8): 07020001. https://doi.org/10.1061/(ASCE)WR.1943-5452.0001270.
Information & Authors
Information
Published In

Journal of Pipeline Systems Engineering and Practice
Volume 14 • Issue 4 • November 2023
Copyright
This work is made available under the terms of the Creative Commons Attribution 4.0 International license, https://creativecommons.org/licenses/by/4.0/.
History
Received: Jun 1, 2022
Accepted: Mar 27, 2023
Published online: Jul 7, 2023
Published in print: Nov 1, 2023
Discussion open until: Dec 7, 2023
Authors
Metrics & Citations
Metrics
Citations
Download citation
If you have the appropriate software installed, you can download article citation data to the citation manager of your choice. Simply select your manager software from the list below and click Download.