Phase Field Modeling at Mesoscale of Recycled Aggregate Concrete
Publication: Journal of Materials in Civil Engineering
Volume 36, Issue 6
Abstract
We devised a mesoscopic model for recycled aggregates, enabling the deduction of mechanical behavior of finite element representative volume element (RVE) size from constituent properties like aggregate and mortar. This model can be integrated into a finite element solver as the material law, computing macroscopic properties based on individual constituents. It interprets material response under stress and strain by differentiating it into elastic and viscoplastic components. The elastic response uses a compressible neo-Hookean material model, while the viscoplastic response employs a nonassociated Perzyna-type model, accounting for rate-dependent deformation. We modified the Drucker–Prager yield function to predict fracture, and phase field equations describe fracture initiation and propagation. The model was applied to study fracture propagation in recycled aggregate concrete at a mesoscopic level, illustrating how fracture originates and spreads. After model calibration and validation, a parametric study examined the impact of residual mortar on an aggregate and new mortar matrix in the stress-strain relationship. Our investigation identified the significance of mechanical properties in the overall stress-strain relationship and failure patterns of recycled aggregate concrete (RAC), notably the new mortar matrix and old mortar adhesions. The model enables the prediction of fracture behavior in RAC with complex structural heterogeneity caused by recycled aggregates.
Introduction
Aggregate demand continues to increase drastically due to globally expanding construction markets. As a result, construction industry actors have sought more sustainable and clean resources amid environmental concerns and the rapid depletion of natural resources. Further, there is an increase in material waste from demolition, driven by urbanization, disasters, and renewal to meet new energy efficiency and safety standards, which has opened the opportunity for a large stock of readily available material to be used as a constituent of new concrete mixtures. Thus, concrete waste can be crushed and processed to extract coarse aggregates that partially replace natural aggregates (Deng et al. 2016).
Moreover, structural materials must meet standards and building code requirements for mixed composition and mechanical properties for safety and sustainability issues. However, concrete produced with recycled aggregates exhibits different behavior than concrete produced with normal aggregates. According to published research, replacing natural aggregates with recycled aggregates reduces mechanical performance (Paine and Dhir 2010) and resistance to freezing and thawing (Zaharieva et al. 2004) while increasing drying shrinkage (Medjigbodo et al. 2018). Therefore, recycled aggregate concrete (RAC) has attracted growing interest in the construction industry and among researchers seeking to improve its performance, mainly the load-bearing capacity, durability for the hardened concrete, and workability of fresh concrete. However, two main facts, namely, the strength reduction and increase in drying shrinkage, constitute significant barriers to the massive use of recycled construction materials. Recycled aggregates differ from natural aggregates in that they are fundamentally heterogeneous, depending on the origin of waste and the type of deconstruction. As recycled aggregates result from crushing, microcracks and microfaults are observed in their matrix, thus increasing porosity and reducing density. Compared with natural aggregates, recycled aggregates have a bulk from 3.8% to 18.6% and increased water absorption from 538.7% to 1,797%.
Numerous experimental studies have revealed that, in general, strength reduces when natural aggregates are replaced with recycled aggregates (Bogas et al. 2016). This has been attributed to different factors such as the crushing process (Duan and Poon 2014), the geometry of the recycled aggregate (RA) (Hansen and Narud 1983), the strength of the concrete where the recycled aggregate originates from, and the amount of residual adhered cement mortar at the aggregates’ surface (Duan and Poon 2014). Research has shown that recovered cement mortar has a massive influence on the performance of RAC (Tabsh and Abdelfatah 2009; Topçu 1997). Since various factors likely impact mechanical behavior, experimental studies sometimes yield different conclusions. According to Poon et al. (2004), Wardeh et al. (2015), and Xiao et al. (2012), the quality of recycled aggregates influences the mechanical properties of RAC, whereas studies by Xiao et al. (2012) and Casuccio et al. (2008) revealed that the global failure behavior of RAC specimens under compression, tension, or flexion is similar to that of conventional concrete specimens. Besides the global mechanical performance, the fracture process at the microscopic level plays a key role.
Although many studies have been performed to better understand the behavior of the RAC at the macroscopic level, the fracture behavior still needs to be better understood at the mesoscopic level. The initiation and propagation of microcracks are different between RAC and standard concrete (Guo et al. 2017; Li et al. 2012). Regarding recycled aggregates, the adhered mortar paste, which is old mortar bound to each aggregate, is either fully or partially encasing the particle. This paste has a higher porosity than the aggregate itself and influences most of the mechanical properties of recycled concrete. Consequently, the cracking behavior is more complex than conventional concrete due to the presence of the old mortar, which creates an additional weaker interfacial transition zone (ITZ) (Guo et al. 2017; Xiao et al. 2012). A quantitative analysis of the fracture process of RAC and a deep understanding of its impact on the load-bearing capacity are highly needed. It is also widely accepted that the local mechanism at the microscale (crack initiation and propagation) governs the macroscopic behavior of concrete (Tsitova 2022; Tsitova et al. 2022; Yip and Short 2013). The modeling of the fracture process of recycled concrete aggregates at the mesoscopic level by considering the effective properties of the old attached mortar is a promising way to close this gap.
Phase-field modeling has been widely used in recent years to study the fracture behavior of concrete materials (Li and Xu 2022; Nguyen et al. 2019; Wang et al. 2021). This type of modeling is beneficial for investigating the microstructural behavior of materials, including the formation and propagation of cracks. Studies have shown that phase-field modeling can provide valuable insights into the fracture behavior of concrete materials and can be used to develop more accurate predictive models for concrete fracture.
These models have been applied to various concrete materials, including normal-strength concrete (Li and Xu 2022), high-strength concrete (Schröder et al. 2022), and reinforced concrete (Hu et al. 2022). By providing a detailed and realistic representation of the fracture behavior of concrete materials, phase-field modeling can significantly enhance our understanding of the behavior of concrete materials and help improve the design and performance of concrete structures.
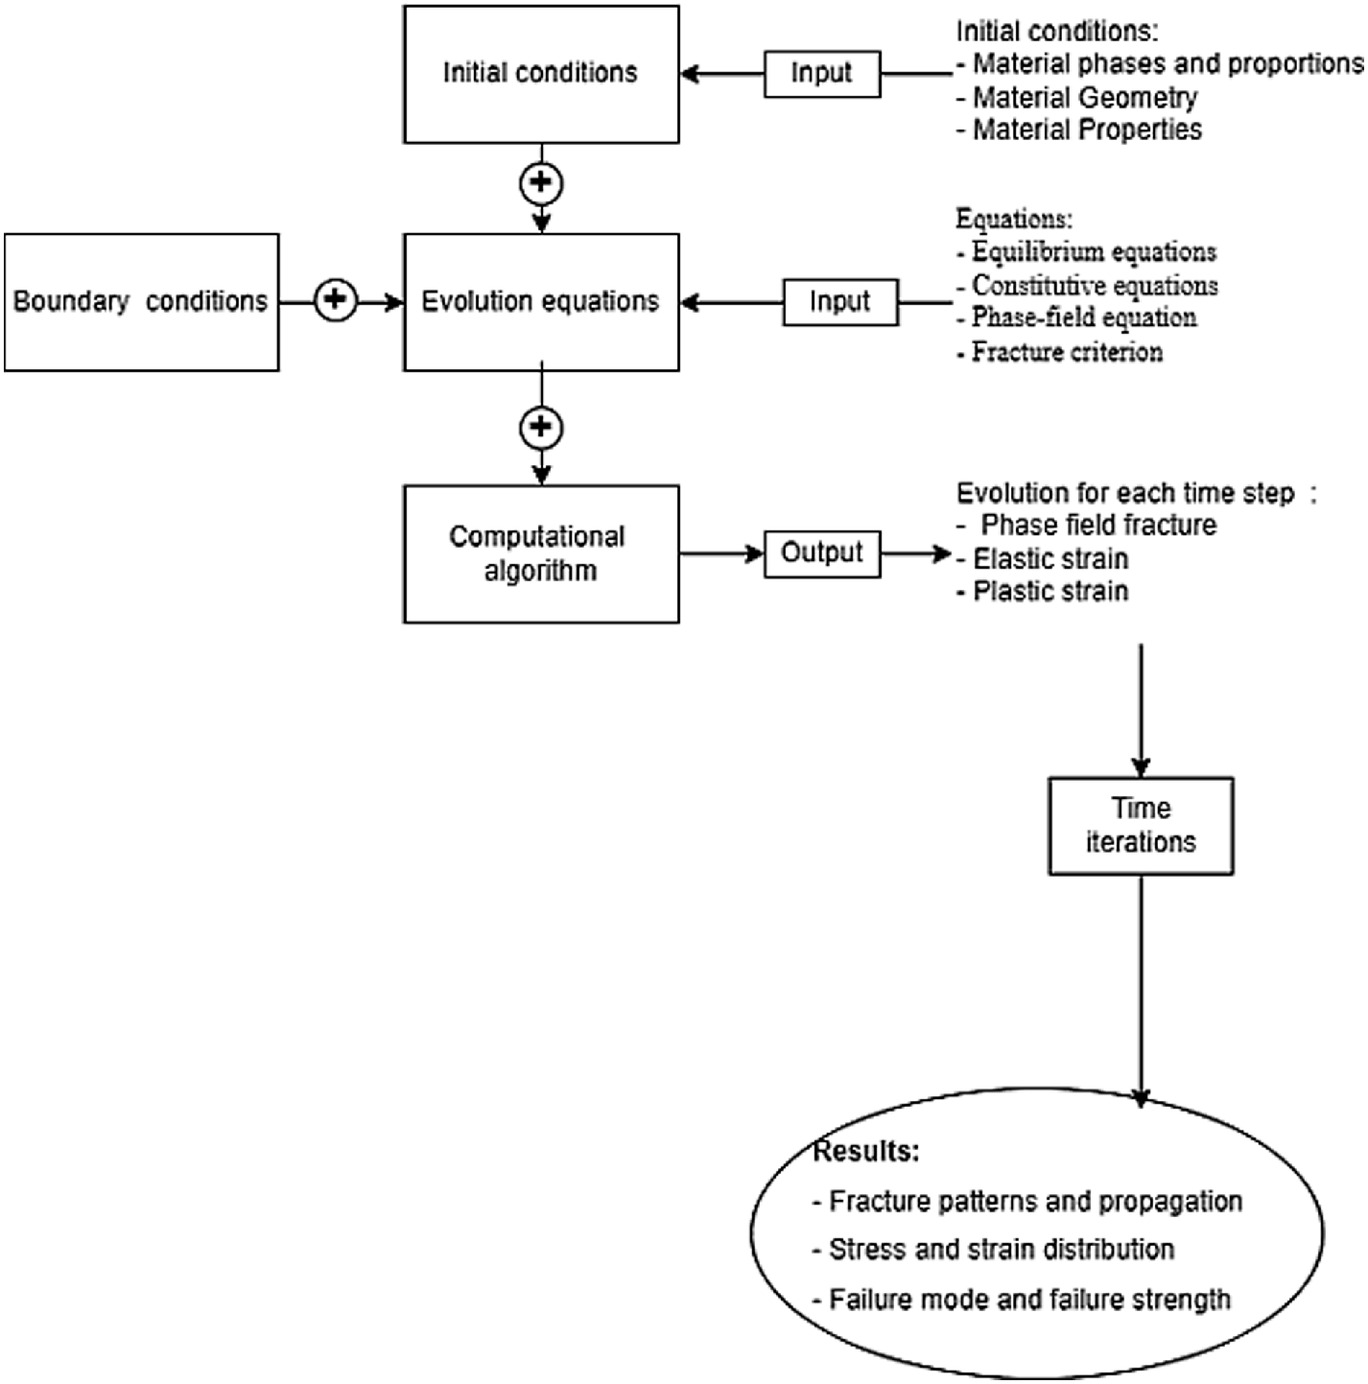
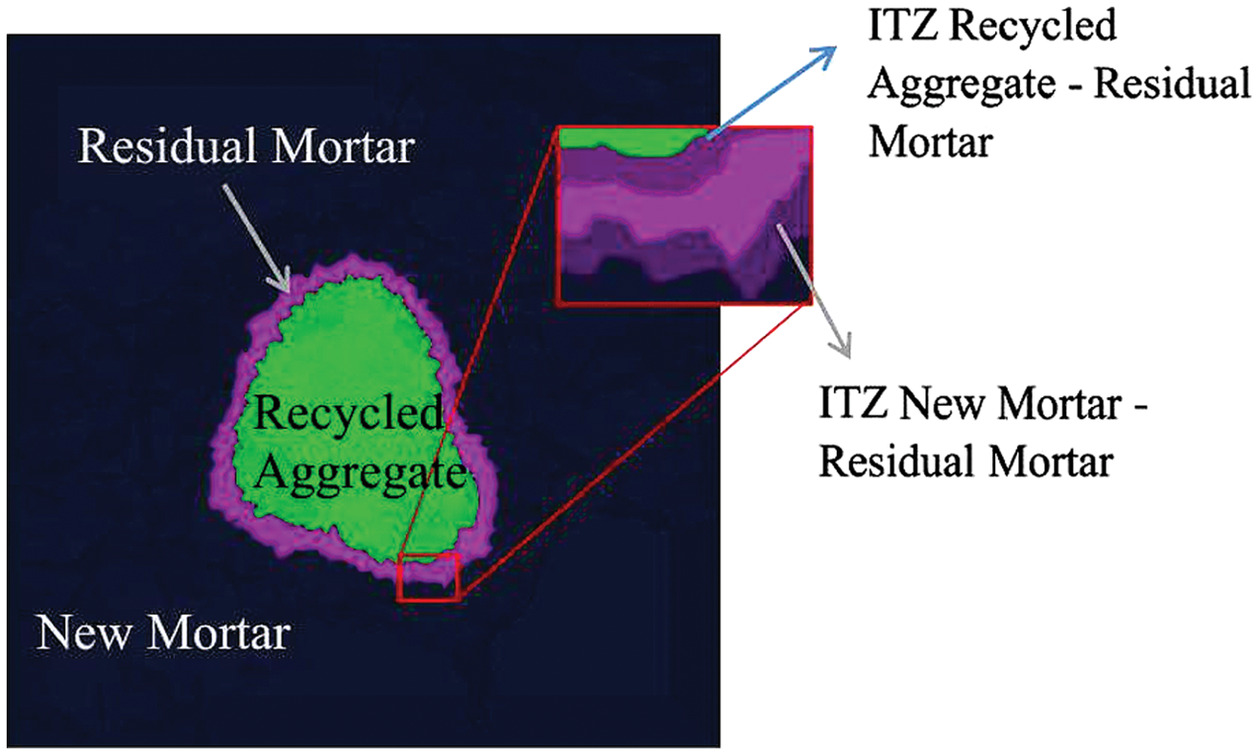
However, phase field modeling has yet to be applied to model the fracture of recycled aggregate. We propose a phase field model for the fracture of recycled concrete at the mesoscopic scale. The modeling aims to understand how the inclusion of recycled aggregate affects the material’s mechanical properties and to identify the mechanisms that govern the formation and propagation of cracks in the material. The flowchart of the model is presented in Fig. 1. We model RAC as a three-phase composite material, Fig. 2. In the modeling part presents the thermodynamic formalism and a detailed description of the developed constitutive model. The section “Experimental Investigations” presents the experiment’s results and the model’s parameters identification. The section “Parametric Study” focuses on the developed model’s sensitivity analysis.
Modeling
We consider a rigid body with a mass density , bounded by the surface and a surface traction over . The reference configuration is denoted . The balance between internal and external work readswhere = the rate of change of the Helmholtz free energy ; and = a body force.
(1)
We assume that the body forms a decoupled system that allows additive decomposition of the free energy density function into elastic, viscoelastic partswhere = the elastic free energy; and = the stored viscoplastic free energy describing the rate-dependent hardening of the material.
(2)
Following the first law of thermodynamics, the rate of work per unit volume is the sum of the Helmholtz free energy density and the rate of dissipation where = the stress power per unit volume in the material configuration. The rate of work is decomposed into elastic and viscoplastic parts as follows:
(3)
(4)
The elastic work is the sum of the elastic free energy and the energy used for creating new surfaces through the crack
(5)
Likewise, the viscoplastic work is the sum of the viscoplastic free energy, and the viscoplastic energy dissipated through heat
(6)
As the second law of thermodynamics requires, the entropy production rates are nonnegative. For an isothermal process, the Clausius–Duhem inequality is reduced to the Clausius–Planck relation
(7)
According to thermodynamics, the state of a material undergoing any process at any given time can be described by a set of observable and internal state variables. Therefore, the following internal variables are introduced to describe the viscoplastic behavior:where = the hardening stress associated with isotropic hardening and is conjugated to , which is the back stress associated with kinematic hardening and is conjugate to internal variable .
(8)
Elastic Constitutive Model
We employ the compressible neo-Hookean material model for the elastic behavior. For an undamaged material, the strain energy density function is defined as the addition of the dilatational and distortional terms as follows:where = the shear modulus; and = the bulk modulus. The strain energy can be conveniently written in terms of principal stretches
(9)
(10)
The Kirchhoff stress tensor can be derived from Eq. (9) as follows:
(11)
Viscoplastic Constitutive Model
For materials presenting discontinuities, the plastic-free energy can be regarded as the energy expended for particle rearrangement, while the plastic dissipation energy is related to energy lost through frictional sliding and heat (Yang and Dong 2020). The origin of plastic-free energy is specific to the type of material. For example, granular materials are attributed to the irreversible rearrangement of the granules rather than their permanent deformation (Yang et al. 2018). Consequently, the plastic flow is particularly complex and is influenced by the hydrostatic pressure, unlike in metals. We consider a nonassociated Perzyna-type viscoplastic flow model to describe the rate-dependent irrecoverablewhere = the viscoplastic multiplier; and = the viscoplastic dissipation potential. We adopt the following viscoplastic dissipation function potential based on the nonassociated Prager modelwhere = the relative stress; and = the dilation angle, which is linked to the angle of internal friction. The viscoplastic multiplier, also known as the consistency parameter, is expressed as follows:where = the viscosity parameter; the term = an overstress function; = a parameter determining the rate sensitivity of the viscoplastic flow; and = the initial yield stress.
(12)
(13)
(14)
We assume that the viscoplastic flow occurs after the material has reached a yielding point. The existence of a yield surface for viscoplastic heterogeneous materials is a debated topic because many geomaterials exhibit irreversible flow early during loading. Several yield criteria have been developed to address material cohesion, friction, and pressure dependency. It includes the well-known Mohr–Coulomb (M-C) and Drucker–Prager (D-P) yield functions. However, the M-C model does not account for the difference between tension and compression, and the yield surface does not meet the smoothness requirement. The D-P criterion, a circle on the octahedral plane, satisfies the smoothness requirement but does not include tension-compression asymmetry.
Therefore, we employed a modified version of the D-P yield function presented as follows:where = the first invariant of Kirchhoff stress; = the second invariant of the deviatoric part of the Kirchhoff stress tensor; and and = the material parameters related to the cohesion and angle of internal friction. They are usually determined by making the D-P yield surface coincide with the M-C edges.
(15)
When matched with the internal edges of the M-C surface, the D-P corresponds to M-C in uniaxial tension and biaxial compression:
(16)
For the external edges, the D-P corresponds to M-C in uniaxial compression and biaxial tension
(17)
Alternatively, can be defined as a function of the plastic strain hardening function. The function was introduced to modify the shape of the yield surface according to the loading type, creating a distinction between tension and compression. The parameters are the ratio between the yield strength in tension and compression and the load angle . We use the function defined by Zhang et al. (2015), which ensures the convexity of the yield functionwhere and .
(18)
The D-P yield function in Eq. (15) can be formulated to consider the kinematic and isotropic hardeningwhere = a stress-like internal variable for kinematic hardening; = a scalar stress-like internal variable for isotropic hardening; = a scalar internal variable; and = the yield stress.
(19)
The evolution of the back stress is given by the Prager’s linear kinematic hardeningwhere = the kinematic hardening modulus. From the thermodynamic perspective, and are derived from the following viscoplastic free energy:
(20)
(21)
(22)
Phase-Field Description of Fracture
The phase-field model is a powerful tool for describing a fracture and is therefore employed in this study. The concept is to describe the crack discontinuity by a damage phase represented by a scalar field . The sharp crack surface is regularized into a smeared topology, easing the strong discontinuity of the displacement field around the crack, thus allowing efficient numerical implementation. Griffith’s representation of fracture energy is therefore regularized as follows (Miehe et al. 2010):where = the critical fracture energy; = the sharp crack surface; the term = the crack surface density; and = a length scale parameter.
(23)
The introduction of damage alters the free energy of the system and modifies the total energy balance in Eq. (1) as follows (Miehe et al. 2010; Francfort and Marigo 1998):
(24)
Andwhere = a positive infinitesimal used for numerical stability; and = the degradation function. We employ the degradation function as in Miehe et al. (2010)
(25)
(26)
In a ductile fracture, the degradation may be modified to consider the viscoplastic displacement. For further details about the contribution of the plastic strains to the damage growth, refer to Ambati et al. (2015). For the sake of simplicity, we use the degradation function defined in Eq. (26).
The noted fracture model has proven to predict a fracture in tension accurately. However, in compression, several studies have shown that the unrealistic crack arises and fracture surfaces interpenetrate. To cope with these limitations, several authors proposed an additive split of the stored elastic energy (Amor et al. 2009; Miehe et al. 2010) into two parts, one of which is used as a driving force for the fracture phase.
The widely used volumetric-deviatoric split proposed by Amor et al. (2009) and Miehe et al. (2010) is based on the assumption that the damage growth is driven by volumetric expansion and deviatoric deformation:with , being a constant, is the elastic part of the infinitesimal strain.
(27)
Zhou et al. (2019) constructed an energy-based driving force for the crack field using a Mohr–Coulomb-type formulation. The cohesion and friction angle of the material are introduced in the energy
(28)
Experimental Investigations
The new mortar paste was chosen to be a standard mortar based on standard EN 196-1:2016 (CEN 2016) with a ratio of and of 0.5. The utilized sand is a CEN Norm Sand of gradation 0–2 mm according to EN 196-1; the cement is a 42.5 N class commercial cement. Mix proportions used in this study are presented in Table 1. These chosen standardized specifications reduce uncertainties in the mix by avoiding other influencing factors, such as admixtures, and focusing strictly on the influence of the recycled aggregate.
| Aggregate (%) | Aggregate size ( mm) | ITZ thickness (e-mm) | ||
|---|---|---|---|---|
| 0.5 | 0.17 | 26 | 1 |
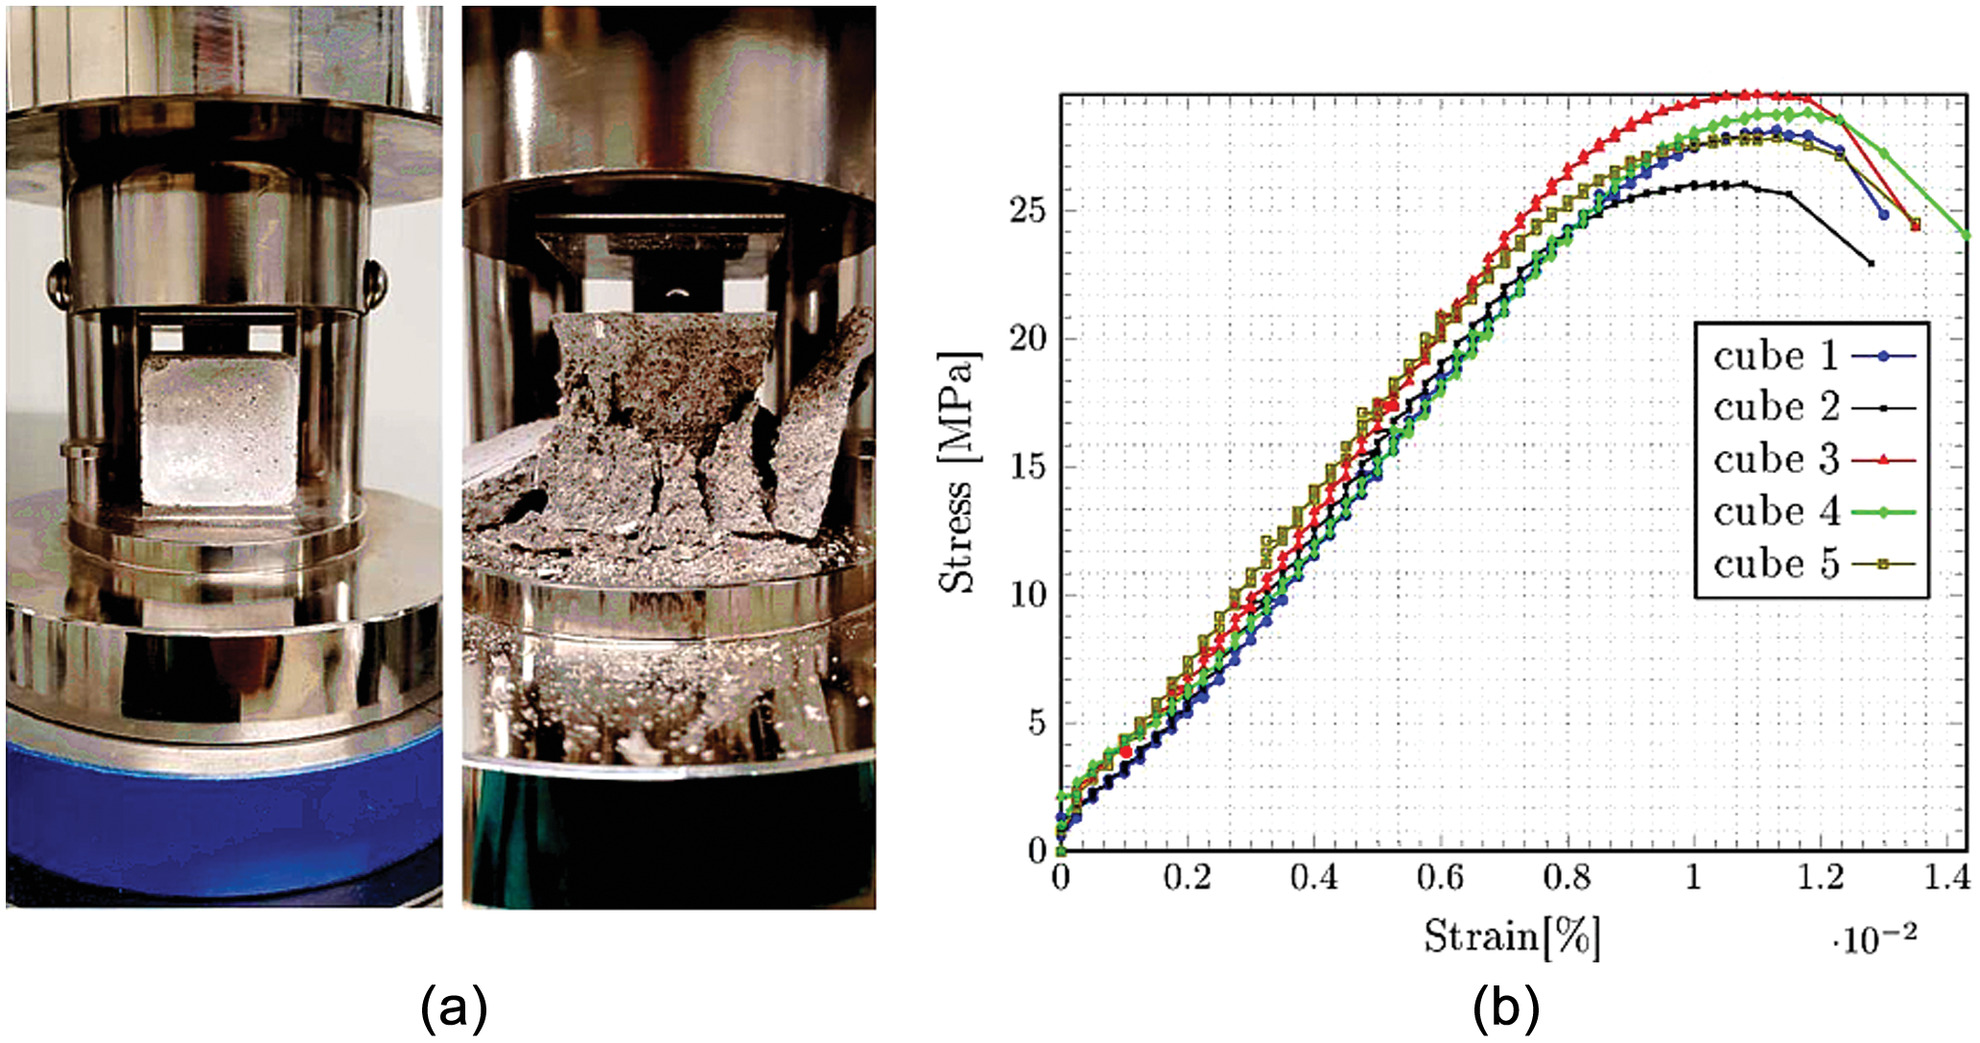
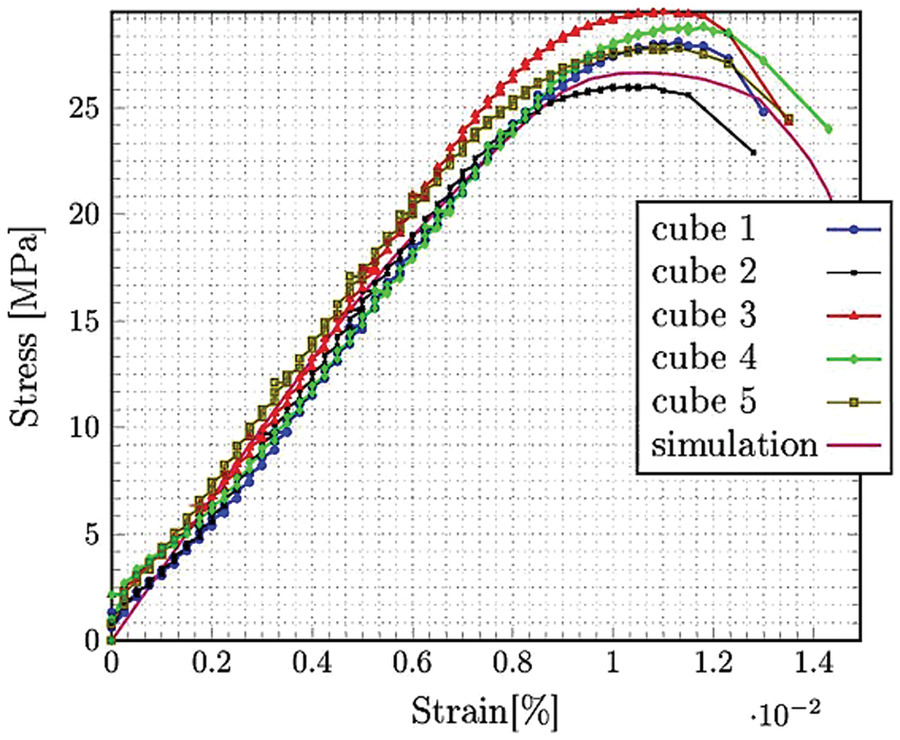
The preparation took place in three stages: first, we dry-mixed the concrete, sand, and cement for 30 s. We added half of the water content in the second step and mixed for 60 s. Further, we added the rest of the water in the third and mixed for 90 s. The molds were vibrated to ensure a compact filling. The specimens were prepared in a controlled environment and tested after 28 days of wet curing. For the compression tests, a 250 kN hydraulic press was utilized [Fig. 3(a)], keeping the speed of loading constant at . Teflon sheets were placed between the specimen and the base plate of the frame to avoid or minimize friction. In total, five cubic specimens were compressed, showing a mean strength of [Fig. 3(a)], which corresponds to a concrete class.
Model Validation
Mesh Generation
In this study, the microstructure of the recycled aggregate is described explicitly such that each phase occupies a specific subdomain, Fig. 4.
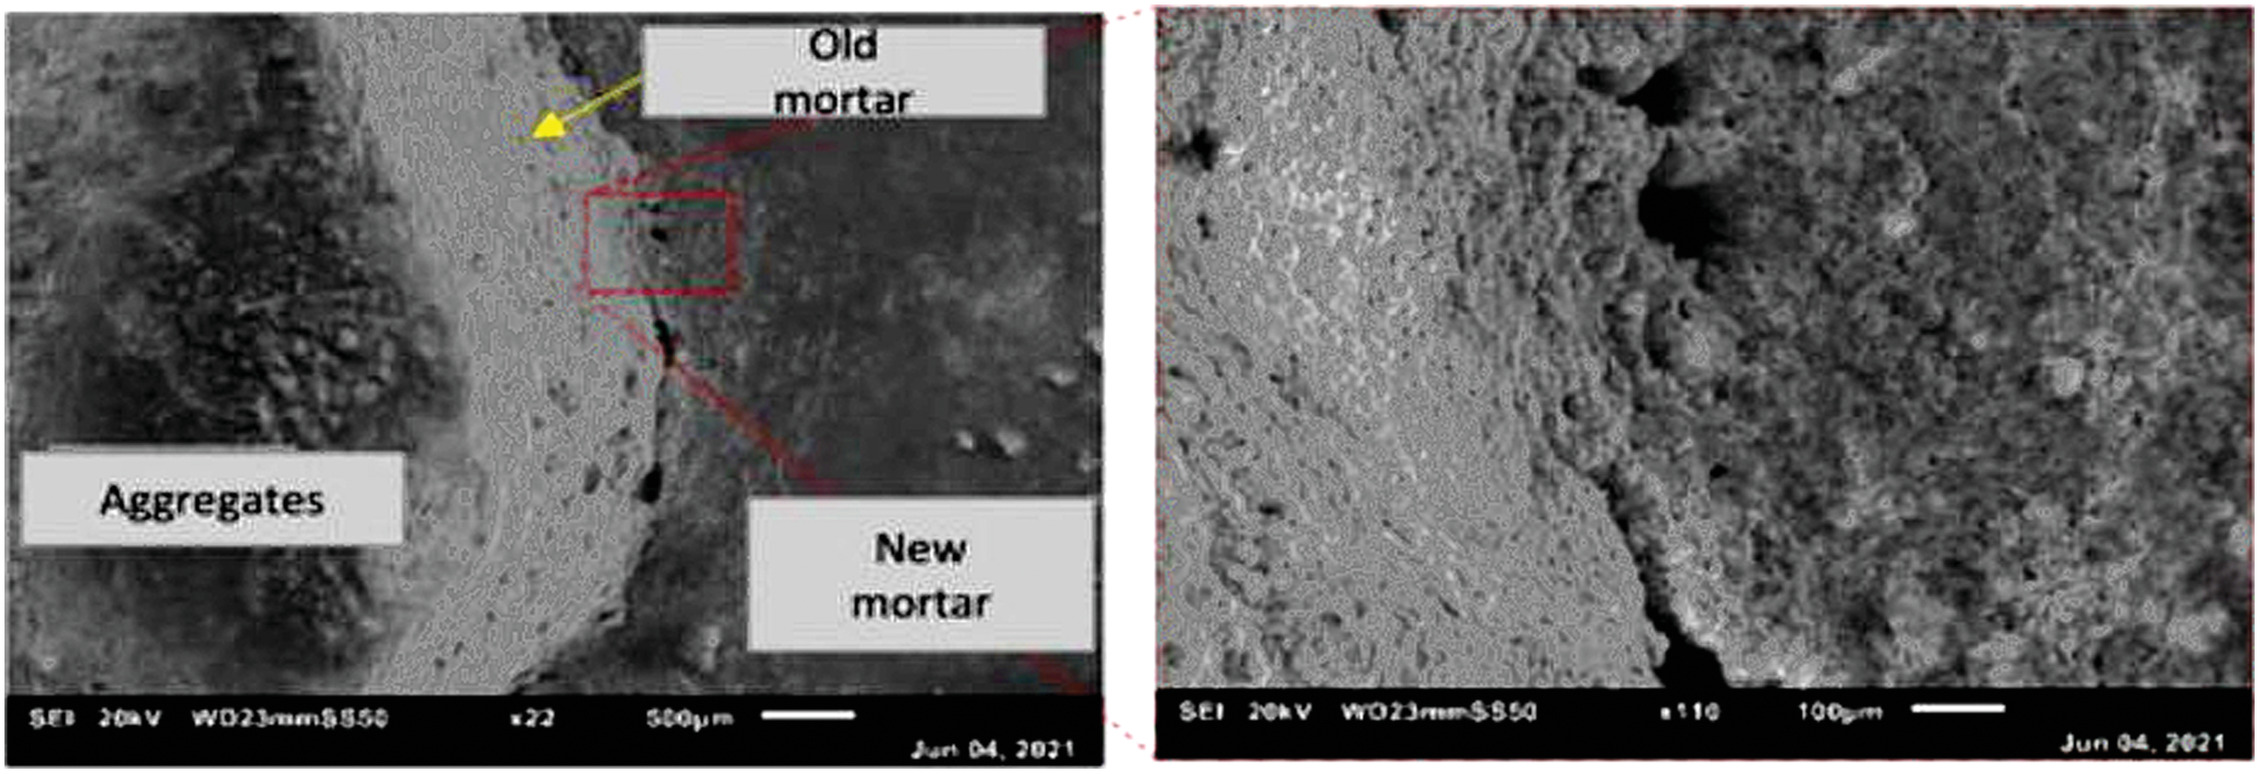
The interphase thickness (old mortar) is equal to in the modeling, according to the SEM observation in Fig. 4. Irregular tetrahedral mesh has been employed to capture complex topology and ensure versatility. Python codes have been used to capture individual regions and the interfaces and allocate numerical markers as mesh functions used during the calculation for material assignation. An initial tetrahedral mesh is generated, a first loop consists of detecting elements near the interfacial zone using a collision detection algorithm (Johansson et al. 2019) and refining them by subdividing the respective cells. This selective refinement reduces the mesh’s size while capturing the interfaces with high precision. Using collision detection from an initial mesh cell contained within the aggregate, the mesh are identified and marked according to the phases present in the matrix, i.e., aggregate, new mortar, and old mortar. Linear elements are used. This process is iterated until the mean cell volume represents the microstructural size. The total number of cells inside an element is , being the number of iterations.
Identification of Model Parameters
For all the simulations to follow, the sample is subjected to a constant displacement rate of at the top nodes while clamped boundary conditions are applied to the bottom nodes. A crucial part of this study is the identification of model parameters.
In fact, for the model to provide credible predictions, the parameters in the constitutive models must be determined through a calibration procedure, which amounts to formulating and solving an inverse problem.
The experimental measurements in Fig. 3 are then used to inform the calibration of the computational model of the material under study.
Certainly, the identification of the model parameter could be improved if more experimental data are available. One can think of increasing the number of multiple tests at constant and distinct strain rates to produce an adequate rich data for accurate calibration.
Due to the limited amount of experimental data at our disposal, we ran a sensitivity study first to focus only on the most sensitive parameters.
The sensitivity analysis results demonstrate that the fracture and plastic parameters of aggregates have little impact on the simulation results. The results are not shown there for a matter of simplicity; in the following, the aggregate is considered as elastic (Karagianni et al. 2017).
A brief description of the model’s parameters is given in Table 2.
| Parameter | Description |
|---|---|
| (GPa) | Young modulus |
| Poisson ratio | |
| (mm) | Characteristic length |
| () | Fracture energy |
| (rad) | Friction angle |
| Cohesion strength | |
| Hardening |
Each phase (aggregates, new mortar, old mortar) is assigned with these parameters.
Elastic Properties of Mortar
In Bogoviku and Waldmann (2022), the authors identified the young modulus, the tensile strength of new mortar and recycled sand mortar (100% substitution); the results are summarized in Table 3.
| Material | (GPa) | (GPa) | (GPa) |
|---|---|---|---|
| New mortar | 22.5 | 2.8 | 35 |
| Recycled mortar | 7.5 | 1.43 | 10 |
Source: Data from Bogoviku and Waldmann (2022).
Fracture Properties of Mortar
The calibration procedure is guided by previous research (Naderi and Kaboudan 2021; Mandal and Mandal 2020). Precisely, the regularization length is adjusted in such a manner that it realistically replicates the typical crack pattern of concrete under uniaxial compression, a point showcased in Fig. 3 (Naderi and Kaboudan 2021) and that it matches the experimental load-displacement curve (Mandal and Mandal 2020).
The regularization length is selected, considering the trade-off between computational cost and the pattern of the crack propagation process: a larger regularization length results in a generalized crack zone process, while a smaller length increases computational time (Mandal and Mandal 2020).
The regularization length is set to the small value of 0.1 mm to better capture the fracture zone process. A sensitivity analysis is carried out later on this parameter. The fracture energy of the residual mortar and the new mortar are computed using this equation (Hillerborg et al. 1976)where = the fracture energy; = the characteristic fracture length; and and =, respectively, the tensile strength and the young modulus, Table 3. We fixed Poisson’s ratio of mortar (old and new) to 0.21, accordingly to the literature values range (Simeonov and Ahmad 1995).
The friction coefficient and the cohesion of the old mortar and the new mortar paste are taken from Bogoviku and Waldmann (2022).
The other parameters of the model were determined by inverse analysis. The objective function quantifies the mismatch between the displacement predicted by the FE model and experimental data, and the optimization problem is solved using gradient-based optimization algorithms.
The identified model (parameters in Table 4) is compared against the experimental data in Fig. 3(b).
| Material | (GPa) | (rad) | (MPa) | () | H | (mm) | |
|---|---|---|---|---|---|---|---|
| Aggregate | 30 | 0.3 | — | — | — | — | — |
| New mortar | 23 | 0.21 | 0.8 | 4.6 | 0.08 | 0.1 | |
| Residual mortar | 16 | 0.21 | 0.7 | 0.13 | 0.024 | 0.1 |
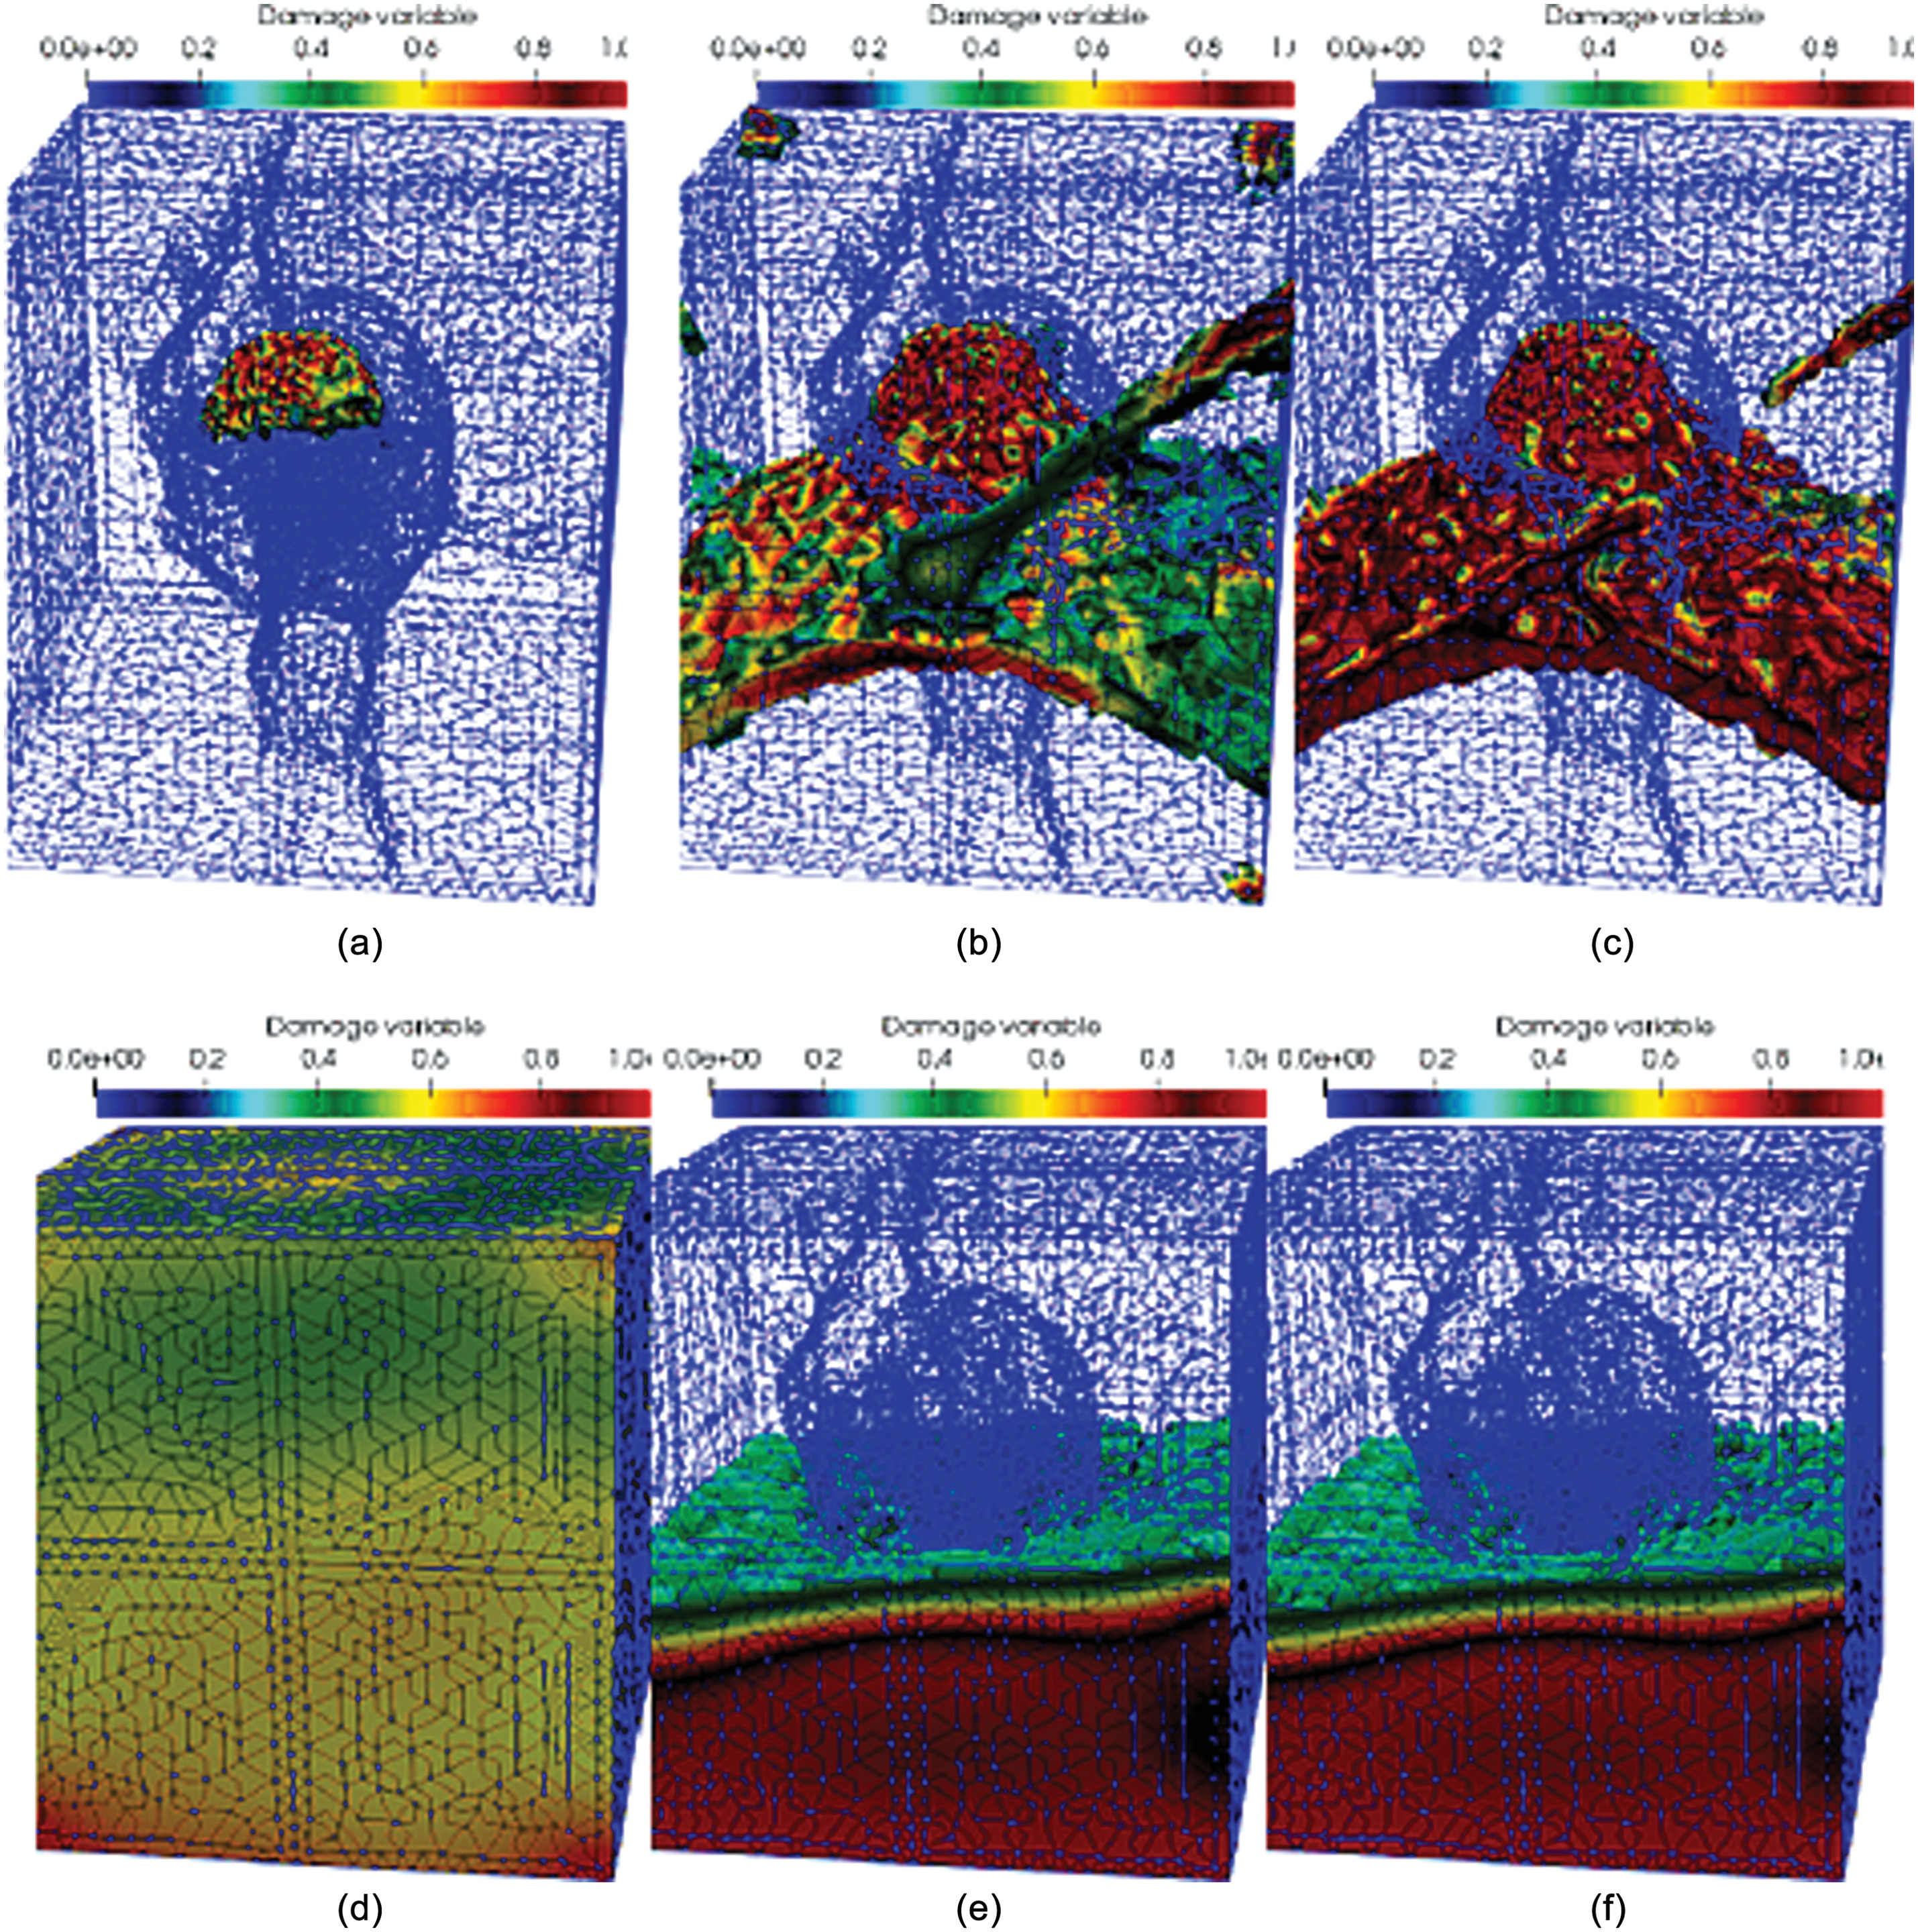
The elastic stiffness, compressive strength, plasticity hardening, and softening regimes of the composite are well captured (see Fig. 5). The displacement at the end of loading, along with the corresponding damaged surface (damaged surface and plastic surface), are presented in Fig. 6; the failure surface develops with an inclination of 30°–45° to the direction of the load due to the cracks interfacial transition zone and in the matrix. The model built at mesoscale can explain the macroscopic behavior considering the heterogeneous properties of the RAC while capturing the 3D complex crack pattern.

Parametric Study
Although the existing resources have been limited in terms of empirical data, nonetheless a parametric study focusing on the model’s most sensitive parameters has been carried out. We carried out a sensitivity study to evaluate the capability of the model to handle a random materials parameter. The identified parameters that match with the experimental results are presented in Table 4. In the following, the plot with these parameters is labeled “reference.” Hereafter, we call () the maximum compressive load reached during the experimental testing.
Influence of Parameters of Regularization
In the following regularization, length is expressed in mm. The impact of on the stress-strain response is investigated. Further, is varied, respectively, while keeping other parameters fixed, Table 4.
The regularization length is an important parameter for the phase-field model. Indeed, initially, it was introduced as a geometric parameter for sharp approximation of the cracks to remove the singularity at the crack tip. It has been proven that the regularized formulation converges (Moës and Belytschko 2002) to the original variational formulation when (Bourdin et al. 2008). Figs. 7–9 show the impact of on the critical stress, which also show that is crucial for predicting the stress-strain response in the phase-field modeling approach. In Fig. 8, however, the variation of the predicted compressive strength with demonstrates that there is a threshold value of , below which the phase-field model response is independent of the regularization parameter.
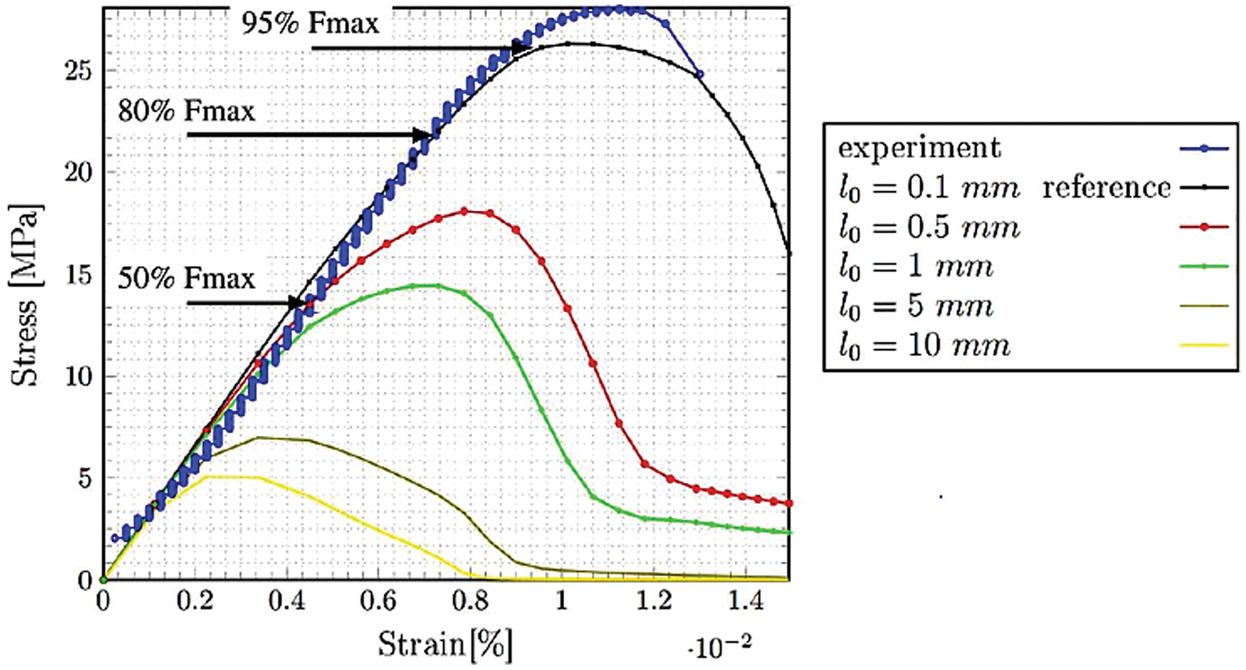
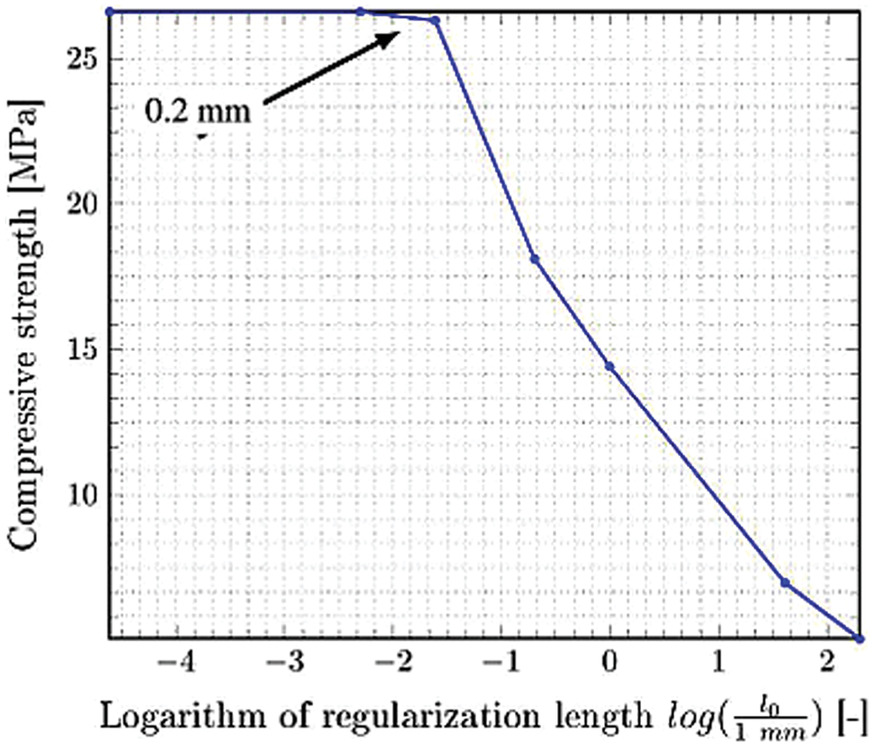
Above this threshold value, the evolution of the compressive strength is quite linear with . The phase-field simulations are valid when the internal length scale is sufficiently small compared with the specimen size, about one-tenth of the smallest side of the sample.
Sensibility Analysis of the Cohesion of Matrix (New Mortar)
The impact of the cohesion of new mortar (Drucker–Prager plasticity model) on the global mesoscopic stress-strain response and fracture process is investigated in this section. The reference values of the model are those obtained by identification of the experiment.
Fig. 10 shows the high impact of the matrix cohesion denoted on the stress-strain response. Increasing it by 30% results in an increase of the load-bearing capacity of more than 20%. Inversely, decreasing the cohesion of the new mortar by reduces the load-bearing capacity by .
The impact of the new mortar cohesion value on the fracture process is illustrated in Fig. 11; for ( decrease of compared with the reference value), the fracture occurs mostly in the matrix, and the ductility of the material is more important. For ( increase of compared with the reference value), the fracture occurs mostly near the interface and could not propagate easily through the matrix.
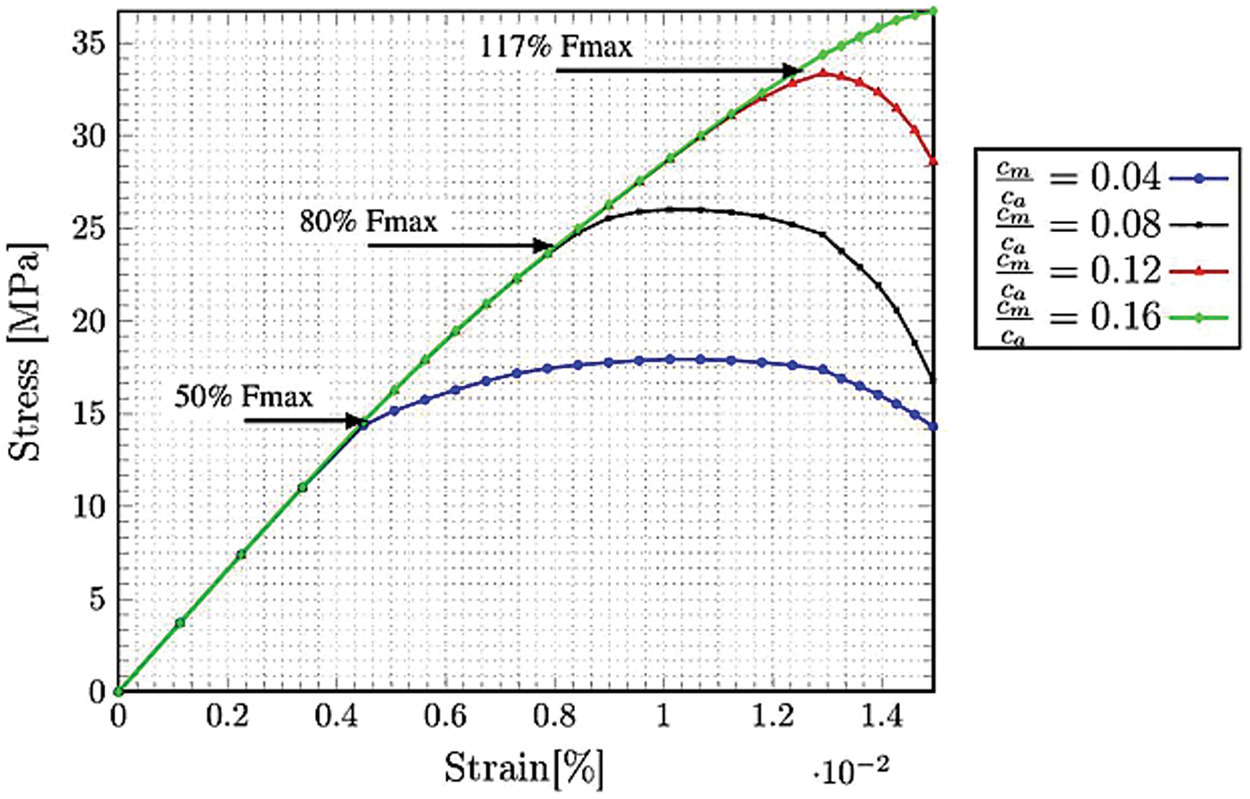
To evaluate the impact of the residual mortar in uniaxial compression, we conducted a sensitivity study by varying its properties via their ratio to the identified reference values (Table 4). Fig. 12 shows the global mesoscopic stress-strain response of uniaxial loading for different ratios of cohesion (RC) and ratio of fracture energy (RG) of the interface. It is noteworthy to highlight that the ultimate load-bearing capacity remains the same, but the elastic limit increases with increasing RC or RG. For instance, for , the nonlinear behavior starts at ; for , it starts at . We also observe the same behavior with RC, for which the nonlinearity for and occurs, respectively, at and above .

The results in Fig. 12 show that the elastic limit is set up by the damage that initiates at the residual mortar zone, which is the weakest point of concrete composites, especially for recycled aggregates. This is practical because it shows a way to improve the mechanical properties of recycled aggregates by increasing the interface bound strengths through surface treatment of aggregates (e.g., use of specific adhesives polymers) or/and nanomodification of the cement paste (e.g., the use of nanosilica fume, nanofibers, and nanotubes).
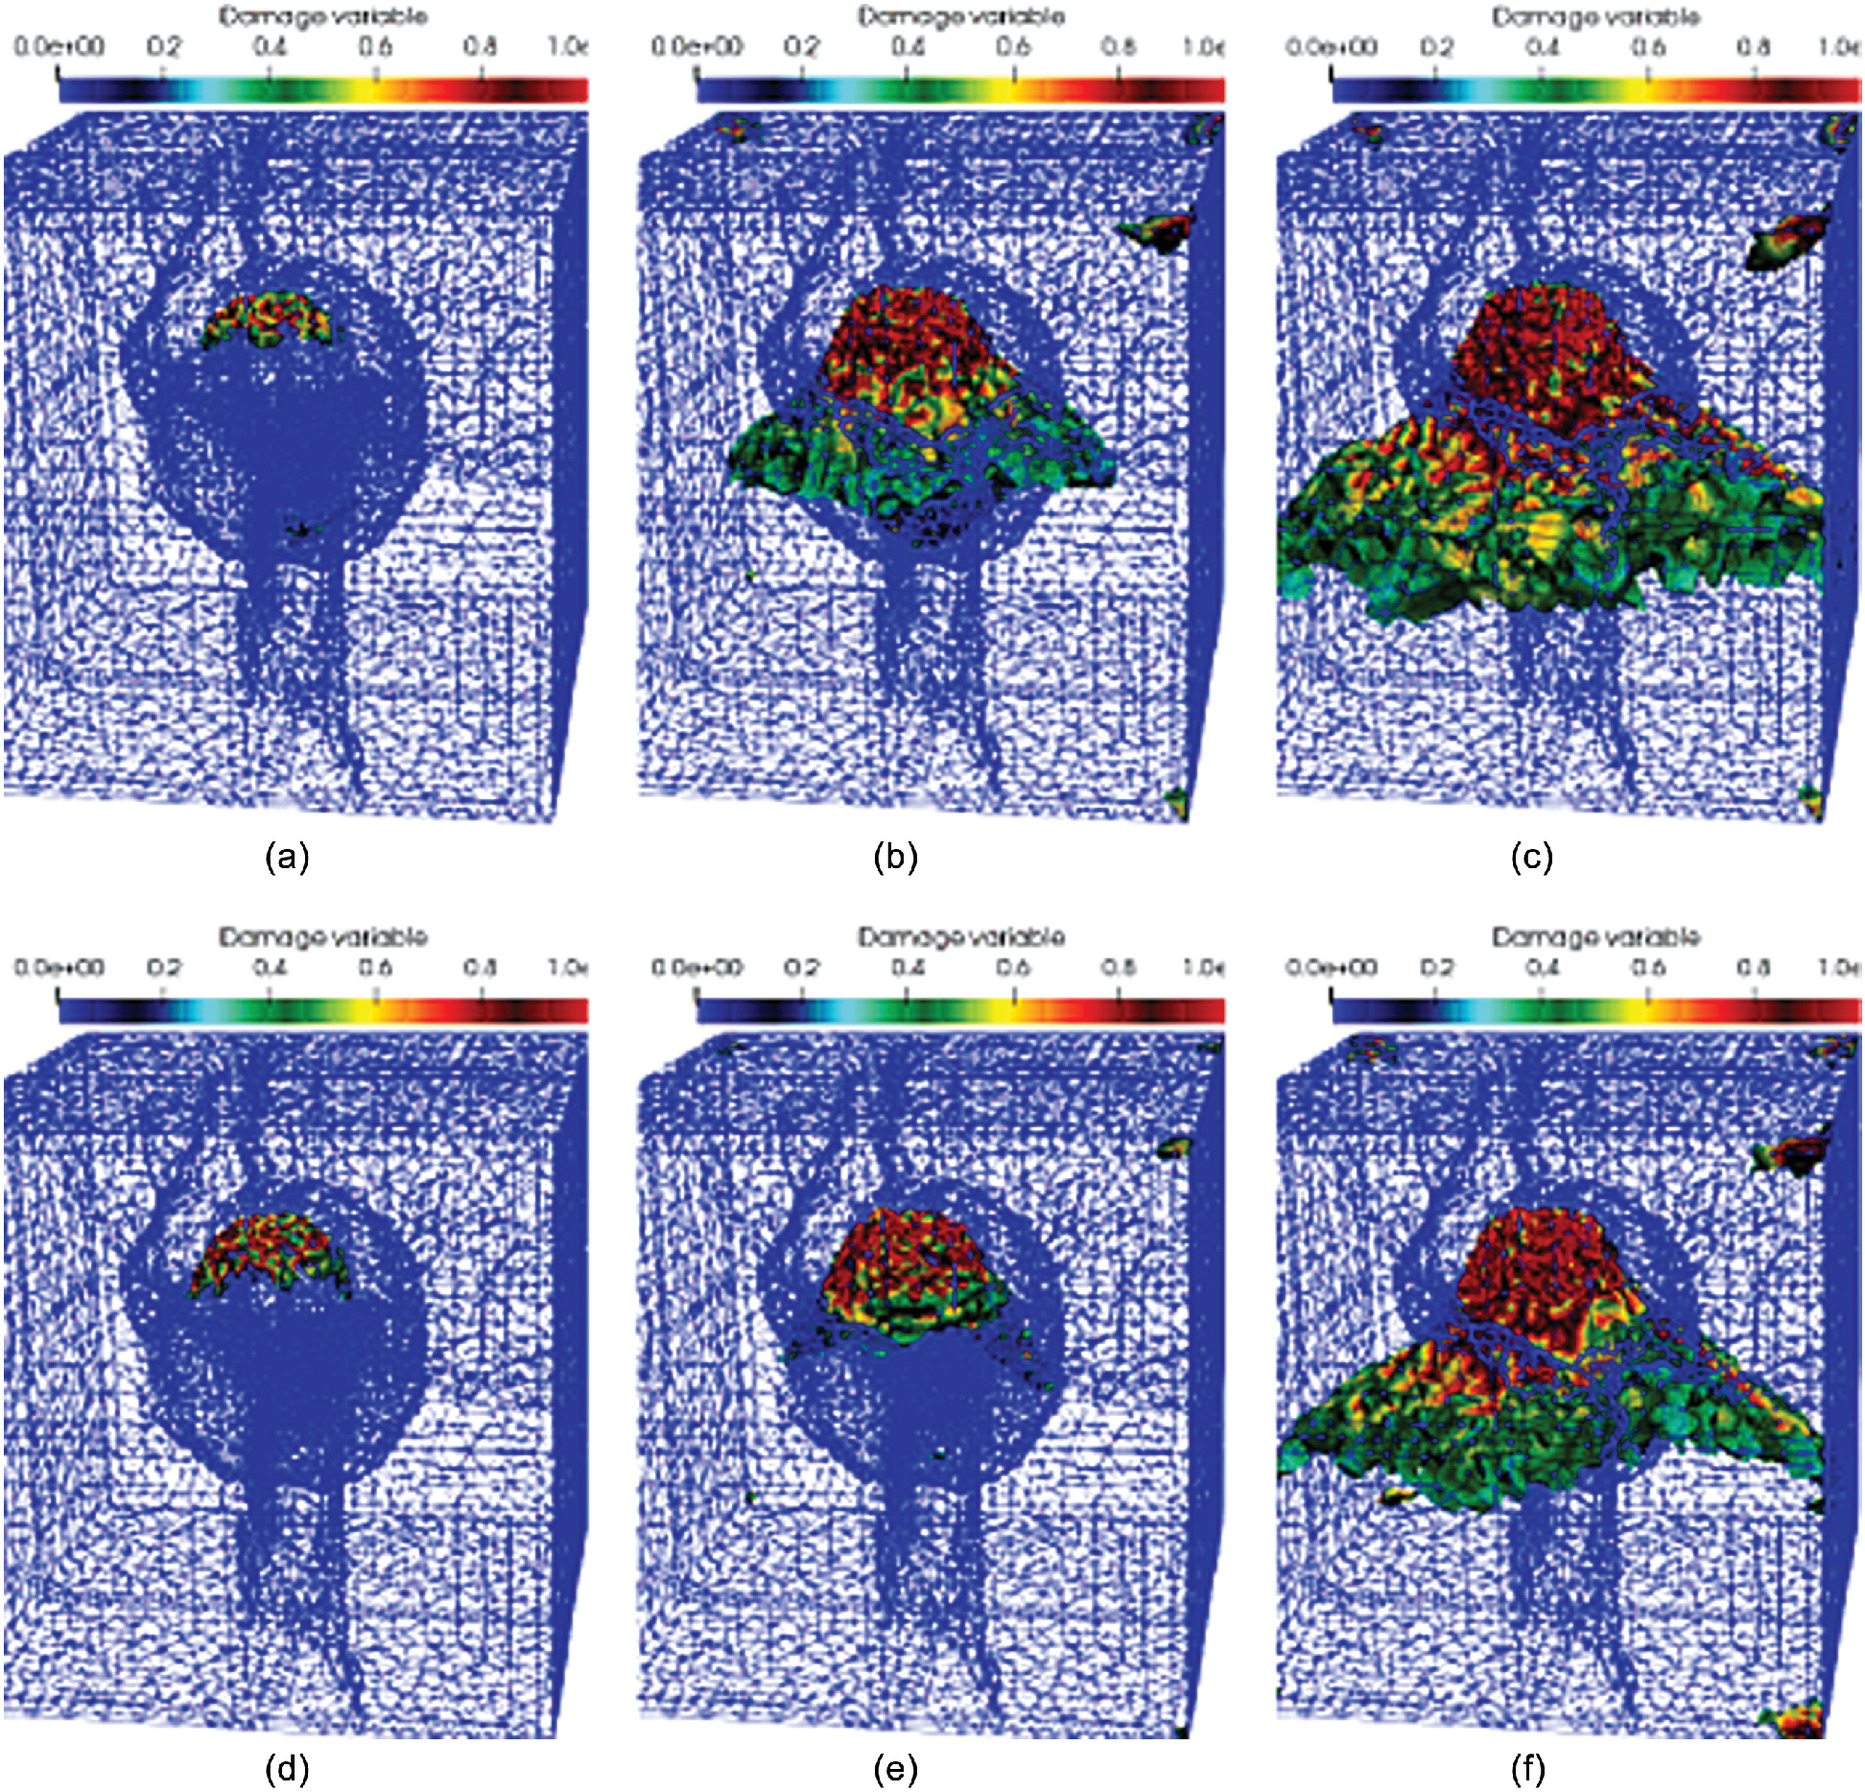
Figs. 13 and 14 present the sensibility of the fracture process zone to the cohesion and fracture energy as the loading is increased. The initiation of damage occurs at the interface between the residual mortar and the aggregate and depends on the strength bond of the interface (fracture energy, cohesion). Also, one can notice from Figs. 13 and 14 that the majority of microcracking occurs at the residual mortar region and much less within the mortar matrix, regardless of the values of cohesion and fracture energy.
Parametric Study on Residual Mortar
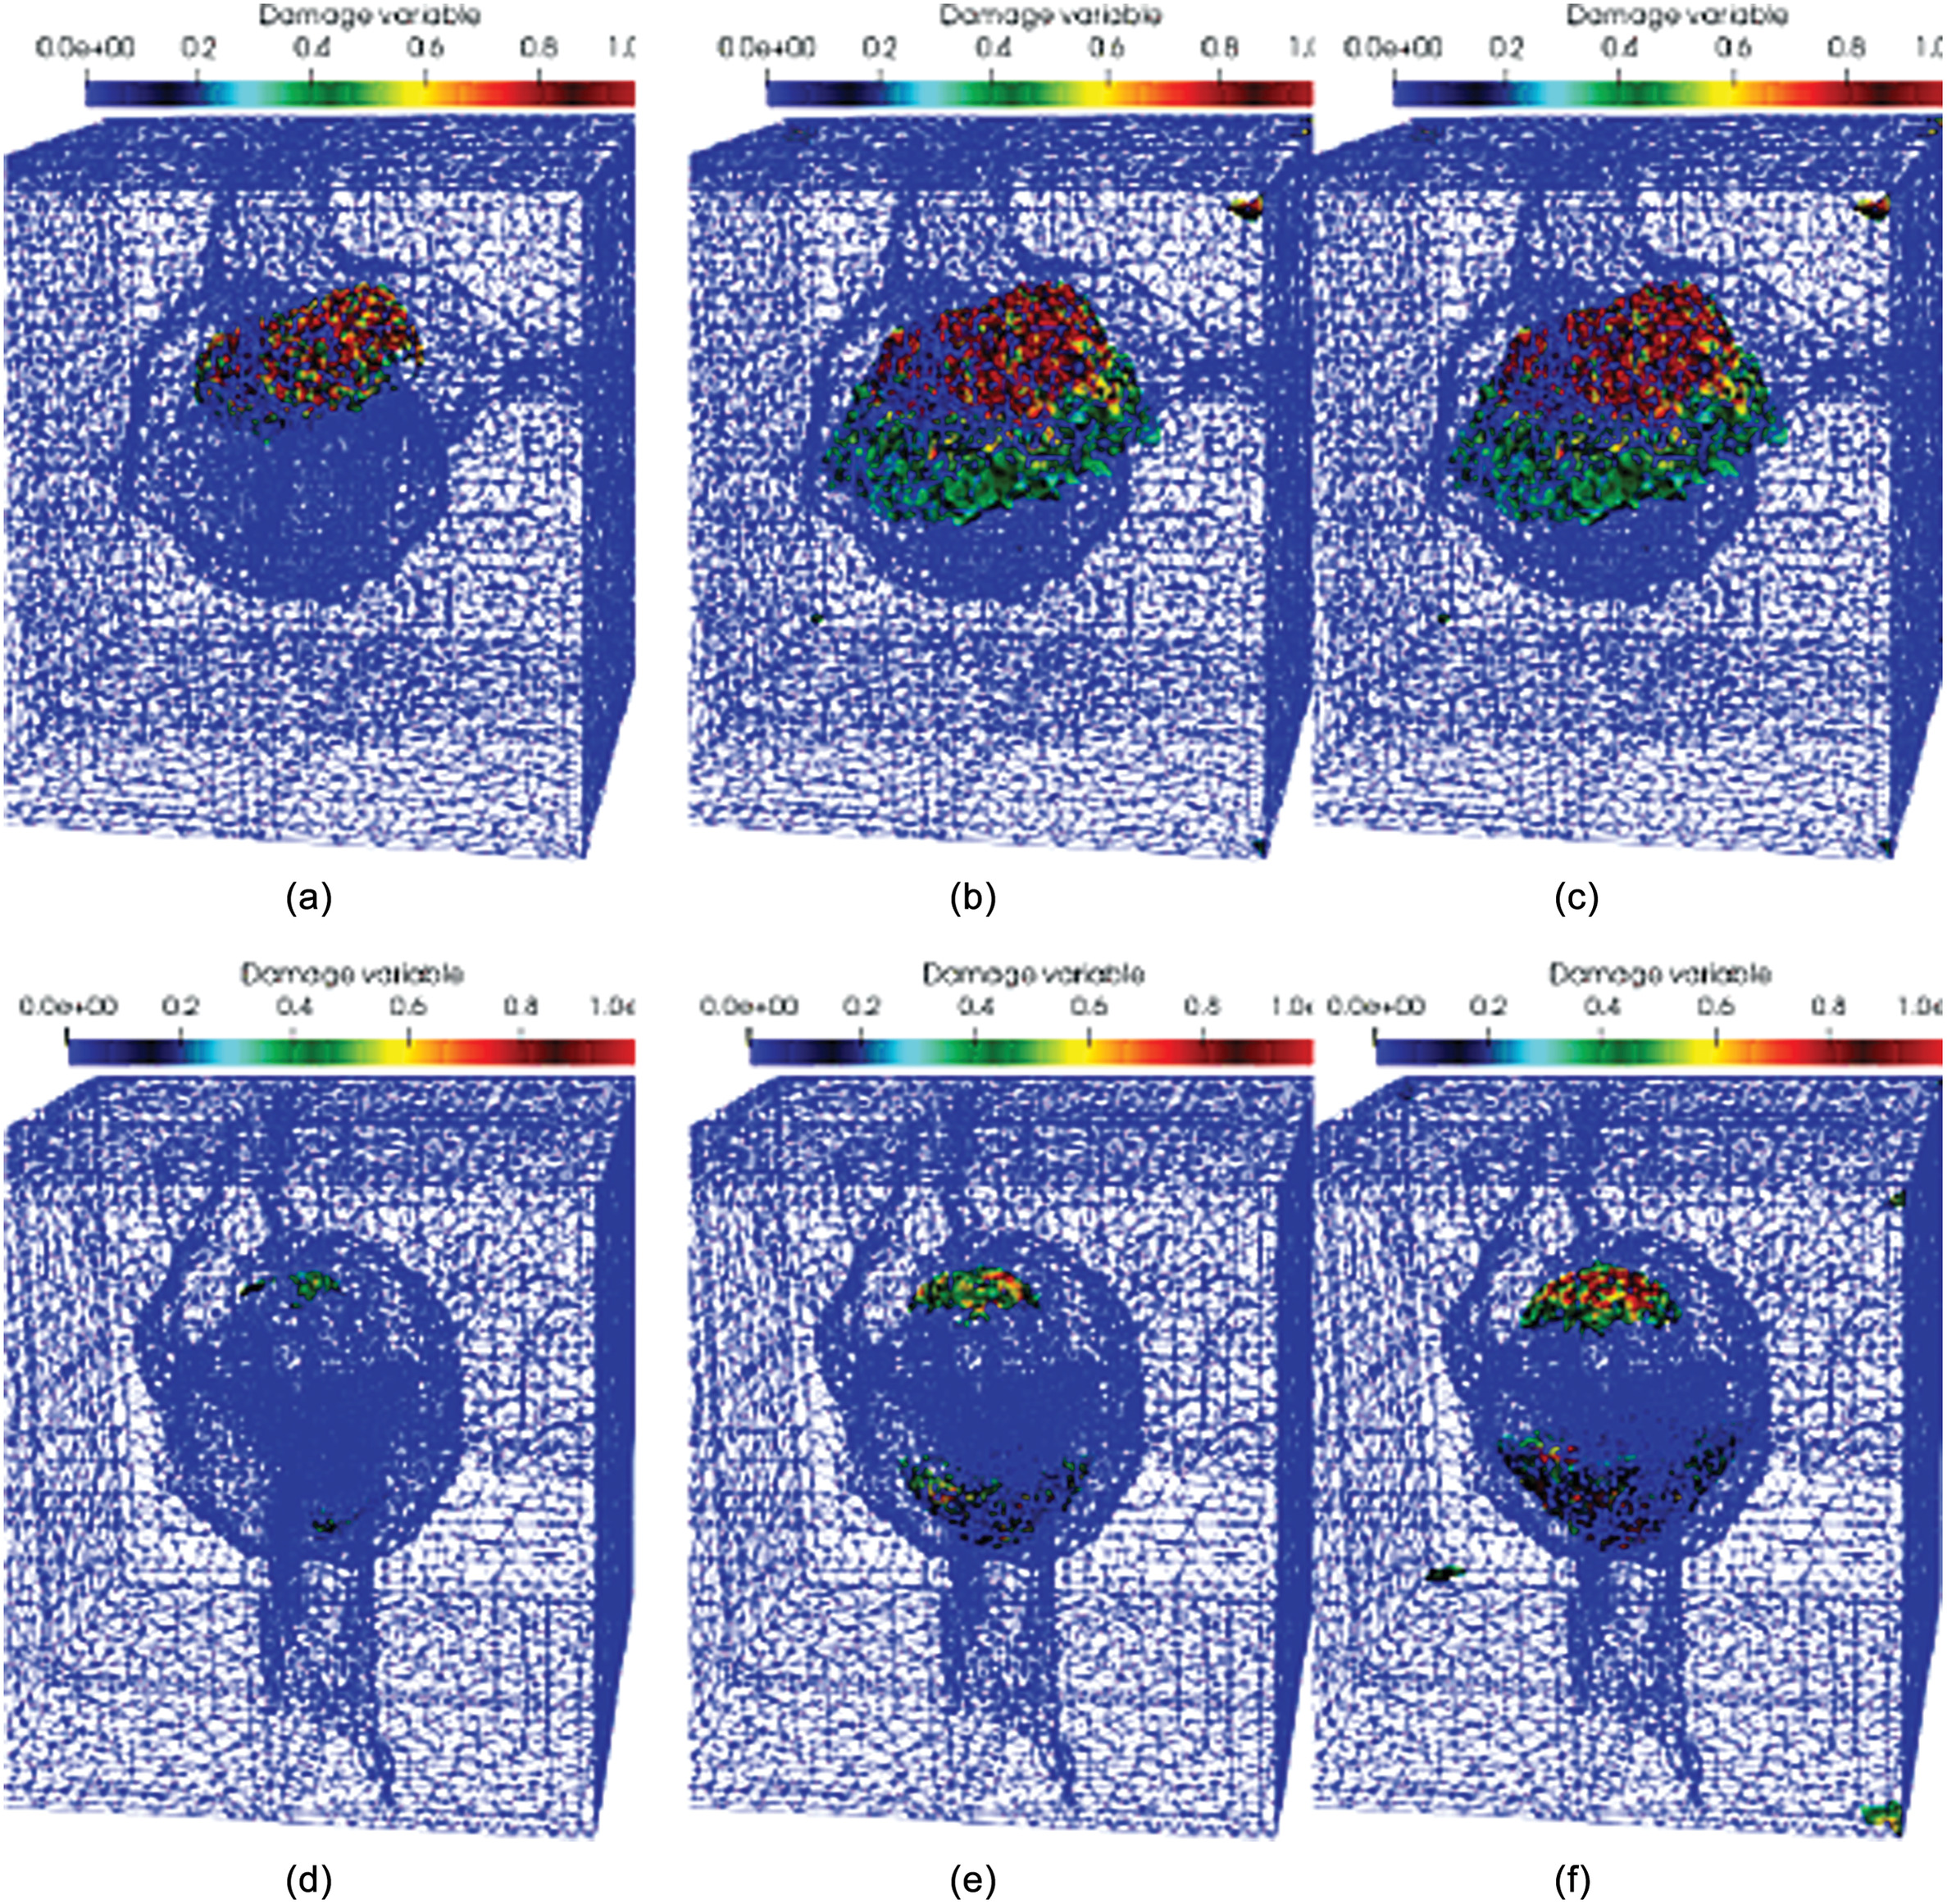
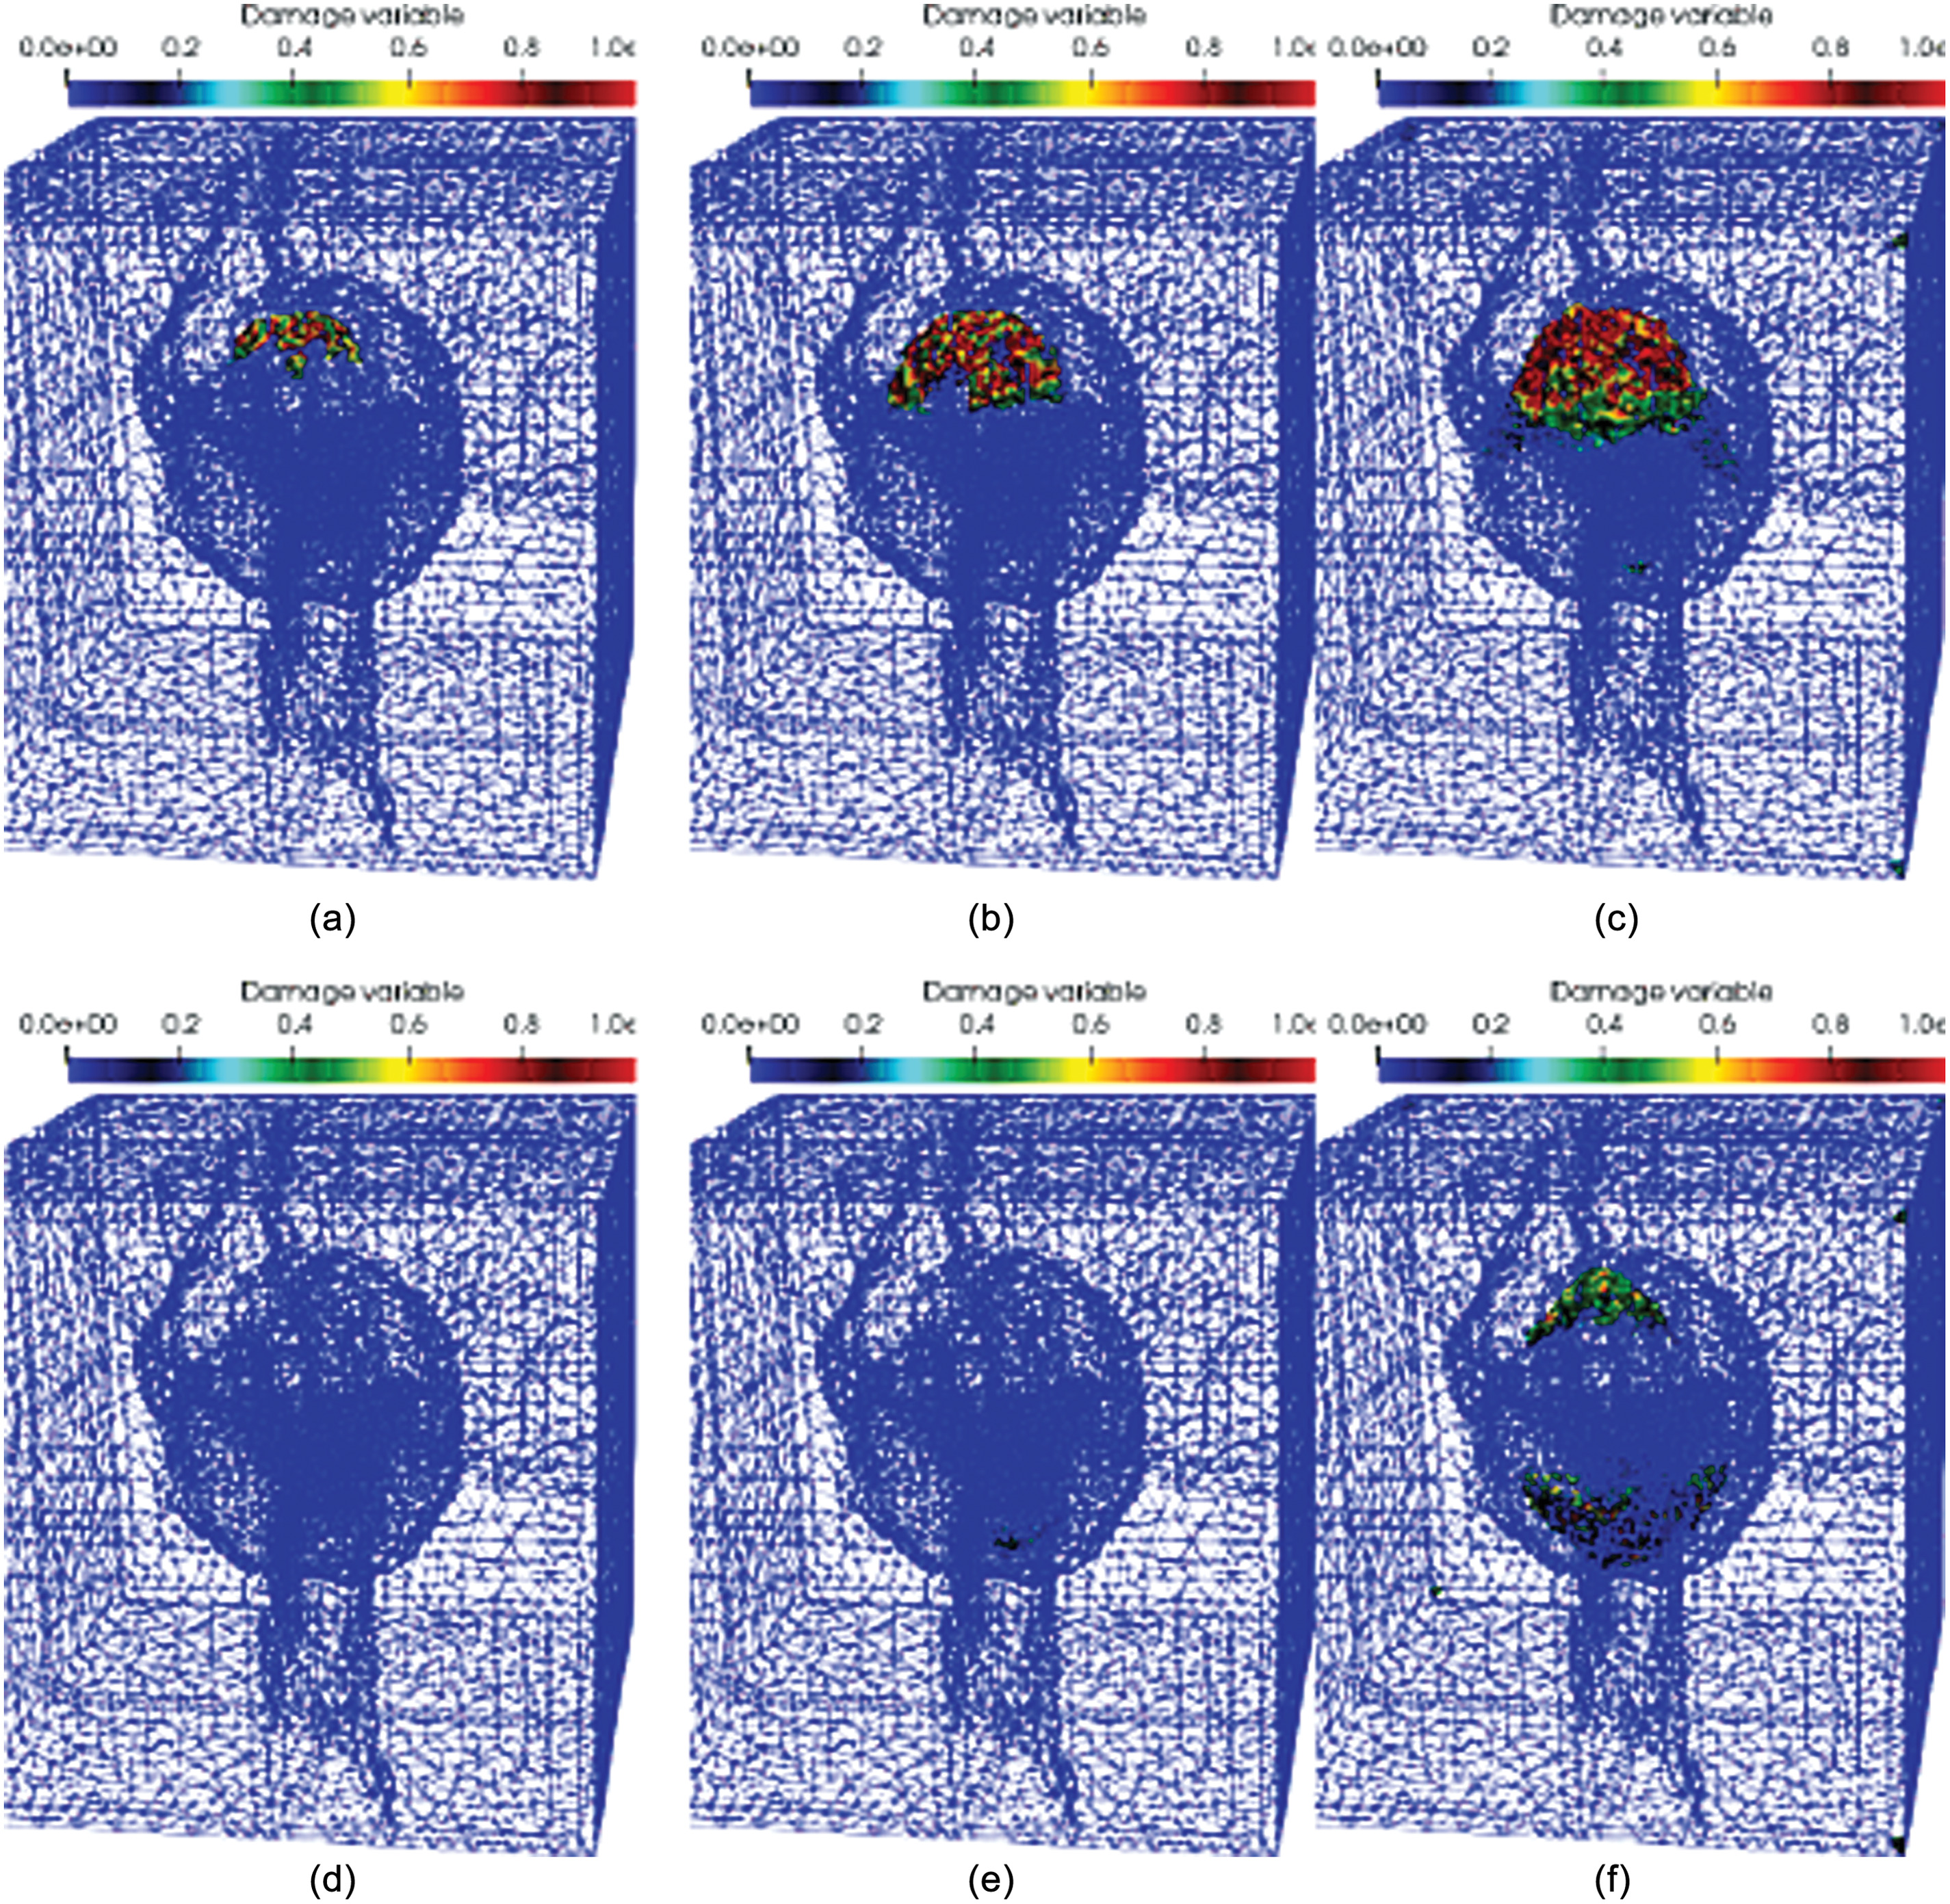
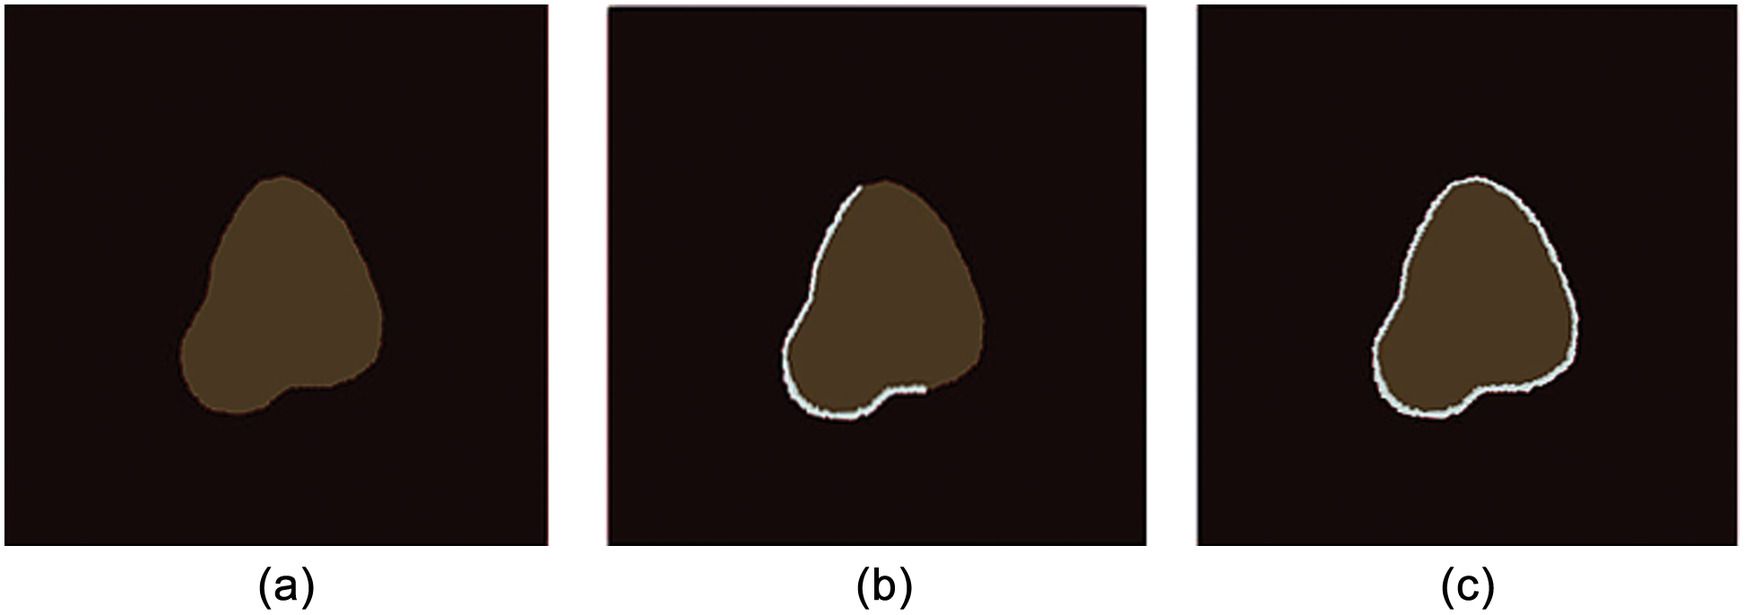
To study the impact of residual mortar on the fracture mechanism, three typologies of residual mortars in recycled aggregates, as shown in Fig. 15, are tested: Topology 1 corresponds to virgin aggregate (no residual mortar); Topology 2 is a recycled aggregate partially recovered with old mortar; and Topology 3 consists of recycled aggregate completely recovered with old mortar. The local damage at the initial and final simulation stages for different residual mortar topologies are analyzed hereafter.
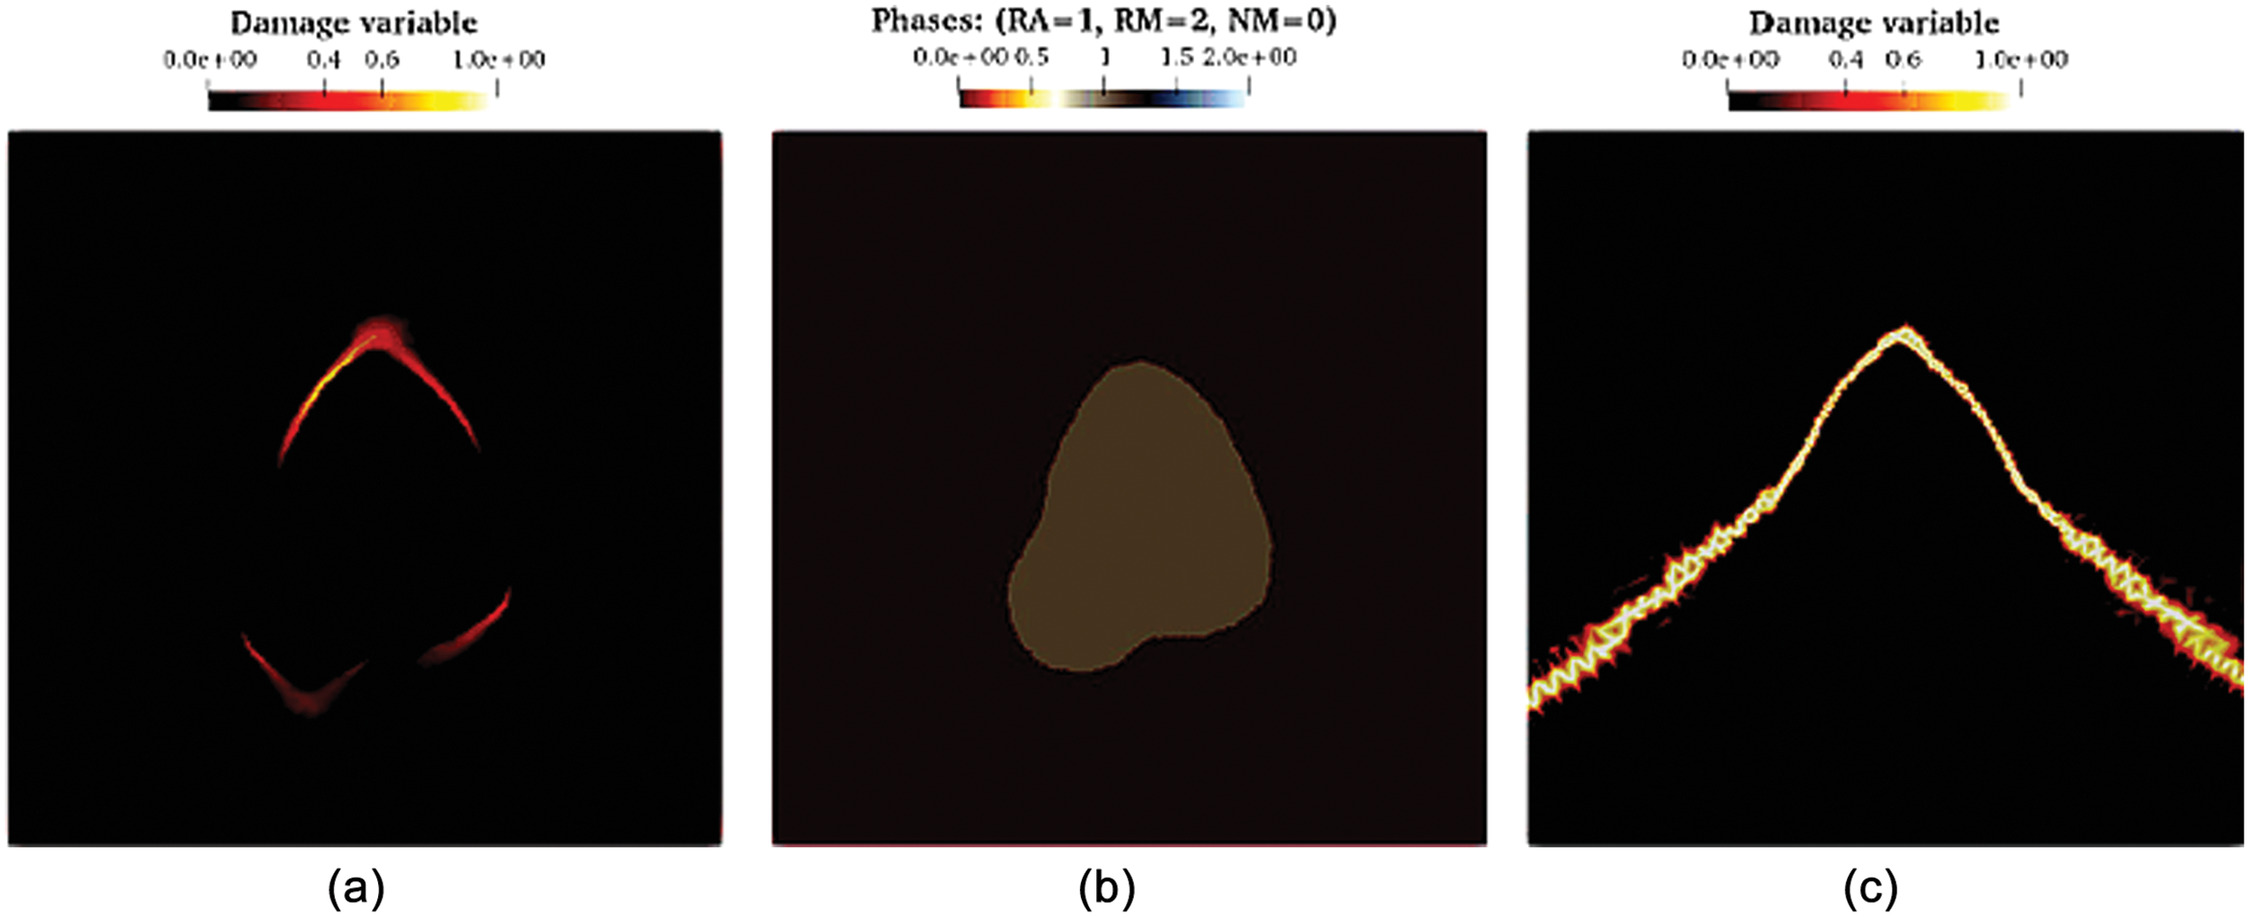
•
No residual mortar. The cracking maps in the case of recycled aggregate concrete without residual mortar is shown in Fig. 16(a). The fracture starts at the level of the sharp edges of the aggregate [Fig. 16(a)] then spreads around the aggregate to continue in the matrix [Fig. 16(c)]. Indeed, the sharp corners are the concentration points of stresses and, therefore, potentially points of cracking initiation. This means that the aggregate shape plays an essential role in crack initiation and propagation.
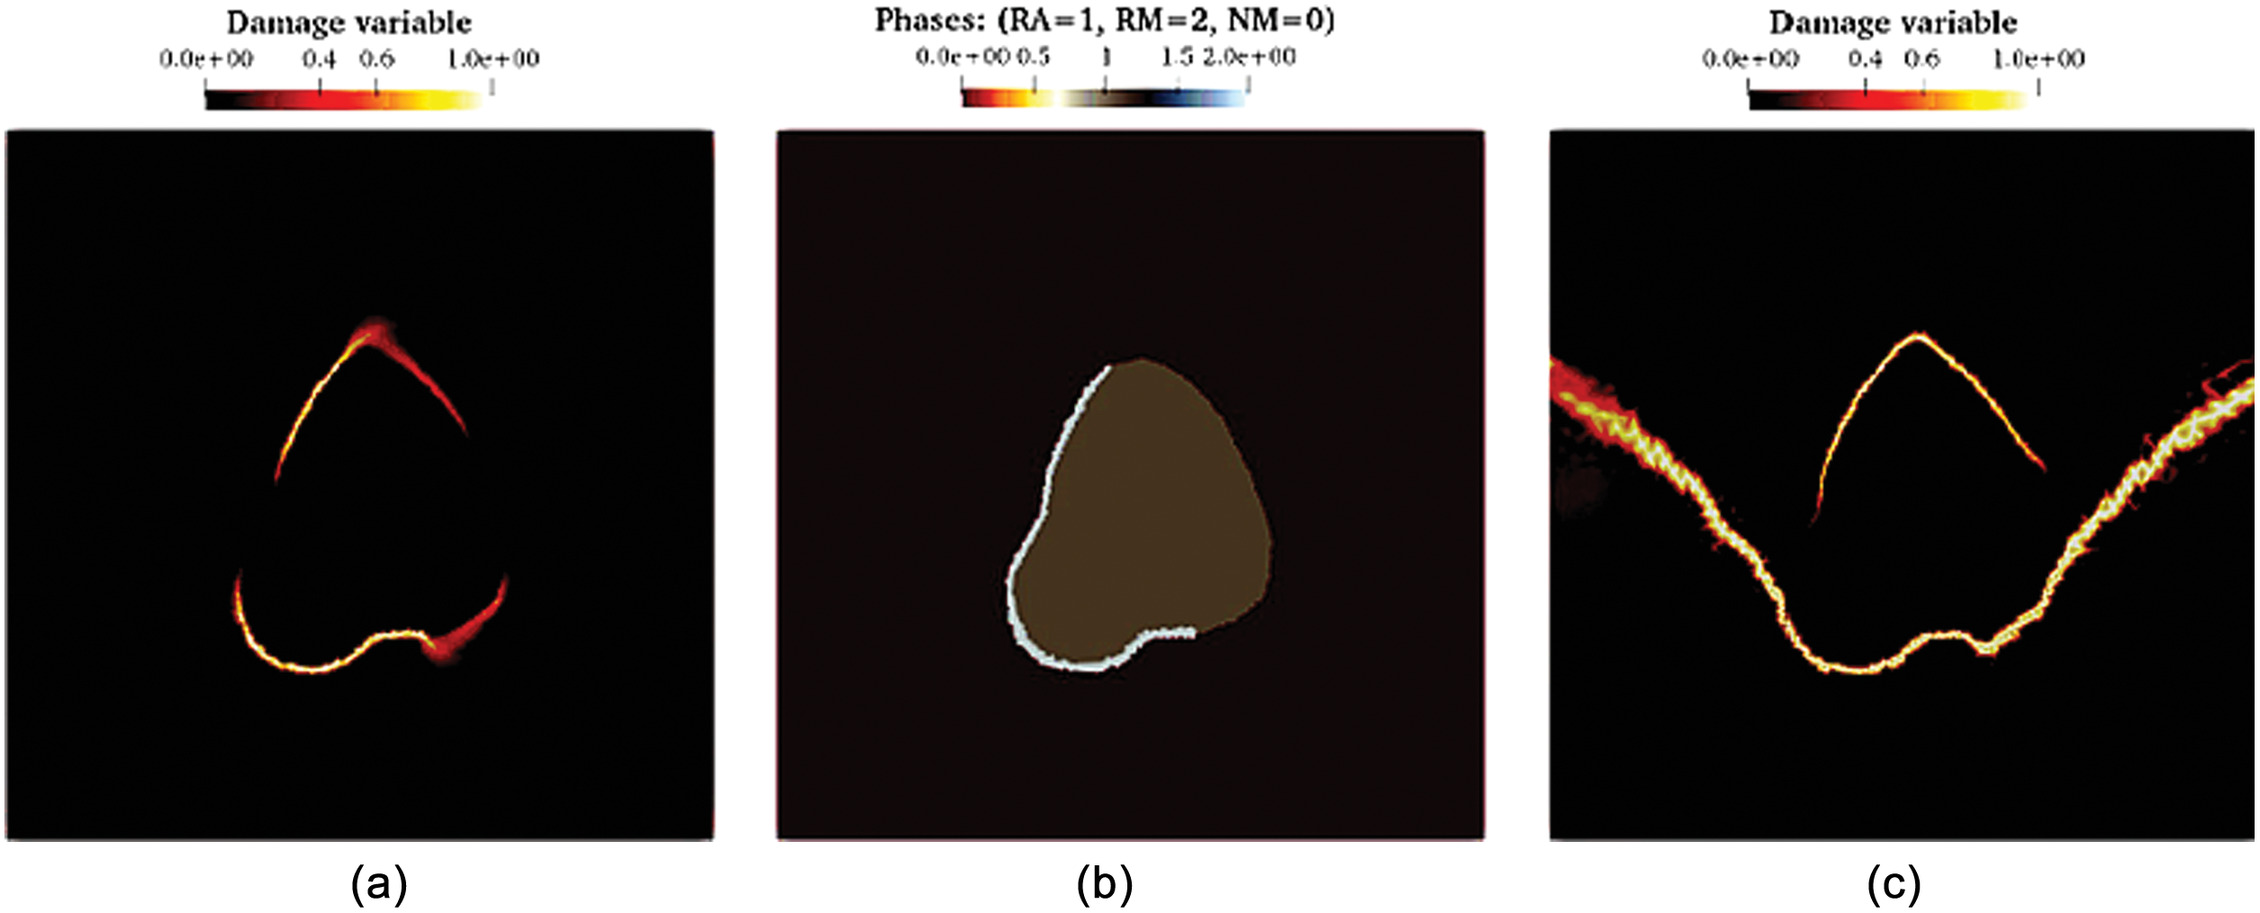
•
Partially covered with residual mortar. The cracks in recycled aggregate concrete with old mortar are displayed in Fig. 17(b). Cracks begin at sharp corners and the residual mortar level, as seen in Fig. 17(a). Subsequently, cracks originating from the residual mortar level dominate and spread rapidly within the matrix, as shown in Fig. 17(c). The interface between the matrix and aggregate, where the residual mortar exists, is the weakest point. This aligns with existing literature, highlighting its susceptibility to forming microcracks even under lower load levels than those necessary for significant fracture damage.
•
Completely covered with residual mortar. The cracking maps of recycled aggregate concrete wholly covered with old mortar are shown in Fig. 18. In this case, all points of the aggregate contour are favorable for crack initiation. The cracks starting from different initiation points coalesce and then diffuse in the matrix Fig. 18(c).

Conclusion
We have developed a mesoscopic model designed explicitly for recycled aggregates, allowing for the inference of the mechanical behavior of a finite element representative volume element based on the individual properties of the material’s constituents, namely, aggregate and mortar. Our research primarily studies fracture initiation and propagation in recycled aggregate concrete to gain deeper insights into its inner mechanics at the mesoscale level. Through comprehensive simulations, our model has uncovered significant findings, outlined here.
First, it has been observed that maintaining a threshold value of 0.2 mm ensures that the response of the phase-field model remains independent of the regularization parameter, thus enabling accurate predictions.
Second, the cohesive properties of the matrix, specifically the new mortar, substantially influence the ultimate load-bearing capacity. A remarkable 20% increase in load-bearing capacity can be achieved by enhancing cohesion.
Additionally, our model demonstrates that stiffness decreases upon damage initiation, and cracks tend to propagate within the mortar matrix.
Further, the cohesion and fracture energy of the residual mortar significantly impacts the elastic limit. Additional simulations on X-ray-scanned concrete microstructures are imperative to further our understanding of the fracture process in recycled concrete with multiple aggregates.
A key innovation of our model lies in incorporating three phases in the concrete modeling process: the new mortar; the interphase (old mortar); and the aggregate.
Our study represents the first application of a mesoscopic phase-field model to investigate the fracture process in recycled aggregates. This novel approach holds immense promise for gaining fresh insights and advancing the field. In the future, integrating our model into a finite element solver as the material law could effectively compute macroscopic properties based on the individual constituent properties. This integration is expected to reduce simulation costs while significantly enhancing the accuracy of prediction.
Data Availability Statement
Some or all data, models, or code generated or used during the study are proprietary or confidential in nature and may only be provided with restrictions.
Acknowledgments
This work received the financial support of the INTERREG FEDER SeRaMCo project under Grants R-AGR-3212-11-C and R-AGR-3815-10-C. Simulations were carried out at the HPC facilities of the University of Luxembourg.
References
Ambati, M., T. Gerasimov, and L. de Lorenzis. 2015. “Phase-field modeling of ductile fracture.” Comput. Mech. 55 (5): 1017–1040. https://doi.org/10.1007/s00466-015-1151-4.
Amor, H., J.-J. Marigo, and C. Maurini. 2009. “Regularized formulation of the variational brittle fracture with unilateral contact: Numerical experiments.” J. Mech. Phys. Solids 57 (8): 1209–1229. https://doi.org/10.1016/j.jmps.2009.04.011.
Bogas, J. A., J. D. Brito, and D. Ramos. 2016. “Freeze e thaw resistance of concrete produced with fine recycled concrete aggregates.” J. Cleaner Prod. 115 (Dec): 294–306. https://doi.org/10.1016/j.jclepro.2015.12.065.
Bogoviku, L., and D. Waldmann. 2022. “Experimental investigations on the interfacial bond strength of the adhered mortar paste to the new mortar paste in a recycled concrete matrix.” Constr. Build. Mater. 347 (Jun): 128509. https://doi.org/10.1016/j.conbuildmat.2022.128509.
Bourdin, B., G. A. Francfort, and J.-J. Marigo. 2008. “The variational approach to fracture.” J. Elast. 91 (1): 5–148. https://doi.org/10.1007/s10659-007-9107-3.
Casuccio, M., M. C. Torrijos, G. Giaccio, and R. Zerbino. 2008. “The failure mechanism of recycled aggregate concrete.” Constr. Build. Mater. 22 (7): 1500–1506. https://doi.org/10.1016/j.conbuildmat.2007.03.032.
CEN. 2016. Methods of testing cement—Part 1: Determination of strength. EN 196-1:2016. Brussels, Belgium: CEN.
Deng, X. H., Z. L. Lu, P. Li, and T. Xu. 2016. “An investigation of mechanical properties of recycled coarse aggregate concrete.” Arch. Civ. Eng. 62 (4): 19–34. https://doi.org/10.1515/ace-2015-0107.
Duan, Z. H., and C. S. Poon. 2014. “Properties of recycled aggregate concrete made with recycled aggregates with different amounts of old adhered mortars.” Mater. Des. 58 (Jun): 19–29. https://doi.org/10.1016/j.matdes.2014.01.044.
Francfort, G. A., and J.-J. Marigo. 1998. “Revisiting brittle fracture as an energy minimization problem.” J. Mech. Phys. Solids 46 (8): 1319–1342. https://doi.org/10.1016/S0022-5096(98)00034-9.
Guo, M., S. Y. Alam, A. Z. Bendimerad, F. Grondin, E. Rozière, and A. Loukili. 2017. “Fracture process zone characteristics and identification of the micro-fracture phases in recycled concrete.” Eng. Fract. Mech. 181 (Aug): 101–115. https://doi.org/10.1016/j.engfracmech.2017.07.004.
Hansen, T. C., and H. Narud. 1983. “Strength of recycled concrete made from crushed concrete coarse aggregate.” Concr. Int. 5 (1): 79–83.
Hillerborg, A., M. Modéer, and P.-E. Petersson. 1976. “Analysis of crack formation and crack growth in concrete by means of fracture mechanics and finite elements.” Cem. Concr. Res. 6 (6): 773–781. https://doi.org/10.1016/0008-8846(76)90007-7.
Hu, X., H. Xu, X. Xi, P. Zhang, and S. Yang. 2022. “Meso-scale phase field modeling of reinforced concrete structures subjected to corrosion of multiple reinforcements.” Constr. Build. Mater. 321 (Feb): 126376. https://doi.org/10.1016/j.conbuildmat.2022.126376.
Johansson, A., B. Kehlet, M. G. Larson, and A. Logg. 2019. “Multi mesh finite element methods: Solving PDEs on multiple intersecting meshes.” Comput. Methods Appl. Mech. Eng. 343 (Jan): 672–689. https://doi.org/10.1016/j.cma.2018.09.009.
Karagianni, A., G. Karoutzos, S. Ktena, N. Vagenas, I. Vlachopoulos, N. Sabatakakis, and G. Koukis. 2017. “Elastic properties of rocks.” Bull. Geol. Soc. Greece 43 (3): 1165. https://doi.org/10.12681/bgsg.11291.
Li, W., J. Xiao, Z. Sun, and S. P. Shah. 2012. “Failure processes of modeled recycled aggregate concrete under uniaxial compression.” Cem. Concr. Compos. 34 (10): 1149–1158. https://doi.org/10.1016/j.cemconcomp.2012.06.017.
Li, X., and Y. Xu. 2022. “Phase field modeling scheme with mesostructure for crack propagation in concrete composite.” Int. J. Solids Struct. 234 (Jan): 111259. https://doi.org/10.1016/j.ijsolstr.2021.111259.
Mandal, S., and B. Mandal. 2020. “Development of porous concrete with recycled aggregate.” In Recent Technologies in Sustainable Materials Engineering: Proc., 3rd GeoMEast Int. Congress and Wxhibition, Egypt 2019 on Sustainable Civil Infrastructures–The Official Int. Congress of the Soil-Structure Interaction Group in Egypt (SSIGE), 22–29. Berlin: Springer.
Medjigbodo, S., A. Z. Bendimerad, E. Rozière, and A. Loukili. 2018. “How do recycled concrete aggregates modify the shrinkage and self-healing properties?” Cem. Concr. Compos. 86 (Feb): 72–86. https://doi.org/10.1016/j.cemconcomp.2017.11.003.
Miehe, C., F. Welschinger, and M. Hofacker. 2010. “Thermodynamically consistent phase-field models of fracture: Variational principles and multi-field FE implementations.” Int. J. Numer. Methods Eng. 83 (10): 1273–1311. https://doi.org/10.1002/nme.2861.
Moës, N., and T. Belytschko. 2002. “Extended finite element method for cohesive crack growth.” Eng. Fract. Mech. 69 (7): 813–833. https://doi.org/10.1016/S0013-7944(01)00128-X.
Naderi, M., and A. Kaboudan. 2021. “Experimental study of the effect of aggregate type on concrete strength and permeability.” J. Build. Eng. 37 (May): 101928. https://doi.org/10.1016/j.jobe.2020.101928.
Nguyen, T.-T., D. Waldmann, and T. Q. Bui. 2019. “Computational chemo-thermo-mechanical coupling phase-field model for complex fracture induced by early-age shrinkage and hydration heat in cement-based materials.” Comput. Methods Appl. Mech. Eng. 348 (May): 1–28. https://doi.org/10.1016/j.cma.2019.01.012.
Paine, K. A., and R. K. Dhir. 2010. “Recycled aggregates in concrete: A performance-related approach.” Mag. Concr. Res. 62 (7): 519–530. https://doi.org/10.1680/macr.2010.62.7.519.
Poon, C. S., Z. H. Shui, and L. Lam. 2004. “Effect of microstructure of ITZ on compressive strength of concrete prepared with recycled aggregates.” Constr. Build. Mater. 18 (6): 461–468. https://doi.org/10.1016/j.conbuildmat.2004.03.005.
Schröder, J., M. Pise, D. Brands, G. Gebuhr, and S. Anders. 2022. “Phase-field modeling of fracture in high-performance concrete during low-cycle fatigue: Numerical calibration and experimental validation.” Comput. Methods Appl. Mech. Eng. 398 (May): 115181. https://doi.org/10.1016/j.cma.2022.115181.
Simeonov, P., and S. Ahmad. 1995. “Effect of transition zone on the elastic behavior of cement-based composites.” Cem. Concr. Res. 25 (1): 165–176. https://doi.org/10.1016/0008-8846(94)00124-H.
Tabsh, S. W., and A. S. Abdelfatah. 2009. “Influence of recycled concrete aggregates on strength properties of concrete.” Constr. Build. Mater. 23 (2): 1163–1167. https://doi.org/10.1016/j.conbuildmat.2008.06.007.
Topçu, I. B. 1997. “Physical and mechanical properties of concretes produced with waste concrete.” Cem. Concr. Res. 27 (12): 1817–1823. https://doi.org/10.1016/S0008-8846(97)00190-7.
Tsitova, A. 2022. Multiscale experimental and numerical study of creep and microcracking in cementitious materials. Paris: Université Paris-Saclay.
Tsitova, A., F. Bernachy-Barbe, B. Bary, S. A. Dandachli, C. Bourcier, B. Smaniotto, and F. Hild. 2022. “Damage quantification via digital volume correlation with heterogeneous mechanical regularization: Application to an in situ meso-flexural test on mortar.” Exp. Mech. 62 (Oct): 333–349.
Wang, J., X. Guo, and N. Zhang. 2021. “Study of the progressive failure of concrete by phase field modeling and experiments.” Int. J. Damage Mech. 30 (9): 1377–1399. https://doi.org/10.1177/10567895211001410.
Wardeh, G., E. Ghorbel, and H. Gomart. 2015. “Mix design and properties of recycled aggregate concretes applicability of Eurocode 2.” Int. J. Concr. Struct. Mater. 9 (1): 1–20. https://doi.org/10.1007/s40069-014-0087-y.
Xiao, J., W. Li, Y. Fan, and X. Huang. 2012. “An overview of study on recycled aggregate concrete in China (1996–2011).” Constr. Build. Mater. 31 (Jun): 364–383. https://doi.org/10.1016/j.conbuildmat.2011.12.074.
Yang, H., S. K. Sinha, Y. Feng, D. B. McCallen, and B. Jeremić. 2018. “Energy dissipation analysis of elastic–plastic materials.” Comput. Methods Appl. Mech. Eng. 331 (Apr): 309–326. https://doi.org/10.1016/j.cma.2017.11.009.
Yang, Z., and S. Dong. 2020. “A roadmap for discretely energy-stable schemes for dissipative systems based on a generalized auxiliary variable with guaranteed positivity.” J. Comput. Phys. 404 (Mar): 109121. https://doi.org/10.1016/j.jcp.2019.109121.
Yip, S., and M. P. Short. 2013. “Multiscale materials modelling at the mesoscale.” Nat. Mater. 12 (9): 774–777. https://doi.org/10.1038/nmat3746.
Zaharieva, R., F. Buyle-Bodin, and E. Wirquin. 2004. “Frost resistance of recycled aggregate concrete.” Cem. Concr. Res. 34 (10): 1927–1932. https://doi.org/10.1016/j.cemconres.2004.02.025.
Zhang, Y., M. Bernhardt, G. Biscontin, R. Luo, and R. L. Lytton. 2015. “A generalized Drucker–Prager viscoplastic yield surface model for asphalt concrete.” Mater. Struct. 48 (Nov): 3585–3601. https://doi.org/10.1617/s11527-014-0425-1.
Zhou, S., X. Zhuang, and T. Rabczuk. 2019. “Phase field modeling of brittle compressive-shear fractures in rock-like materials: A new driving force and a hybrid formulation.” Comput. Methods Appl. Mech. Eng. 355 (Oct): 729–752. https://doi.org/10.1016/j.cma.2019.06.021.
Information & Authors
Information
Published In

Journal of Materials in Civil Engineering
Volume 36 • Issue 6 • June 2024
Copyright
This work is made available under the terms of the Creative Commons Attribution 4.0 International license, https://creativecommons.org/licenses/by/4.0/.
History
Received: Feb 22, 2023
Accepted: Nov 7, 2023
Published online: Mar 20, 2024
Published in print: Jun 1, 2024
Discussion open until: Aug 20, 2024
Authors
Metrics & Citations
Metrics
Citations
Download citation
If you have the appropriate software installed, you can download article citation data to the citation manager of your choice. Simply select your manager software from the list below and click Download.