Modeling Potential Damages of Hurricanes at the Facility Scale: A Case Study of Eglin Air Force Base
Publication: Journal of Infrastructure Systems
Volume 29, Issue 2
Abstract
Tropical cyclones have intensified and are expected to strengthen throughout the 21st century due to climate change impacts. Storm intensification poses a serious threat to coastal municipalities and infrastructure that are not designed to withstand future wind and storm surge potential. Coupled modeling software has been widely used to replicate extreme weather events and simulate climate change effects to understand the magnitude of vulnerability coastal regions face. However, these studies are often conducted at too coarse resolutions to provide decision makers with actionable information for facility-level adaptation. This study addresses this limitation using a coupled modeling approach by simulating climate-intensified hurricane events at Eglin Air Force Base (AFB) along the Florida Panhandle. The study simulates hurricane impacts throughout the 21st century using multithreat projections of storm surge, sea-level rise, and wind intensification. Hazus Multi-Hazard software was used to simulate hurricanes at four threat horizons for five possible climate change scenarios. Storm hazard intensities were extracted at the facility level using geographic information system software to determine the spatiotemporal impact on Eglin AFB’s infrastructure. This analysis provides asset managers with likely intensities that buildings will experience and determine when and to what extent vulnerable facilities need to be made resilient. Results showed Eglin AFB could sustain between $773 million and $1.8 billion (2020 USD) in facility damage by the end of the century. This methodology can be applied to other coastal municipalities, provided adjustments are made to fit regional conditions and extremes, and could be used to inform infrastructure adaptation and development plans.
Introduction
There is growing global concern over the impact of climate change on tropical cyclones (TCs), and their threat to coastal communities and infrastructure portfolios (Pielke and Pielke 1997; Mendelsohn et al. 2011; Peduzzi et al. 2012). Hurricanes, TCs with sustained wind speeds greater than 64 kts [119 km/h ()], making landfall in the US have increased in intensity (Fraza and Elsner 2014), and are expected to continue strengthening, although nonuniformly across space and time throughout the 21st century (Meehl et al. 2000; Elsner et al. 2008; Villarini and Vecchi 2013). Although TC frequency is expected to decrease overall (Walsh et al. 2016), the number of extreme TCs (Category 4 and 5 hurricanes) is expected to increase in occurrence, potentially doubling in frequency by the end of the century (Bacmeister et al. 2016; Bender et al. 2010; Emanuel 2013). Evidence of this trend can be seen by comparing past hurricane seasons, because damages and fatalities stemming from Atlantic Ocean storm activity in the US have increased dramatically. Sixteen of the top 20 costliest hurricanes on record have occurred since 2000, causing $32.2 trillion (2020 USD) in total damages (NHC 2020c). The historical frequency of TCs has increased as well, with 15 named storms and three major hurricanes occurring on average, each season between 2000 and 2019. This represents a 150% increase in frequency and magnitude compared with 1980–1999 averages (NHC 2020b). The 2020 Atlantic hurricane season alone produced 30 named storms and four major hurricanes, making it the most active Atlantic hurricane season on record (NHC 2020a).
Most coastal communities and organizations, including Department of Defense’s (DoD) installations, struggle to adapt asset portfolios to be resilient against TC threats and therefore face substantial risk in terms of infrastructure losses (Contento et al. 2019; Pilkington and Mahmoud 2016; Woodruff et al. 2018). Loss risk from TCs is compounded by population growth and the attractiveness of infrastructure development in coastal areas, putting more people and assets in harm’s way (Crossett et al. 2013; Hauer et al. 2016; Neumann et al. 2015). Although the threat has become apparent, there is still a considerable amount of uncertainty in determining the true magnitude of risk that coastal communities face as the population and the built environment change over time. Historically, regional TC climatology or storm-of-record events have driven coastal community risk assessments and infrastructure design codes (Dehring and Halek 2013; Simmons et al. 2019). Because infrastructure adaptation is expensive and sociopolitically sensitive, it is easier for decision makers to gain support for adaptation to events that have already transpired than it is to rely on projections of future possibilities, which are uncertain or unaccepted (Akerlof et al. 2013; Shao et al. 2017).
Reevaluation of design standards is typically reactive and undertaken when the storm-of-record is superseded, as was the case when Miami-Dade standards were implemented after Hurricane Andrew (Simmons et al. 2019). This reactive design practice causes coastal municipalities to be extremely vulnerable because climate change effects cause uncertainty with possible future TC event intensities. Although most adaptation efforts have been reactive, some coastal municipalities are beginning to develop adaptation strategies based on climate projections (Shi and Varuzzo 2020; Xie et al. 2019). However, cities possess little guidance or mandated documents to drive actionable adaptation (Woodruff and Stults 2016) and regularly postpone implementation to meet short-term budgetary demands (Shi and Varuzzo 2020).
A primary struggle in gaining support for adaptation is the quantifying and understanding of future uncertainties that infrastructure needs to be made resilient against (Kwakkel et al. 2016). Research conducted on uncertainty quantification for coastal regions has underlined this need for adaptation, but these studies are traditionally broad in scope and lack specific implementation recommendations that infrastructure managers require to make informed adaptation decisions (Woodruff and Stults 2016).
An additional gap in research exists in producing and localization of multihazard climate intensification–informed damage assessments at the facility level (Li and Ellingwood 2006). In the context of TCs, which are multihazard by nature (Misuri et al. 2019), an analysis might consider the combined impacts of wind and surge flooding (Li et al. 2012). Combining storm threat criteria can enable a holistic assessment of TC damage potential, so long as the interconnections between threats are designed appropriately (Kappes et al. 2012). Calculating damages from individual parameters, such as wind alone, or simple aggregation of damages ignores the interconnectivity of storm parameters, which can lead to underestimation of true damage potential or double counting of damages sustained from multiple hazards (Pilkington and Mahmoud 2016).
For example, a wind model combined with a storm surge model may overestimate losses if damage to infrastructure is caused by both parameters (Pei et al. 2018). Conversely, there might be cases where the compound impacts of wind and rain magnify damages not captured by simple aggregation alone (Silva de Abreu et al. 2020). This limitation can be overcome by using coupled modeling processes and simulation tools, such as open-access software like FEMA’s Hazus-MH program or coupled estimation frameworks (Barbato et al. 2013) that account for multihazard criteria and their interconnectivity. This study explores the use of such modeling software at Eglin Air Force Base (AFB) and how the information can inform facility-level decisions.
If it is the goal of storm simulation research to answer the question: What degree must infrastructure be made resilient?, it is natural to expect that new design standards will emerge as an adaptation method. However, it is inefficient to establish a single design standard needed to achieve long-term resilience because this might lead to overdesign or premature adaptation (Dehring and Halek 2013). Furthermore, not considering facility importance and condition when applying a uniform building standard will drive excessive expenditures in terms of initial construction and recurring maintenance costs (Simmons et al. 2019). Analyzing storm threats must be done both temporally and spatially to enable effective development of adaptation standards to inform policy (Pei et al. 2014) and determine likely intensities and their timeframe for individual facility damage mitigation (Masoomi et al. 2019). Therefore, models must consider various climate change projection scenarios to ensure standards are robust enough for future intensity possibilities.
Comparing the severity of damage intensities and probabilities across multiple threat horizons allows for adaptation signals to be identified and when improvements are needed to achieve maximum threat avoidance (Stephens et al. 2018). We refer to threat horizons as expected ranges of damages associated with climate change at different future times. This concept of using risk signals to trigger adaptation is crucial to adapting infrastructure to changing conditions over time (Haasnoot et al. 2013) and mitigating the threat TCs pose to coastal cities.
Considering the limitations of the aforementioned literature, highlighted by the gap between the coarseness of storm model predictions and the demand for additional granularity in damage assessments, the objective of this research is to analyze the potential effects of climate change on TC activity at the facility level for coastal communities. The results address three questions:
•
How will climate change affect TC strength and risk to coastal communities and infrastructure over time?
•
How can multihazard coupled modeling be used to develop damage estimates and determine the spatial importance of individual threats from intensified storms?
•
How can analyzing storm activity at the infrastructure system level be beneficial in improving coastal resiliency?
This study applies a multihazard coupled model at the infrastructure system level to answer these questions through a case study analysis of Eglin AFB, located in the Florida Panhandle, in which the current infrastructure at the installation is simulated against major probabilistic hurricanes occurring at various threat horizons throughout the 21st century. Hazus version 4.2 software was used to simulate the intensification of a storm event spatially and across multiple threat horizons. The analysis supported facility-level analysis and discussions surrounding potential threat intensification over the remainder of the century. Although this research is focused on a specific region, the methodology framework presented here can be applied to other coastal municipalities; provided adjustments are made for regional conditions, extremes, and geospatial infrastructure parameters are known or available.
Materials and Methods
Methodology Overview
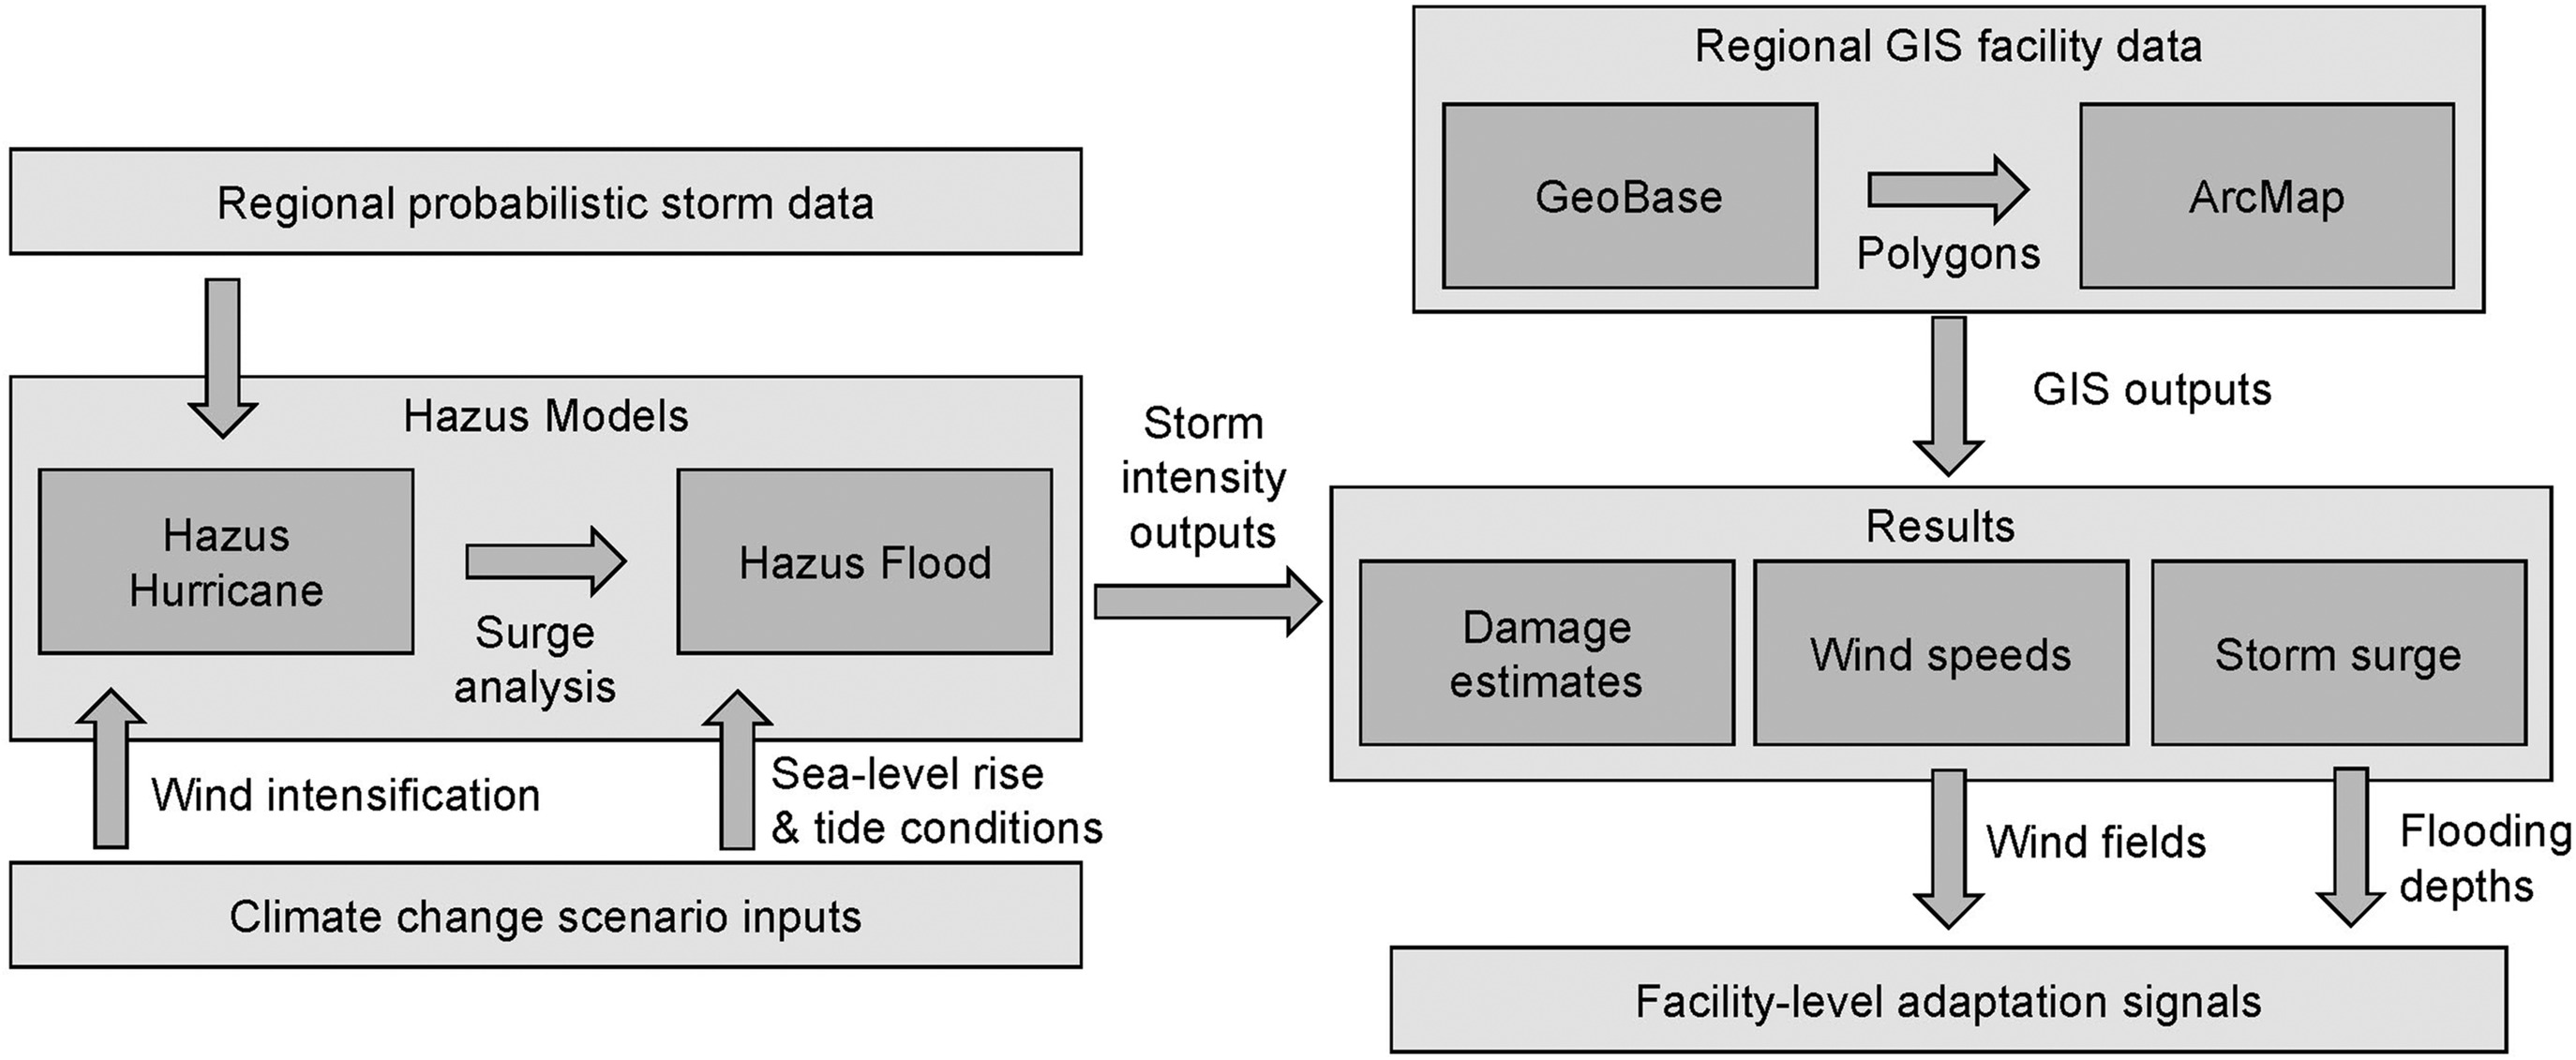
The multihazard modeling approach developed in this work combines existing climate change projections with historical hurricane profile parameters to generate facility-level damage estimates for storm occurrence at four threat horizons (2020, 2035, 2065, and 2100). These threat horizons are coupled with five different climate projections of increasing severity (lowest, low, moderate, high, and highest). This simulation is accomplished in four parts: (1) determination of a multithreat TC damage framework based on regional probabilistic storm data and calibrated to a previously performed analysis for Eglin, (2) construction and simulation of intensified hurricane scenarios to produce census tract-level damage estimates, (3) aggregation of climate-intensified hurricane parameters, and (4) extraction of hurricane intensity measures to the facility level through coupling with Eglin AFB’s building inventory data. Fig. 1 shows the methodological sequence performed for each climate change scenario across the threat horizons, which resulted in 16 simulated storms (one baseline storm and five storms each at three time horizons).
Regional Probabilistic Storm Data
Eglin AFB is a major US military installation located in northwestern Florida, bordering the Gulf Coast (Fig. 2). The installation is the largest in the Air Force in terms of size, encompassing over (460,000 acres). It consists of over 3,000 facilities with a total plant replacement cost of $9 billion, supporting 9,500 active-duty military members and their families (DoD 2018). Elevation for the installation ranges from () below mean sea level (MSL) along the shoreline to 28 m (92 ft) above MSL in northern woodland regions. Eglin AFB was selected as the study region of interest due to its proximity to the Gulf of Mexico, which has experienced increased hurricane activity, and its compatibility with coastal communities. Additionally, available data included facility-level data sets and GIS information, enabling the extraction of hazard intensity. Lastly, Eglin AFB was the subject of previous hurricane, wind-only threat assessments (Elsner et al. 2011; Scheitlin et al. 2011; Scheitlin and Elsner 2010). These studies provided the platform for calibration and a hurricane profile that was expanded upon for simulating intensification.
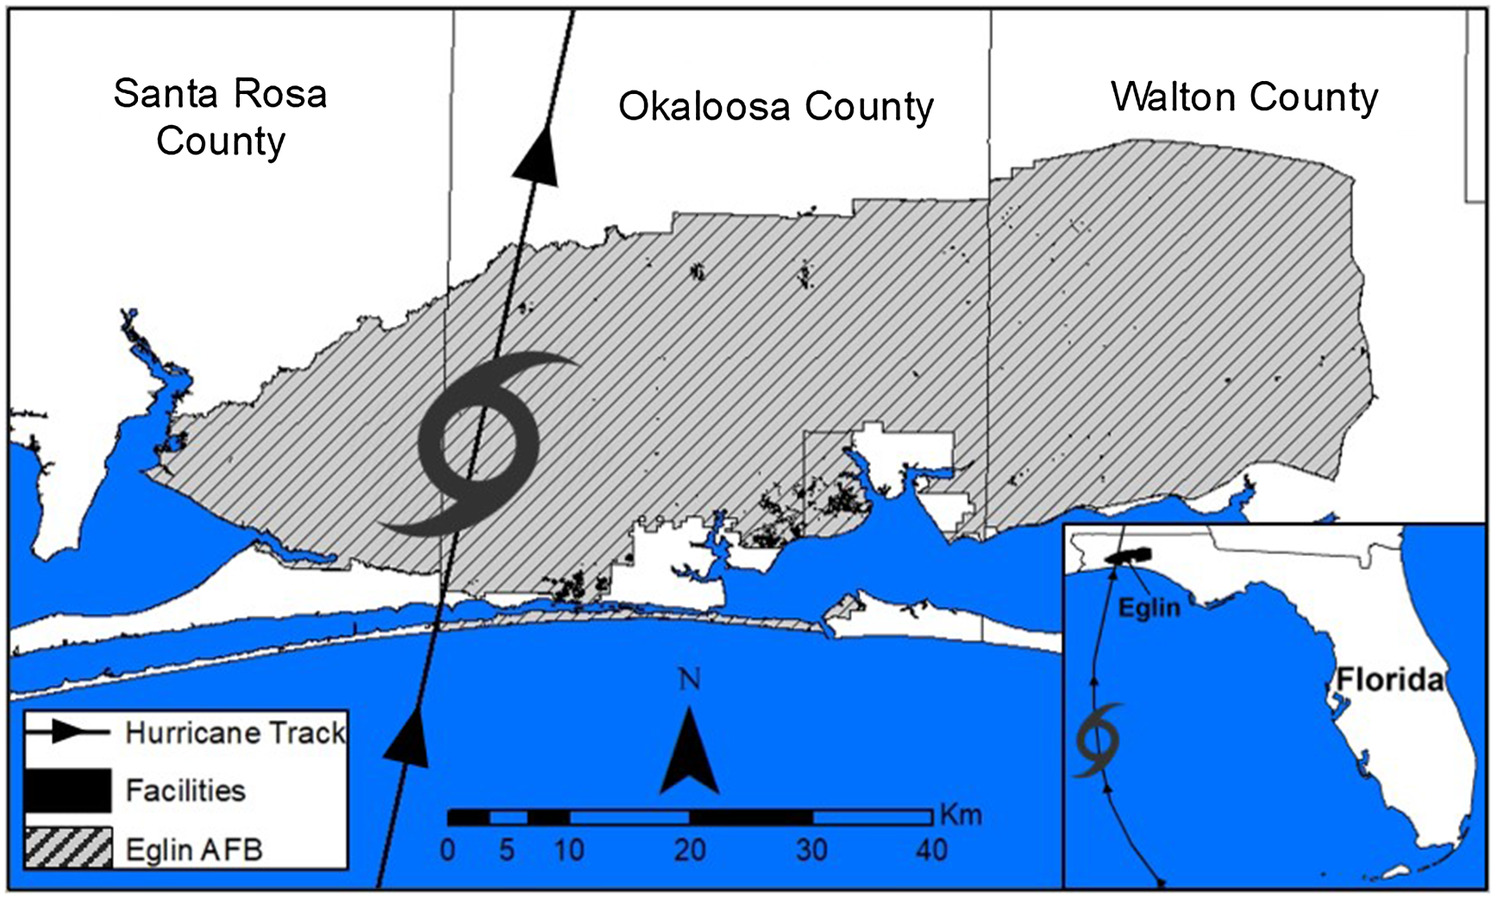
Prior assessments of Eglin AFB’s vulnerability to TC activity determined that there is a high likelihood of a worst-case hurricane event occurring by the end of the century as determined by analysis of historical hurricanes occurring within 150 km (93 mi) of Eglin AFB from 1851 to 2008. This storm, consisting of extreme 100-year return wind speeds, has the potential to cause severe damage to the installation. The total economic impact was estimated to be $664 million (2020 USD) in damage and revenue loss to residential and commercial buildings without considering specific government facilities (Scheitlin et al. 2011). Solely due to increasing sea-surface temperatures (SST), wind damages were estimated to be 36% greater at Eglin AFB by the end of the century for the 100-year event (Elsner et al. 2011). Elsner et al.’s (2011) assessments were based on a trend analysis of SST using historical data, potentially yielding an underestimate of future damages due to climate nonstationarity. These assessments used Hazus-MH hurricane modeling software to simulate storms, translated along a manually defined track (Fig. 2), intended to maximize the destructive impact of winds. The model was formulated based on four profile parameters: translation speed, radius to maximum wind, wind speed, and central pressure. The storm made landfall on the western side of Eglin AFB before continuing inland (Scheitlin and Elsner 2010). These studies provided the basis for Hazus calibration, the hurricane profile, and defined track that is utilized within this study.
As this previous research showed, wind forces alone pose a significant threat to Eglin AFB, and infrastructure resiliency improvements would reduce this risk. However, the lack of geospatial data on storm intensities makes resiliency adaptation difficult for decision makers to prioritize infrastructure maintenance and improvements within budgetary limitations. Although analyses of Eglin AFB’s vulnerability to hurricane-force winds are extensive, there is room for more robust and comprehensive damage assessments. Specifically, this study focuses on the facility-level and models damage risk stemming from interconnected wind intensities and storm surge inundation simulated through multiple climate change–intensified storms. Geospatial analysis of Eglin AFB’s impact by both wind intensities and storm surge inundations advances the understanding of holistic threat at the facility level that the installation faces, allowing for robust decision making to be done in terms of prioritization and identification of building resiliency adaptation signals.
Hazus-MH Models
Hazus is a geographic analysis tool developed by FEMA to simulate and analyze extreme weather event likelihood, impact, and regional recovery for emergency management purposes. Although multiple storm simulation models exist, many of these tools are not open-source and may require specialized training to operate. For use and uptake by DoD and coastal community planners, models should be available at low to no cost and produce interpretable and actionable results. Aside from the necessary addition of ArcMap, which is a tool most planners and community engineers have available, Hazus satisfies these requirements. Additionally, training and technical manuals are regularly updated and provided by FEMA, including reach-back support. Hazus can perform detailed modeling of extreme weather events (earthquakes, floods, hurricanes, and tsunamis) and can be coupled with census and topographic data to produce various desired outputs.
Hazus has been widely used to model extreme weather event intensities and impact simulations (McGrath et al. 2015; Pei et al. 2018), and the results have been found to closely replicate artificial wind tunnels, small-scale flooding models, and real-world events (Vickery et al. 2006, 2009; Elsner et al. 2011). Hazus hurricane and flood modeling software were used in this study to produce the damage estimates and storm intensities of both wind fields and storm surge inundation heights at Eglin AFB.
Hurricane Model
Hazus hurricane models can be operated in many modes, simulating manually defined, historical, or probabilistic hurricane events for a region of interest. The region of interest is customizable and can be as small as a single census tract. For Eglin AFB, the hurricane parameters from Scheitlin et al. (2011) were used to calibrate Hazus before expanding the analysis to the multihazard domain. To calibrate the model, we used the parameters from Scheitlin et al. (2011), including wind speed and pressure along multiple points of the storm paths, verifying landfall wind speeds and expected damages. The hurricane wind analysis outputs were used to determine wind intensities experienced by each census tract, which then served as inputs for the storm surge analysis, ultimately producing the multithreat damage estimation. Hazus utilizes fragility curves for different building construction types, including material and building height, and occupancy categories to assess damages of facilities. A complete description of the hurricane wind modeling process can be found in Section 4.2 of the Hazus Hurricane Model User Guidance (FEMA 2018b).
Flood Model
Coastal surge analysis produced by the hurricane models were incorporated into Hazus flood models to produce combined wind and surge intensities, and damage estimates. Regional topographic digital elevation model (DEM) data were first obtained for Eglin AFB from the US Geological Survey (USGS) National Map at the arc-second interval to accomplish the storm surge analysis. Next, a coastal surge analysis consisting of both a surge elevation grid, as determined by the National Oceanic and Atmospheric Administration’s (NOAA) Sea, Lake, and Overland Surges from Hurricanes (SLOSH) model and a significant wave height grid using a Simulating Waves Nearshore (SWAN) model were run. This surge analysis was performed for each climate change scenario across the threat horizons. Floodplains for each scenario were then delineated from the SLOSH and SWAN models, completing the Hazus surge flooding analysis.
Food depth-damage curves were used to assess expected damages for buildings. Hazus used the analysis results to calculate the combined wind and storm surge loss estimates for each scenario. An internal algorithm within Hazus combines the flood and wind damages to avoid double counting and exceeding the facility replacement cost maximum. The resolution of the coastal surge analysis is at the 30 m scale. We recognize that surge damage is very sensitive to resolution, and higher resolution models could provide greater detail. However, we elected to stay with the Hazus framework due to its algorithms for merging wind and flood damages. A complete description of the flooding model process can be found in the Hazus Flood Model User Guidance, specifically Section 4.4.2 (FEMA 2018a).
Climate Change Scenario Inputs
Sea-Level Rise
Storm surge is widely accepted as the most lethal and costly aspect of TCs, and estimates suggest it is responsible for 60% of the $36 billion annual economic loss to residential and commercial sectors in the US (CBO 2019). It is projected that high-tide conditions combined with sea-level rise (SLR) alone will produce regular flooding events for coastal locations that exceed contemporary storm surge extremes, referred to as recurrent or nuisance flooding (Moftakhari et al. 2017; Taherkhani et al. 2020). Scheitlin et al. (2011) omitted the impact of storm surge from damage estimates for Eglin AFB, likely because storm surge has not traditionally been a threat due to its inland geographical location, elevation, and the protection provided by natural barriers. However, it remains unclear whether these attributes will be overcome by intensified storm surge when coupled with climate change-informed expectations for SLR (Hall et al. 2016; Sweet et al. 2017).
Although the uncertainty associated with regional SLR projections vary, several agencies have produced comprehensive forecast predictions for the remainder of the century, such as NOAA. For DoD’s coastal installations, the US Strategic Environmental Research and Development Program (SERDP) evaluates and forecasts SLR potential at military installations, using a wide variety of climate change models and tools. SERDP’s Regionalized Sea Level Change and Extreme Water Level Scenarios tool generates five possible SLR scenarios based on NOAA data and Representative Concentration Pathway (RCP) greenhouse gas accumulation scenarios. Using the SERDP tool for Eglin AFB, the most conservative of these scenarios, labeled Lowest, estimated that SLR will only increase 0.3 m (1 ft) by the end of the century. The most extreme scenario, Highest, predicted SLR could rise as much as 2.3 m (7.5 ft). SLR values were used as inputs in the Hazus models at each threat horizon and accounted for each scenario produced by SERDP.
Tide Conditions
Sea-level rise is not the only hydrologic parameter that affects storm surge inundation. Tidal conditions impact wave behavior and during a TC can intensify storm surge and produce a storm tide. Storm tide–influenced floods have consistently caused damages exceeding $1 billion (Smith and Katz 2013) and account for approximately 50% of fatalities during TC events (Rappaport 2014). To further replicate the worst-case conditions for the simulated storms, high-tide levels were added to SLR estimates at each threat horizon. Previous 5-year high-tide averages were taken for the region from the Pensacola, Florida, monitoring station (Station 8729840), the closest available station to Eglin AFB (NOAA 2020). Tide conditions were taken during August through October, which corresponds to the Atlantic’s peak hurricane season period. This resulted in an MSL baseline of 0.55 m (1.8 ft).
Wind Strength
The exact effect of climate change on TC wind intensities is not fully understood (Walsh et al. 2016). Several studies have been conducted with respect to evaluating TC intensity change due to singular influences, such as SST and global temperature rise (Bhatia et al. 2018; Fraza and Elsner 2015; Knutson 2020). Expert opinions on end-of-century predictions for TC wind intensity are mixed, although the consensus is that major TC wind intensities will be greater than or equal to contemporary values (Cui and Caracoglia 2016; Fraza et al. 2016; Villarini and Vecchi 2013). Research performed on evaluating TC maximum intensity in the North Atlantic basin due to SST sensitivity predicted that a 1°C change might result in 10.7 kts () to 13.6 kts () higher wind speeds (Strazzo et al. 2016). Additional forecasts suggest TCs intensity increases of 1%–10% for every 2°C global temperature change is likely (Knutson 2020). Combining this range for TC intensity increases with global temperature projections ranging from 1°C to 5°C throughout the end of the century (O’Neill et al. 2016) create a potential range of TC wind intensity increase of 1%–30%, which falls within the broad range of wind intensity increase expectations (Bhatia et al. 2018; Strazzo et al. 2016).
Wind field multipliers for the 2100 threat horizon intensities were then derived from this range to produce the simulated TC wind strengths at Eglin AFB for the five climate change scenarios. End-of-century wind field multiplier values ranged at 5% increments from a 1.05 multiplier for the Lowest scenario, representing a 1°C change, to upward of 1.25 for the Highest scenario. It was assumed that wind intensity increases will follow an exponential trend throughout the century, like SLR and SST, due to the positive correlation between wind and temperature (Michaels et al. 2006; Strazzo et al. 2013). Wind intensity multiplier values, along with SLR and tide heights, are given for all climate scenarios and threat horizons in Table 1.
| Climate scenario | Threat horizon | ||||||
|---|---|---|---|---|---|---|---|
| 2020 | 2035 | 2065 | 2100 | ||||
| MSL (m) | Wind multiplier (%) | SLR (m) | Wind multiplier (%) | SLR (m) | Wind multiplier (%) | SLR (m) | |
| Lowest | 0.55 | 1.002 | 0.18 | 1.02 | 0.18 | 1.05 | 0.30 |
| Low | 1.004 | 0.18 | 1.03 | 0.30 | 1.10 | 0.58 | |
| Moderate | 1.005 | 0.30 | 1.05 | 0.49 | 1.15 | 1.10 | |
| High | 1.007 | 0.30 | 1.06 | 0.70 | 1.20 | 1.68 | |
| Highest | 1.009 | 0.40 | 1.08 | 0.98 | 1.25 | 2.29 | |
Wind fields are not singular values, but they are multiplied to all coordinate points through the storm track. Initial sea levels used for surge analysis consisted of SLR values added to the baseline, high tide MSL. Additionally, because wind intensity is an input of surge analysis, the adjusted wind input was used in each Hazus simulation.2.5 Regional GIS Facility Data.
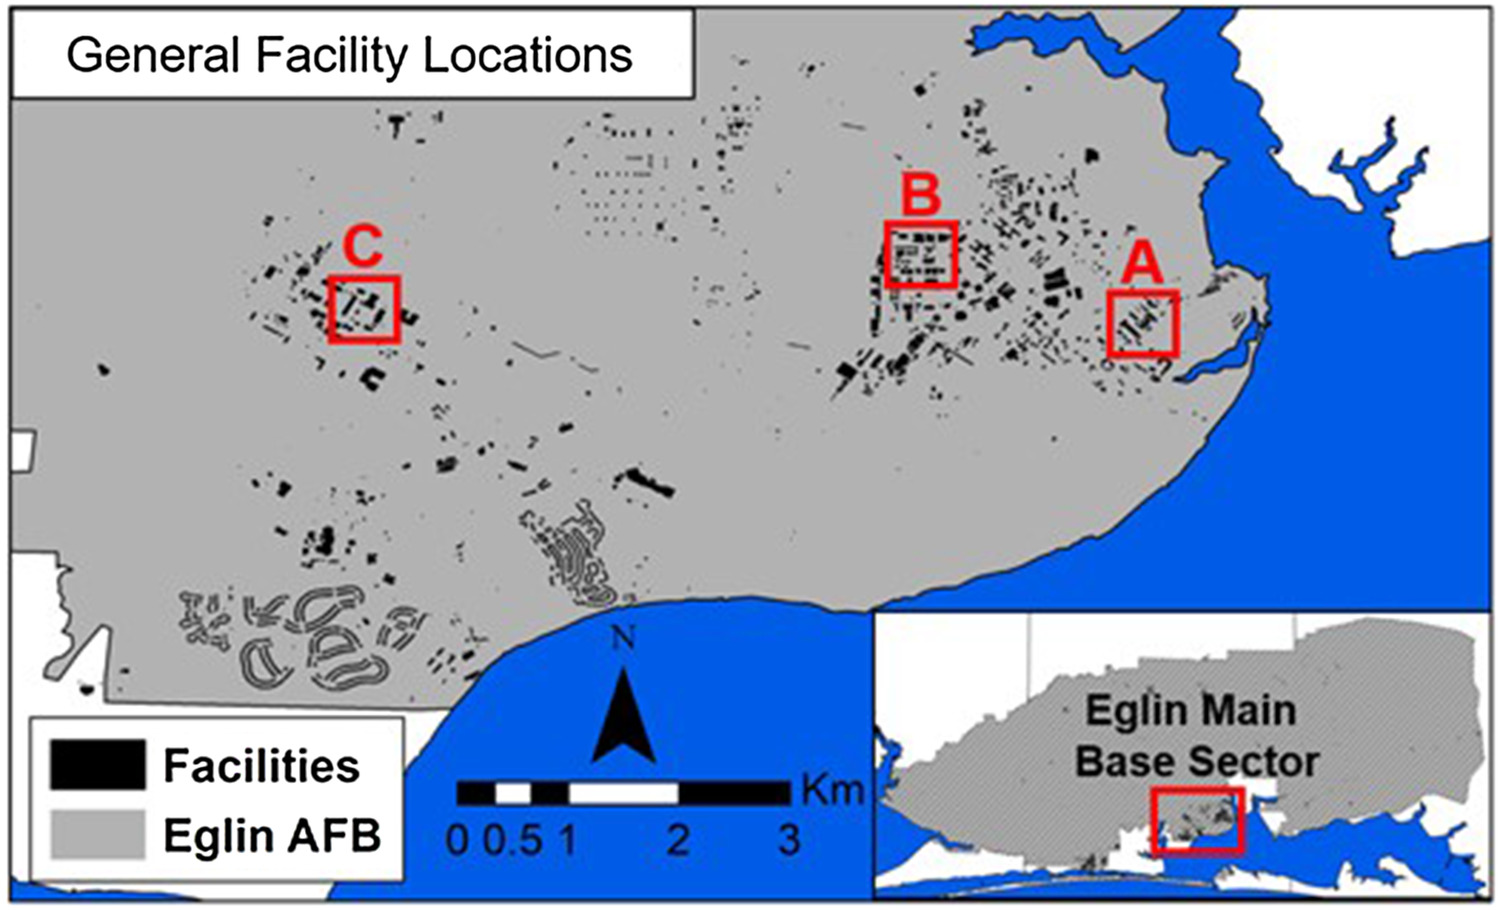
GIS data produced by Hazus for the wind field intensities and storm surge inundation heights were overlaid with Eglin facility data in ArcMap version 10.7.1 to extract hazard intensity measures to the facility-level. Eglin facility data were obtained from the Air Force GeoBase GIS database, which contains specific geographic shapefile polygons, including size, importance to Eglin operations, replacement cost, and location. As expected, most facilities (44.6%) are in the main base sector (Fig. 3), which is equivalent to a community’s downtown. Due to security requirements, three generalized facilities are discussed here to show the effect of simulated hurricane impacts at the facility-level, across the threat horizons. These buildings, referred to as Facilities A, B, and C, were purposefully chosen to represent the diversity in functions, replacement costs, and mission importance of facilities within Eglin. Furthermore, each facility was selected from different locations around the installation (Fig. 3) to illustrate the geospatial effects of storm intensities within even a relatively small area and how they can inform specific infrastructure adaptation decisions.
Results
Wind Intensity
Hazus wind outputs varied due to the variation in climate projections used to inform the wind field multipliers across the threat horizons. For the 2020 baseline storm, the maximum wind speed () was determined to be 113 kts () at landfall and decreased to 108 kts () as the storm moved inland, making it resemble a Category 3 hurricane. At the 2035 threat horizon, was relatively unchanged, although by 2065, it rose to 118 kts (), which elevated the hurricane to a Category 4. At 2100, rises to 130 kts (), but the range of intensity potential is the most diverse of the threat horizons, with an interquartile range of 123 kts () to 136 kts (). Although variance increases with each threat horizon, which reflects model and input uncertainty, the general results suggest that the expected TC event would transition from a Category 3 hurricane to a severe Category 4 by the end of the century at the median (Fig. 4).
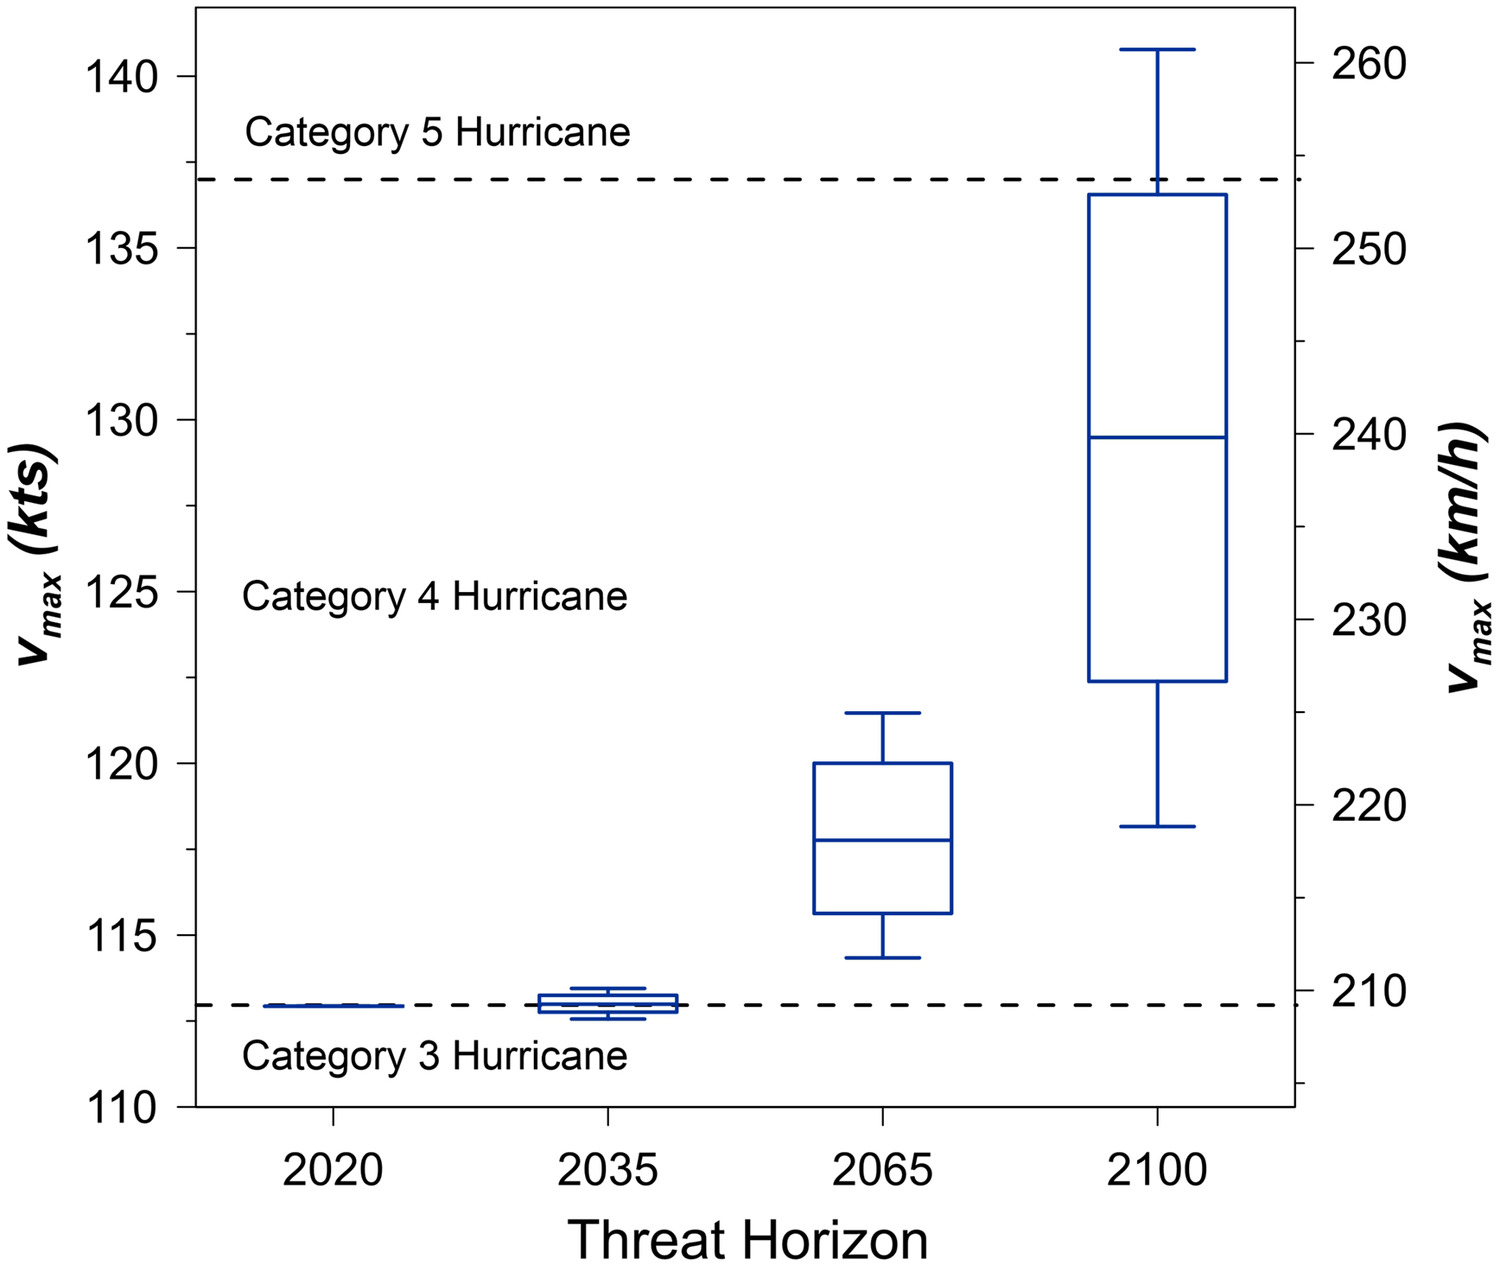
Here, refers to the highest wind speed measured at any point across the study region. Predominantly, this location was at the shoreline near the storm’s landfall when wind speeds began to drop as the storm moved inland, but this was not uniform across all storm simulations. The uncertainty in is largely due to climate scenarios. Because an identical path was used for all storm simulations, the spatial variation of was negligible. Landfall intensities increased consistently; the maximum potential at any given threat horizon was less than the 25th percentile value of subsequent threat horizon.
Storm Surge
Storm surge inundations produced by the Hazus models show how SLR and tidal conditions affect the number of facilities threatened over the century. As mentioned previously, storm surge has not historically been a significant concern for Eglin due to its geographic properties. For the 2020 hurricane, storm surge produced at high tide is 5.7 m (18.7 ft) for some coastal regions of the base, but these areas are largely uninhabited and resulted in little to no facility damage. On the main base, where the bulk of buildings are located, storm surge heights were 1.8 m (6 ft) to 2.7 m (9 ft) and threatened a small portion of buildings (). As the century progresses, storm surge potential increases across most modeling scenarios (Fig. 5).
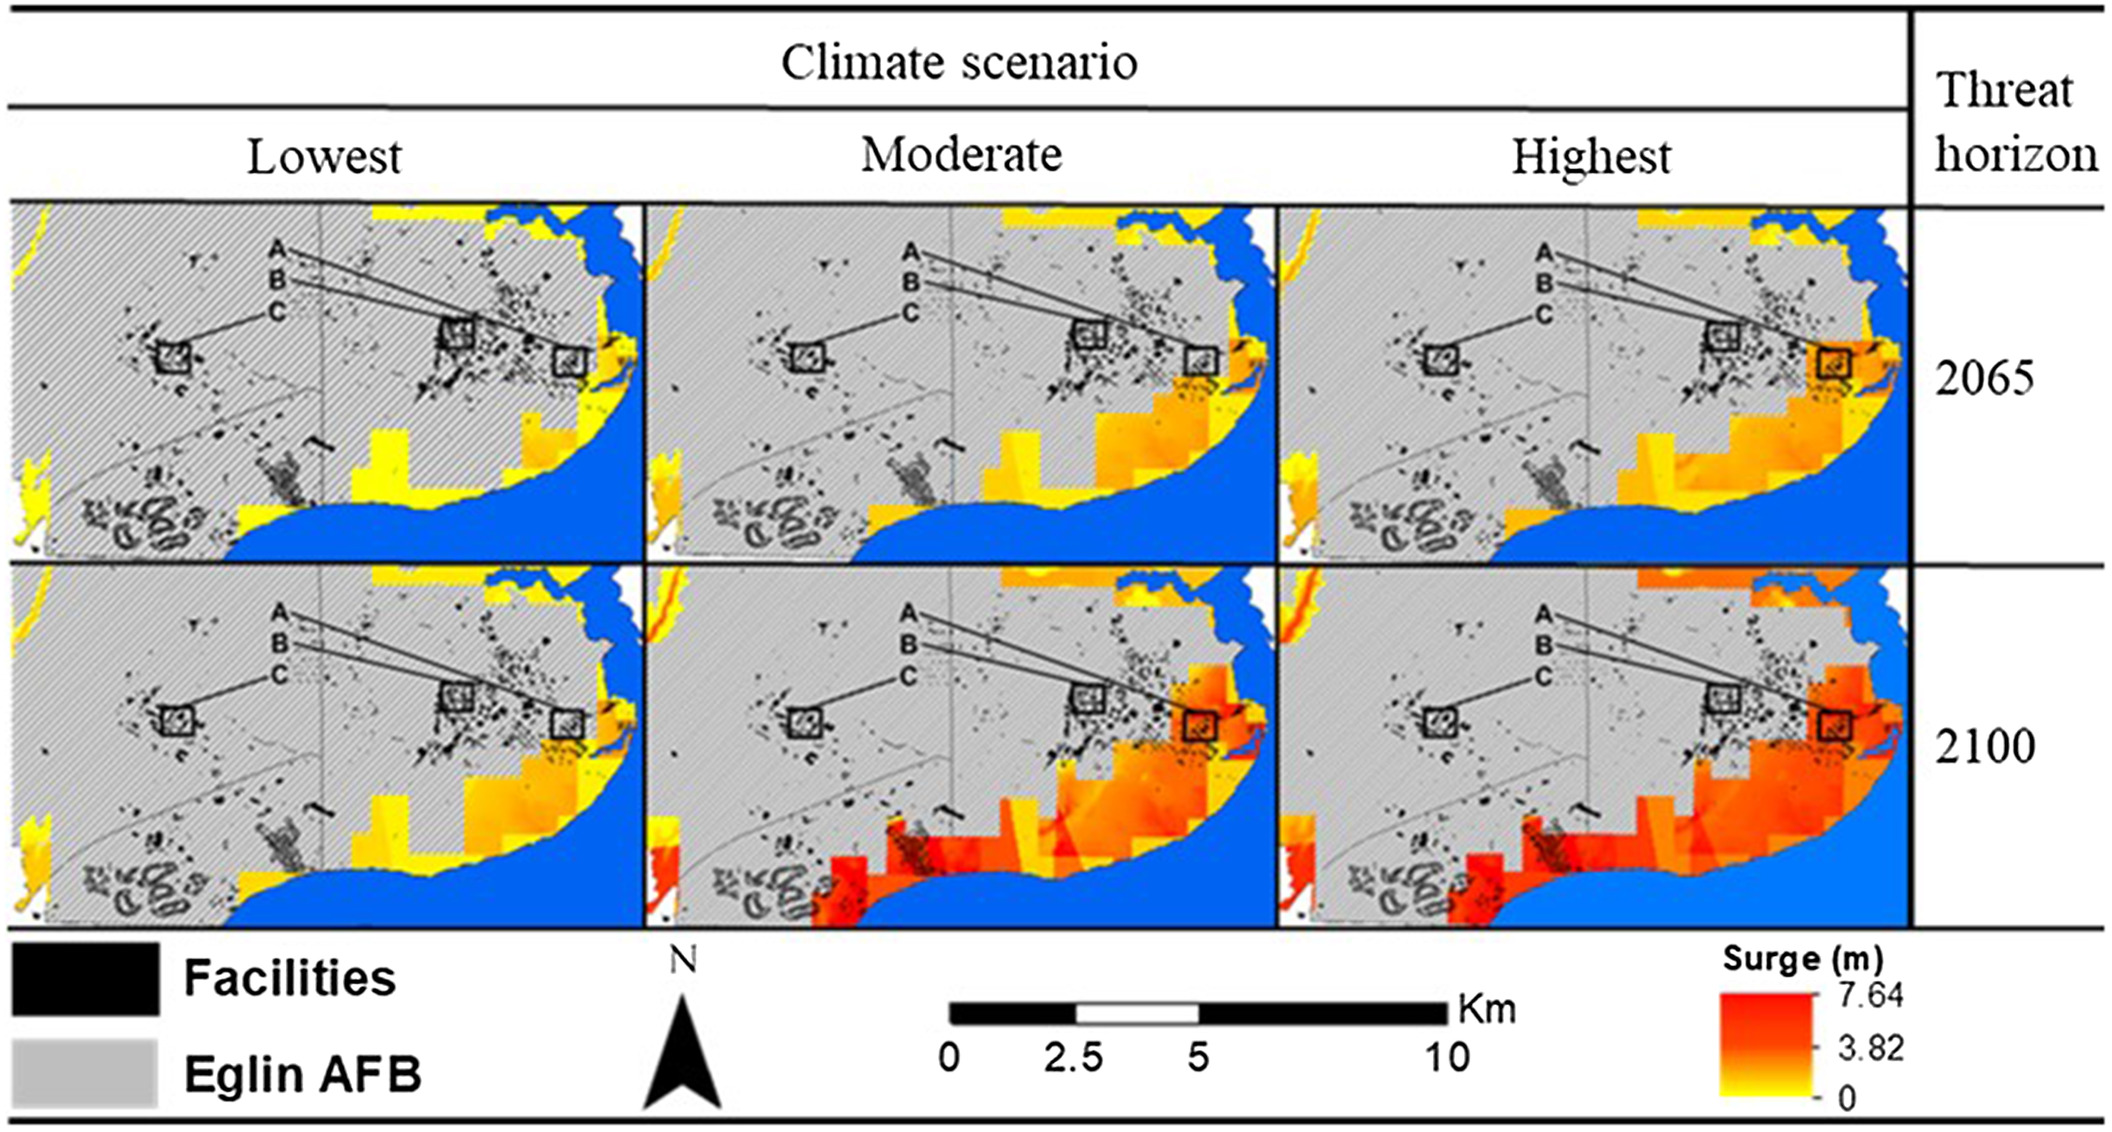
Although 2035 scenarios only produce a small [ (1.6 ft)] increase in storm surge heights, the 2065 and 2100 scenarios produced drastically higher inundations. At the 2065 threat horizon, the increase in storm surge to Eglin AFB ranged from 1 m (3.3 ft) in the Lowest scenario to 2.6 m (8.6 ft) in the Highest scenario, threatening 479 to 632 facilities, respectively. For 2100, storm surge increase ranges from 1.6 m (5.3 ft) to 4.9 m (16 ft) between Lowest and Highest scenarios and threatened 530–837 facilities, respectively. The total number of facilities for all of Eglin AFB affected by storm surge inundation rises from 419 (12.9% of total facilities) in 2020 to 837 (25.8%) by 2100 for the Highest climate change scenario. This means that the number of surge-affected buildings could double between 2020 and 2100. Surge maps for climate-intensified storms like this can be utilized to identify flooding zones and highlight facilities that are susceptible to future storm surge inundations for adaptation planning.
Multihazard Damage Estimates
The simulations produced a variety of loss estimates across the threat horizons. Conducting a two-tailed -distribution analysis on the outputs illustrates that Eglin AFB faces facility damages of $1.8 billion [($2.45 billion, $1.16 billion) = 90% confidence interval (CI)] for a storm occurring by 2100 (Fig. 6). This is a 133% increase of potential loss [(216%, 50%), 90% CI] from the $773 million damage potential of the 2020 baseline storm. These values are based on the census tract estimates of damage cost from Hazus and do not use the actual building replacement value of the installation. A comparison of damage by threat showed that wind forces cause the most significant portion of damage. Although storm surge, which is influenced by the combination of SLR and tide, is less destructive than wind; it accounts for 35% of storm damage in 2020 and 20% in 2100.
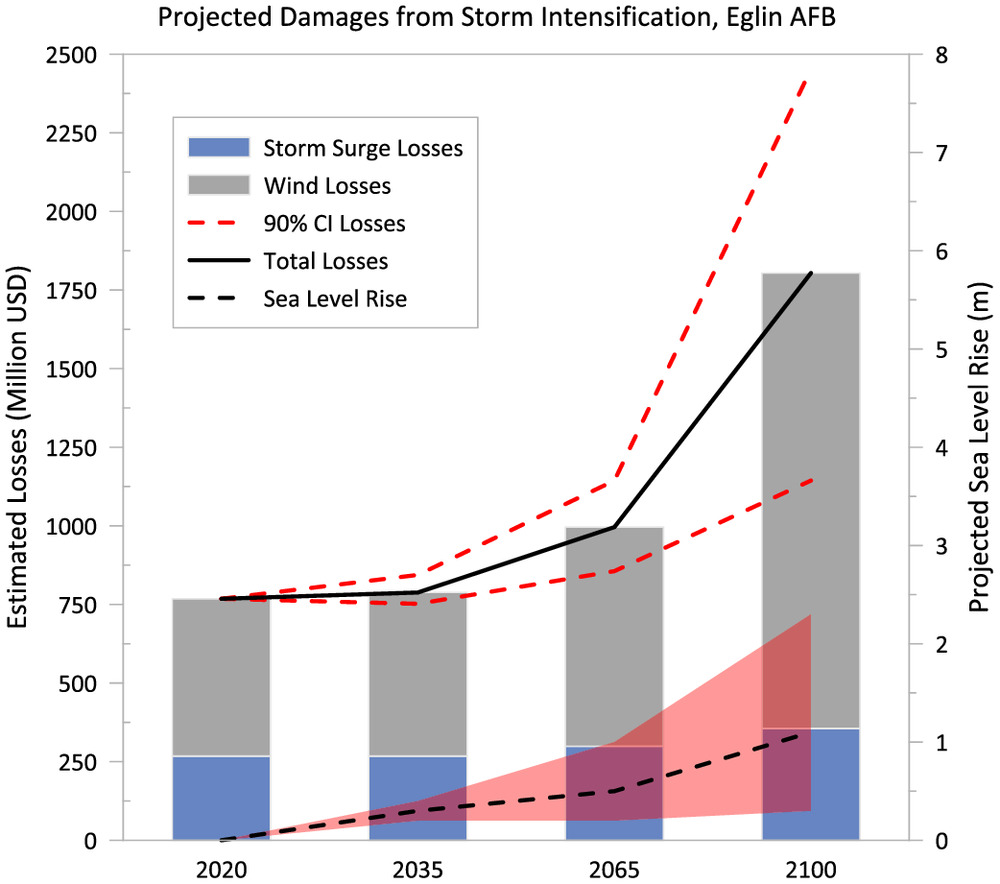
The storm simulated is classified as wind-driven, which is an artifact of the Scheitlin et al. (2011) hurricane profile development. As such, the escalation in damage from wind compared with surge is not unexpected. Damage estimates follow an exponential curve across the threat horizons, which aligns with storm parameter intensification. This means that although increases in loss potential continuously occur throughout the threat horizons, damage potential due to climate change will be comparatively larger as the century progresses. Because estimates were only taken at the threat horizons, an exponential fit was used to approximate values between threat horizons.
Eglin AFB Facility Impact
As expected, impact at the facility level varied by location and across threat horizons for the simulated hurricanes (Table 2). Facilities A and B experience identical wind intensities across the threat horizons, whereas Facility C experiences slightly higher intensities. This is due to Facility C being located west of A and B and closer to the storm track. However, Facility A will be exposed to storm surge potential by 2065, whereas Facilities B and C will not be threatened by storm surge because they are located inland.
| Facility | Facility type | Importance | Threat horizon | Climate change scenario | |||||||
|---|---|---|---|---|---|---|---|---|---|---|---|
| 2020 | 2035 | 2065 | 2100 | ||||||||
| Wind km/h (kts) | Storm surge (m) | Wind km/h (kts) | Storm surge (m) | Wind km/h (kts) | Storm surge (m) | Wind km/h (kts) | Storm surge (m) | ||||
| A | Community support | Low | 198 (107) | 0 | 200 (108) | 0 | 204 (110) | 0 | 207 (112) | 0 | Lowest |
| 200 (108) | 204 (110) | 0 | 219 (118) | 1.2 | Low | ||||||
| 202 (109) | 207 (112) | 0 | 228 (123) | 2.0 | Moderate | ||||||
| 202 (109) | 209 (113) | 1.8 | 241 (130) | 3.7 | High | ||||||
| 202 (109) | 213 (115) | 2.9 | 252 (136) | 4.6 | Highest | ||||||
| B | Office | Moderate | 200 (107) | 0 | 200 (108) | 0 | 204 (110) | 0 | 207 (112) | 0 | Lowest |
| 200 (108) | 204 (110) | 219 (118) | Low | ||||||||
| 202 (109) | 207 (112) | 228 (123) | Moderate | ||||||||
| 202 (109) | 209 (113) | 241 (130) | High | ||||||||
| 202 (109) | 213 (115) | 252 (136) | Highest | ||||||||
| C | Operational | High | 200 (108) | 0 | 200 (108) | 0 | 206 (111) | 0 | 209 (113) | 0 | Lowest |
| 202 (109) | 206 (111) | 219 (118) | Low | ||||||||
| 202 (109) | 207 (112) | 230 (124) | Moderate | ||||||||
| 202 (109) | 211 (114) | 241 (130) | High | ||||||||
| 204 (110) | 215 (116) | 253 (137) | Highest | ||||||||
The use of these climate signals allows for asset managers to make targeted, informed decisions to achieve infrastructure resiliency goals. For example, one such targeted decision would be to invest in Facility C wind tolerance in the near term, between 2020 and 2035, because it is sustaining the highest intensity and has a high importance. Investment could then be deferred to Facility A for surge protection until between 2035 and 2065 because it is unlikely to be affected by surge until then based on this scenario evaluated.
Because exposures are not uniform, facilities should be adapted based on their location and importance. For example, facilities along the southern coast of Eglin AFB experience substantially higher wind and surge intensities than the main base sector facilities described in this article. It is worth noting that there are significant uncertainties associated with wind speeds in a hurricane, and therefore minor changes listed in Table 2 are not necessarily statistically significant. These facility decisions can be evaluated within a dynamic adaptation policy pathways (DAPPs) framework to use climate signals as a way to triggers specific adaptation efforts (Haasnoot et al. 2013; Ramm et al. 2018; Lawrence and Hasnoot 2017; Lawrence et al. 2018, 2019).
Discussion
Fiscal Impact of Storms
The Hazus damage estimates indicated that Eglin AFB’s risk to major hurricane events will increase exponentially over time as climate change affects storm intensities. Wind intensities cause the preponderance of damage, and its significance increases over time. Storm surge, although not as detrimental as wind, will still cause significant damage to facilities. This threat also increased across the threat horizons for all facilities, and it should be considered in future resiliency improvement decisions and modeling scenarios. The fiscal threat from the simulated hurricanes to the installation is alarming when considering the damage estimates are based upon contemporary facility replacement costs. After such a widespread natural disaster, construction and material costs are likely to increase due to an abundant demand to repair Eglin AFB and surrounding municipal areas straining available resources and labor pools (Chang et al. 2012; Rouhanizadeh and Kermanshachi 2020). This could lead to a significant increase in recovery costs and time frame for Eglin as facilities are brought back to present service levels or adapted states.
Additionally, Hazus produces damage estimates based on available census data of general building stock for Eglin AFB. As was the case with the original threat assessment (Scheitlin et al. 2011), it did not include specific government facility data in its damage calculations. As such, the actual risk to military buildings at Eglin AFB from the simulated hurricanes will be different, and likely larger, than the damage estimates determined by Hazus. In comparison, the census tract general building stock consisted of 11,279 facilities with a $3.6 billion replacement cost (not damage-based). Eglin AFB real property data procured from USAF GeoBase consists of 3,249 military facilities with a $9 billion replacement cost. This translates to a 250% facility replacement cost increase when comparing military facilities with residential and commercial buildings, despite having 29% of the facilities. The interpolation of damage potential to military facilities will not be the same as residential and commercial facilities due to differences in locations and building construction types. Regardless of true damage potential, the difference between military and census building stock data sets indicates that losses to military facilities would be significantly higher, potentially two and a half times greater, than those estimated by Hazus for the census building stock across the threat horizons.
Future Intensities and Facility Adaptation
As reflected in the increase in damage potential to Eglin AFB, the storm intensities increase on an exponential scale. Wind field projections suggest that future TC events at Eglin AFB will likely produce higher wind speeds than contemporary extremes throughout the century. These winds, combined with SLR and tidal conditions, will likewise result in widespread flooding throughout the region as storm surge inundations increase. In reflection on how coastal communities would adapt to an event occurrence in near-future years (a TC occurring around 2035), design standards and flood protection measures that may have been exceeded will most likely be updated to more stringent design standards (Simmons et al. 2019).
Although this practice is common and would reduce the risk that an identical TC would have, intensity projections showed that such standard would likely again be exceeded if a TC were to occur in subsequent years. Therefore, adopting a singular set of building codes and standards that do not include climate projections and asset service life will be insufficient in TC threat elimination. Additionally, designing to worst-case conditions—those occurring at the 2100 maximum extremes—would result in high adaptation costs, both in terms of initial construction and recurring maintenance.
As part of this adaptation of facilities, facility importance could be considered. For example, there could be some threshold of risk that is acceptable to low- or moderate-importance facilities. Similarly, we could generalize this beyond an Air Force installation to a community, where emergency response buildings or community shelters could be held to a higher design standard as opposed to other facilities that could tolerate higher risk levels. To mitigate the climate change–informed threat that TC presents, temporal and spatial analysis of expected storms scaled to the facility level is needed. This allows decision makers to make informed decisions based upon risk tolerances and existing limitations. Additionally, preventative adaptation avoids postevent recovery cost escalations that are likely to occur after a major hurricane event, thereby further reducing the cost of recovery for Eglin AFB.
Geospatial Facility Analysis
Traditionally, building importance or replacement cost logic is used to prioritize maintenance and improvement funding. Such logic puts operational buildings to receive the bulk of funding whereas lower importance facilities, such as recreation or auxiliary structures, are lower priority and less likely to receive project funding. Using such logic to determine resiliency prioritization would mean that Facility C is the most competitive to receive project funding, followed by Facility B, and lastly Facility A if adaptation measures are pursued. However, the facility climate signals indicate that Facility C risk is comparatively low in terms of intensity increase throughout the century, with increasing drastically between 2065 and 2100. Conversely, Facility A is the most vulnerable to storm damage due to the combined threat of wind and storm surge flooding. Using these climate signals highlight when hurricane parameters exceed design standards for the facilities. Based upon this concept, it would be beneficial for Facility A to be made resilient to storm surge by 2065. Additionally, the wind design speed for Facility A should be checked against these projections to determine when a threshold is likely to be exceeded. Facilities B and C could be made resilient to wind intensities by 2065 using a similar design standard comparison and, according to this modeling effort, need not be made resilient to storm surge.
This level of analysis can be expanded to all facilities at a coastal region to inform infrastructure sustainment plans and develop project implementation timelines. This allows asset managers to know which facilities should be made resilient and at what time frame adaptation is needed against likely storm intensities. These dynamic approaches to adaptation will allow for threatened facilities to be made resilient against future TC potentials at the appropriate time before design standards are exceeded, while understanding limited resources for facility improvement.
Modeling Limitations
The hurricane parameters and path simulated in this work only represent one possible TC event across the threat horizons. Given the complex and ever-changing nature of TCs, storms can develop various behaviors and the true magnitude of future event parameters may vary from the wind-dominant storms presented here. For this research, rainfall intensities generated by TCs were not considered. Existing research suggests that rainfall is and will continue to be a major factor when coupled with wind intensity and storm surge during TCs. Consistent with other climate variables, rainfall intensification is expected to increase throughout the century (Feldmann et al. 2019). A heavy rainfall–dominated hurricane could generate higher flood levels and cause widespread destruction to buildings at Eglin AFB, possibly to facilities located away from the coastline, which are traditionally protected from storm surge.
Such a storm would be similar to Hurricane Harvey, which notably affected Houston, Texas, in 2017, with 1,000 mm (39 in.) of precipitation, causing widespread flooding to the landlocked city (Blake and Zelinsky 2018). Alternatively, a slower moving storm would generate prolonged sustained wind fields that could drastically change the damage probability functions for specific facility construction types used in Hazus, resulting in different damage estimations. Additionally, only wind speed and SLR were changed across the threat horizons for the simulated storms. Other storm profile parameters, such as translation speed, radius to maximum wind speed, and pressure were kept constant between all storms. Existing research suggests that this will not be the case and that these parameters will likely change in the future because several are known to be affected by climate change (Liu et al. 2019; Kossin 2018). A more robust sensitivity analysis would be needed to capture these factors, which is outside the scope of this study.
Additionally, the previously conducted assessment concluded that the simulated storm used represented a probabilistic worst-case event for the Eglin region, based upon historical aggregation (Scheitlin et al. 2011). However, hurricane impacts are affected by multiple factors including tide, size, landing position, and so on. Hurricane activity along the Florida Panhandle has intensified since the 2011 assessment. For example, Hurricane Michael, which made landfall at Tyndall Air Force Base in 2018, only 105 km (65 mi) southeast of Eglin AFB, generated maximum sustained wind speeds exceeding 139 kts (), and it produced 4.3 m (14 ft) of storm surge above ground level, resulting in $26 billion in damages (Beven et al. 2019). Although Michael could be considered an observed worst-case event for the Florida Panhandle, its conditions were not used here. Rather, the prior research (Scheitlin et al. 2011) simulated storm was kept as a baseline of comparison and expanded upon to highlight the effects that climate change could have on Eglin AFB hurricane risk. Future research should simulate and evaluate different trajectories of hurricanes to better understand and describe the probabilistic failure space of the individual facilities. A single track, as used in this study, provides a snapshot at one possibility, which can be used to promote understanding of the system, but it does not fully capture the variability associated with planning for and adapting to climate change in coastal environments.
In this article, we focused on identifying hazards to facilities and their probable ranges as the first step in a risk analysis. Due to the lack of government facility data, precise damage estimates for military installations cannot be accomplished with Hazus. Although replacement cost provides a rough comparison of damage potential, the risk to Eglin AFB’s military infrastructure as a function of both hazard probability and damage extent was not captured in this study. It is recommended that future research to military installations threatened by climate change and extreme weather events evaluate damage estimates and impact analysis, both at the base and infrastructure system-level, with military-specific data. The opportunities of such efforts would allow for specific facility improvements to be considered and analyze their practicality through a benefit-cost analysis from various resiliency strategy perspectives. However, such specific data were not available for the region at the time of the study.
Conclusion
This research demonstrated a coupled multihazard modeling framework that can be used to develop climate signals for future TCs, refined to the facility level. These signals can inform decision making regarding which facilities face the greatest threat and prioritize when buildings should be made resilient to future conditions. Although the hurricane profile used only represents one type of TC the defined study region could experience, the message is clear: the impact of climate change on storm parameters results in higher intensities and damage potential from future events than contemporary values. Moreover, this increase in TC intensities will likely exceed building codes upon which facilities in coastal regions were constructed, resulting in increased losses and widespread damage. Recent hurricane activity indicates that cities in the US possibly face a far greater threat from major TC events than this or previous research suggests.
To mitigate this increasing threat, coastal municipalities must adopt actionable adaptation methods and strategies into infrastructure sustainment and development plans. Just as there is no singular standard that can be implemented to avoid losses from all possible future TCs, no singular adaptation strategy should be considered. A range of infrastructure adaptation portfolios should be created to allow for alternative resiliency options. These options can be optimized by balancing decision-maker risk tolerances, fiscal availability, and resource limitations factors. Performing infrastructure system-level damage assessments for coastal regions aids in bridging the gap for actionable research provided by climate scientists for coastal asset managers and future risk assessments. Such assessments should consider geospatial storm damage parameters, both temporally and spatially, to develop climate signals to provide the greatest reduction of risk through determining appropriate adaptation measures before future intensified TCs are realized. This research can be expanded to other coastal municipalities, provided adjustments are made for specific geographic properties and regional TC extremes.
Data Availability Statement
Some data, models, or code generated or used during the study are proprietary or confidential in nature and may only be provided with restrictions.
Tidal data used to determine the high-tide conditions for Eglin AFB were obtained from the open source NOAA Tides & Currents Pensacola, Florida, station page (it can be downloaded from https://tidesandcurrents.noaa.gov/waterlevels.html?id=872,984,0). Eglin AFB sea-level rise data was obtained from the SERDP Regionalized Sea Level Change & Extreme Water Level Scenarios website and are not publicly available due to DoD restrictions with sensitive military information. Access to the website can be requested from SERDP and require use of a user Common Access Card (CAC) at https://sealevelscenarios.serdp-estcp.org/Account/Login?ReturnUrl=%2F. Eglin AFB GIS facility data were obtained from the Air Force Geospatial Information Management System (AFGIMS) GeoBase data-library and are not publicly available due to DoD restrictions with military infrastructure information. Access to the data-library require a user CAC.
Acknowledgments
This work was supported using FEMA Hazus software and SERDP SLR prediction tools. All statistical analysis was performed using MATLAB and geospatial analysis was conducted using ArcMap with facility shapefiles procured from the Air Force GeoBase data-library. We thank all organizations and teams for putting together and allowing access use of these resources. We thank J. Elsner, K. Scheitlin, S. Lewers, J. Malmstadt, and T. Jagger for their exhaustive efforts in generating the original probabilistic hurricane profile at Eglin, creating the foundation upon which our research could be built. The authors thank the Air Force Civil Engineer Center for funding the research. The views expressed are those of the authors and do not necessarily reflect the official policy or position of the Department of the Air Force, the Department of Defense, or the US government.
References
Akerlof, K., E. W. Maibach, D. Fitzgerald, A. Y. Cedeno, and A. Neuman. 2013. “Do people ‘personally experience’ global warming, and if so how, and does it matter?” Global Environ. Change 23 (1): 81–91. https://doi.org/10.1016/j.gloenvcha.2012.07.006.
Bacmeister, J. T., K. A. Reed, C. Hannay, P. Lawrence, S. Bates, J. Truesdale, N. Rosenbloom, and M. Levy. 2016. “Projected changes in TC activity under future warming scenarios using a high-resolution climate model.” Clim. Change 146 (3): 547–560. https://doi.org/10.1007/s10584-016-1750-x.
Barbato, M., F. Petrini, V. U. Unnikrishnan, and M. Ciampoli. 2013. “Performance-based hurricane engineering (PBHE) framework.” Struct. Saf. 45 (Nov): 24–35. https://doi.org/10.1016/j.strusafe.2013.07.002.
Bender, M. A., T. R. Knutson, R. E. Tuleya, J. J. Sirutis, G. A. Vecchi, S. T. Garner, and I. M. Held. 2010. “Modeled impact of anthropogenic warming on the frequency of intense Atlantic hurricanes.” Science 327 (5964): 454–458.
Beven, J., R. Berg, and A. Hagen. 2019. TC report: Hurricane Michael (AL142018). Miami: National Hurricane Center.
Bhatia, K., G. Vecchi, H. Murakami, S. Underwood, and J. Kossin. 2018. “Projected response of tropical cyclone intensity and intensification in a global climate model.” J. Clim. 31 (20): 8281–8303. https://doi.org/10.1175/JCLI-D-17-0898.1.
Blake, E., and D. Zelinsky. 2018. TC report: Hurricane Harvey (AL092017). Miami: National Hurricane Center.
CBO (Congressional Budget Office). 2019. Expected costs of damages from hurricane winds and storm-related flooding. Washington, DC: United States Congress.
Chang, Y., S. Wilkinson, E. Seville, and R. Potangaroa. 2012. “Changes in resource need for post-disaster reconstruction: A longitudinal study in China.” Build. Res. Inf. 40 (3): 327–336. https://doi.org/10.1080/09613218.2012.684867.
Contento, A., H. Xu, and P. Gardoni. 2019. “Risk analysis for hurricanes accounting for the effects of climate change.” Chapter 2 in Climate adaptation engineering, edited by E. Bastidas-Arteage and M. G. Stewart, 39–72. Oxford, UK: Butterworth-Heinemann.
Crossett, K., B. Ache, P. Pacheco, and K. Haber. 2013. National coastal population report: Population trends from 1970 to 2020. Washington, DC: National Oceanic and Atmospheric Administration.
Cui, W., and L. Caracoglia. 2016. “Exploring hurricane wind speed along US Atlantic coast in warming climate and effects on predictions of structural damage and intervention costs.” Eng. Struct. 122 (Sep): 209–225. https://doi.org/10.1016/j.engstruct.2016.05.003.
Dehring, C. A., and M. Halek. 2013. “Coastal building codes and hurricane damage.” Land Econ. 89 (4): 597–613. https://doi.org/10.3368/le.89.4.597.
DoD (Department of Defense). 2018. Base structure report: Fiscal year 2018 baseline, a summary of the real property inventory data. Washington, DC: DoD.
Elsner, J., J. Kossin, and T. Jagger. 2008. “The increasing intensity of the strongest TCs.” Nature 455 (Sep): 92–95. https://doi.org/10.1038/nature07234.
Elsner, J., S. Lewers, J. Malmstadt, and T. Jagger. 2011. “Estimating contemporary and future wind-damage losses from hurricanes affecting Eglin Air Force Base, Florida.” J. Appl. Meteorol. Climatol. 50 (7): 1514–1526. https://doi.org/10.1175/2011JAMC2658.1.
Emanuel, K. A. 2013. “Downscaling CMIP5 climate models shows increased tropical cyclone activity over the 21st century.” Proc. Natl. Acad. Sci. U.S.A. 110 (30): 12219–12224.
Feldmann, M., K. Emanuel, L. Shu, and U. Lohmann. 2019. “Estimation of Atlantic TC rainfall frequency in the United States.” J. Appl. Meteorol. Climatol. 58 (8): 1853–1866. https://doi.org/10.1175/JAMC-D-19-0011.1.
FEMA. 2018a. Hazus flood model user guidance. Washington, DC: US Dept. of Homeland Security.
FEMA. 2018b. Hazus hurricane model user guidance. Washington, DC: US Dept. of Homeland Security.
Fraza, E., and J. B. Elsner. 2014. “A spatial climatology of North Atlantic hurricane intensity change.” Int. J. Climatol. 34 (9): 2918–2924. https://doi.org/10.1002/joc.3884.
Fraza, E., and J. B. Elsner. 2015. “A climatological study of the effect of sea-surface temperature on North Atlantic hurricane intensification.” Phys. Geogr. 36 (5): 395–407. https://doi.org/10.1080/02723646.2015.1066146.
Fraza, E., J. B. Elsner, and T. H. Jagger. 2016. “A space & time statistical climate model for hurricane intensification in the North Atlantic basin.” Adv. Stat. Climatol. Meteorol. Oceanogr. 2 (2): 105–114. https://doi.org/10.5194/ascmo-2-105-2016.
Haasnoot, M., J. H. Kwakkel, W. E. Walker, and J. Maat. 2013. “Dynamic adaptive policy pathways: A method for crafting robust decisions for a deeply uncertain world.” Global Environ. Change 23 (2): 485–498. https://doi.org/10.1016/j.gloenvcha.2012.12.006.
Hall, J. A., S. Gill, J. Obeysekera, W. Sweet, K. Knuuti, and J. Marburger. 2016. Regional sea level scenarios for coastal risk management: Managing the uncertainty of future sea level change and extreme water levels for Department of Defense coastal sites worldwide. Washington, DC: US Dept. of Defense.
Hauer, M., J. Evans, and D. Mishra. 2016. “Millions projected to be at risk from sea-level rise in the continental United States.” Nat. Clim. Change 6 (7): 691–695. https://doi.org/10.1038/nclimate2961.
Kappes, M. S., M. Keiler, K. von Elverfeldt, and T. Glade. 2012. “Challenges of analyzing multi-hazard risk: A review.” Nat. Hazards 64 (2): 1925–1958. https://doi.org/10.1007/s11069-012-0294-2.
Knutson, T., et al. 2020. “TCs and climate change assessment: Part II: Projected response to anthropogenic warming.” Bull. Am. Meteorol. Soc. 101 (3): E303–E322. https://doi.org/10.1175/BAMS-D-18-0194.1.
Kossin, J. 2018. “A global slowdown of tropical-cyclone translation speed.” Nature 558 (7708): 104–107. https://doi.org/10.1038/s41586-018-0158-3.
Kwakkel, J. H., W. E. Walker, and M. Haasnoot. 2016. “Coping with the wickedness of public policy problems: Approaches for decision making under deep uncertainty.” J. Water Resour. Plann. Manage. 142 (3): 01816001. https://doi.org/10.1061/(ASCE)WR.1943-5452.0000626.
Lawrence, J., R. Bell, P. Blackett, S. Stephens, and S. Allan. 2018. “National guidance for adapting to coastal hazards and sea-level rise: Anticipating change, when and how to change pathway.” Environ. Sci. Policy 82 (Apr): 100–107. https://doi.org/10.1016/j.envsci.2018.01.012.
Lawrence, J., R. Bell, and A. Stroombergen. 2019. “A hybrid process to address uncertainty and changing climate risk in coastal areas using dynamic adaptive pathways planning, multi-criteria decision analysis & real options analysis: A New Zealand application.” Sustainability 11 (2): 406. https://doi.org/10.3390/su11020406.
Lawrence, J., and M. Haasnoot. 2017. “What it took to catalyze uptake of dynamic adaptive pathways planning to address climate change uncertainty.” Environ. Sci. Policy 68 (Feb): 47–57. https://doi.org/10.1016/j.envsci.2016.12.003.
Li, Y., and B. Ellingwood. 2006. “Hurricane damage to residential construction in the US: Importance of uncertainty modeling in risk assessment.” Eng. Struct. 28 (7): 1009–1018. https://doi.org/10.1016/j.engstruct.2005.11.005.
Li, Y., J. Van de Lindt, T. Dao, S. Bjarnadottir, and A. Ahuja. 2012. “Loss analysis for combined wind and surge in hurricanes.” Nat. Hazard. Rev. 13 (1): 1–10. https://doi.org/10.1061/(ASCE)NH.1527-6996.0000058.
Liu, M., G. Vecchi, J. Smith, and T. Knutson. 2019. “Causes of large projected increases in hurricane precipitation rates with global warming.” Clim. Atmos. Sci. 2 (Oct): 38. https://doi.org/10.1038/s41612-019-0095-3.
Masoomi, H., J. van de Lindt, M. Ameri, and T. Do. 2019. “Combined wind-wave-surge-hurricane-induced damage prediction for buildings.” J. Struct. Eng. 145 (1): 379–387. https://doi.org/10.1061/(ASCE)ST.1943-541X.0002241.
McGrath, H., E. Stefanakis, and M. Nastev. 2015. “Sensitivity analysis of flood damage estimates: A case study in Fredericton, New Brunswick.” Int. J. Disaster Risk Reduct. 14 (Dec): 379–387. https://doi.org/10.1016/j.ijdrr.2015.09.003.
Meehl, G., T. Karl, R. Easterling, S. Changnon, R. Pielke, D. Changnon, and F. Zwiers. 2000. “An introduction to trends in extreme weather and climate events: Observations, socioeconomic impacts, terrestrial ecological impacts, and model projections.” Bull. Am. Meteorol. Soc. 81 (3): 413–416. https://doi.org/10.1175/1520-0477(2000)081%3C0413:AITTIE%3E2.3.CO;2.
Mendelsohn, R., K. Emanuel, and S. Chonabayashi. 2011. The impact of climate change on global tropical storm damages. Washington, DC: World Bank.
Michaels, P. J., P. C. Knappenberger, and R. E. Davis. 2006. “Sea-surface temperatures and tropical cyclones in the Atlantic basin.” Geophys. Res. Lett. 33 (9): L09708. https://doi.org/10.1029/2006GL025757.
Misuri, A., V. C. Moreno, N. Quddus, and V. Cozzani. 2019. “Lessons learnt from the impact of Hurricane Harvey on the chemical and process industry.” Reliab. Eng. Syst. Saf. 190 (Oct): 106521. https://doi.org/10.1016/j.ress.2019.106521.
Moftakhari, H., A. AghaKouchak, B. Sanders, and R. Matthew. 2017. “Cumulative hazard: The case of nuisance flooding.” Earth’s Future 5 (2): 214–223. https://doi.org/10.1002/2016EF000494.
Neumann, B., A. Vafeidis, J. Zimmermann, and R. Nicholls. 2015. “Future coastal population growth and exposure to sea-level rise and coastal flooding—A global assessment.” PLoS One 10 (3): e0118571. https://doi.org/10.1371/journal.pone.0118571.
NHC (National Hurricane Center). 2020a. “2020 Atlantic Hurricane Season. National Oceanic and Atmospheric Administration (NOAA).” Accessed November 12, 2020. https://www.nhc.noaa.gov/data/tcr/.
NHC (National Hurricane Center). 2020b. “Tropical cyclone climatology. National Oceanic and Atmospheric Administration (NOAA).” Accessed November 12, 2020. https://www.nhc.noaa.gov/climo/#bac.
NHC (National Hurricane Center). 2020c. “Costliest U.S. TCs.” Accessed November 12, 2020. https://www.ncdc.noaa.gov/billions/dcmi.pdf.
NOAA (National Oceanic and Atmospheric Administration). 2020. “Tides and currents: Pensacola, FL.” Accessed October 20, 2020. https://tidesandcurrents.noaa.gov/stationhome.html?id=8729840.
O’Neill, B., et al. 2016. “The scenario model intercomparison project (scenarioMIP) for CMIP6.” Geosci. Model Dev. 9 (9): 3461–3482. https://doi.org/10.5194/gmd-9-3461-2016.
Peduzzi, P., B. Chatenoux, H. Dao, A. De Bono, C. Herold, J. Kossin, J. Mouton, and O. Nordbeck. 2012. “Global trends in TC risk.” Nat. Clim. Change 2 (Feb): 289–294. https://doi.org/10.1038/nclimate1410.
Pei, B., W. Pang, F. Testik, N. Ravichandran, and F. Liu. 2014. “Mapping joint hurricane wind and surge hazards for Charleston, South Carolina.” Nat. Hazards 74 (2): 375–403. https://doi.org/10.1007/s11069-014-1185-5.
Pei, B., W. Pang, F. Testik, N. Ravichandran, and F. Liu. 2018. “Selection of hazard-consistent hurricane scenarios for regional combined hurricane wind and flood loss estimation.” Nat. Hazards 91 (2): 671–696. https://doi.org/10.1007/s11069-017-3149-z.
Pielke, R., Jr., and R. Pielke Sr. 1997. Hurricanes: Their nature and impacts on society. Hoboken, NJ: Wiley.
Pilkington, S. F., and H. N. Mahmoud. 2016. “Using artificial neural networks to forecast economic impact of multi-hazard hurricane-based events.” Sustainable Resilient Infrastruct. 1 (1–2): 63–83. https://doi.org/10.1080/23789689.2016.1179529.
Ramm, T., C. Watson, and C. White. 2018. “Strategic adaptation pathway planning to manage sea-level rise and changing coastal flood risk.” Environ. Sci. Policy 87 (Sep): 92–101. https://doi.org/10.1016/j.envsci.2018.06.001.
Rappaport, E. 2014. “Fatalities in the United States from Atlantic TCs: New data and interpretation.” Bull. Am. Meteorol. Soc. 95 (3): 341–346. https://doi.org/10.1175/BAMS-D-12-00074.1.
Rouhanizadeh, B., and S. Kermanshachi. 2020. “Post-disaster reconstruction of transportation infrastructures: Lessons learned.” Sustainable Cities Soc. 63 (Dec): 102505. https://doi.org/10.1016/j.scs.2020.102505.
Scheitlin, K., J. Elsner, S. Lewers, J. Malmstadt, and T. Jagger. 2011. “Risk assessment of hurricane winds for Eglin air force base in northwestern Florida, USA.” Theor. Appl. Climatol. 105 (3): 287–296. https://doi.org/10.1007/s00704-010-0386-4.
Scheitlin, K. N., and J. B. Elsner. 2010. “A track-relative climatology of Eglin Air Force Base hurricanes in a variable climate.” In Hurricanes and climate change, edited by J. Elsner, R. Hodges, J. Malmstadt, and K. Scheitlin. Dordrecht, Netherlands: Springer. https://doi.org/10.1007/978-90-481-9510-7_13.
Shao, W., S. Xian, B. D. Keim, K. Goidel, and N. Lin. 2017. “Understanding perceptions of changing hurricane strength along the US Gulf coast.” Int. J. Climatol. 37 (4): 1716–1727. https://doi.org/10.1002/joc.4805.
Shi, L., and A. Varuzzo. 2020. “Surging seas, rising fiscal stress: Exploring municipal fiscal vulnerability to climate change.” Cities 100 (May): 102658. https://doi.org/10.1016/j.cities.2020.102658.
Silva de Abreu, R. V., J. P. Pinelli, F. Raji, and I. Zisis. 2020. “Testing and modeling of hurricane wind-driven rain water ingress, propagation, and subsequent interior damage in residential buildings.” J. Wind Eng. Ind. Aerodyn. 207 (Dec): 104427. https://doi.org/10.1016/j.jweia.2020.104427.
Simmons, K. M., J. Czajkowski, and J. M. Done. 2019. “Building code economic performance under variable wind risk.” Mitigation Adapt. Strategies Global Change 24 (2): 235–258. https://doi.org/10.1007/s11027-018-9808-x.
Smith, A., and R. Katz. 2013. “U.S. billion-dollar weather and climate disasters: Data sources, trends, accuracy and biases.” Nat. Hazards 67 (2): 387–410. https://doi.org/10.1007/s11069-013-0566-5.
Stephens, S., R. Bell, and J. Lawrence. 2018. “Developing signals to trigger adaptation to sea level rise.” Environ. Res. Lett. 13 (10): 104004. https://doi.org/10.1088/1748-9326/aadf96.
Strazzo, S., J. B. Elsner, T. E. LaRow, H. Murakami, M. Wehner, and M. Zhao. 2016. “The influence of model resolution on the simulated sensitivity of North Atlantic tropical cyclone maximum intensity to sea surface temperature.” J. Adv. Model. Earth Syst. 8 (3): 1037–1054. https://doi.org/10.1002/2016MS000635.
Strazzo, S., J. B. Elsner, J. C. Trepanier, and K. A. Emanuel. 2013. “Frequency, intensity, and sensitivity to sea surface temperature of North Atlantic tropical cyclones in best-track and simulated data.” J. Adv. Model. Earth Syst. 5 (3): 500–509. https://doi.org/10.1002/jame.20036.
Sweet, W., R. Kopp, C. Weaver, J. Obeysekera, R. Horton, E. Thieler, and C. Zervas. 2017. Global and regional sea level rise scenarios for the United States. Silver Spring, MD: National Oceanic and Atmospheric Administration.
Taherkhani, M., S. Vitousek, P. Barnard, N. Frazer, T. Anderson, and C. Fletcher. 2020. “Sea level rise exponentially increases coastal flood frequency.” Sci. Rep. 10 (1): 6466. https://doi.org/10.1038/s41598-020-62188-4.
Vickery, P., J. Lin, P. Skerlj, L. Twisdale, M. Young, and F. Lavelle. 2006. “Hazus-MH hurricane model methodology. II: Damage and loss estimation.” Nat. Hazard. Rev. 7 (2): 94–103. https://doi.org/10.1061/(ASCE)1527-6988(2006)7:2(94).
Vickery, P., D. Wadhera, L. Twisdale, and F. Lavelle. 2009. “U.S. hurricane wind speed risk and uncertainty.” J. Struct. Eng. 135 (3): 301–320. https://doi.org/10.1061/(ASCE)0733-9445(2009)135:3(301).
Villarini, G., and G. Vecchi. 2013. “Projected increases in North Atlantic TC intensity from CMIP5 models.” J. Clim. 26 (10): 3231–3240. https://doi.org/10.1175/JCLI-D-12-00441.1.
Walsh, K., et al. 2016. “TCs and climate change.” WIREs Clim. Change 7 (1): 65–89. https://doi.org/10.1002/wcc.371.
Woodruff, S., S. Meerow, M. Stults, and C. Wilkins. 2018. “Adaptation to resilience planning: Alternative pathways to prepare for climate change.” J. Plann. Educ. Res. 42 (1): 64–75. https://doi.org/10.1177/0739456X18801057.
Woodruff, S., and M. Stults. 2016. “Numerous strategies but limited implementation guidance in US local adaptation plans.” Nat. Clim. Change 6 (8): 796–802. https://doi.org/10.1038/nclimate3012.
Xie, D., Q. Zou, A. Mignone, and J. MacRae. 2019. “Coastal flooding from wave overtopping and sea level rise adaptation in the northeastern USA.” Coastal Eng. 150: 39–58. https://doi.org/10.1016/j.coastaleng.2019.02.001.
Information & Authors
Information
Published In

Journal of Infrastructure Systems
Volume 29 • Issue 2 • June 2023
Copyright
This work is made available under the terms of the Creative Commons Attribution 4.0 International license, https://creativecommons.org/licenses/by/4.0/.
History
Received: Jun 25, 2022
Accepted: Dec 16, 2022
Published online: Mar 29, 2023
Published in print: Jun 1, 2023
Discussion open until: Aug 29, 2023
ASCE Technical Topics:
- Business management
- Case studies
- Climate change
- Climates
- Coastal engineering
- Coastal processes
- Coasts, oceans, ports, and waterways engineering
- Computer programming
- Computer software
- Computing in civil engineering
- Disaster risk management
- Disasters and hazards
- Engineering fundamentals
- Environmental engineering
- Geographic information systems
- Geomatics
- Government
- Hurricanes, typhoons, and cyclones
- Infrastructure
- Local government
- Methodology (by type)
- Natural disasters
- Organizations
- Practice and Profession
- Research methods (by type)
- Storm surges
- Surveying methods
Authors
Metrics & Citations
Metrics
Citations
Download citation
If you have the appropriate software installed, you can download article citation data to the citation manager of your choice. Simply select your manager software from the list below and click Download.