Evaluating SWMM Modeling Performance for Rapid Flows on Tunnels with Geometric Discontinuities
Publication: Journal of Hydraulic Engineering
Volume 151, Issue 1
Abstract
The EPA’s Storm Water Management Model (SWMM) has been applied across the globe for citywide stormwater modeling due to its robustness and versatility. Recent research indicated that SWMM, with proper setup, can be applied in the description of more dynamic flow conditions, such as rapid inflow conditions. However, stormwater systems often have geometric discontinuities that can pose challenges to SWMM model accuracy, and this issue is poorly explored in the current literature. The present work evaluates the performance of SWMM 5 in the context of a real-world stormwater tunnel with a geometric discontinuity. Various combinations of spatiotemporal discretization are systematically evaluated along with four pressurization algorithms, and results are benchmarked with another hydraulic model using tunnel inflow simulations. Results indicated that the pressurization algorithm has an important effect on SWMM’s accuracy in conditions of sudden diameter changes. From the tested pressurization algorithms, the original Preissmann slot algorithm was the option that yielded more representative results for a wider range of spatiotemporal discretizations. Regarding spatiotemporal discretization options, intermediate discretization, and time steps that lead to Courant numbers equal to one performed best. Interestingly, the traditional SWMM’s link-node approach also presented numerical instabilities despite having low continuity errors. Results indicated that although SWMM can be effective in simulating rapid inflow conditions in tunnels, situations with drastic geometric changes need to be carefully evaluated so that modeling results are representative.
Introduction and Objectives
Stormwater collection systems are increasingly stressed by continued urbanization and intensification of extreme rain events (Janssen et al. 2014; Wright et al. 2019). A common consequence is urban flash flooding, accompanied by public health impacts, economic losses, and public safety risks. Ponds, depressions, interception, and infiltration can attenuate stormwater runoff peaks, but our ability to enhance these processes in highly urbanized areas is relatively limited, in large part because creating substantial new grade-level runoff storage would require the removal of existing buildings in most cities. In such cases, below-grade stormwater storage and conveyance tunnels can relieve stormwater collection systems and reduce surficial flooding. Below-grade tunnels are also used in the management of combined sewer systems, where they provide a surge volume to decrease the episodes of combined sewer overflows (CSOs) (EPA 2024).
Although stormwater tunnels are generally able to meet these design purposes, they do have some drawbacks. Of specific interest here is that, under certain conditions, stormwater tunnels can experience entrapment and uncontrolled release of air, which has been linked to stormwater geysers (Muller et al. 2017), manhole cover displacements (Wang and Vasconcelos 2020), and infrastructure damage (Li and McCorquodale 1999). To date, we do not fully understand either (1) the conditions leading to rapid air release, or (2) the ability of the industry-standard design model [i.e., EPA Storm Water Management Model (SWMM)] to model such conditions. The present work is a step toward addressing these gaps.
The design of stormwater storage or CSO tunnels is a complex task involving hydrometeorological estimates of inflows and the hydraulic design of the tunnel geometry and connected structures. Various tools have been proposed to represent the hydrodynamics of rapid filling processes. A chief hydraulic design concern has been the ability to represent the transient characteristics of tunnel flows, including pressure surges in vertical structures and the simulation of varying flow rates. Modeling tools also need to be able to represent the complex geometry of tunnels and the transition between free surface and pressurized flow regimes, also referred to as mixed-flow conditions. Such models fall into two broad categories: (1) computational fluid dynamics (CFD) models that simulate the three-dimensional (3D) flows of air and water, and (2) one-dimensional (1D) two-phase models applying mass and momentum conservation equations.
Past investigations using CFD tools (Cataño-Lopera et al. 2014; Vasconcelos et al. 2022) are examples of how these tools have valuable insights into mixed-flow and two-phase flow conditions but presently are not practical for solving large system-scale problems, including the extended lengths of upstream and downstream piping that affect air trapping. The second category, 1D models, include single-phase models (Cunge and Wegner 1964; Song et al. 1982; Wiggert 1972), or two-phase flow models (Leon et al. 2010; Trindade and Vasconcelos 2013; Vasconcelos and Wright 2009). Presently, such models are used for systemwide simulations but are typically too computationally intensive for citywide stormwater system analysis.
SWMM 5.1 (Rossman 2017) is a 1D hydraulic modeling tool that is often applied to citywide stormwater modeling. This is possible because SWMM introduces simplifications in terms of conduit spatial discretization (i.e., link-node approach), and a numerical scheme that enables the selection of relatively large time steps. SWMM also has two approaches to represent mixed-flow conditions: the extended transport model (EXTRAN) approach (Roesner et al. 1988) and the Preissmann slot (Cunge and Wegner 1964; Sharior et al. 2023). Although the model was successfully applied to a range of stormwater system modeling, Ridgway and Kumpula (2008) showed that SWMM’s link-node approach was not adequate to represent rapidly changing flow conditions. Vasconcelos et al. (2018) evaluated the impact of time steps on the accuracy of SWMM to describe mixed-flow conditions. Pachaly et al. (2020, 2021b) performed studies focused on the effects of pressurization algorithm selection on the description of unsteady flow conditions using SWMM. Finally, Pachaly et al. (2021a) showed that a narrower Preissmann slot alternative improved the SWMM modeling results in the context of a deep stormwater storage tunnel simulation.
Despite the important progress in using SWMM for the description of stormwater systems in rapid inflow conditions, one relevant knowledge gap persists. Oftentimes, stormwater systems have geometric discontinuities, such as an abrupt change in slopes, diameters, and invert drops, among others. An earlier investigation by Geller and Vasconcelos (2023) discovered severe numerical instabilities at locations with abrupt diameter changes, limiting SWMM’s accuracy and usefulness. The present work expands on their work, studying in more detail how spatiotemporal discretization and pressurization algorithms impact such numerical instabilities. Moreover, it investigates the potential causes for these issues at locations with geometric discontinuities, which can be useful for understanding such occurrences in other geometry and modeling contexts. These results are evaluated in terms of continuity errors and instabilities, and further compared with simulations results using a more sophisticated model presented in Pachaly et al. (2021a). These comparisons are performed in the context of a real stormwater tunnel, the Richmond Transport Tunnel (RMT), in San Francisco.
Methodology
SWMM Assessment Approach
As pointed out, the goal is to understand the development of numerical instabilities in SWMM caused by abrupt geometry changes in large stormwater tunnels considering the geometry of the RMT system in San Francisco. Sufficiently detailed field measurements of pressure and flow rates for the RMT are not available for diagnosing model behavior, particularly these numerical instabilities. Therefore, the approach adopted in this study is to compare SWMM with another 1D hydraulic model, hydraulic analysis of sewers and tunnels (HAST). HAST is a finite-volume solver for the Saint-Venant equations built with Roe first-order accurate scheme, which is an approximate Riemann solver as described by Macchione and Morelli (2003). This numerical scheme is particularly adequate to perform calculations with a wide range of Courant numbers, which is relevant because of the range of pressure wave celerities in mixed-flow conditions.
HAST adopts the two-component pressure approach (Vasconcelos et al. 2006) to represent pressurization, including subatmospheric pressurized flows, and was tested with other tunnel-filling simulations and laboratory experiments (Pachaly et al. 2021a; Vasconcelos and Wright 2007). Details of this model formulation and application have been given by Vasconcelos et al. (2006) and thus are omitted here for the sake of brevity.
SWMM Formulation
SWMM represents networks through a scheme of links and nodes, solving the Saint-Venant equations for unsteady free surface flows to determine the discharge passing through the links and the accumulated head on the nodes using an implicit backward Euler method, fitted with a relaxation factor to improve convergence. The SWMM hydraulic solver updates the flow rate at reaches using only a combination of momentum and continuity equation, averaging flow depth between the upstream and downstream junctions. Furthermore, SWMM applies the continuity equation only at node assemblies, which consist of junctions and account for half of the plan area of the connected links (Roesner et al. 1988; Rossman 2017). These equations, the Saint-Venant equations (SVE), express the conservation of mass [Eq. (1)] and linear momentum [Eq. (2)] in conduitswhere = cross-sectional area of the flow; = flow rate; = gravity acceleration; = hydraulic head of water in the conduit; = friction slope; and = distributed local energy loss along the conduit.
(1)
(2)
Pressurization of closed pipes in stormwater systems can occur during rapid fillings and highly dynamic situations, and in pressurized flow conditions, the original SVE are no longer valid (Vasconcelos and Wright 2007). Mixed-flow models follow two approaches for adjusting SVE to handle pressurized flows. Shock-fitting models track pressurization interfaces and apply a separate set of equations to pressurized and open-channel flow regimes, and shock-capturing models apply SVE with a conceptual model that overcomes the pressurized flow limitation. SWMM has both alternatives: EXTRAN is a shock-fitting algorithm that applies a lumped inertia approach to describe pressurized reaches; ; and the Preissmann Slot algorithm (Cunge and Wegner 1964), referred in SWMM as SLOT, assumes a hypothetical narrow slot on the pipe that enables surcharge pressures in the conduit. Although EXTRAN does not have a defined celerity by which pressure waves travel in conduits, the width of the Preissmann slot determines this characteristicwhere = pressure wave celerity; = pipe area , where is the pipe diameter; and = width of the slot. The current version of SWMM has a SLOT algorithm implementation assuming is 1% of the diameter (). Consequently, the range of celerity values for large sewers (e.g., diameters under 3.0 m) is under , which is relatively small. Typical wave celerity in pressurized pipe flows is in the range of a few hundred up to . Based on this, Pachaly et al. (2021b) presented a variation of SLOT with a narrower slot that yielded in the range of . The effect of pressure wave celerity is further discussed in this study.
(3)
Tunnel Geometry and Inflow Information
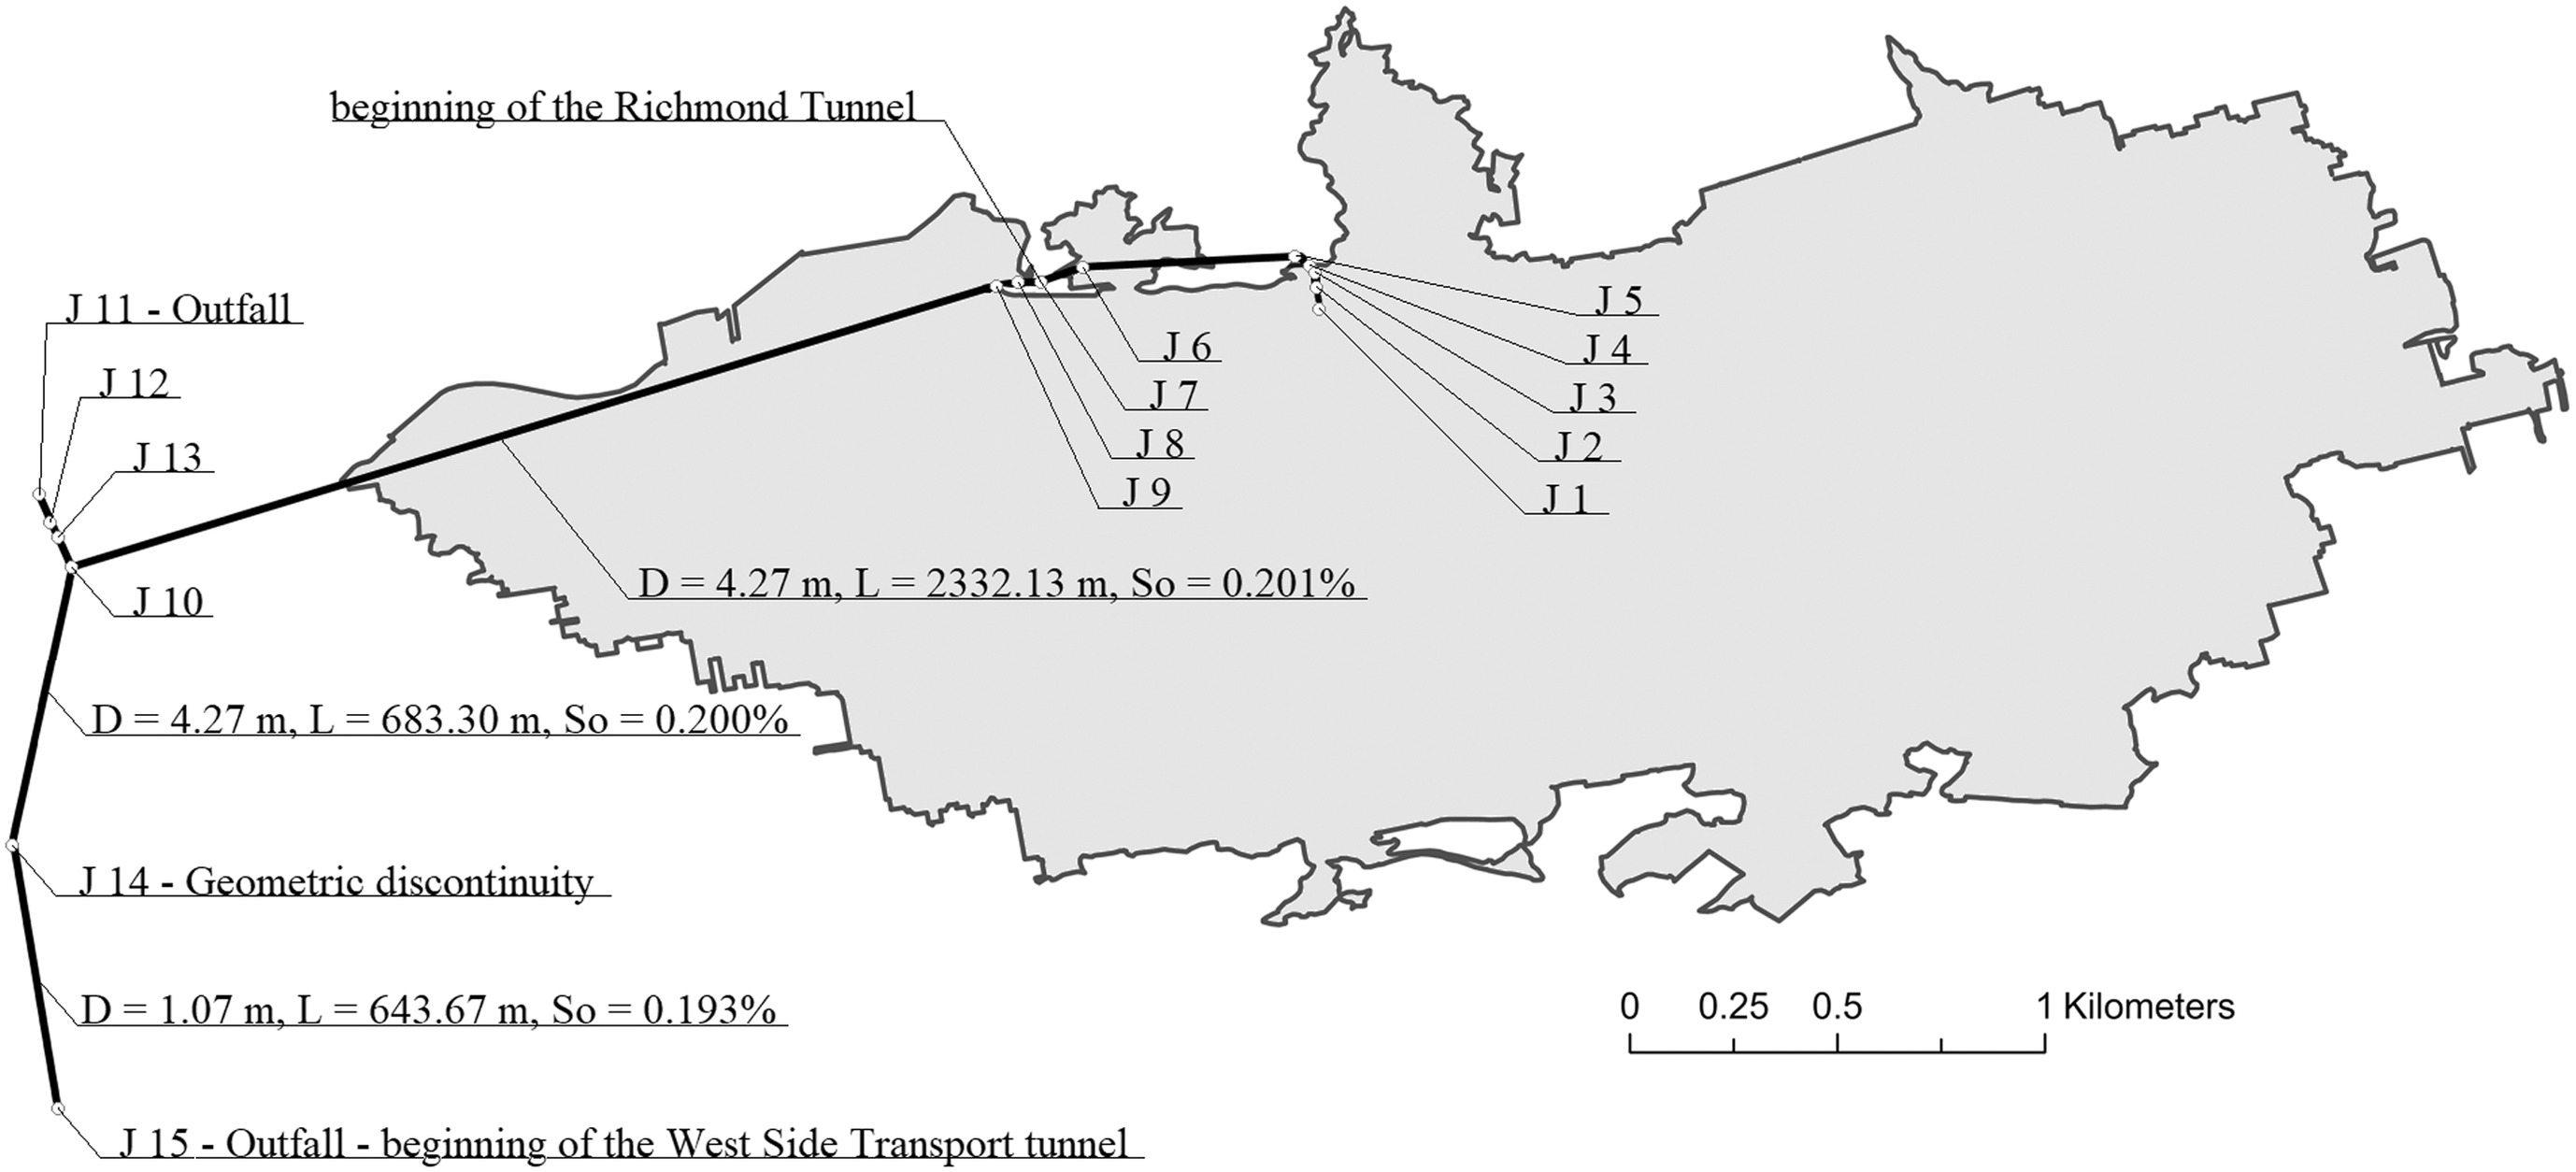
The model study is developed using the geometry of the RMT in San Francisco, shown in Fig. 1 along with its drainage area. The main RMT has a length of 3.11 km and a diameter of 4.27 m. The tunnel drains combined storm and sewage flows from the Richmond watershed in the city’s northwest. The main tunnel connects to the West Side Transport Tunnel through a smaller tunnel of length 0.64 km and diameter of 1.07 m, whose design goal is to store and slow the discharge of flows into the downstream structure, the West Side Transport Tunnel. The fourfold tunnel diameter reduction ( reduction in pipe cross-sectional area) is the key geometric discontinuity that impacts SWMM modeling results, as is presented subsequently.
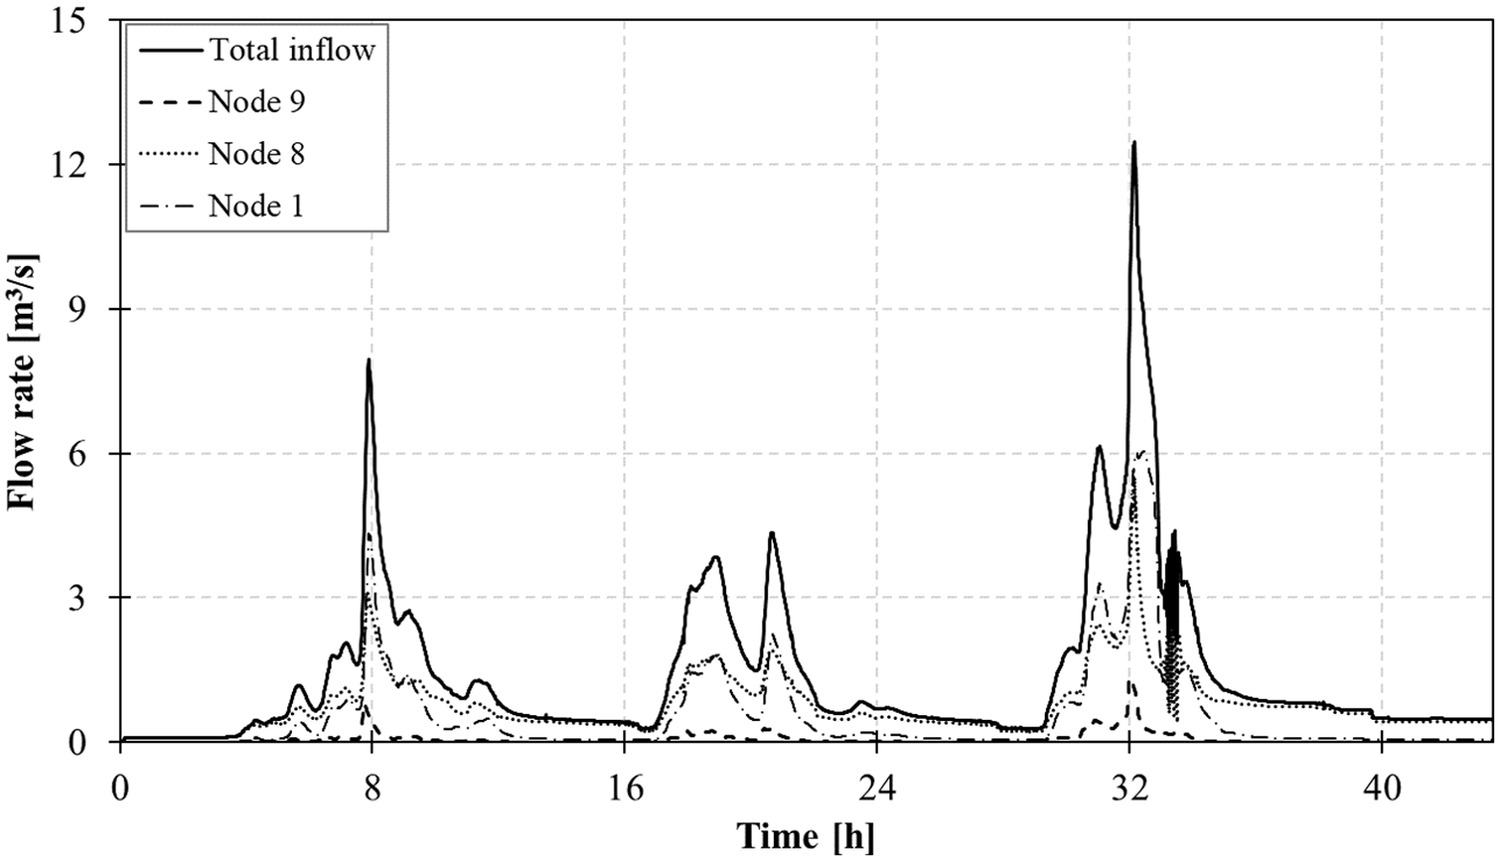
The inflow hydrographs used in this work (Fig. 2) were obtained from the simulation of the entire San Francisco Richmond drainage basin using a SWMM model. The model was forced by four rain gauges with a 1-mi time discretization for 1 days, December 1 and 2, 2012. This rain event corresponded to three consecutive rainfall peaks whose recurrence time is approximately 2 years, which generated tunnel pressurization. The normalized peak inflow for the tunnel, defined as , where is the average tunnel diameter, is equal to 0.11, a relatively small value that is unlikely to result in severe single-phase surging issues (Vasconcelos and Wright 2016). However, due to the smaller diameter at the downstream end of the tunnel, pressurization was observed. The modeling results do not indicate episodes where the hydraulic grade line reaches the grade level.
Study Variables
This work investigated the impacts of pressurization algorithms, spatial discretization, and time discretization in the conditions of a stormwater system with a geometric discontinuity in diameter. The goal was to determine the approaches least impacted by spurious numerical instabilities using SWMM and to assess whether other, less extreme, changes in diameter would influence instabilities. The four pressurization algorithms were
•
EXTRAN;
•
SWMM implementation of Preissmann slot (SLOT) (Rossman and Simon 2022), which contains a gradual slot width transition (Sjöberg 1982);
•
customized SLOT, with a narrower slot yielding pressure wave celerity of that did not present a gradual slot width transition (C250) (Pachaly et al. 2021b); and
•
variation of C250 with a gradual slot transition (C250S) (Pachaly et al. 2021b).
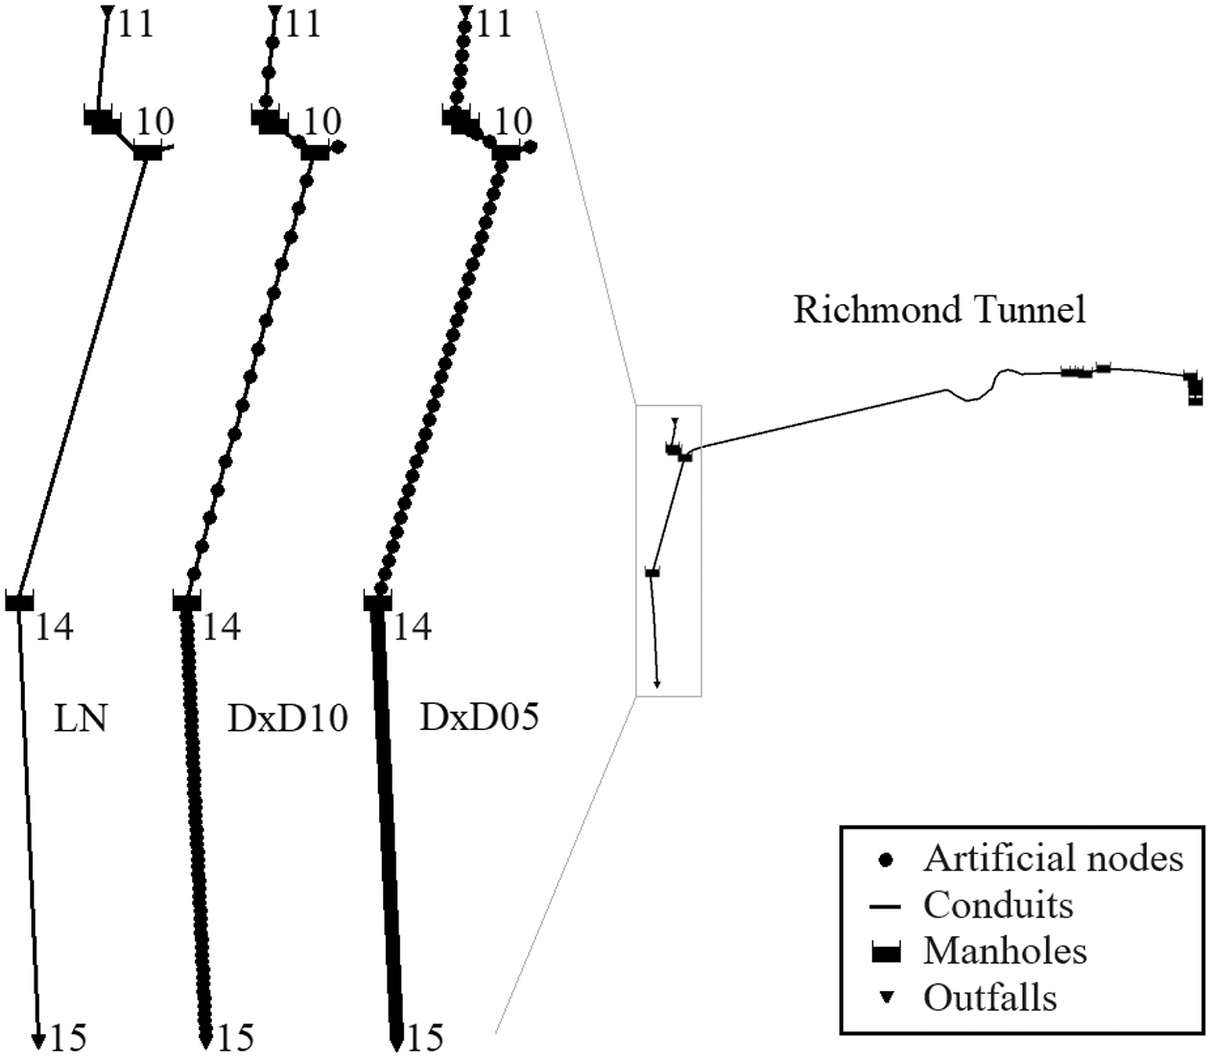
In all SWMM simulations, the dynamic wave (i.e., Saint-Venant equations) option with full inertial terms was used, and the head convergence value was reduced to a smaller threshold of 0.0005 m. Regarding the alternatives for spatial discretization, the baseline condition is the link-node approach typically used in SWMM (referred to herein as the LN approach), which identifies nodes only where physical nodes exist. The entire RMT consists of 15 such original nodes in the LN discretization. Two higher-resolution discretization approaches were tested through the introduction of artificial nodes (with no storage capabilities) in the system, following Ridgway and Kumpula (2008) and Vasconcelos et al. (2018).
The second and third approaches, DxD10 and DxD05, introduce artificial nodes spaced every 10 or 5 conduit diameters, respectively. The resulting number of nodes for the discretized approaches was 183 and 365 for the DxD10 and the DxD05 approaches, respectively. Instead of using standard SWMM nodes (which have a fixed default cross-sectional area), all physical nodes (e.g., manholes) were represented as SWMM storage nodes with defined mass storage corresponding to the original SWMM input file. The artificial nodes introduced in the DxD05 and DxD10 approaches were set up as nodes with the parameter of minimum nodal surface area set to a value of () so that these artificial nodes do not interfere with the overall storage volume of the system. Fig. 3 illustrates the effect of the varying discretization strategies in the representation of RMT.
For temporal discretization of slot-based algorithms, the variable time stepping option in SWMM was disabled, and a fixed routing time step was enforced for eight cases based on limiting Courant numbers in the set: . Except for the case using the EXTRAN pressurization algorithm, the adopted time step for a given was computed as follows:where = time step for a given limiting Courant number ; = number of computational links, = length of the th model conduit; and = wave celerity of the th model conduit, defined as follows:
(4)
(5)
The time step selection when using the EXTRAN algorithm adopted the recommendation by Vasconcelos et al. (2018), which reduced the recommended time step presented in the SWMM manual by a factor of 10. To this reduced value, a multiplier (referred to as ) was introduced using the same eight values as for comparison. As a result, the expressions used to compute time step in this study are
(6)
(7)
The combination of four pressurization algorithms, three spatial discretizations, and eight time steps yielded 96 unique SWMM modeling setups for representing RMT, which are summarized in Table 1. The smaller time steps are associated with the algorithms C250 and C250S due to larger values. All SWMM simulations were benchmarked against a HAST simulation that presented a spatial discretization of twice the pipe diameter (DxD02). This denser spatial discretization used in HAST aimed to maximize the results’ accuracy against which SWMM results were compared. The simulation was performed assuming a celerity of and the time steps are handled automatically by the model.
| Pressurization algorithm | Spatial discretization | Range of spatial discretization (m) | Range of temporal discretization |
|---|---|---|---|
| EXTRAN | LN | 19.5 to 2,332.1 | 22.10 ms to 4.42 s |
| DxD10 | 10.7 to 52.9 | 16.55 ms to 3.31 s | |
| DxD05 | 5.3 to 26.4 | 8.20 ms to 1.64 s | |
| SLOT | LN | 19.5 to 2,332.1 | 22.50 ms to 4.50 s |
| DxD10 | 10.7 to 52.9 | 16.25 ms to 3.25 s | |
| DxD05 | 5.3 to 26.4 | 8.05 ms to 1.61 s | |
| C250 | LN | 19.5 to 2,332.1 | 3.80 ms to 0.76 s |
| DxD10 | 10.7 to 52.9 | 2.10 ms to 0.42 s | |
| DxD05 | 5.3 to 26.4 | 1.00 ms to 0.20 s | |
| C250S | LN | 19.5 to 2,332.1 | 3.80 ms to 0.76 s |
| DxD10 | 10.7 to 52.9 | 2.10 ms to 0.42 s | |
| DxD05 | 5.3 to 26.4 | 1.00 ms to 0.20 s |
Evaluating Effects of Sudden Diameter Change in SWMM Modeling
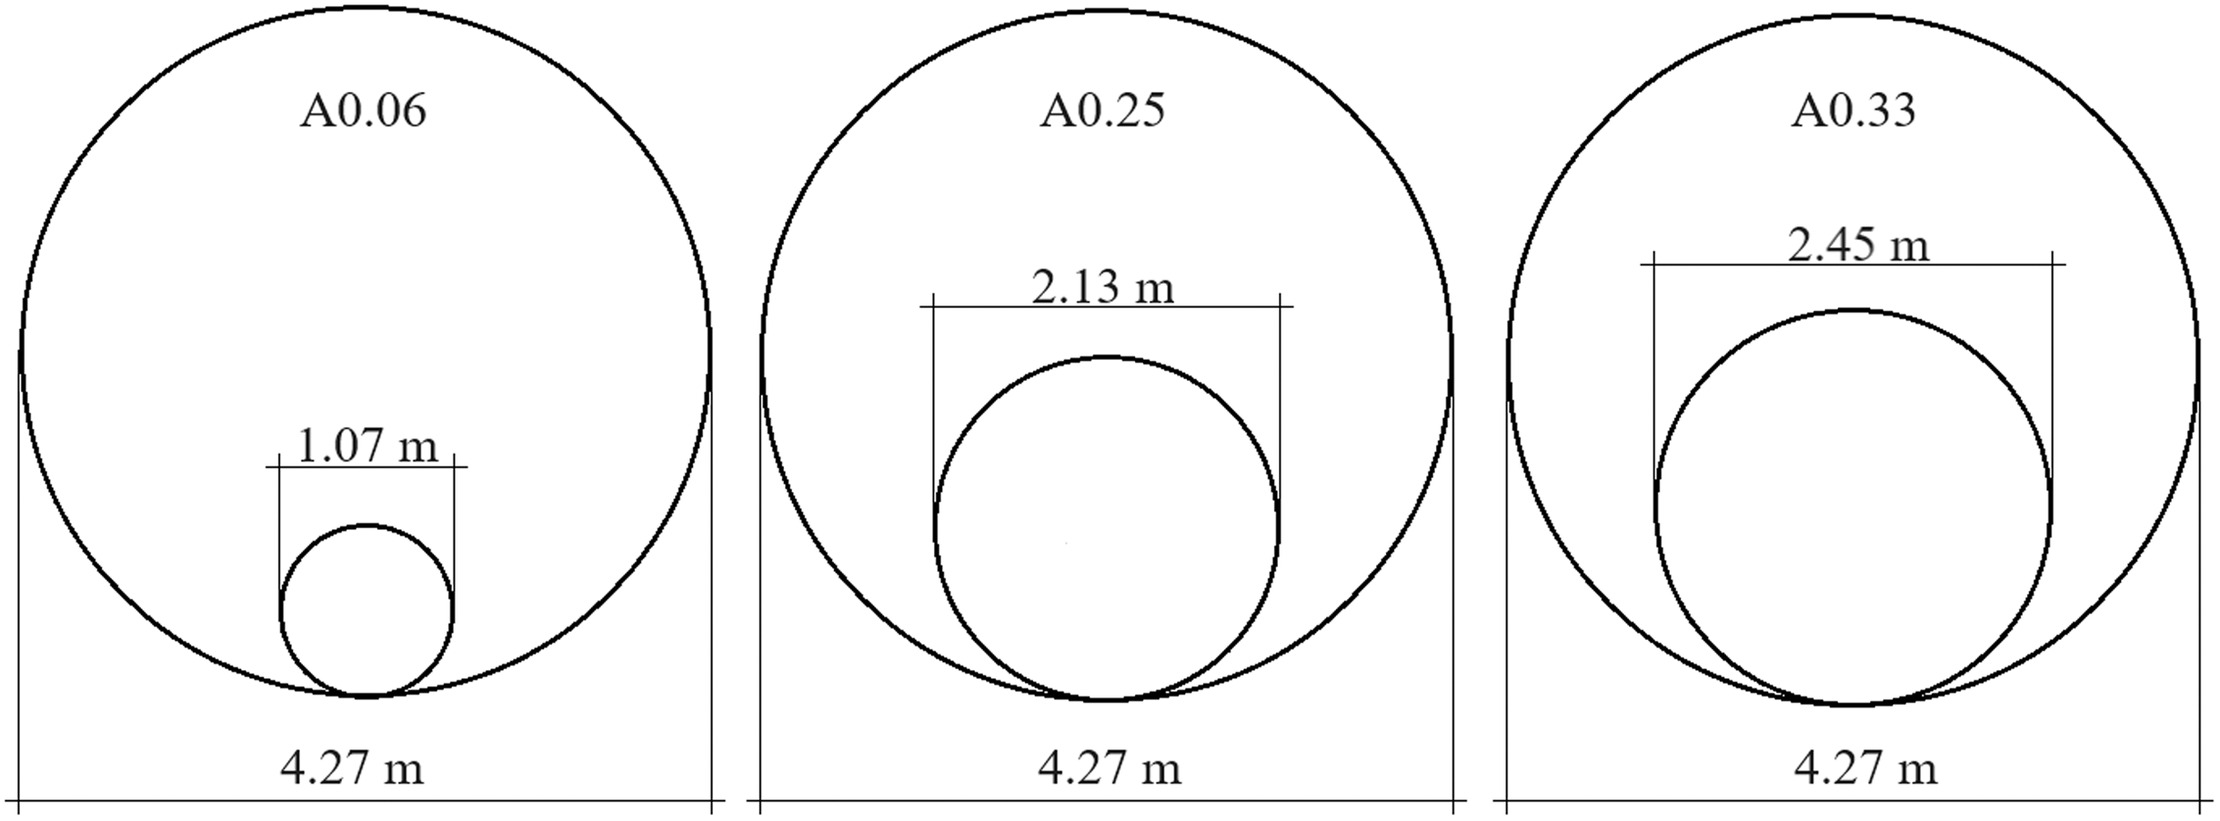
The RMT geometry introduces a diameter reduction from 4.27 to 1.07 m near its downstream end, with the resulting cross-sectional area becoming 6.3% of the upstream reach, thus being referred to in this study as A0.06. As shown subsequently, this abrupt diameter change, located in Node 14, impacts SWMM model results in terms of strong numerical instabilities. It was hypothesized that such diameter reduction amplifies numerical instabilities that could be expected in actual stormwater tunnel flows.
To test the hypothesis, this work also evaluated SWMM performance for hypothetical scenarios where this last RMT segment had a larger diameter. Two alternative geometries were considered with different cross-sectional area reductions in which the downstream cross-sectional represented 25% and 33% of the upstream tunnel area, referred to as A0.25 and A0.33, respectively. These were simulated both in SWMM and HAST. No additional modifications to the RMT geometry were introduced into those simulations.
The rationale for these diameter choices was linked with the resulting conveyance in Node 14. The dimension A0.25 was chosen as this size led to pressurization only in the third peak flow of the inflow hydrograph, but not in the initial two peak flows. The third alternate geometry A0.33 was chosen because this did not result in any pressurization in Node 14 in the entire simulation. The differences in the geometries between the existing (A0.06) and these two hypothetical geometries are illustrated in Fig. 4.
Model Accuracy Evaluation
The accuracy of SWMM simulations was evaluated in terms of flow continuity error and the Nash-Sutcliffe efficiency (NSE) coefficient for the node with geometry discontinuity. The flow continuity error is a parameter consisting of a mass balance of the system in terms of percentage that SWMM estimates to inform the user about the validity of the obtained results (Rossman 2017). Large flow continuity errors are usually signals of issues with models, such as instabilities or inadequate SWMM model geometry (e.g., conduits that are too short). In the present work, continuity errors at or above 2% were considered inadequate. Due to the absence of field monitoring data within the RMT for the selected rain events, NSE was applied between the results from SWMM and HAST models.
NSE is a normalized statistical procedure that determines the relative magnitude of the residual variance compared with the measured data variance (Nash and Sutcliffe 1970). It also evaluates the goodness of fit of modeled data compared with observed data. NSE is presented in Eq. (8)where th observed value; th forecasted value; and = mean of observed data. The NSE ranges from negative infinite to one. When it equals one, there is a perfect match between predicted and observed data. In this study, simulations that presented were not considered good predictions. NSE was calculated for pressure heads and flow rates at Node 14, the location of the abrupt change in diameter is located in which the numerical instabilities were strongest.
(8)
Results
General Description of the Filling Process
As indicated in Fig. 1, the RMT tunnel is comprised of several diameters that gradually increase as flows go downstream, with a sudden diameter reduction at Node 14. In addition, the RMT geometry also has two sudden drops at Nodes 3 and 7. Upstream from Node 7, reach slopes are in the range of 0.7% to 3.1%, and downstream slopes are milder, in the range of 0.2% or less. This is an important geometric characteristic because upstream from Node 7, the flow regime is mostly in the transcritical/supercritical regime, whereas in the downstream portion, the flow is entirely in the subcritical regime. There are three periods in the simulation where pressurization is observed in the RMT, matching the peaks in the inflow hydrographs presented in Fig. 2.
During the simulations, no hydraulic bores/jumps were observed in either HAST or SWMM models. Although the pressurized flow conditions front reaches the majority of the RMT length, the peak inflows were not so extreme, which mitigated the severity of the tunnel pressurization. The flow pressurization interfaces do not reach the pipe reaches with steeper slopes in the RMT system; hence, no hydraulic jump was observed in our SWMM or HAST simulations. This is also consistent with the relatively low value of computed previously in this work.
Effects of Pressurization Algorithms and Spatiotemporal Discretization to Simulation Results
A wide range of simulation conditions were considered in SWMM, and in each case, the characteristics of the simulation results were compared with HAST predictions. As indicated in Fig. 2, three distinct peaks in inflows were admitted into the tunnel, leading to three corresponding events where portions of RMT became pressurized. According to the selection of the pressurization algorithm, time step, and spatial discretization, the results between the two models were comparable. However, some SWMM configurations led to poor simulation results both in terms of continuity errors and NSE. This section provides a comparison between the model setups with the simulation condition using SLOT, DxD10, and considered as the reference for comparison due to the relatively good results obtained with this combination, particularly in terms of continuity errors, as is further explored.
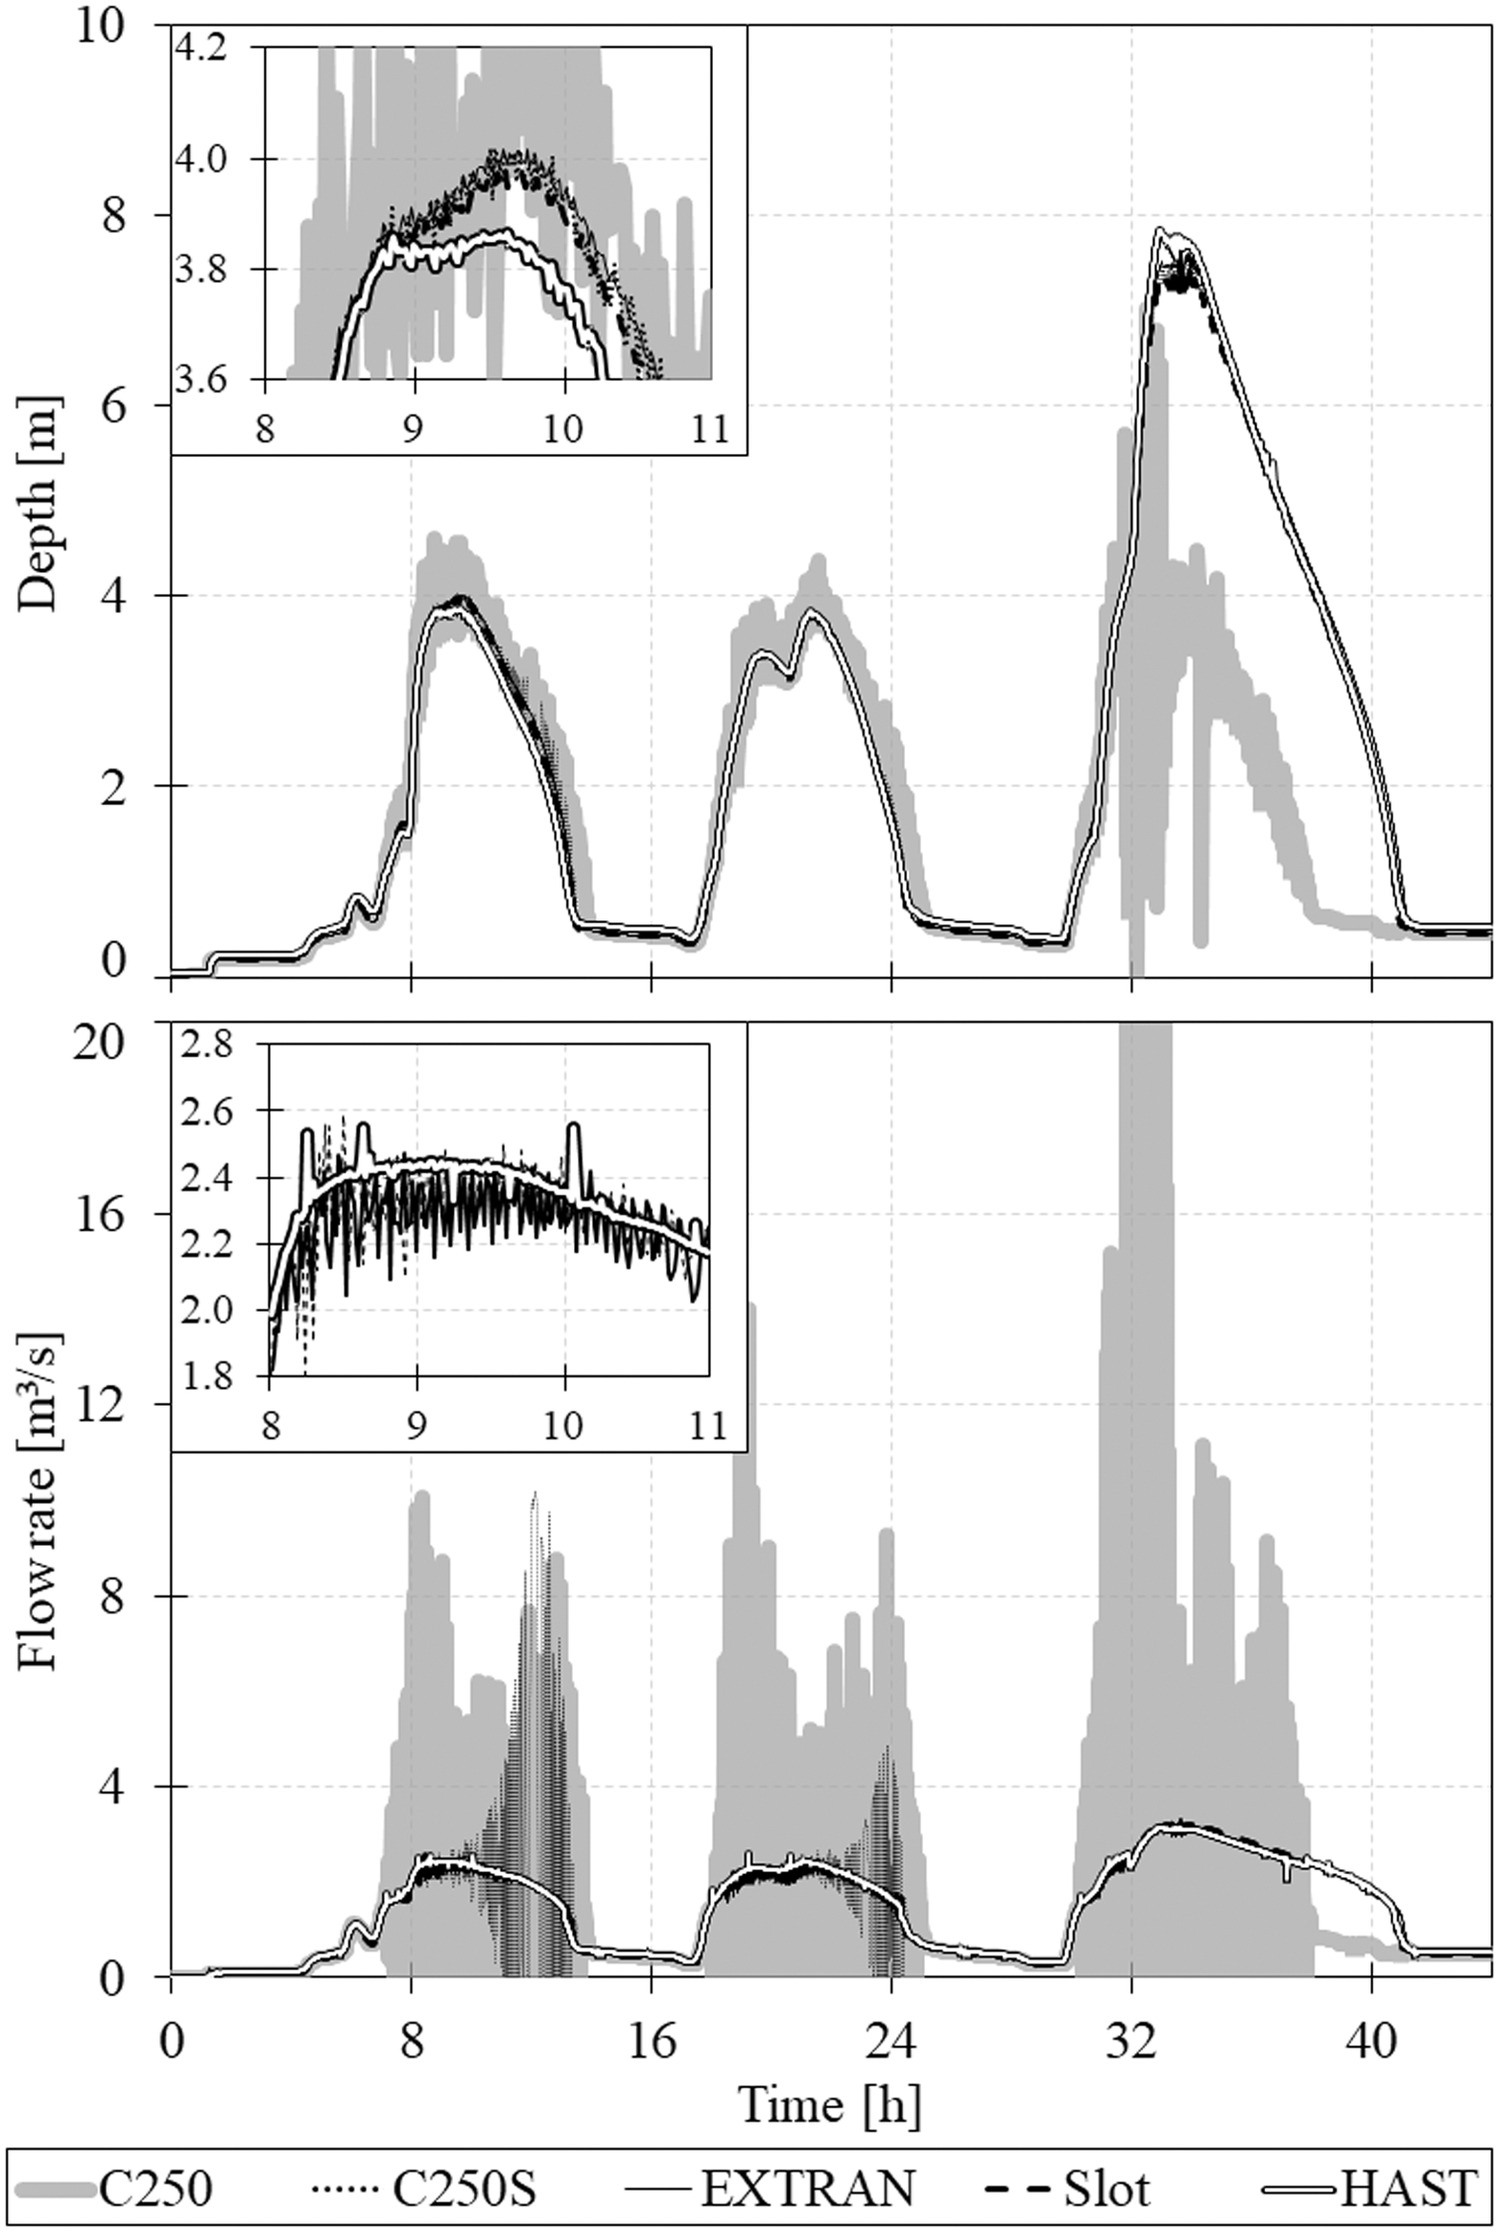
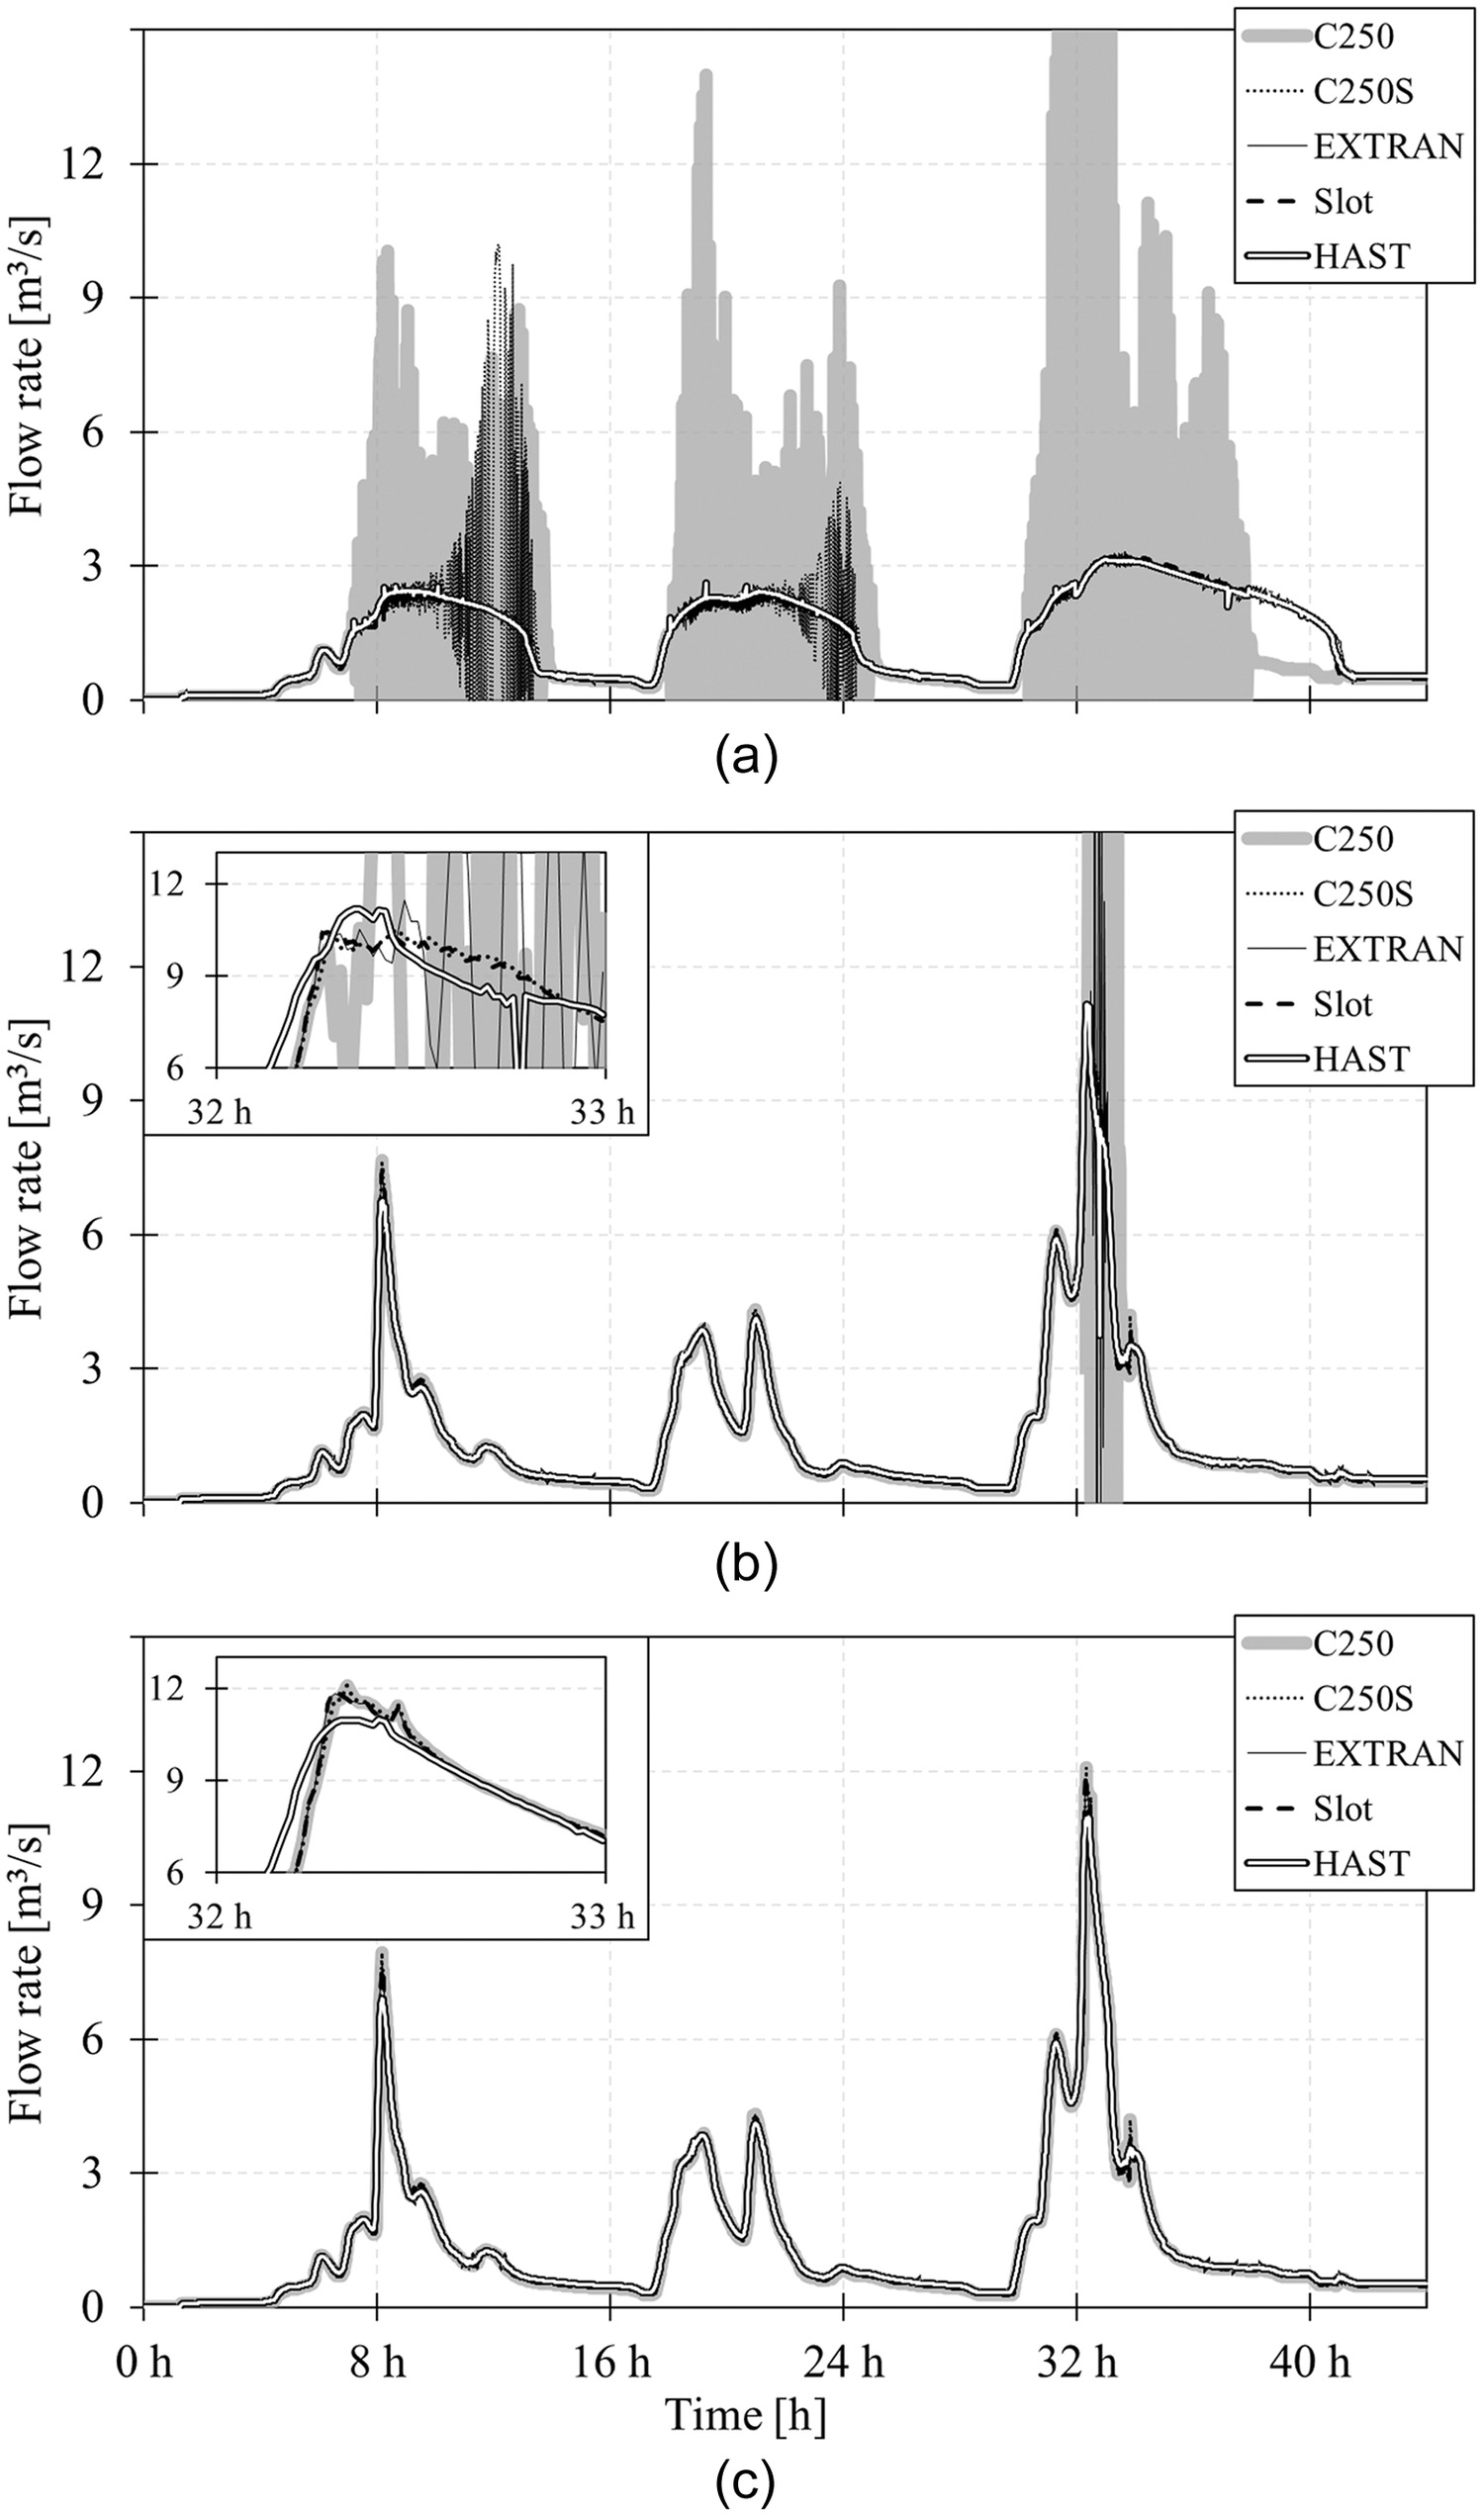
Fig. 5 presents the effect of pressurization algorithms on the flow rate and pressure head measured at Node 14 compared with HAST model results. The results correspond to the case of discretization (DxD10) and consider , considered the most appropriate spatiotemporal discretization. The water depth and flow rate calculated by the EXTRAN and SLOT algorithms in SWMM were similar to HAST results despite small numerical instabilities, as detailed in the inset of Fig. 5. However, large numerical instabilities were observed for the results obtained with the pressurization algorithms using larger values of pressure wave celerity, i.e., C250 and C250S. Early work by Pachaly et al. (2021a) did not indicate similar issues with numerical instabilities, but in that previous study, there were no sudden changes in diameters in the system geometry. Thus, these results indicate that applying pressurization algorithms such as C250 or C250S with sudden diameter changes on a pressurized reach amplifies numerical instabilities, which impacted the performance of the models in terms of NSE evaluated in terms of flow rate.
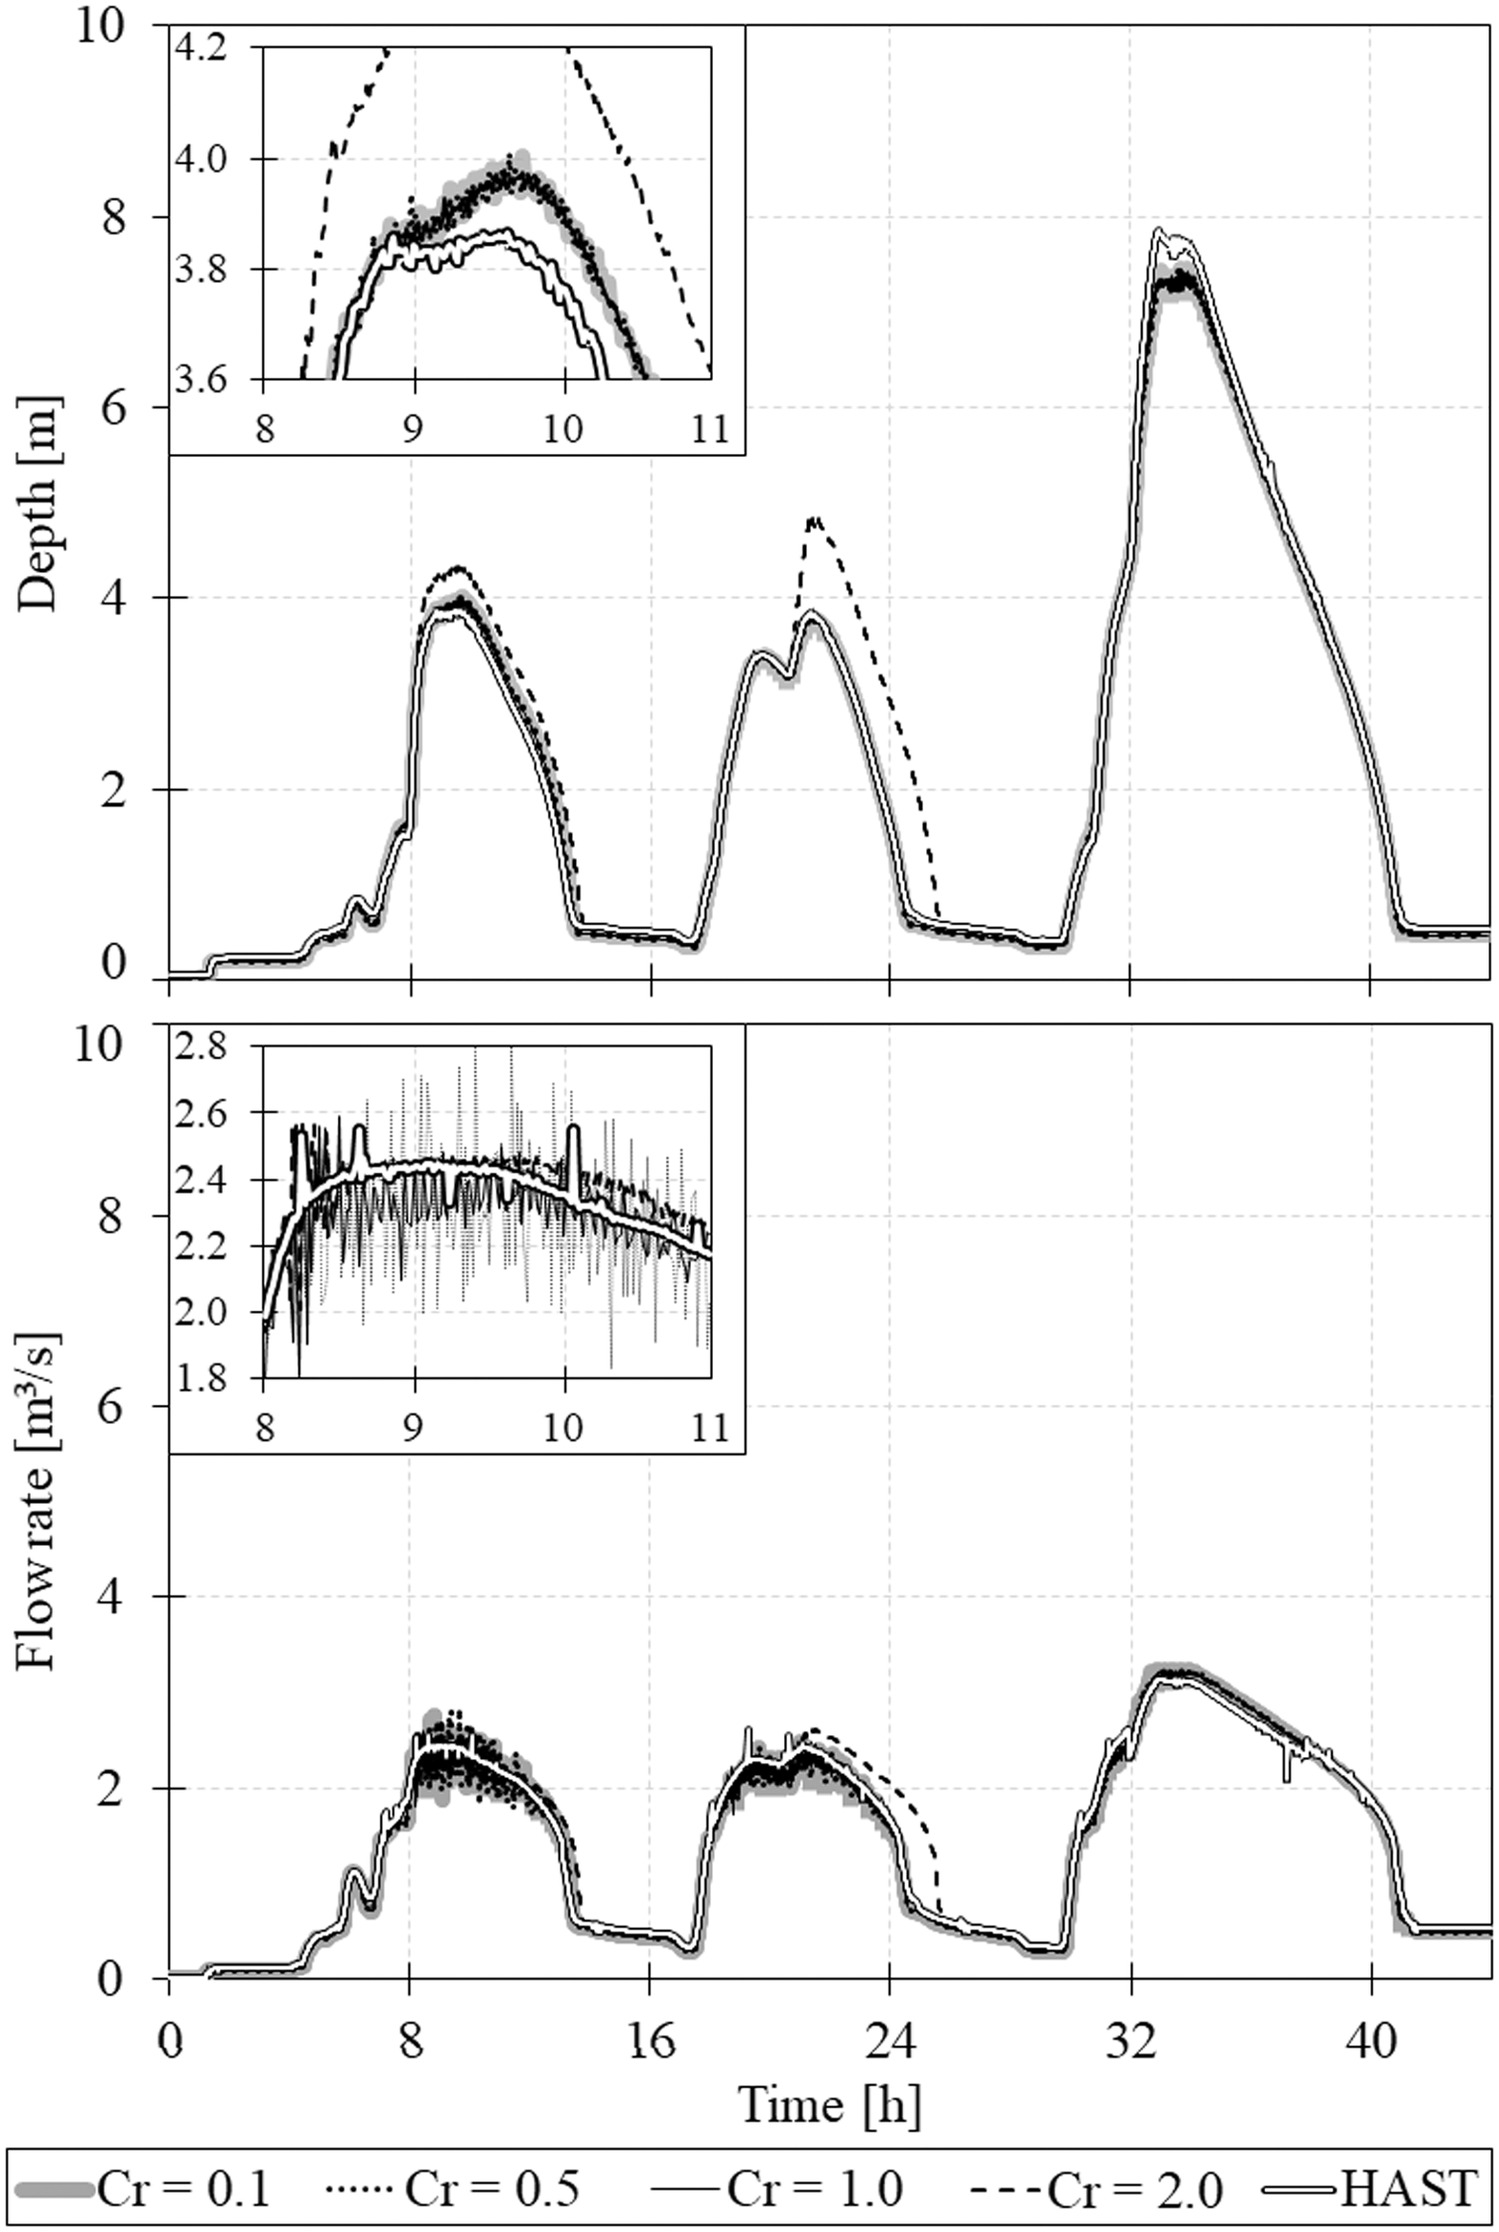
Time step changes, expressed in terms of and , also impacted SWMM modeling results. Fig. 6 presents simulation results using SLOT, DxD10, and different values of . Whereas results were not substantially impacted when the time step was decreased (i.e., ), a noticeable discrepancy occurred for , with a large (5%) continuity error noticed, which explained the hydrograph discrepancy observed in Fig. 6. The source of the continuity error did not originate at Node 14 (i.e., location of diameter discontinuity) but further upstream at Node 3, near a short and steep conduit. Larger continuity errors were most frequently observed for simulations with and when . The effects of time step on continuity errors were mostly observed in the simulations involving spatial discretization.
Vasconcelos et al. (2018) pointed out the importance of spatial discretization in unsteady flow simulations in SWMM, which was also noticed in this study. Fig. 7 presents the hydrograph results at Node 14 for SLOT and for all tested discretizations. Results obtained with DxD10 were the closest to the ones yielded by HAST, but the other two discretizations presented different issues. The smallest spatial discretization, DxD05, had much higher flow depth and inflow rates due to continuity errors originating at the upstream reaches of RMT with supercritical flows.
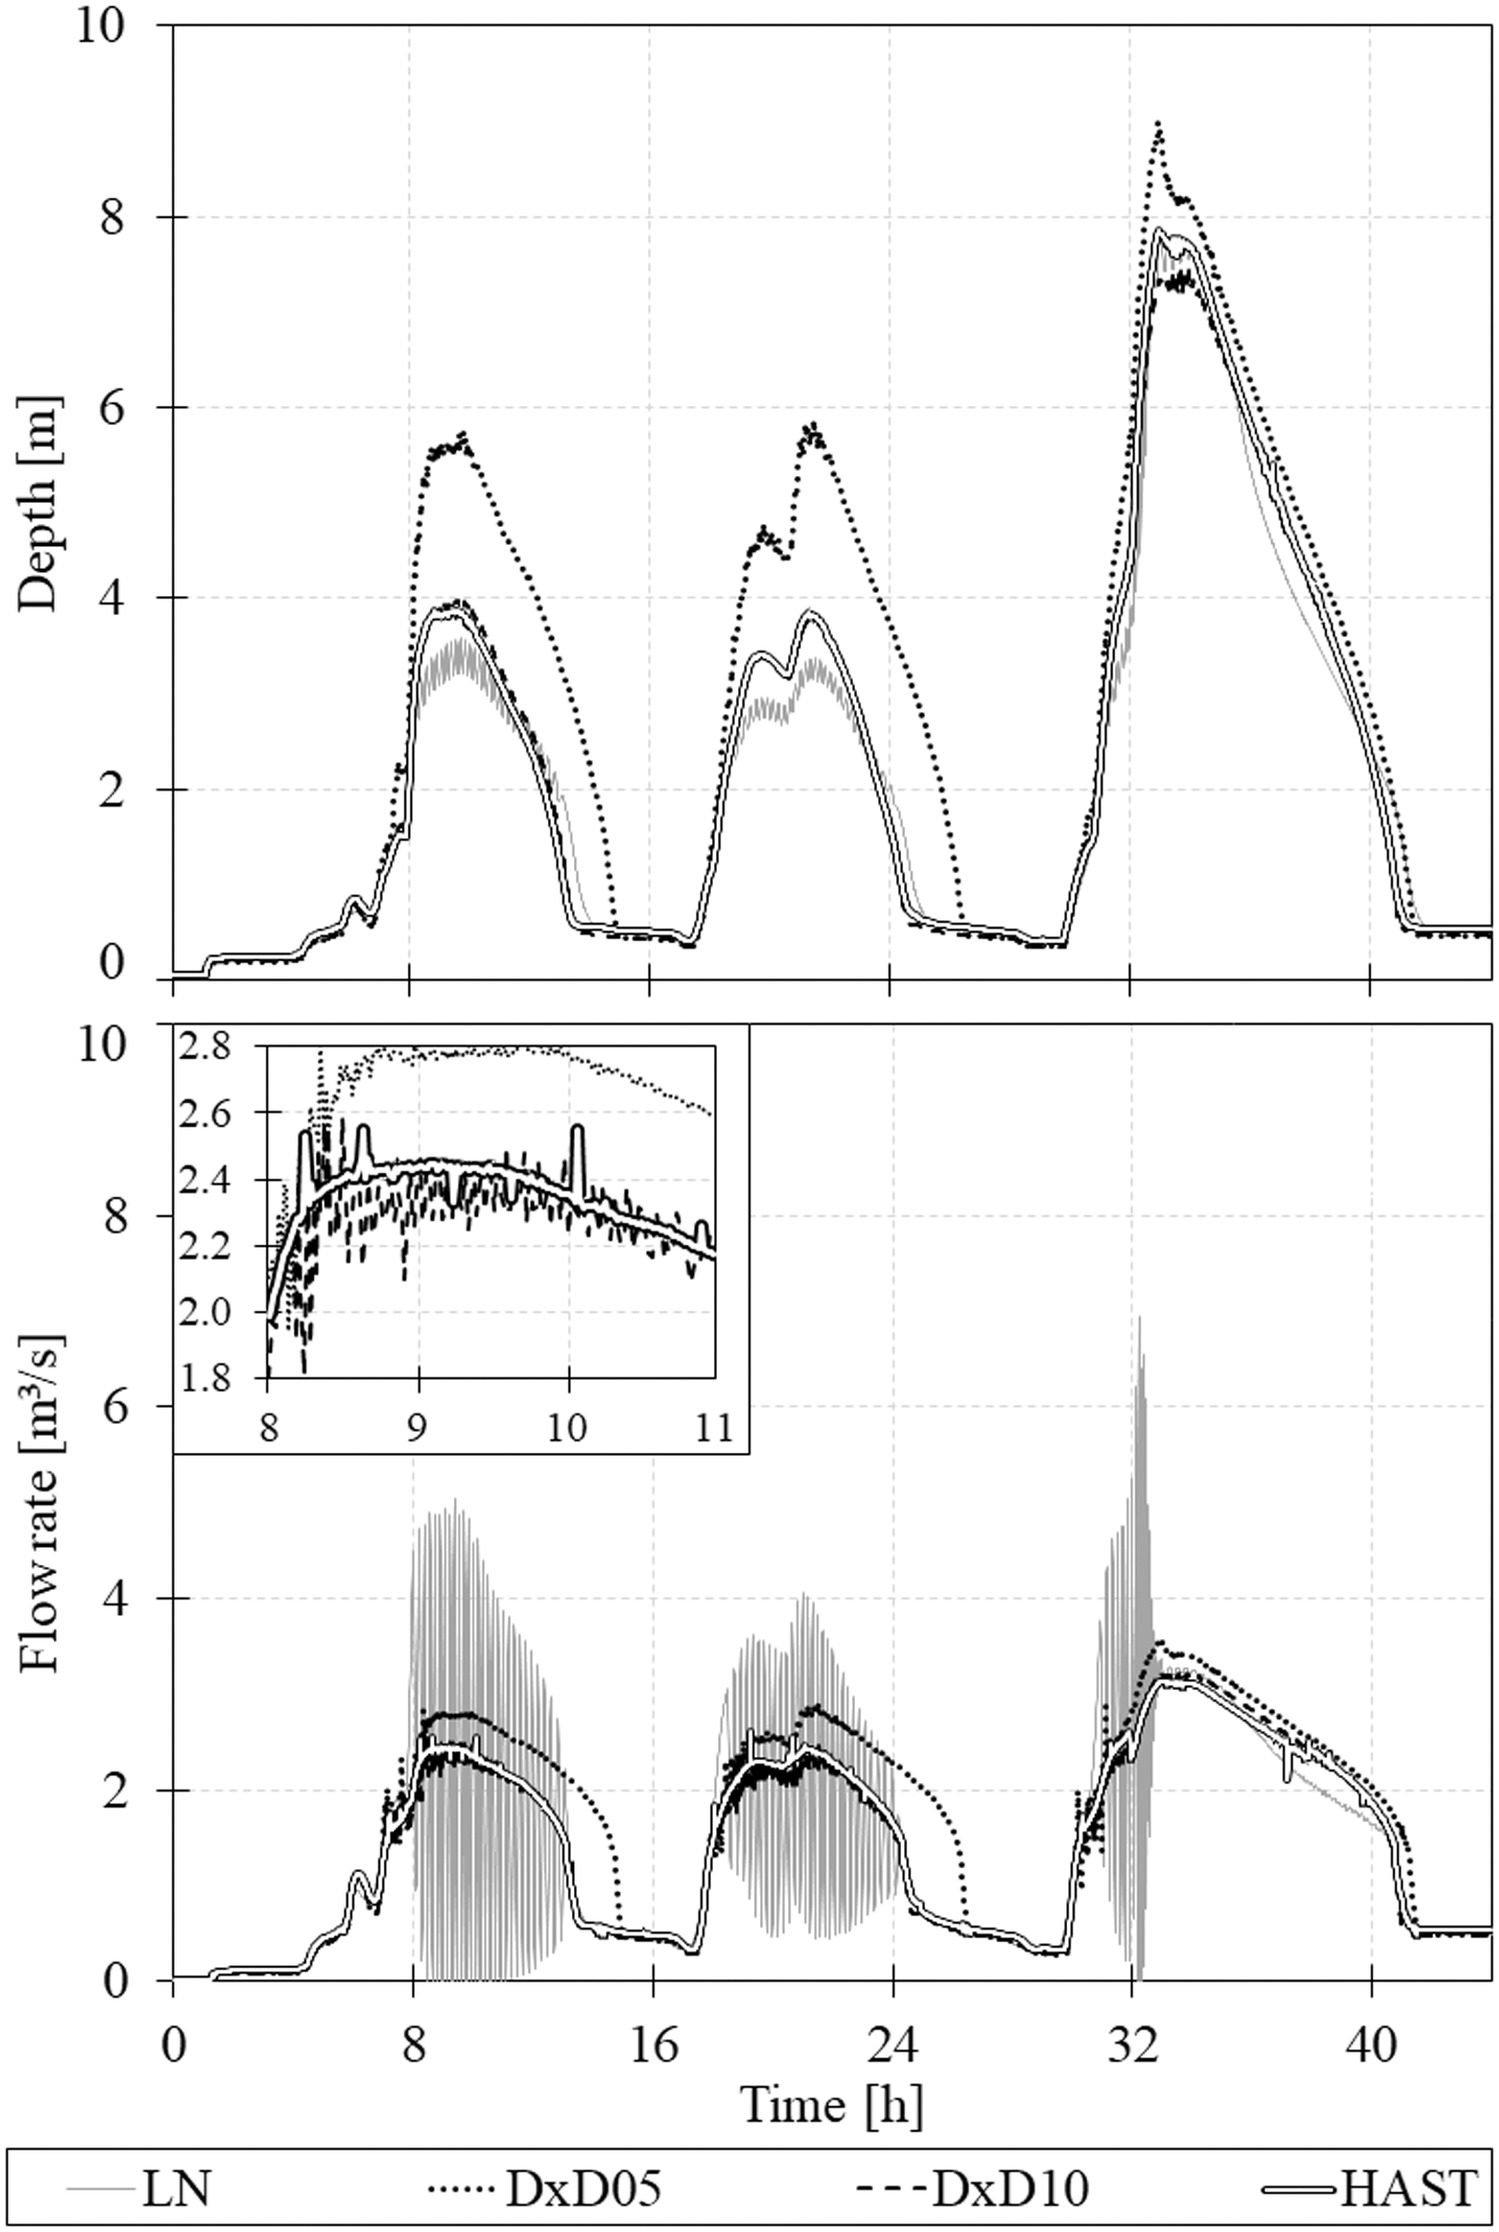
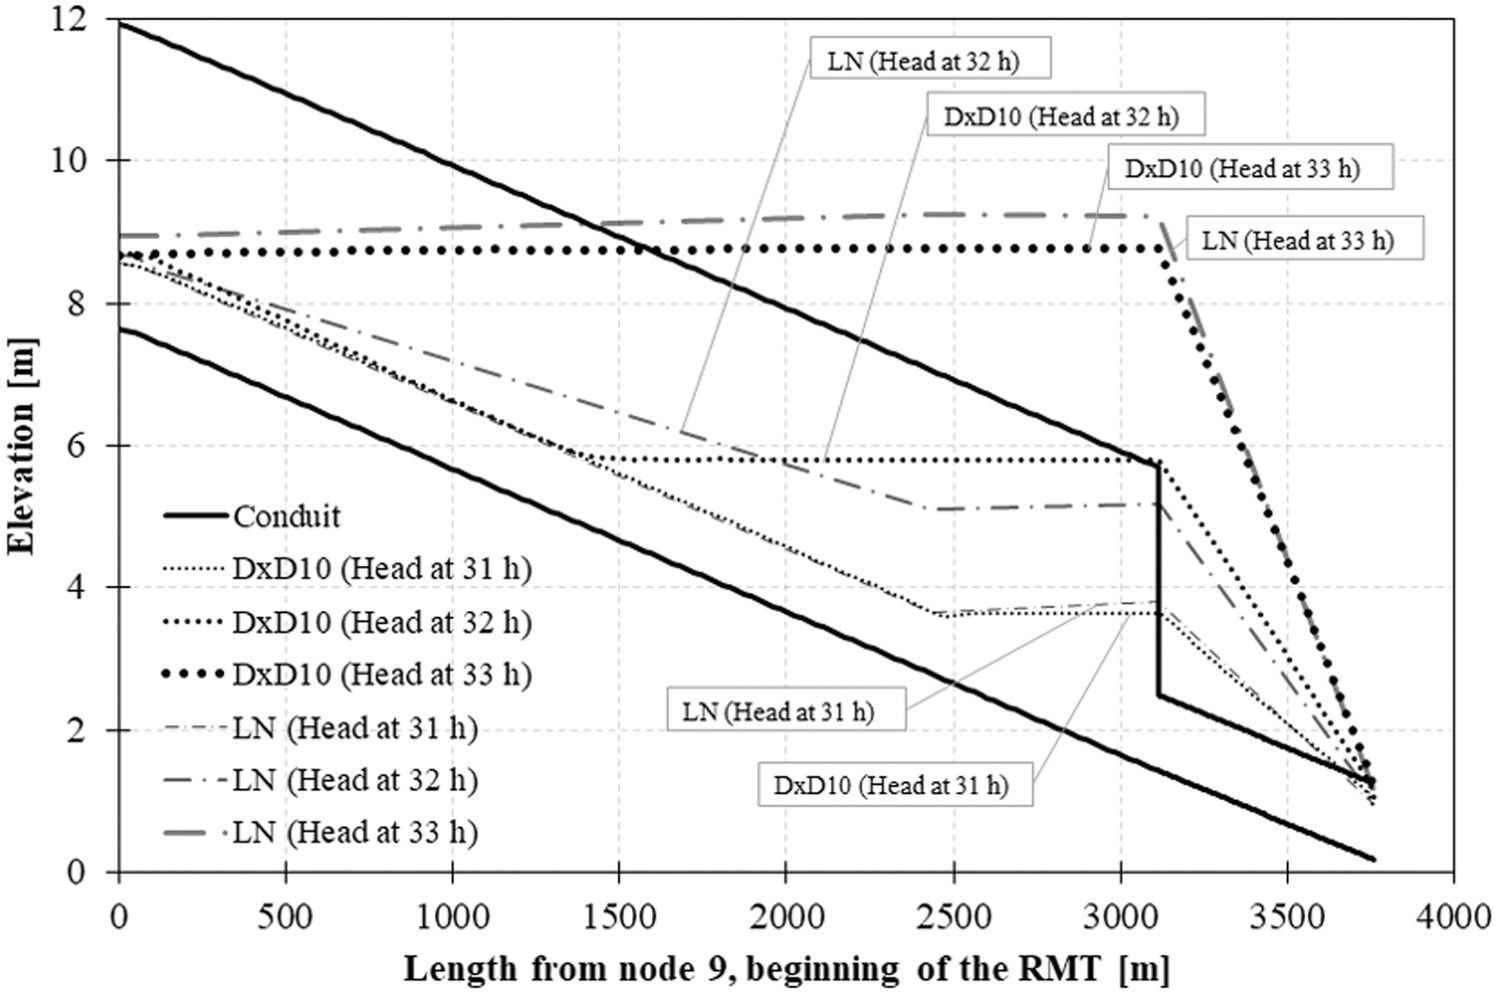
For the LN case, numerical instabilities in depth and velocity were observed in the results. Interestingly, these instabilities did not affect the continuity error for LN (about 0.6%), even though the NSE results for flow were inadequate. Another issue of using LN discretization in this type of application is presented in Fig. 8, in which the hydraulic grade lines (HGL) for DxD10 and LN discretizations are compared for SLOT and . The HGL is presented for three times in the simulation: , 32, and 33 h into the simulation. There were no significant differences between the HGLs yielded by LN and DxD10 at 31 h, with both presenting the last tunnel reach as already pressurized and a backwater formed for the reach upstream of Node 14. However, as the water depth rapidly increased at , there were substantial differences in HGLs between the two discretizations. At , near peak flow conditions, the difference between these approaches was relatively minor with LN hydraulic grade line above DxD10 results.
Effects of Abrupt Geometry Change
As pointed out previously, RMT has a sudden diameter reduction at Node 14 to ensure a gradual runoff discharge into the West Side Transport Tunnel, and this work evaluated hypothetical scenarios for other sudden diameter changes. Fig. 9 compares the flow hydrographs at Node 14 for the discretization DxD10, , and various pressurization algorithms. It can be noticed that the severe numerical instabilities observed in C250 and C250S for A0.06 become less prevalent with A0.25 and are absent for the A0.33 geometry.
The instabilities in A0.25 mostly coincide with the pressurization of the reach downstream from Node 14. Interestingly, C250S did not present numerical instabilities for A0.25, a result attributed to Sjoberg’s gradual slot transition. Another interesting and unexpected result was that EXTRAN displayed severe and short-lived numerical instabilities for A0.25 at the third peak flow. No numerical instabilities were present in the A0.33 results. As evident in the hydrograph, with such a larger diameter downstream from Node 14, there was no flow reduction of inflow accumulation at RMT. It can be concluded that simulations using slot-based pressurization algorithms with large wave celerity can be negatively impacted by drastic geometry changes in tunnels.
A summary of SWMM results in terms of accuracy corresponding to the actual RMT geometry (i.e., A0.06) is presented in Table 2 and Fig. 10. Table 2 presents how the continuity errors have varied for each combination of pressurization algorithm, spatial discretization, and time step used in this study. Fig. 10 presents four charts summarizing the NSE values for flow and depth at Node 14 for each simulated condition. Negative values of NSE were omitted from Fig. 10 because they fell outside the chart scales. For this investigation, the simulation performance was deemed accurate when two criteria were met: continuity errors below 2%, and the calculated NSE coefficients at Node 14 were greater than 0.75. As is discussed subsequently, most of the simulated conditions could not meet the three accuracy criteria adopted in this study.
| Pressurization algorithms | Spatial discretization | Temporal discretization ( or ) | |||||||
|---|---|---|---|---|---|---|---|---|---|
| 0.05 | 0.10 | 0.20 | 0.50 | 1.00 | 2.00 | 5.00 | 10.0 | ||
| EXTRAN | LN | 0.1 | 0.1 | 0.1 | 0.1 | 0.6 | 9.4 | 17.1 | 11.7 |
| DxD10 | 23.1 | 8.1 | 0.0 | 0.0 | 0.0 | 5.2 | 17.0 | 6.1 | |
| DxD05 | 24.4 | 0.9 | 7.9 | 4.7 | 21.4 | 33.0 | 42.2 | 41.1 | |
| SLOT | LN | 0.1 | 0.1 | 0.1 | 0.1 | 0.3 | 2.6 | 2.6 | 4.4 |
| DxD10 | 0.0 | 0.0 | 0.0 | 0.0 | 0.0 | 5.0 | |||
| DxD05 | 18.9 | 15.7 | 12.8 | 4.1 | 22.3 | 35.8 | |||
| C250S | LN | 0.1 | 0.1 | 0.1 | 0.1 | 0.1 | 0.1 | 0.1 | 2.4 |
| DxD10 | 0.0 | 0.0 | 0.1 | 0.2 | 0.7 | 52.6 | |||
| DxD05 | 1.0 | 1.7 | 8.5 | 4.7 | 57.3 | 8.2 | |||
| C250 | LN | 0.1 | 0.1 | 0.1 | 0.1 | 0.2 | 0.0 | 0.5 | 3.4 |
| DxD10 | 40.1 | 42.4 | 46.0 | 54.8 | 61.6 | 69.2 | |||
| DxD05 | 40.2 | 43.8 | 50.5 | 55.5 | 66.5 | 70.2 | |||
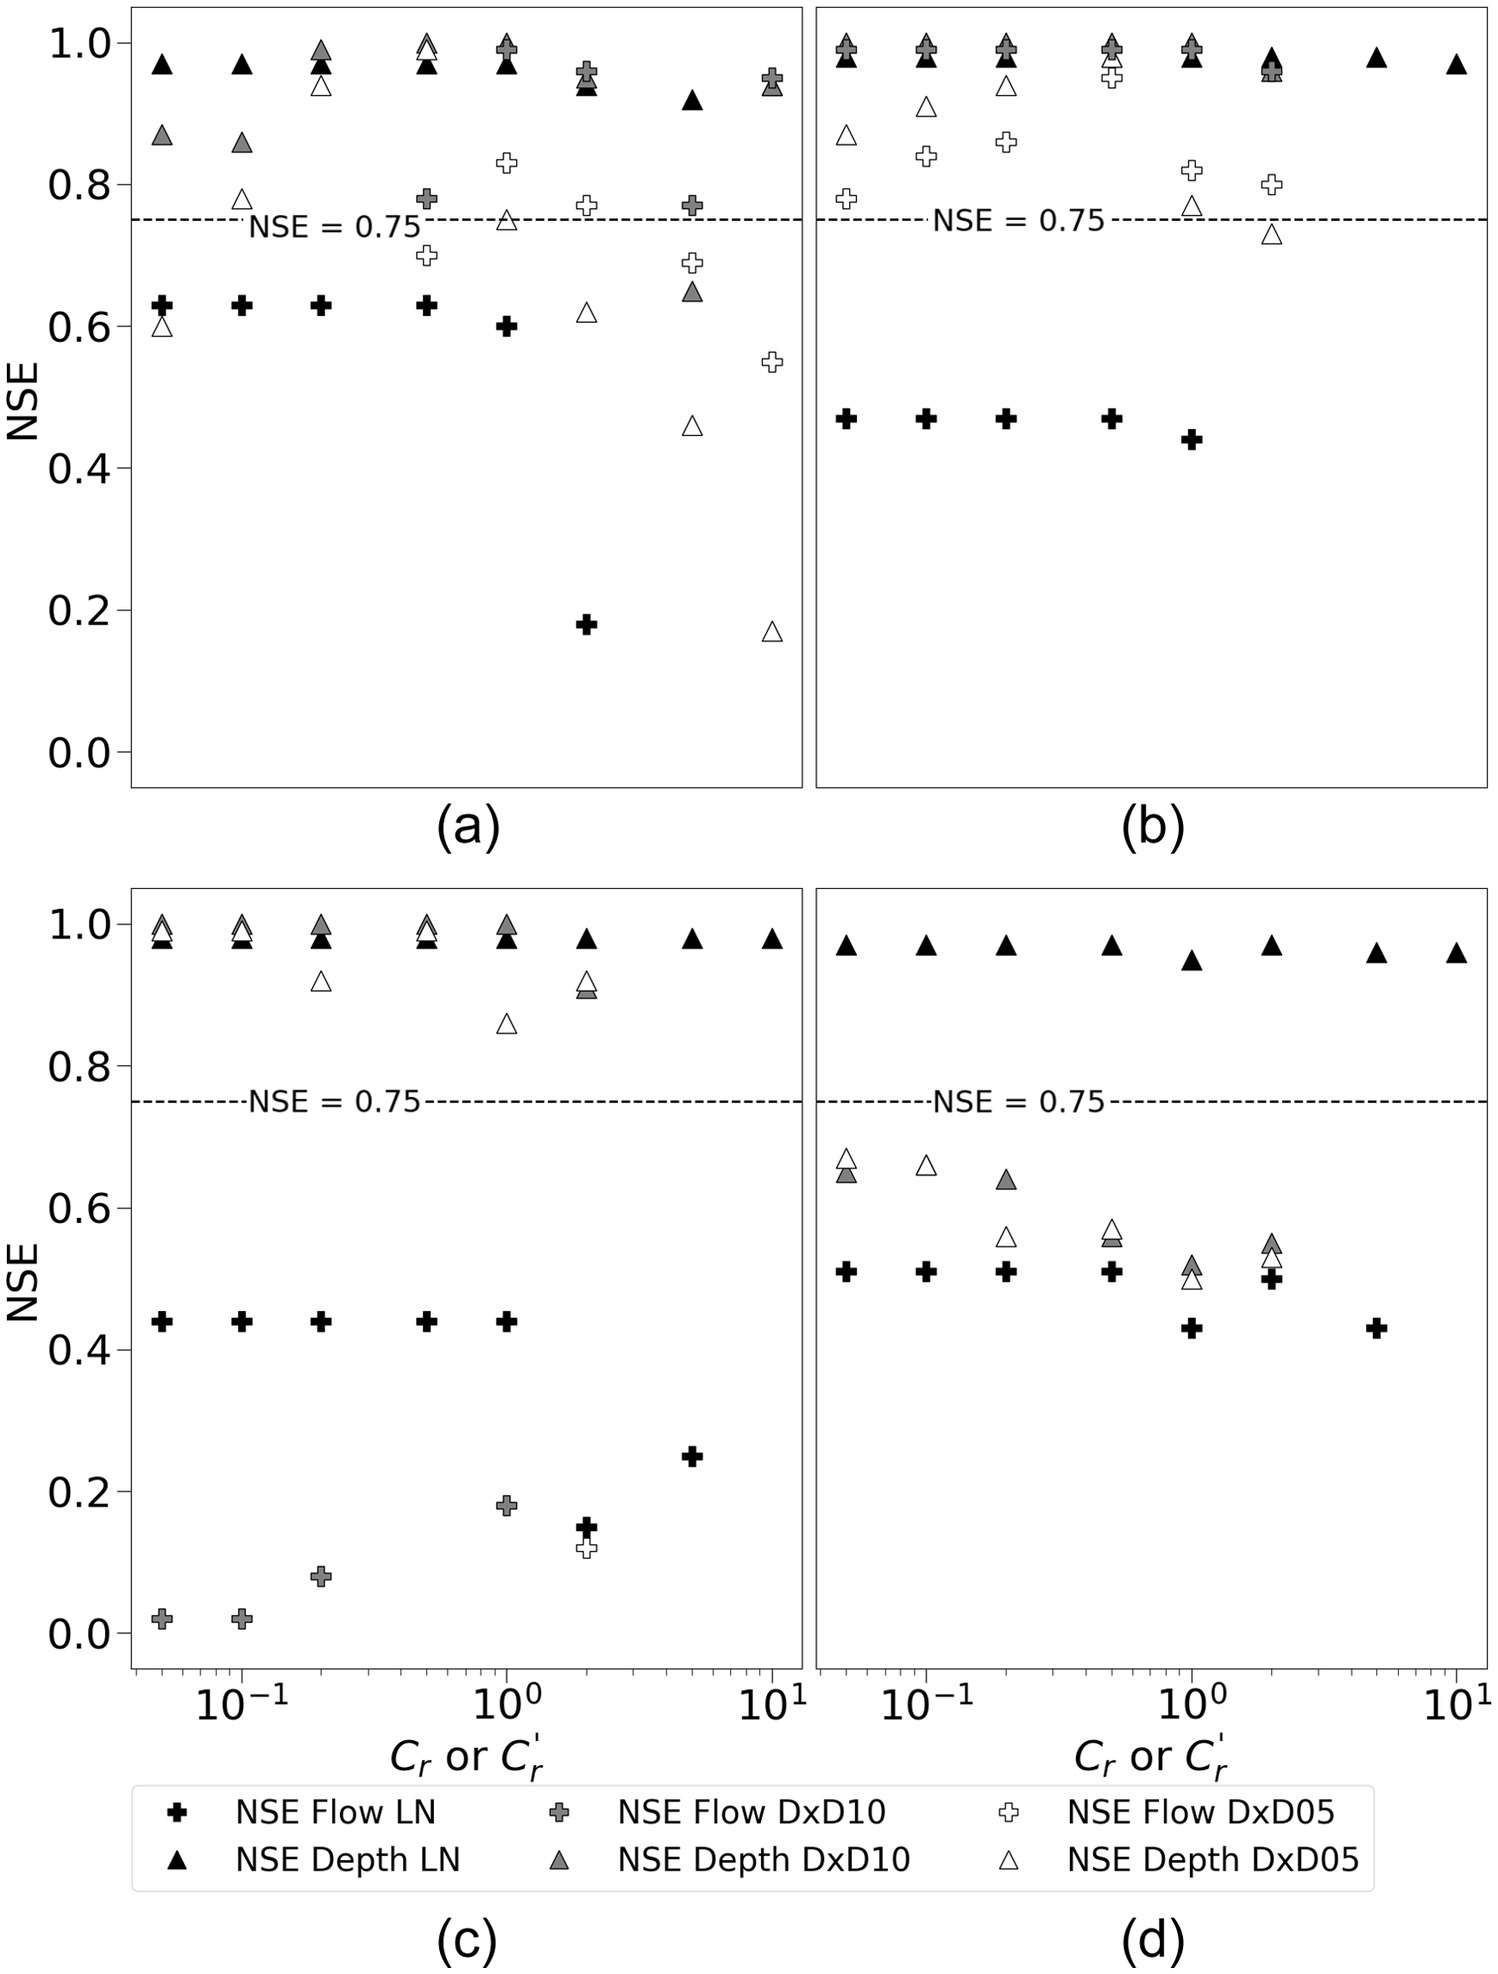
The results shown in Fig. 10 indicate that for the RMT geometry, the most stringent accuracy criterion was the NSE associated with the flow rate on Node 14. A tendency of NSE values to decrease as or exceeded unity was noticed, which was expected. Interestingly, the NSE results obtained with LN were less prone to be affected by varying time steps if the or was less than one, but a quick degradation of the results was observed for larger time steps.
Examining EXTRAN results, a favorable combination of low continuity errors and high NSE values for flow rate and flow depth at Node 14 happened for two cases, when and , both combined with DxD10. Results from the smallest spatial discretization, i.e., DxD05, were impacted by continuity errors originating in upstream reaches, which propagated throughout the tunnel. Such continuity errors could be linked to the node assembly strategy and transcritical flow conditions, which can pose challenges to implicit numerical schemes (Meselhe and Holly 1997; Sart et al. 2010). On the other hand, as also illustrated in Fig. 7, LN flow rate results were impacted by instabilities in Node 14.
Comparing the SLOT algorithm with EXTRAN, a wider range of conditions, all associated with DxD10 and Courant values between 0.05 and 1, yielded model results that are considered adequate. If the issues related to continuity errors originating in the upstream reaches of the tunnel were addressed, it is anticipated that the magnitude of the continuity errors for DxD05 would decrease, and it would be expected that the results for this finer discretization would also produce acceptable results for a similar range of time steps.
No result was considered acceptable for the two slot-based pressurization algorithms with larger wave celerity (C250S and C250) due to the numerical instabilities generated by the discontinuity in tunnel diameter in Node 14. It can be noticed that the presence of the gradual slot in the C250S generally improved the numerical instabilities for depth predictions in Node 14, indicating the advantage of a more gradual wave celerity transition in modeling results.
Conclusions
This work examined the effects of different spatial-temporal discretization and pressurization algorithms within SWMM on the simulation of rapid filling of the Richmond Tunnel in San Francisco. The simulations used tunnel geometry and rainfall data from the San Francisco Department of Public Works. They included depth and flow rate predictions at a specific location in the tunnel with a significant change in diameter. SWMM’s performance was evaluated in terms of continuity errors and numerical instabilities linked with tunnel geometry characteristics. Results were compared with the ones obtained by another hydraulic model, HAST, which was specifically created to simulate such rapid filling conditions. Less drastic changes in diameter were also considered and helped mitigate numerical instabilities. The work highlights some of the challenges for simulating mixed-flow conditions in tunnels, particularly where geometric discontinuities exist.
Regarding the pressurization algorithms, the original Preissmann slot present in SWMM 5.1 yielded representative simulation results for a wide range of time steps. This was shown both in terms of low continuity errors and good agreement between SWMM and HAST results. SWMM results obtained with EXTRAN were adequate when the parameter was equal to 0.5 and 1 combined with the DxD10 spatial discretization, and there were no conditions in which the pressurization algorithms using narrower slots did not present strong numerical instabilities at the diameter discontinuity. This indicates an open issue regarding the application of SWMM to represent mixed flows in stormwater systems with significant geometric discontinuities. The ability to use higher celerity values in modeling could be relevant in certain mixed-flow simulation scenarios, as shown by Pachaly et al. (2021a). However, the present work indicated that faster celerities, although physically justifiable in numerical modeling, may not always be feasible in SWMM, particularly when geometric discontinuities are present.
Issues in SWMM boundary conditions calculations involving diameter discontinuities may be linked to numerical instabilities. There could be several possible causes for these instabilities, maybe even linked to the node assembly strategy to enforce continuity at the junctions. This will require a deeper evaluation of SWMM’s solution algorithms, which can be the focus of future investigations. Presently, the recommendation is to carefully assess SWMM modeling results in terms of numerical instabilities or to use other modeling tools such the new SWMM 5+ (Sharior et al. 2023).
Regarding spatiotemporal discretization, the best results for SWMM and EXTRAN were obtained with the spatial discretization DxD10 and time step based on or as expected. Due to numerical instabilities and flow rate overestimation observed at the upstream reaches of the tunnel with supercritical flows, results obtained with DxD05 presented significant continuity errors. These errors could be linked to the SWMM’s numerical scheme applied to conditions of transcritical flows observed at the upstream end of the system. Potentially, the node assembly strategy adopted by the model could also be a cause for continuity errors in such flow conditions. These results are somewhat paradoxical because improvements in numerical modeling results are typically expected with finer discretization. As a results, practitioners need to exercise careful modeling setup and result analysis when SWMM is used to model rapid inflow conditions. Further adjustments to the tunnel geometry could have helped mitigate these numerical instabilities, but these were not within the scope of this work that aimed to study the effects of diameter change.
On the other hand, the original LN approach also created numerical instabilities at the diameter discontinuity and did not yield plausible HGL within the tunnel due to the coarse spatial resolution. Future studies should consider the benefits and evaluate the additional computational effort of performing SWMM modeling with finer spatial discretization, e.g., DxD05, in conditions where numerical instabilities are controlled.
Hypothetical geometries in which the diameter change was not as extreme as the real-world case were tested using the same inflow hydrographs and tunnel geometry except for the diameter change. It was shown that, at least in the tested range of inflows and diameter changes, numerical instabilities were reported with the narrower slot pressurization algorithms as long as pressurization existed at the downstream reach. To further evaluate this, more studies expanding the range of tested flows and diameter changes should be considered in SWMM.
This study highlighted that low continuity errors are insufficient to assess whether SWMM results are representative. Practitioners may find this study useful because the criteria used in this work are suitable across different models, helping them better understand the potential causes of numerical instability in modeling sewers and tunnels. With careful consideration, and considering the limitations of a one-dimensional single-phase model, SWMM can be effective for representing rapid filling inflow conditions in large sewers and tunnels.
Data Availability Statement
All data, models, or code that support the findings of this study are available from the corresponding author upon reasonable request.
Acknowledgments
The authors would like to acknowledge the support of the National Science Foundation under Grant Nos. 2049025, 2049094, and 2048607. The authors also would like to thank the San Francisco Department of Public Works for supporting this work by providing the drainage network geometry and rainfall data for the RMT watershed and tunnel.
References
Cataño-Lopera, Y. A., T. E. Tokyay, J. E. Martin, A. R. Schmidt, R. Lanyon, K. Fitzpatrick, C. F. Scalise, and M. H. García. 2014. “Modeling of a transient event in the tunnel and reservoir plan system in Chicago, Illinois.” J. Hydraul. Eng. 140 (9): 05014005. https://doi.org/10.1061/(ASCE)HY.1943-7900.0000888.
Cunge, J. A., and M. Wegner. 1964. “Intégration numérique des équations d’écoulement de barré de Saint-Venant par un schéma implicite de différences finies.” Houille Blanche 50 (1): 33–39. https://doi.org/10.1051/lhb/1964002.
EPA. 2024. “United States Environmental Protection Agency.” Accessed February 2, 2024. https://www.epa.gov/.
Geller, V. G., and J. G. Vasconcelos. 2023. “Effect of modeling setup parameters in SWMM predictions of large-scale tunnel filling.” In Proc., World Environment Water Resources Congress 2023. Reston, VA: ASCE.
Janssen, E., D. J. Wuebbles, K. E. Kunkel, S. C. Olsen, and A. Goodman. 2014. “Observational- and model-based trends and projections of extreme precipitation over the contiguous United States.” Earth’s Future 2 (2): 99–113. https://doi.org/10.1002/2013EF000185.
Leon, A. S., M. S. Ghidaoui, A. R. Schmidt, and M. H. Garcia. 2010. “A robust two-equation model for transient-mixed flows.” J. Hydraul. Res. 48 (1): 44–56. https://doi.org/10.1080/00221680903565911.
Li, J., and A. McCorquodale. 1999. “Modeling mixed flow in storm sewers.” J. Hydraul. Eng. 125 (11): 1170–1180. https://doi.org/10.1061/(ASCE)0733-9429(1999)125:11(1170).
Macchione, F., and M. A. Morelli. 2003. “Practical aspects in comparing shock-capturing schemes for dam break problems.” J. Hydraul. Eng. 129 (Mar): 187–195. https://doi.org/10.1061/(ASCE)0733-9429(2003)129:3(187).
Meselhe, E. A., and F. M. Holly Jr. 1997. “Invalidity of Preissmann scheme for transcritical flow.” J. Hydraul. Eng. 123 (7): 652–655. https://doi.org/10.1061/(ASCE)0733-9429(1997)123:7(652).
Muller, K. Z., J. Wang, and J. G. Vasconcelos. 2017. “Water displacement in shafts and geysering created by uncontrolled air pocket releases.” J. Hydraul. Eng. 143 (10): 04017043. https://doi.org/10.1061/(ASCE)HY.1943-7900.0001362.
Nash, J. E., and J. V. Sutcliffe. 1970. “River flow forecasting through conceptual models Part I—A discussion of principles.” J. Hydrol. 10 (3): 282–290. https://doi.org/10.1016/0022-1694(70)90255-6.
Pachaly, R. L., J. G. Vasconcelos, and D. G. Allasia. 2021a. “Surge predictions in a large stormwater tunnel system using SWMM.” Urban Water J. 18 (8): 577–584. https://doi.org/10.1080/1573062X.2021.1916828.
Pachaly, R. L., J. G. Vasconcelos, D. G. Allasia, and J. P. P. Bocchi. 2021b. “Evaluating SWMM capabilities to simulate closed pipe transients.” J. Hydraul. Res. 60 (1): 74–81. https://doi.org/10.1080/00221686.2020.1866695.
Pachaly, R. L., J. G. Vasconcelos, D. G. Allasia, R. Tassi, and J. P. P. Bocchi. 2020. “Comparing SWMM 5.1 calculation alternatives to represent unsteady stormwater sewer flows.” J. Hydraul. Eng. 146 (7): 04020046. https://doi.org/10.1061/(ASCE)HY.1943-7900.0001762.
Ridgway, K., and G. J. Kumpula. 2008. “Surge modeling in sewers using alternative hydraulic software programs.” J. Water Manage. Model. 6062 (1): 155–164. https://doi.org/10.14796/jwmm.r228-10.
Roesner, L. A., J. A. Aldrich, and R. E. Dickinson. 1988. Storm water management model user’s manual version 4: EXTRAN addendum. Washington, DC: US EPA.
Rossman, L., and M. Simon. 2022. Addendum to the storm water management model reference manual. Volume II—Hydraulics. Washington, DC: US EPA.
Rossman, L. A. 2017. Storm water management model reference manual Volume II—Hydraulics. Washington, DC: US EPA.
Sart, C., J. P. Baume, P. O. Malaterre, and V. Guinot. 2010. “Adaptation of Preissmann’s scheme for transcritical open channel flows.” J. Hydraul. Res. 48 (4): 428–440. https://doi.org/10.1080/00221686.2010.491648.
Sharior, S., B. R. Hodges, C. Yu, E. D. Tiernan, E. Jenkins, G. Riaño-briceño, C. E. Davila-hernandez, and A. Lokhandwala. 2023. SWMM5+ user manual version 1.0. Austin, TX: Texas Data Repository.
Sjöberg, A. 1982. “Sewer network models DAGVL-A and DAGVL-DIFF.” In Urban stormwater hydraulics and hydrology, 127–136. Littleton, CO: Water Resources.
Song, C. C. S., J. A. Cardle, and K. S. Leung. 1982. “Transient mixed-flow models for storm sewer systems.” J. Hydraul. Eng. 109 (11): 360–367. https://doi.org/https://doi.org/10.1061/(ASCE)0733-9429(1983)109:11(1487).
Trindade, B. C., and J. G. Vasconcelos. 2013. “Modeling of water pipeline filling events accounting for air phase interactions.” J. Hydraul. Eng. 139 (9): 921–934. https://doi.org/10.1061/(ASCE)HY.1943-7900.0000757.
Vasconcelos, J. G., Y. Eldayih, Y. Zhao, and J. A. Jamily. 2018. “Evaluating storm water management model accuracy in conditions of mixed flows.” J. Water Manage. Model. 26 (Jul): 1–10. https://doi.org/10.14796/JWMM.C451.
Vasconcelos, J. G., H. Gheith, R. L. Pachaly, M. Abdel-Latif, and R. Herr. 2022. “Multiphase rapid filling conditions of tunnel system in Columbus, Ohio.” J. Water Manage. Model. 30 (Jan): 6. https://doi.org/10.14796/JWMM.C479.
Vasconcelos, J. G., and S. J. Wright. 2007. “Comparison between the two-component pressure approach and current transient flow solvers.” J. Hydraul. Res. 45 (2): 178–187. https://doi.org/10.1080/00221686.2007.9521758.
Vasconcelos, J. G., and S. J. Wright. 2009. “Investigation of rapid filling of poorly ventilated stormwater storage tunnels.” J. Hydraul. Res. 47 (5): 547–558. https://doi.org/10.3826/jhr.2009.3390.
Vasconcelos, J. G., and S. J. Wright. 2016. “Anticipating transient problems during the rapid filling of deep stormwater storage tunnel systems.” J. Hydraul. Eng. 143 (3): 06016025. https://doi.org/10.1061/(ASCE)HY.1943-7900.0001250.
Vasconcelos, J. G., S. J. Wright, and P. L. Roe. 2006. “Improved simulation of flow regime transition in sewers: Two-component pressure approach.” J. Hydraul. Eng. 132 (Jun): 553–562. https://doi.org/10.1061/(ASCE)0733-9429(2006)132:6(553).
Wang, J., and J. G. Vasconcelos. 2020. “Investigation of manhole cover displacement during rapid filling of stormwater systems.” J. Hydraul. Eng. 146 (4): 04020022. https://doi.org/10.1061/(ASCE)HY.1943-7900.0001726.
Wiggert, D. 1972. “Transient flow in free-surface, pressurized systems.” J. Hydraul. Div. 98 (1): 10–27. https://doi.org/https://doi.org/10.1061/JYCEAJ.00031.
Wright, D. B., C. D. Bosma, and T. Lopez-Cantu. 2019. “US hydrologic design standards insufficient due to large increases in frequency of rainfall extremes.” Geophys. Res. Lett. 46 (14): 8144–8153. https://doi.org/10.1029/2019GL083235.
Information & Authors
Information
Published In

Journal of Hydraulic Engineering
Volume 151 • Issue 1 • January 2025
Copyright
This work is made available under the terms of the Creative Commons Attribution 4.0 International license, https://creativecommons.org/licenses/by/4.0/.
History
Received: Feb 22, 2024
Accepted: Aug 13, 2024
Published online: Sep 28, 2024
Published in print: Jan 1, 2025
Discussion open until: Feb 28, 2025
ASCE Technical Topics:
Authors
Metrics & Citations
Metrics
Citations
Download citation
If you have the appropriate software installed, you can download article citation data to the citation manager of your choice. Simply select your manager software from the list below and click Download.