Experimental Tests of Lateral Bedload Transport Induced by a Yawed Submerged Vane Array in Open-Channel Flows
Publication: Journal of Hydraulic Engineering
Volume 150, Issue 6
Abstract
This work proposes the use of an array of yawed porous vanes to control the lateral bedload transport by locally steering bedform migration and maximize the amount of sediments redirected toward a potential sediment extraction system or bypass channel. A laboratory experiment was conducted in a quasifield-scale channel with an array of permeable vanes installed on one side, in live-bed conditions under bedload dominant regime, i.e., negligible suspended load. A baseline experiment without vanes was also performed for comparison. The evolution of migrating bedforms of different scales was tracked in space and time using a high-resolution, state-of-the-art laser scanning device. The bedload transport rate in the streamwise direction was first calculated using bedforms’ geometry and migration velocity, and then spatially distributed over the entire monitored area using a new Eulerian-averaged grid-mapping method. This allowed us to introduce a new methodology to estimate the lateral bedload transport using control volume theory and applying mass conservation. Quantitative assessments of lateral bedload transport along the channel yield consistent results, suggesting that the vanes effectively move sediments laterally as intended. Under the investigated setup, the maximum lateral sediment transport rate ranges from 9% to 18% of the whole domain-averaged streamwise transport rate. The developed methodology also allowed to identify the location where sediment capture could be maximized for the given vane spatial distribution.
Practical Applications
In river engineering, in-stream structures are used to control flow and sediment movement to prevent erosion, intake clogging, and habitat disruption. Submerged vanes are small, angled structures that are installed to redirect sediments toward a preferred direction by creating secondary flow circulations. This study tests experimentally an array of porous vanes in an open channel to measure and quantify the lateral displacement of sediment. Porous plates were selected to minimize local scour and anchoring requirements while directing flow, bedforms, and sediment laterally. The amount of sand moved laterally is measured by comparing the streamwise bedform transport within and outside of the vane array. The proposed vane array is part of a modular hydrosuction sediment bypass system being developed for low-head dams, which features inlets to collect coarse sediments and siphon them over the dam via a slurry conduit. The vane array is meant to be installed upstream of the collector to increase the lateral transport of coarse sediment toward the intake structures. Porous elements can potentially be replaced by vegetation and log structures for nature-based alternatives.
Introduction
Numerous solutions have been studied and developed over the years to control rivers to ensure flood protection, channel stabilization, and navigation. The management of sediment transport is one of these forms of control. Multiple designs have been proposed in the past to steer sediments toward a preferred direction and dictate the local river morphology. Among these designs, in-stream submerged vanes were first proposed by IIHR-Hydroscience and Engineering at the University of Iowa (Odgaard and Wang 1991a, b), offering engineering solutions to stream bank erosion (Odgaard and Kennedy 1983; Dey et al. 2017), channel intake sedimentation (Barkdoll et al. 1999; Neary et al. 1999; Gumgum and Cardoso 2023), and scouring at hydraulic structures foundations (Ghorbani and Kells 2008). These structures are short, vertical, submerged objects installed with specific orientations with respect to the approaching flow to generate a pressure imbalance between the two sides of the vane. This, in turn, imposes a lift force on the flow, which generates a secondary circulation that alters the direction and magnitude of the bed shear stress, sweeping sediments laterally. Other more traditional strategies include the use of groynes (or spur dykes) which are hydraulic structures made of rocks, wood, or concrete, extending from the side bank into the main channel to divert the main flow and protect banks, improve navigability, and create stream corridor restoration projects (Uijttewaal 2005; Duan et al. 2009; Khosronejad et al. 2014, 2015, 2018; Han et al. 2022, among others).
In previous work by Lee et al. (2022a), the authors proposed the use of permeable vanes as a proof of concept to maximize the steering effect on the sediments while limiting the local scour and the anchoring requirements. Intuitively, the scour occurring around submerged porous structures is typically lower than the one induced by solid obstacles, which, conversely, induces intense vortical structures shedding at the edges. Local scour reduction for porous structures was also observed by Ismail et al. (2021) while studying engineered log jams as a river restoration measure. Porous objects can thus properly model submerged vegetation elements in case a more nature-based solution is sought for sediment control, as demonstrated by Ismail et al. (2021), or simply to study the impact of vegetation on river morphodynamics (Bennett et al. 2002; Follett and Nepf 2012; Van Dijk et al. 2013; Schalko et al. 2019; Redolfi et al. 2021). The adoption of permeable vanes instead of solid ones in Lee et al. (2022a) was also motivated by experimental observations of sediment erosion and deposition patterns downstream of submerged marine hydrokinetic turbines (MHK), which are often modeled as porous actuator disks (Göçmen et al. 2016; Kang et al. 2014; Musa et al. 2018a; Sandoval et al. 2021). A small yaw angle imposed on the rotor, representing a slight misalignment of the turbine axis with respect to the flow direction, was found to induce a cross-stream component of the drag force able to steer the turbine wake (Bastankhah and Porté-Agel 2014; Musa et al. 2020; Dou et al. 2019; Modali et al. 2021). Preliminary experiments discussed in Lee et al. (2022a) provided basic guidelines for the yaw angle, vane aspect ratio, streamwise and spanwise spacing, porosity effect, and local scour estimates, all devoted to optimizing the sediment spanwise flux while limiting the local scour.
Because of the vast parameter space to explore and the need to achieve rapidly converging results, experiments in Lee et al. (2022a) were performed using vanes in critical mobility conditions. The limitation is particularly stringent because the performances of the vanes were not assessed in the occurrence of migrating bedforms and active bedload transport, which better represent the morphodynamics of natural rivers. Critical mobility also limits the spatial extent of scour and deposition processes, preventing the study of nonlocal effects, as those observed by Musa et al. (2018b, 2019) and Redolfi et al. (2021). In particular, the potential distortion of the mean bed and spanwise modulation of migrating bedforms’ velocities had to be investigated at the scale of the vane array, under live-bed conditions, and in a larger channel beyond the small laboratory flume used by Lee et al. (2022a). In this new study proposed herein we then conducted a series of experiments in a larger laboratory flume under migrating bedforms, using an array of vanes similar to those employed by Lee et al. (2022a). In particular, we conserved the porosity and adapted their size, aspect ratio, and submergence to the flume geometry and hydraulics. These experiments are critical to verify scalability with respect to both the channel, the vane, and the array sizes. During the experiments, high-resolution bed surface elevation data, acquired by a state-of-the-art laser scanning device (Hill et al. 2014), was used to quantify individual bedform geometries and the corresponding migration velocity through a specialized tracking method (Lee et al. 2021).
This set of experiments was conceived as part of a broader ongoing project that aims at evaluating new alternative sediment capture and bypass strategies to mitigate reservoir sedimentation issues (Fan and Morris 1992a, b; Morris and Fan 1998). Numerous studies have in fact highlighted that since 1990, the global reservoir storage depletion has outpaced its creation, posing a significant challenge to water reliability for human population (Annandale et al. 2016; Randle et al. 2021; Schmitt et al. 2019). In addition, the progressive reduction of the available impounded volume caused by sediment buildup has major consequences for hydropower development and sustainability, and water resources management in general (Annandale 1987; Podolak and Doyle 2015). With the increasing deployment of available, although intermittent, renewable resources on the grid, like solar and wind, there is a need for energy storage, which can be addressed by hydropower reservoirs and pumped storage technology (Hauer et al. 2018; Kougias et al. 2019; Hansen et al. 2022; DOE 2022). Nevertheless, the preclusion of the natural continuity of sediment transport in rivers introduces also serious environmental issues upstream, around, and downstream of the reservoir (Brandt 2000; Magilligan and Nislow 2005; Hazel et al. 2006; Grams et al. 2007; Schmidt and Wilcock 2008; Best 2019; Winton et al. 2019; Wild et al. 2019). Given these challenges, it is imperative to adopt sustainable sediment management strategies at reservoirs, addressing both water management and environmental concerns (Schleiss et al. 2016; Randle et al. 2021; Li et al. 2022). Several remedies exist to remove sediments that have already accumulated in the reservoir, either through complex and costly mechanical excavation (e.g., dredging or dry excavation; Herbich 2000; Kantoush et al. 2021; Randall 2022) or via hydraulic evacuation using low-level gates (e.g., drawdown flushing, pressure flushing, and turbidity current venting; Lai and Shen 1996; Sumi 2008; De Cesare et al. 2001; Jenzer Althaus et al. 2015; Chamoun et al. 2016; Xu et al. 2023; Lai et al. 2024). Alternatively, one prospective solution involves the continuous extraction of sediment from upstream the reservoirs and its redirection downstream of dams through designated sediment passages, often referred to as “bypasses” (Sumi et al. 2004; Auel and Boes 2011; Auel 2014; Ohori et al. 2018; Boes et al. 2019; Facchini et al. 2024). These solutions prevent the sediment from entering the reservoir and would ideally follow the natural pattern of the sediment flow through the river, perhaps representing a better solution from an environmental perspective.
To optimize the bypass strategy and enhance sediment collection efficiency, we propose the implementation of a strategically positioned yawed porous submerged vane array. These structures would guide bedload transport alongside the stream and concentrate it near a specific collection area [see the conceptual schematic in Fig. 1(b)]. To maximize the extraction, the collector must be placed where the lateral movement of sediments is maximized. However, there are no standardized methods to quantify the lateral mass flux of sediments from bathymetric data, to the knowledge of the authors. Therefore, in order to identify the area of maximum lateral displacement and quantify the spatial variability of the streamwise mass flux, we developed a methodology to estimate the percentage of lateral sediment transport, based on the quantification of streamwise transport. We first identify each individual bedform on the streamwise transects at consecutive times and estimate its travel distance, thus operating in a Lagrangian framework (Zomer et al. 2021; Lee et al. 2021). Then we switch to a Eulerian observational approach, leveraging on the long time (36 h) monitoring of bed surface evolution and conditionally average all bedform characteristics and associated transport on a regular grid. The Eulerian-average grid mapping algorithm allowed us to calculate the time-averaged, streamwise bedload transport rate on a two-dimensional X–Y plane (i.e., longitudinal–lateral directions). Subsequently, the lateral bedload sediment transport was quantified based on the control volume theory in accordance with mass conservation principles. The result provides a quantification of sediment lateral redirection in a Eulerian reference frame, which assesses the efficiency of the installation of yawed submerged vanes. In order to validate our methods and results, a baseline experiment without vanes was performed using the same hydraulic and sediment transport conditions as a reference case.
The article is structured as follows. First, the experimental setup is presented. Second, the detailed methodology of bedform identification, Eulerian-average mapping algorithm, and lateral bedload transport quantification are described. Third, the quantification of vane array effects on streamwise and lateral bedload transport rates are presented and discussed. Finally, key points and implications are summarized.
Experimental Setup
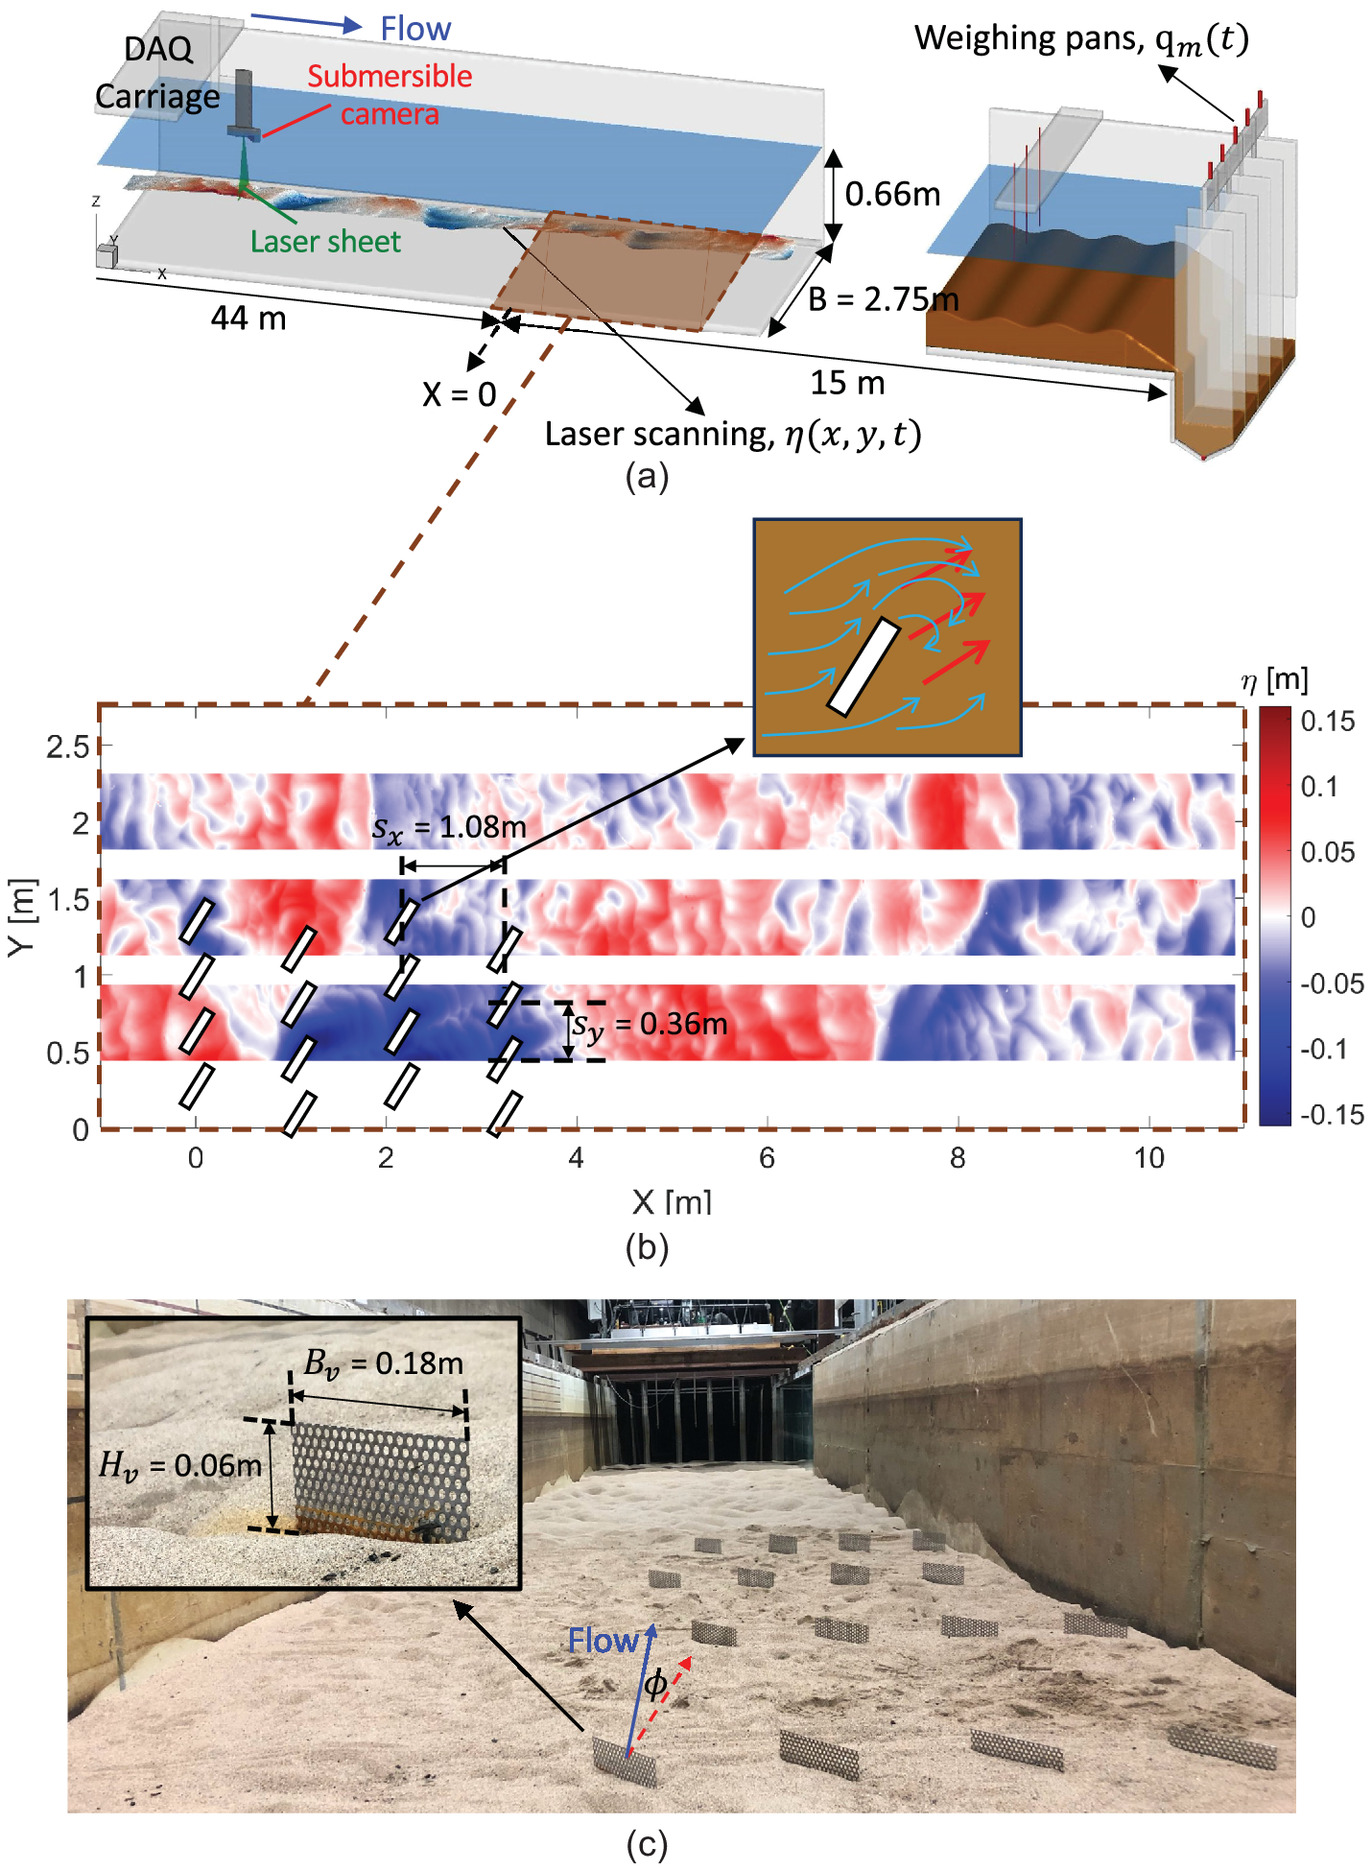
The experiments were carried out in the Main Channel at the Saint Anthony Falls Laboratory (SAFL), University of Minnesota [Fig. 1(a)]. The flume is 85 m long, 2.75 m wide (), and 1.8 m deep, filled with a 0.4 m thick sediment layer consisting of nearly uniform quartz sand with median grain size () of 0.42 mm, in which sediment grain size ranges from to [see Fig. S1 in Musa et al. (2018b) for more details on the grain size distribution]. The water used in the experiments was directly withdrawn from the adjacent Mississippi River, controlled by a calibrated sluice gate at the upstream end of the facility. The water depth was adjusted by a tailgate at the channel exit.
Two experiments were conducted with and without a vane array to quantify how much hydraulic structures can effectively redirect sediment in the lateral direction [Figs. 1(b and c)]. We used a porous vane that is wide (), tall above the bed (), and oriented at a 45° angle (), resulting in the projected vane width perpendicular to the flow direction corresponding to [see details from the inset in Fig. 1(c)]. The porosity of the vane was 40%, defined as the ratio of opening to total area (). The opening area consists of staggered circular holes with a diameter of 6.4 mm, which is 3.5% of and 11% of . Lee et al. (2022a) conducted a series of wind tunnel tests using plates with different porosity to investigate the effects on the exerted drag, observing that the drag coefficient was linearly proportional to the porosity. The width-to-height ratio () is 3. Sixteen vanes were used to configure an array, spaced () and () in the stream- and span-wise directions, respectively. The first row was located at downstream from the inlet. The vane array was installed on the right-hand side of the channel when facing downstream and designed to transport sediment to the left-hand side of the channel. The dimensions of the individual vane and the array configuration were based on a series of experiments in an earlier study by Lee et al. (2022a). In Lee et al. (2022a), parameter spaces associated with effective lateral sediment flux directionality were extensively investigated under the critical mobility condition, including vane width, height, orientation angle, porosity, and vane spacing in an array.
We continuously measured two-dimensional (2D) spatiotemporal bed surface evolution data using a computer-controlled laser scanning device for 36 h for each experiment. The bed surface elevation was reconstructed by capturing 1 mm thick projected line laser on the bed surface, while the entire measuring system travels downstream. Three regions of the channel bed evolution were sequentially measured within a scanning domain that was 12 m long (3.7 times the vane array length ) and 0.5 m wide. The streamwise extent started 1 m upstream of the first vane row. The spanwise center of each scan region corresponded to , , and , and the total spanwise extent covered 55% of the entire channel width. The temporal resolution of the scans was 376 s, defined as the elapsed time between two consecutive scans at the same location. To resolve and capture the geometry and kinematics of migrating bedforms, the displacement of bedforms between consecutive scans had to be limited. We operated at moderate bedload transport conditions with negligible suspended load (). Here, and are the bed shear velocity and the settling velocity, respectively. The settling velocity is estimated as (Engelund and Hansen 1967), and the drag coefficient is computed by a method suggested by Cheng (2009). In this hydraulic condition, bedforms migrate approximately 9 cm () between consecutive scans, where is the bedform migrating velocity introduced hereafter.
Five identical weighing pans spanning the entire channel width, each with an opening 0.54 m, were located 4 m downstream of the test section and approximately 25 m upstream of the tailgate to measure bedload transport. All bedforms completed their migration and fell into the weighing pans at the end of the test section. The temporal changes in the accumulated submerged sediment weight were measured by load cells at each pan [Fig. 1(a)]. When the accumulated submerged sediment weight reached the prescribed threshold of 196.2 N (20 kgf), all sediments were automatically dumped into a recirculation system and transported back to the upstream end of the channel, allowing continuous bedload transport measurement and steady boundary conditions. The temporal resolution of the weighing pan measurement was 1.2 s. The measured sediment weight was converted into volume , where is the channel porosity, assumed to be 0.3; and and are the sediment and water densities, respectively. Experimental conditions, including morpho-hydrodynamic parameters and vane configurations, are summarized in Table 1.
| Variable | Parameters | Value | Unit |
|---|---|---|---|
| Hydraulics | Flow discharge () | 1.038 | |
| Channel width () | 2.75 | m | |
| Water depth above the bed () | 0.66 | m | |
| Hydraulic radius () | 0.45 | m | |
| Cross-sectional velocity () | 0.57 | ||
| Water surface slope () | 0.041 | % | |
| Froude number () | 0.22 | — | |
| Reynolds number () | — | ||
| Shear velocity () | 0.042 | ||
| Sediment | Median grain size () | m | |
| Settling velocity () | 0.063 | ||
| Particle Reynolds number | 34.63 | — | |
| Shields number () | 0.26 | — | |
| Suspension number () | 0.67 | — | |
| Bedform | Averaged height () | m | |
| Averaged length () | 0.35 | m | |
| Averaged migration velocity () | |||
| Pan-measured averaged bedload transport () | |||
| Laser-measured streamwise bedload transport () | |||
| Vane | Width () | 0.18 | m |
| Height () | 0.06 | m | |
| Orientation angle () | 45 | degrees | |
| Projected width () | 0.13 | m | |
| Row spacing () | 1.08 | m | |
| Lateral spacing () | 0.36 | m |
The experiment procedures are described as follows. We started the experiments with a flatbed and allowed the bed surface to evolve for approximately 54 h to ensure the dynamical equilibrium and uniform flow conditions. The data acquisition for the baseline case (without the vane array) started after insignificant changes were observed in bedload transport and water surface slope measurements. After measuring the bed surface evolution and bed load transport for 36 h in the baseline case, we locally flattened the channel bed in a region where the vane array was installed. We carried out another experiment under the same hydraulic condition with the vane array for 36 h to quantify the lateral sediment dynamics.
Analysis Methods
Bedform Tracking
Bedform kinematics and morphology are identified using a bedform tracking algorithm developed by Lee et al. (2021) with high-resolution laser scanning bathymetry data. The algorithm first detects every concave downward shape from the time series of bathymetry data and finds the locations of the bedform crest and trough based on sign changes of the spatial gradient in longitudinal bed elevation profiles. Next, the corresponding bedform characteristics, such as bedform migration velocity, , and bedform area, , can be estimated by tracking the locations of the identified bedform crests and troughs in time series. More details on the bedform geometry extraction and tracking procedure are reported in Lee et al. (2021).
Streamwise Bedload Transport Calculation and Eulerian-Averaging Method
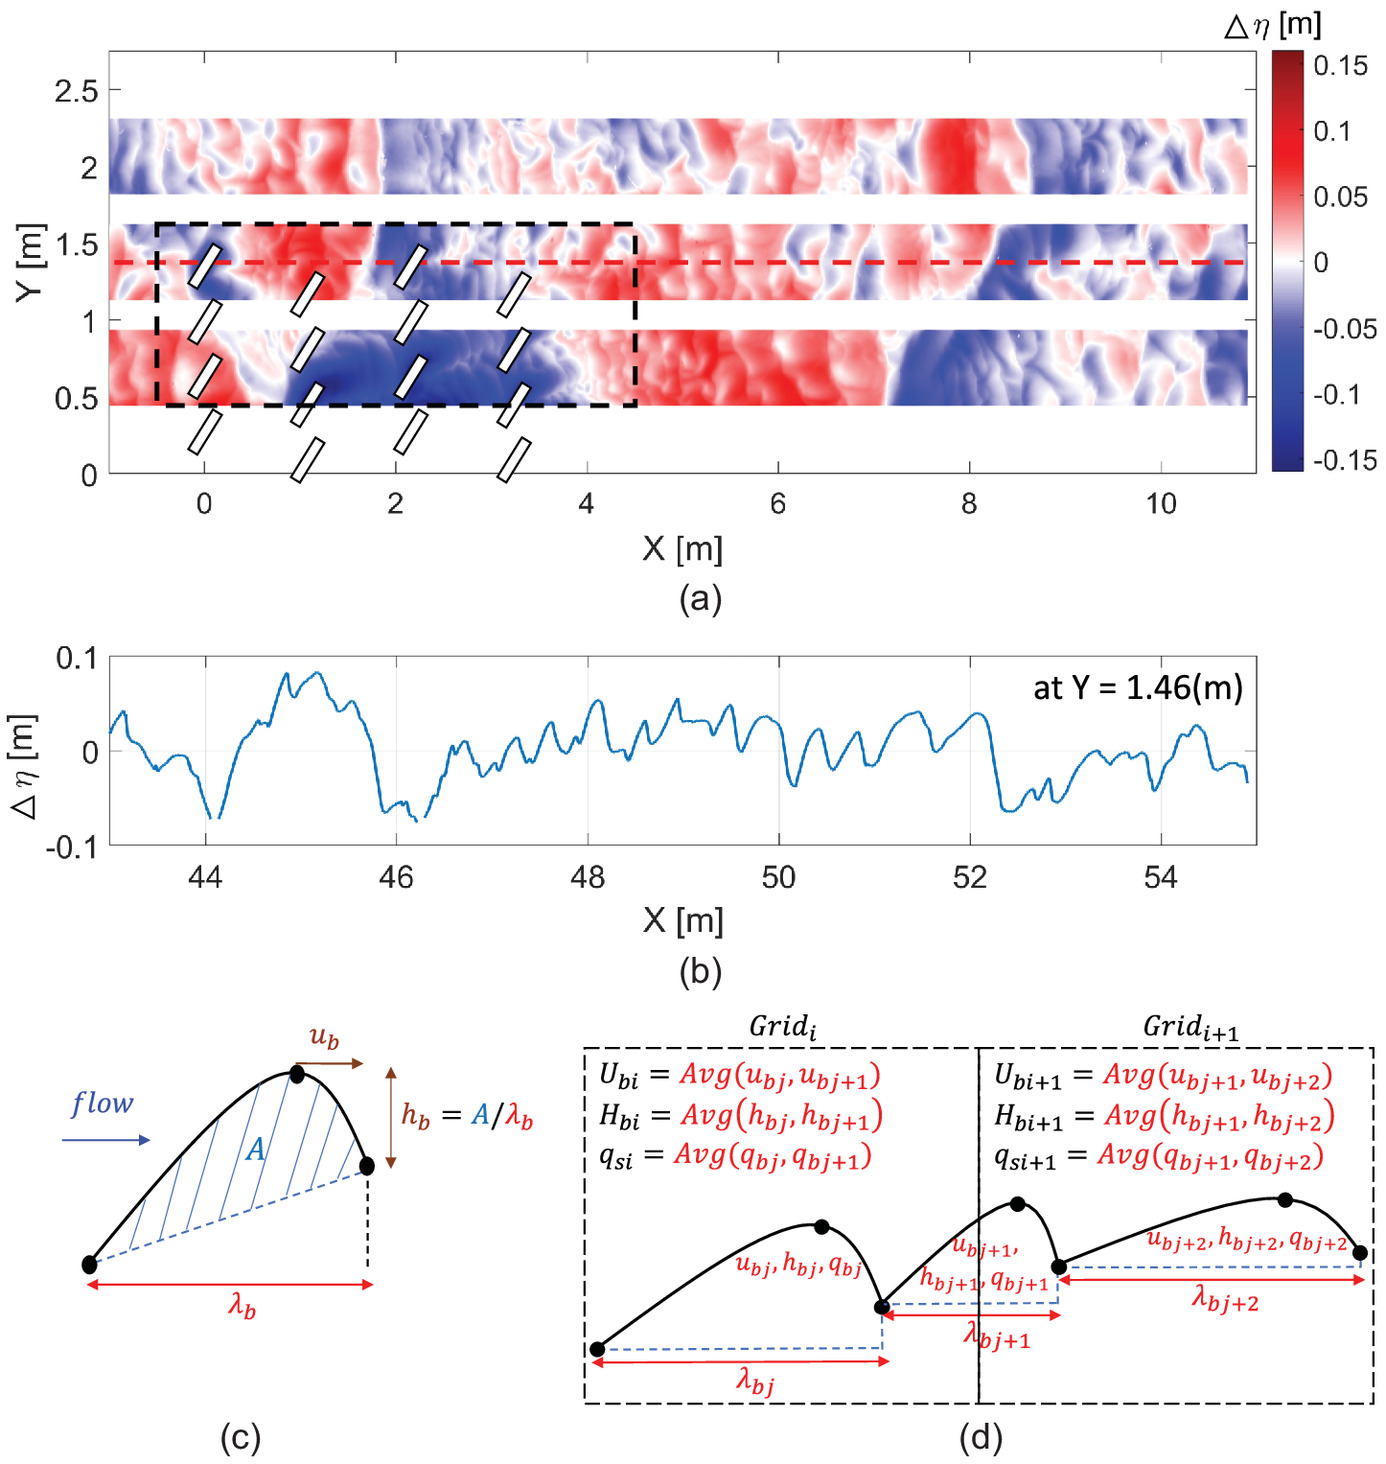
Fig. 2(a) shows an instantaneous two-dimensional field of bed elevations, and the transect-view elevation profile along the red dashed line is presented in Fig. 2(b), which clearly shows a wide range of coexisting migrating bedforms of different scales. To ensure capturing all small-scale bedform information, the representative bedform height, , was estimated by dividing the bedform area, , to the bedform length, , which is defined as the distance between the upstream and downstream troughs [Fig. 2(c)]. The information of the individual bedform migration velocity, , and the bedform height, , are set to be stored at the crest points of each individual bedform to represent the bedform migration [Fig. 2(d)]. The streamwise bedload transport rate, , was calculated according to the equation (Simons et al. 1965):where = porosity of the sediment substrate. Note that we use a consistent porosity value to convert directly measured sediment weight by the weighing pans into volumetric flux. All the findings and validation discussed later are independent of . In this study, we proposed a new Eulerian-average grid mapping algorithm to convert the discrete bedform characteristic data into regular grids. Following the Lagrangian approach that was applied to investigate individual bedform migrations [the bedform tracking method proposed by Lee et al. (2021, 2022a)], the Eulerian-average method allowed the calculation of time-averaged bedform transport characteristics on the 2D (X–Y) plane by monitoring bed surface evolution for a substantially long period (36 h), in which statistical convergence was achieved. In the Eulerian-average mapped grids, we calculated the Eulerian-averaged migration velocity, , bedform height, , and streamwise bedload transport rate, , among all the bedforms inside each grid at each specific time instant (t):where = Eulerian-averaging operator. Note that bedforms that cover any part of the grid must be included when performing the Eulerian-average. We can simply follow the bedform length, , as the reference region to identify how many grids were occupied by each bedform and how many incoming or outgoing bedforms would need to be included in the calculation for each grid. As an example shown in Fig. 2(d), the center bedform () extends to both the left () and the right () grid. Therefore, both the left and the right grid should account for the contribution from the center bedform in the Eulerian-average. The quantities, , obtained here are instantaneous, , which can be used to calculate the time-averaged quantities, , where represents the time-averaging operator. This operation accounts for bedform variability and scale-dependent migration velocity in the estimate of bedform transport (Lee et al. 2022b, 2023).
(1)
(2)
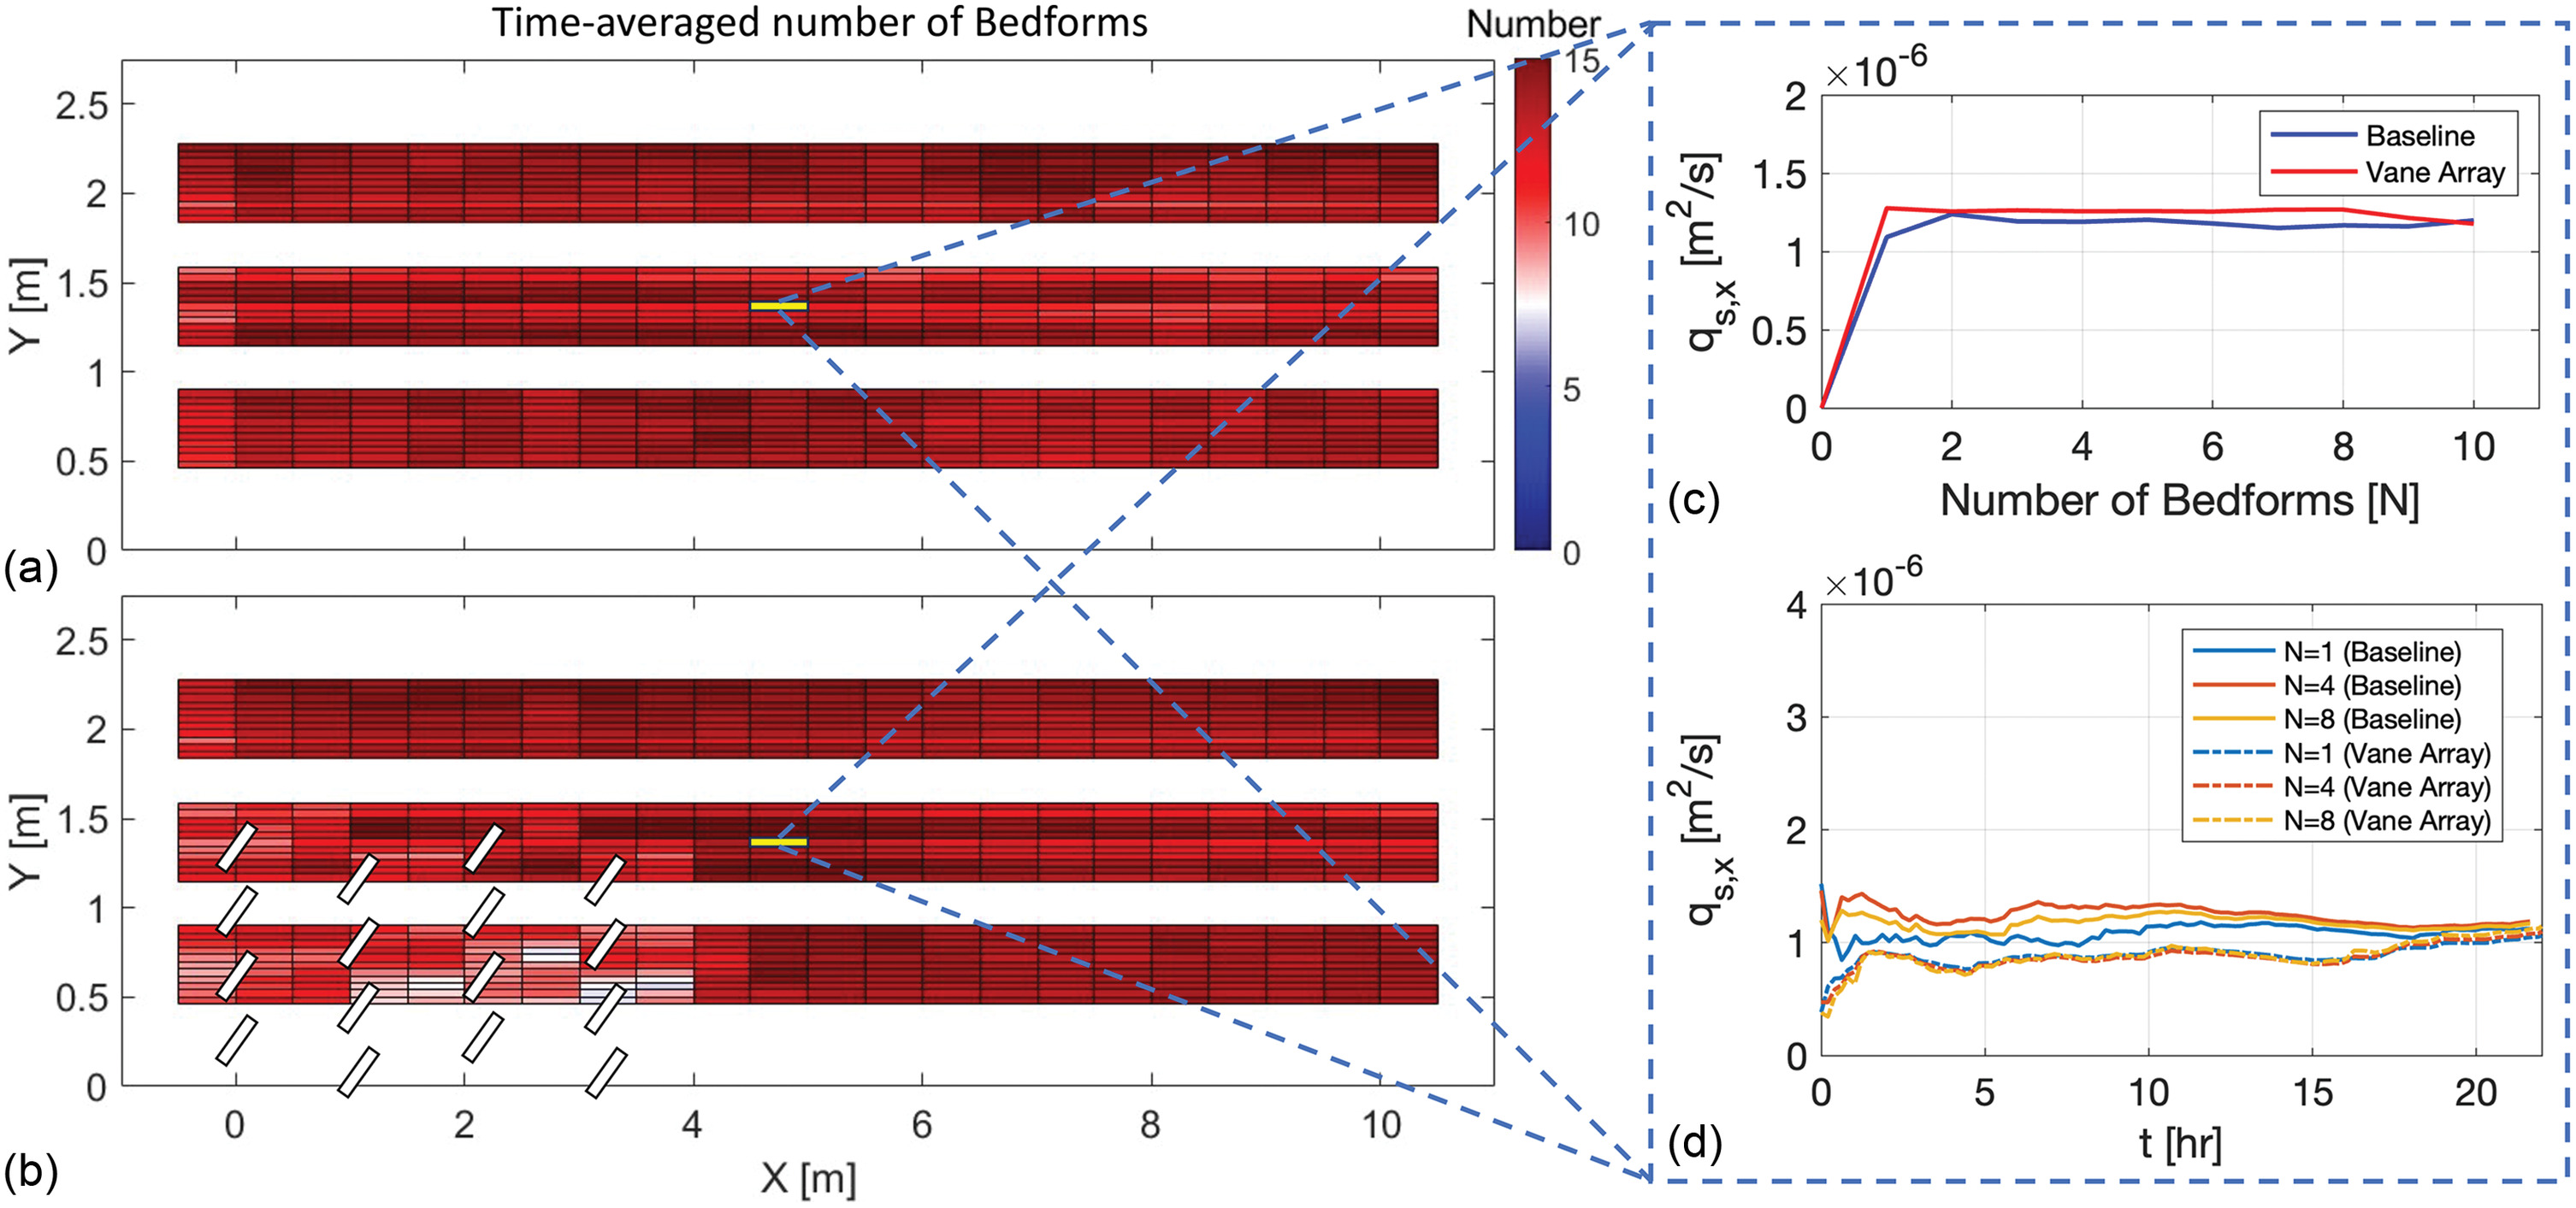
To design the Eulerian-average window size, we need to ensure a sufficient number of bedforms were captured in each grid to reach convergence in the quantities, such as , while at the same time optimizing the window size to obtain the best resolution of the Eulerian-average values. Following this discussion, we set the Eulerian-average window to be 0.5 m long and 0.04 m wide and check the numbers of bedforms in each grid with and without the submerged vanes. Fig. 3(a) shows that in the baseline case, since no in-stream structure exists to interfere with the flow and redirect bedforms, bedform numbers are generally uniform across the whole domain, ranging from 10 to 15 in each grid. In Fig. 3(b), the presence of submerged vanes reduces the flow within the array and exerts additional spatial variability on both the flow field and the bed, leading to relatively fewer bedforms captured within the array. However, the selected size of the grid window from baseline data, still allowed to capture at least eight bedforms per grid, per time instant, within the array. A convergence analysis [Fig. 3(c)] indicates that , locally averaged within the center grid in the baseline case (blue line) and the vane array case (red line), quickly converged when the grid included more than three bedforms at each time instant over 21 h because the substantially long period of the measurement time ensures convergence of the time-averaged values. In Fig. 3(d), lines representing one, four, and eight bedforms included in the Eulerian-average under the baseline case (solid lines) and the vane array case (dash lines) both converged when averaging over 20 h, which proves that the designed Eulerian-average window size is acceptable to ensure a converging average of local bedform transport rate. Note that this Eulerian-averaging provides a fairly robust measure of bedform transport in a specific location at a specific time.
Lateral Bedload Transport Quantification
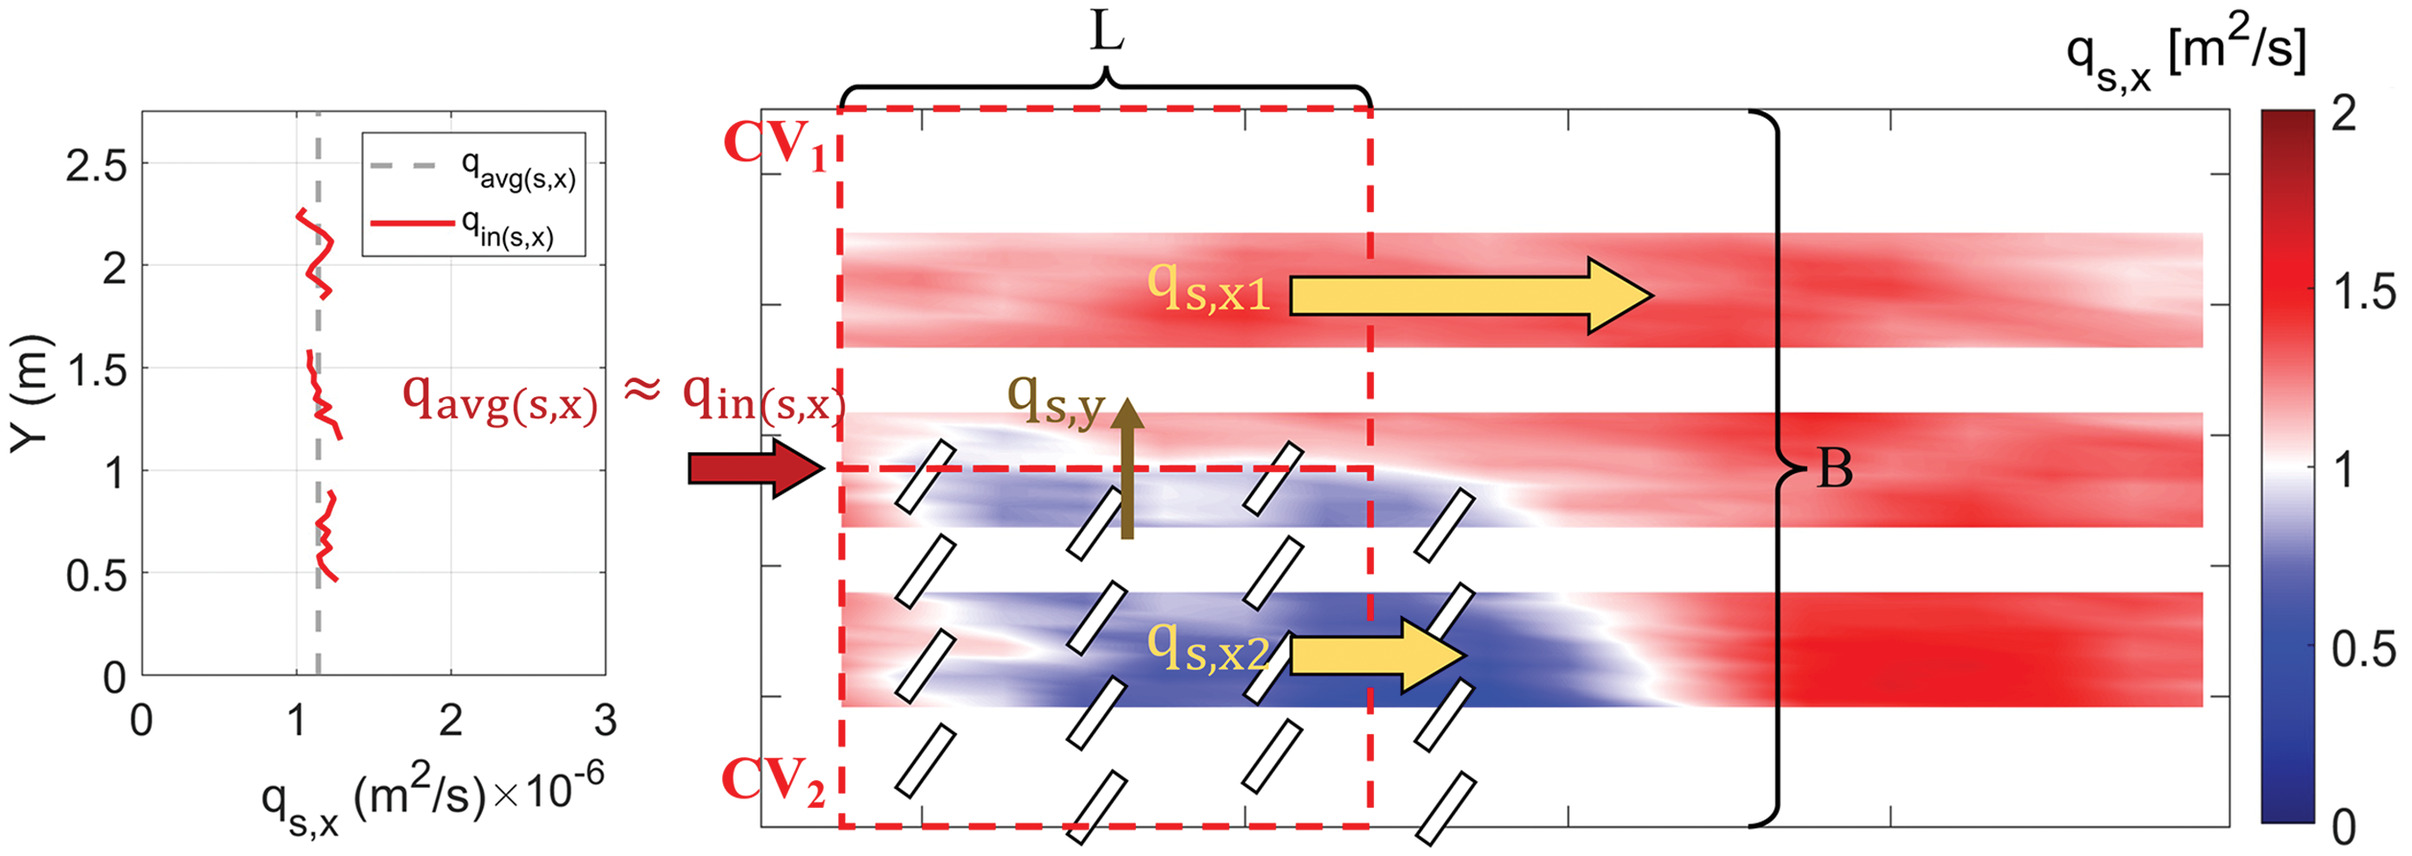
A control volume (CV) theory in accordance with the mass conservation principle is applied to quantify the lateral bedload sediment transport so as to test the redirection efficiency by the vane array installment. In Fig. 4, two control volumes, and , were set to evenly separate the channel into the upper (unobstructed side) and lower (vane array) regions. The time-averaged streamwise bedload transport rate at the beginning of the two control volumes () is shown to be uniform across the channel in the left panel of Fig. 4, suggesting that the volumetric sediment influx at () and () are nearly the same (), and the value is equal to the whole domain-averaged streamwise bedload transport rate, , which can be used as a reference volumetric sediment flux per unit width:
(3)
We verified that the system reached a dynamic equilibrium in which statistical convergence was achieved by monitoring the time-averaged bed elevation to ensure that it remained constant within the two control volumes (not shown here). Therefore, the mass conservation of sediment in and can be expressed aswhere and are the width-averaged streamwise bedload transport rate at the end of and , respectively. and are the width of the flume and the length of the control volume side. is the average lateral bedload transport rate, which can be obtained by subtracting the two equations [Eqs. (4) and (5)]:
(4)
(5)
(6)
(7)
However, because of the missing information within the blank gaps between the three laser scanning regions, the measured sediment outflow could deviate from the sediment inflow across the control volumes. Such unbalanced sediment mass could cause errors in calculating according to the mass conservation principle. To solve this potential issue, a mass balance correction coefficient, , was introduced as a ratio between the reference domain-averaged volumetric sediment flux, , and the mean of the computed outflow transport rate in the two CVs, and , to account for the unresolved streamwise sediment flux and ensure sediment mass balance:
(8)
The value of varies in space and time, ranging from 0.85 to 1.18 for the baseline case and from 0.84 to 1.19 for the vane array case. Finally, Eq. (7) can be rewritten asand the total lateral bedload transport flux in the varying sizes of the control volumes can be obtained by multiplying the total lateral length of the control volume:
(9)
(10)
The approach provides an estimation of the lateral bedload transport while ensuring the streamwise sediment mass balance.
Results and Discussions
Temporal Bedform Evolution around the Vane Array
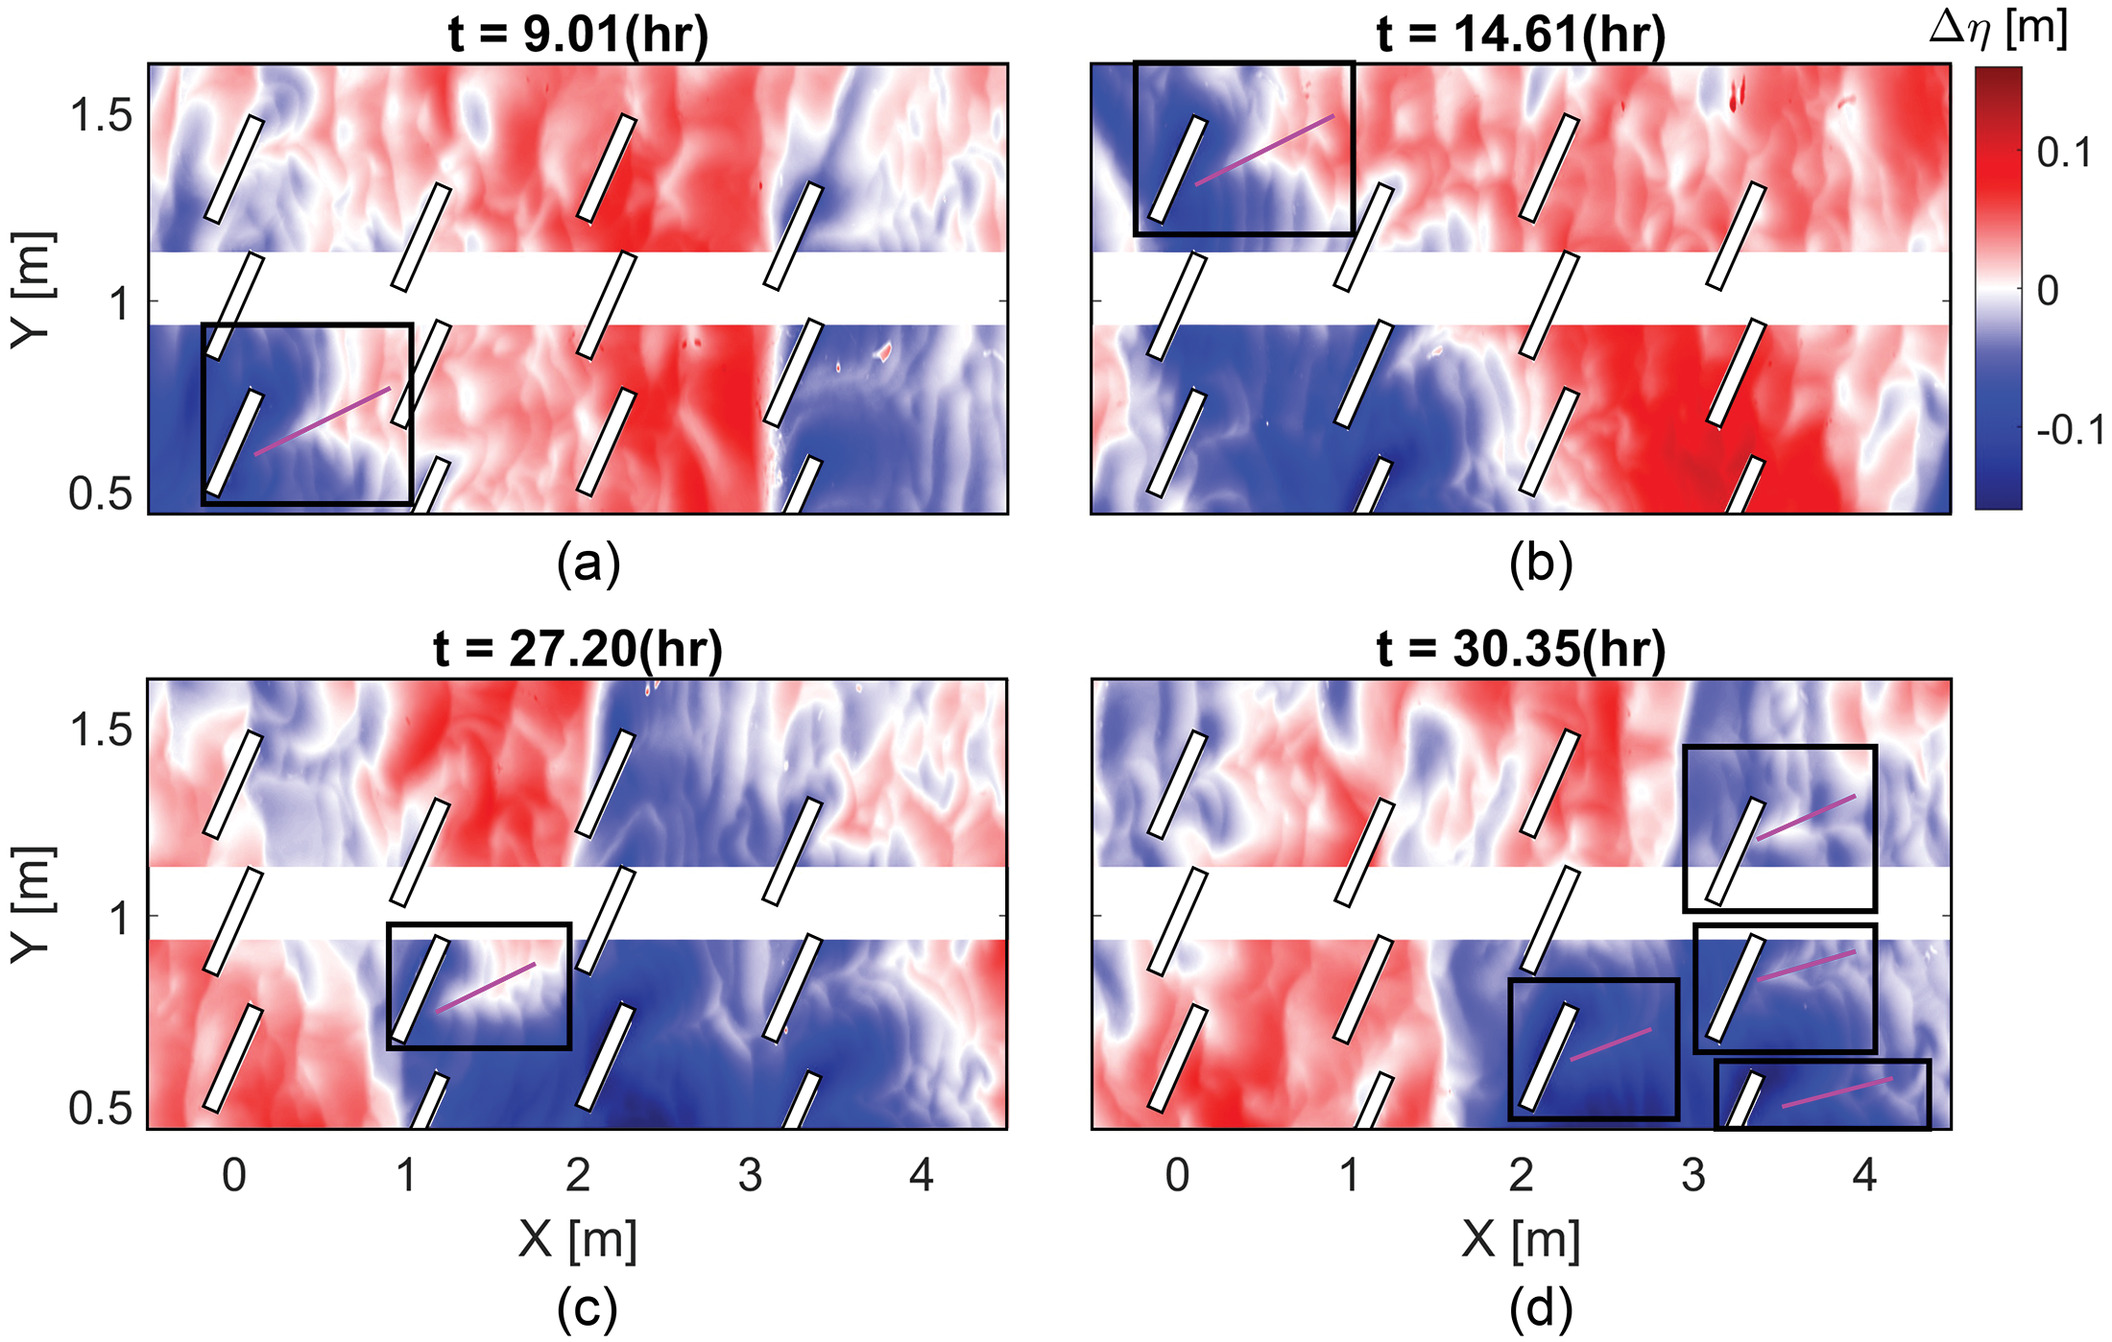
The physical mechanism governing the directionality of bedload transport is based on the cross-flow component of the drag force exerted by the vane on the incoming flow. This force steers the vane wake in the cross-stream direction and thus directly affects the flow near the sediment bed downstream of the vane and the local shear stress. In critical mobility experiments (Lee et al. 2022a), the sediments were locally mobilized near the base of the vane structure, leading to the formation of a scour region and then entrained in the wake. The performance of the vane(s) was evaluated by measuring how far the emerging sediment deposit was steered laterally with respect to the vane(s) center. In the design optimization, we focused on the lateral displacement of the deposit, compensating for the amount of sediment displaced from the scour region (not a desired feature). In live-bed conditions, bedforms migrate through the vane array, making boundaries of the scour and deposit regions less distinctive and unsteady, forcing us to change our methodology. The cross-flow components of the drag, the wake, and the shear stress persist in transitioning from critical to live-bed conditions. However, the overall effect on sediment transport is different. The shear stress spatial distribution and direction induced by the vane array primarily act on the incoming bedform field, not exclusively on the sediment in the scour hole. The macroscopic effect is a deflection and break up of incoming bedforms, resulting in the generation of sequences of yawed bedforms spatially evolving along the steered wake. This can be observed in Video S1 resulting from the laser scan measurements and in Fig. 5. These laterally redirected bedforms are, in fact, moving sediments in the cross-flow direction. Fig. 5 demonstrates the working principle of the vanes in live-bed conditions, showing instantaneous bedform fields at four selected times (9.01 h, 14.61 h, 27.20 h, and 30.35 h). Preferential lateral redirection of bedform fields is clearly shown by the chevron-shaped scour patterns highlighted by the magenta lines in the black solid boxes. The patterns are shifted in the cross-flow direction that aligns with the vane orientation and resembles those observed in the wake of MHK turbines (Hill et al. 2014; Musa et al. 2020) and vegetation patches (Rominger et al. 2010; Follett and Nepf 2012; Kim et al. 2015).
Spatial Distribution of Bedform Characteristics and Transport
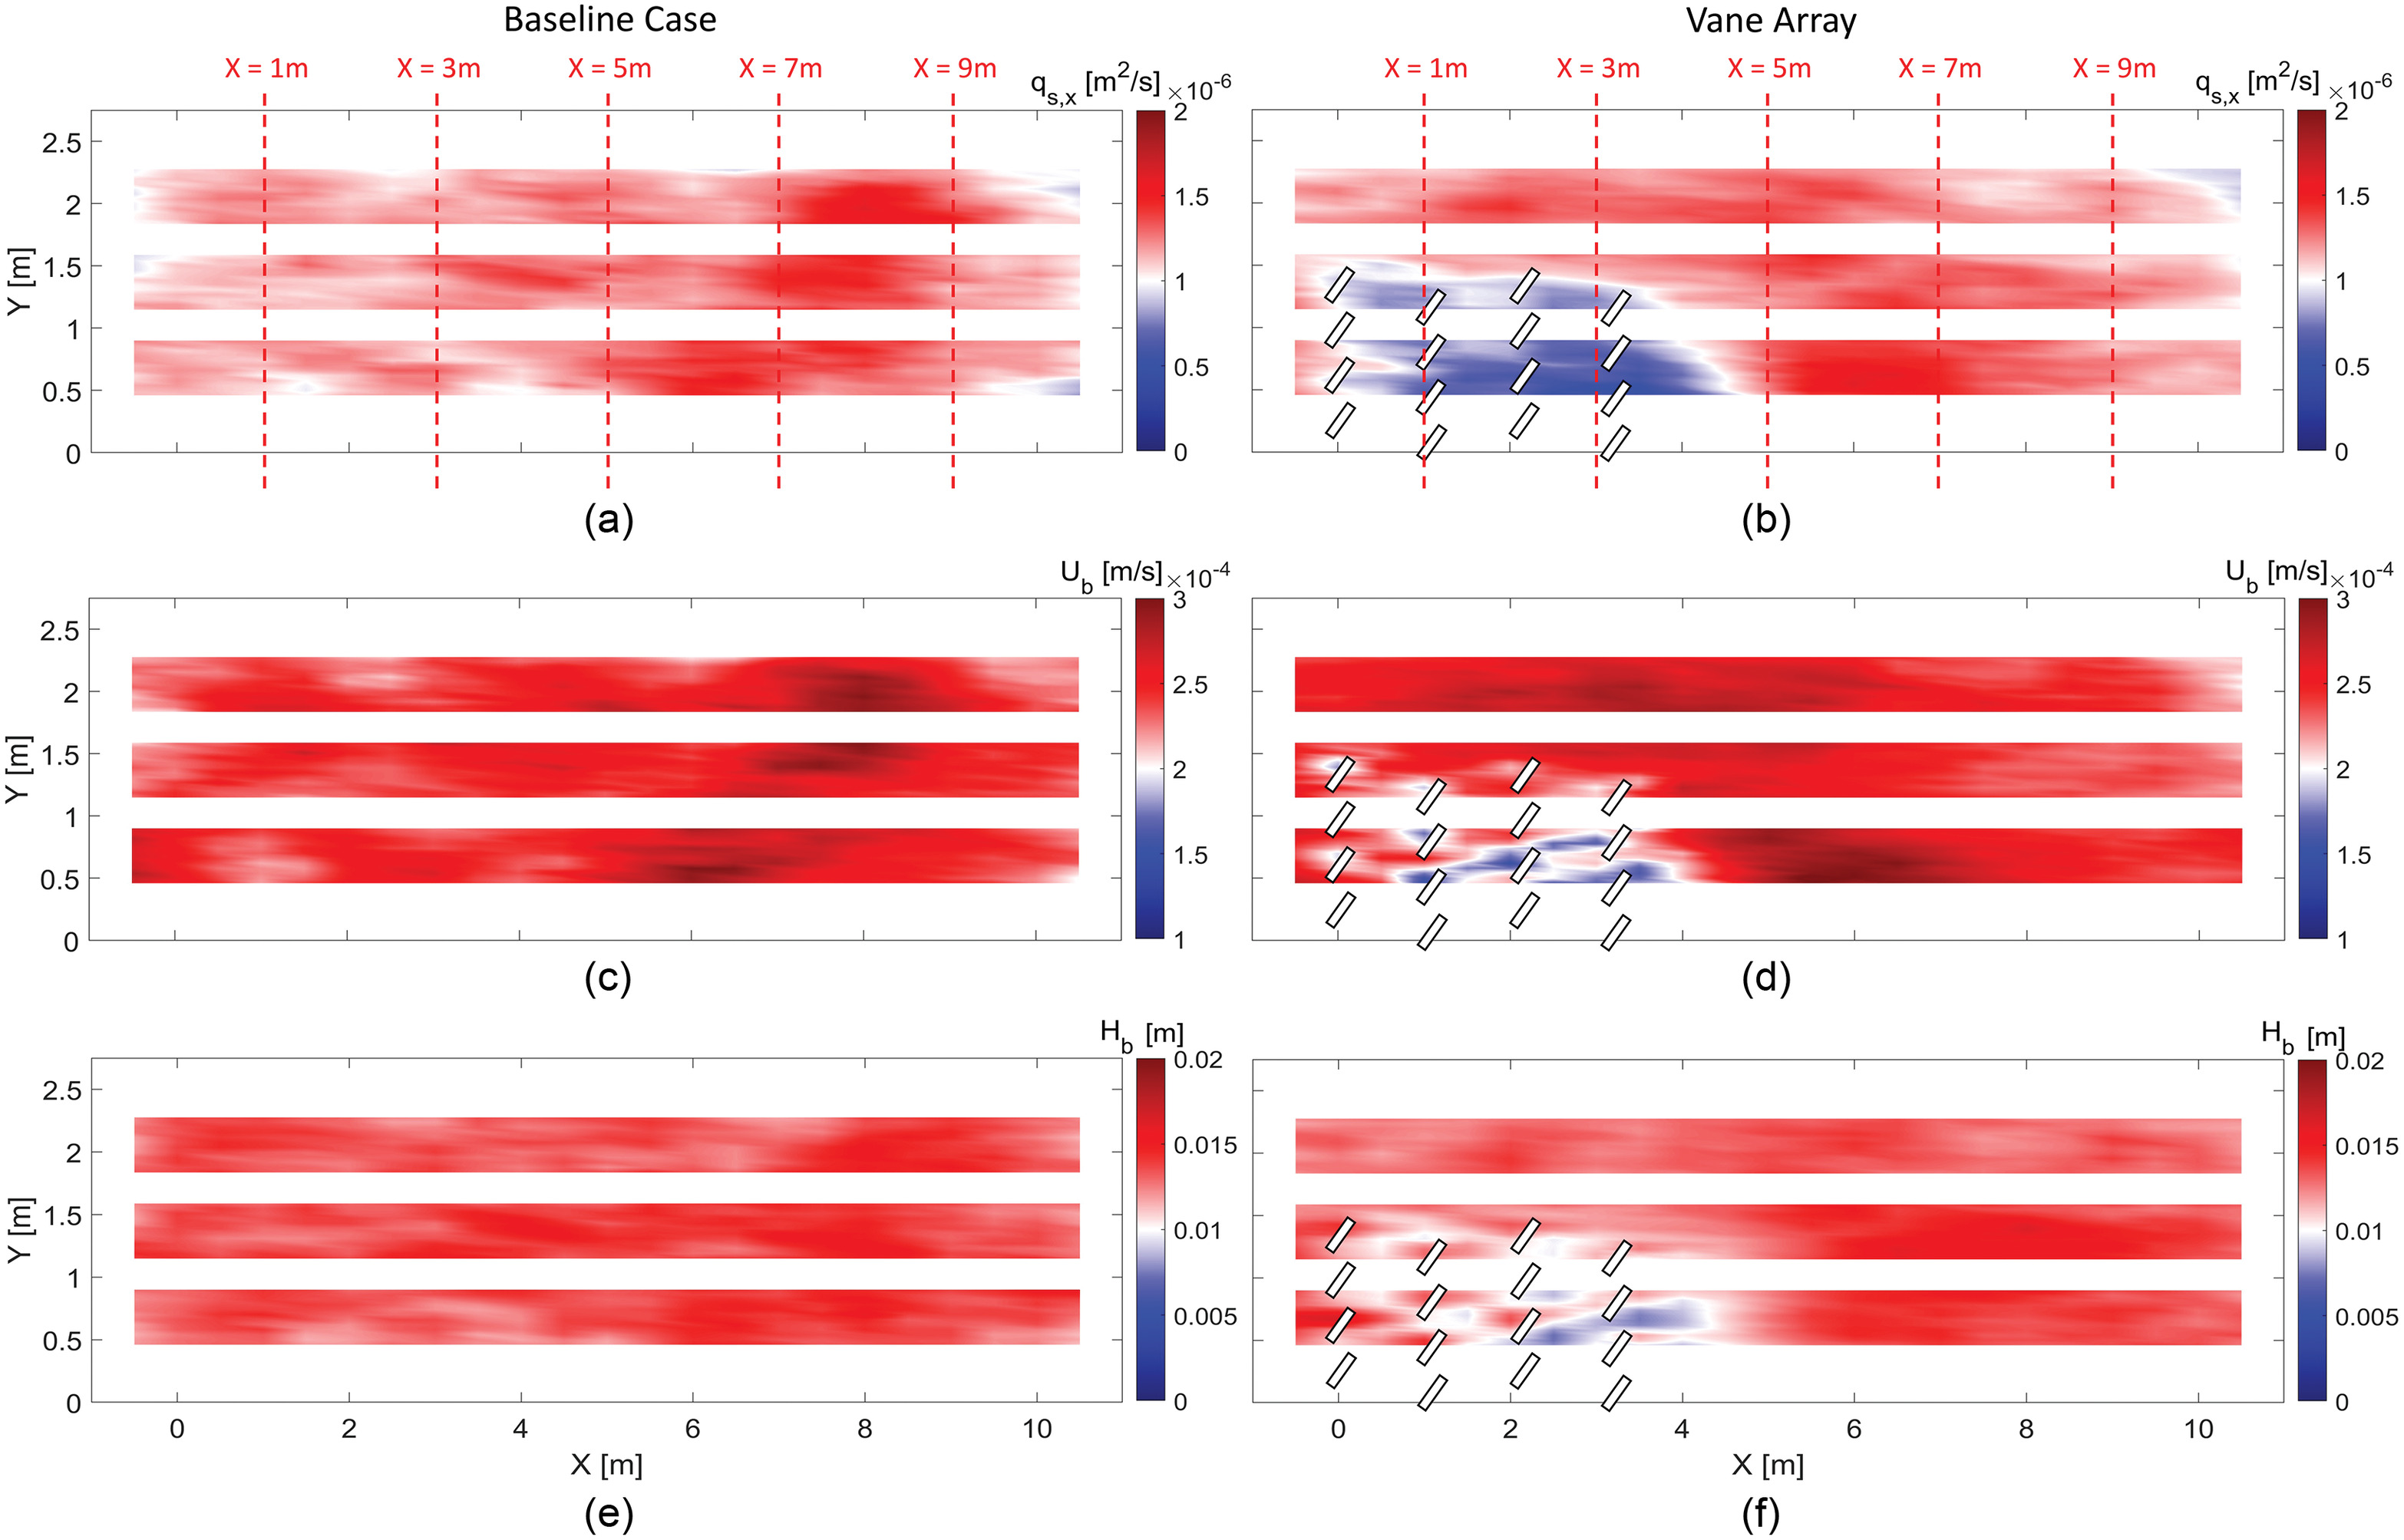
Fig. 6 presents comparisons of the Eulerian-averaged bedload transport rate, , bedform migration velocity, , and bedform height, , between the baseline case and the vane array case. When there were no submerged vanes installed, the flow generated a uniform downstream bedform migration pattern, as Figs. 6(a, c, and e) present relatively uniform fields of , , and , respectively. However, after installing the array, the additional drag exerted by the vanes slowed down the flow, thereby reducing both and within the array [Figs. 6(d and f)]. The reduced and , in turn, decreased inside the array as indicated by the blue-colored region in Fig. 6(b). Nevertheless, all results suggest that the bedform field recovers back to normal flow conditions when leaving the vane array, as two cases show similar results of , , and downstream of the vanes when .
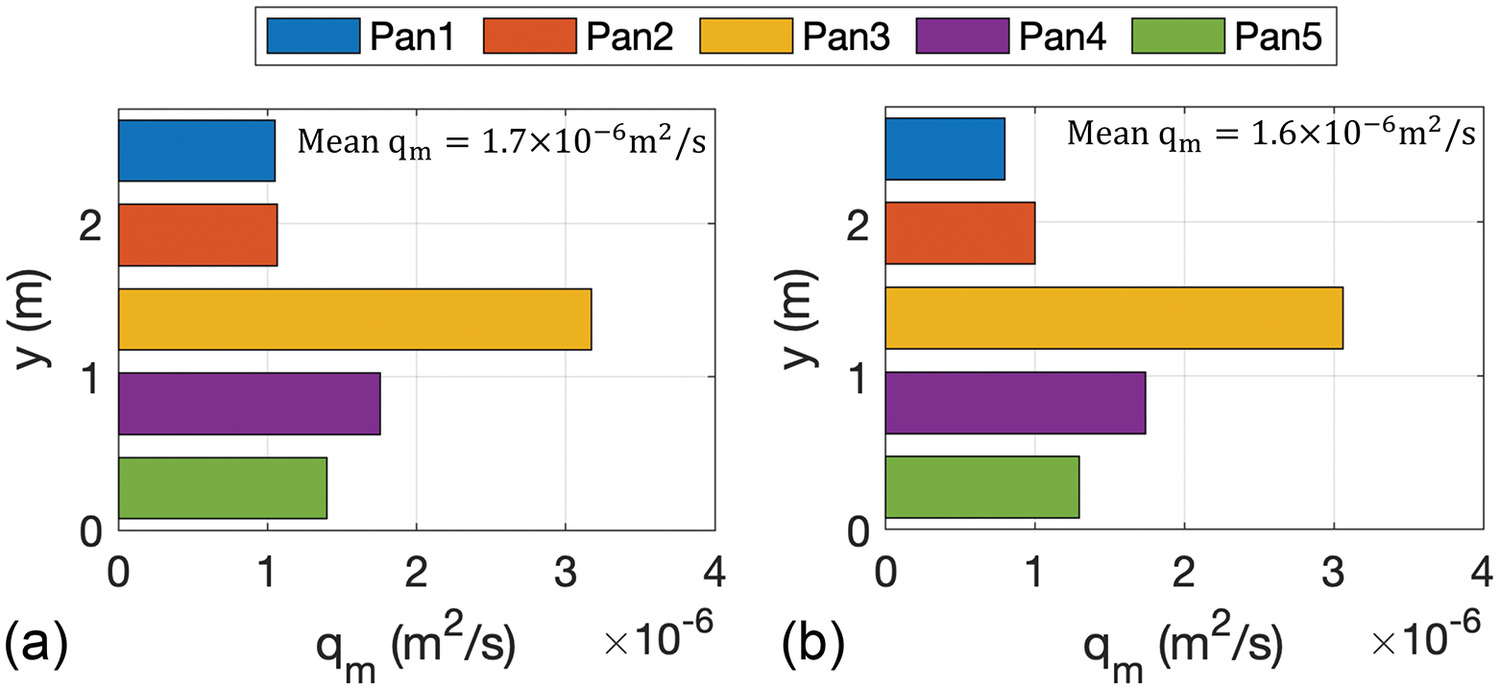
The five weighing pans at the end of the channel provide a direct measurement of the streamwise bedload transport rate, , far downstream from the vane array, whose time-averaged values are shown in Fig. 7(b) as a comparison to the estimated by the laser scanning bedform tracking method. The measured shows the expected bedload transport profile in open channel flows with higher transport at the center and lower transport near the two sides of the wall because of boundary effects similar to the baseline case result [Fig. 7(a)]. This confirms that bedform characteristics and transport have recovered back to normal flow conditions almost downstream (location of the weighing pans from the array), namely 3.7 times the array length (). The time-averaged ranges roughly from 1 to m2/s and the overall mean is in the baseline case and in the vane array case, which has the same order of magnitude as the measured domain-averaged (). The two measured values validate the Eulerian-average method applied to laser-scanning bedform tracking data.
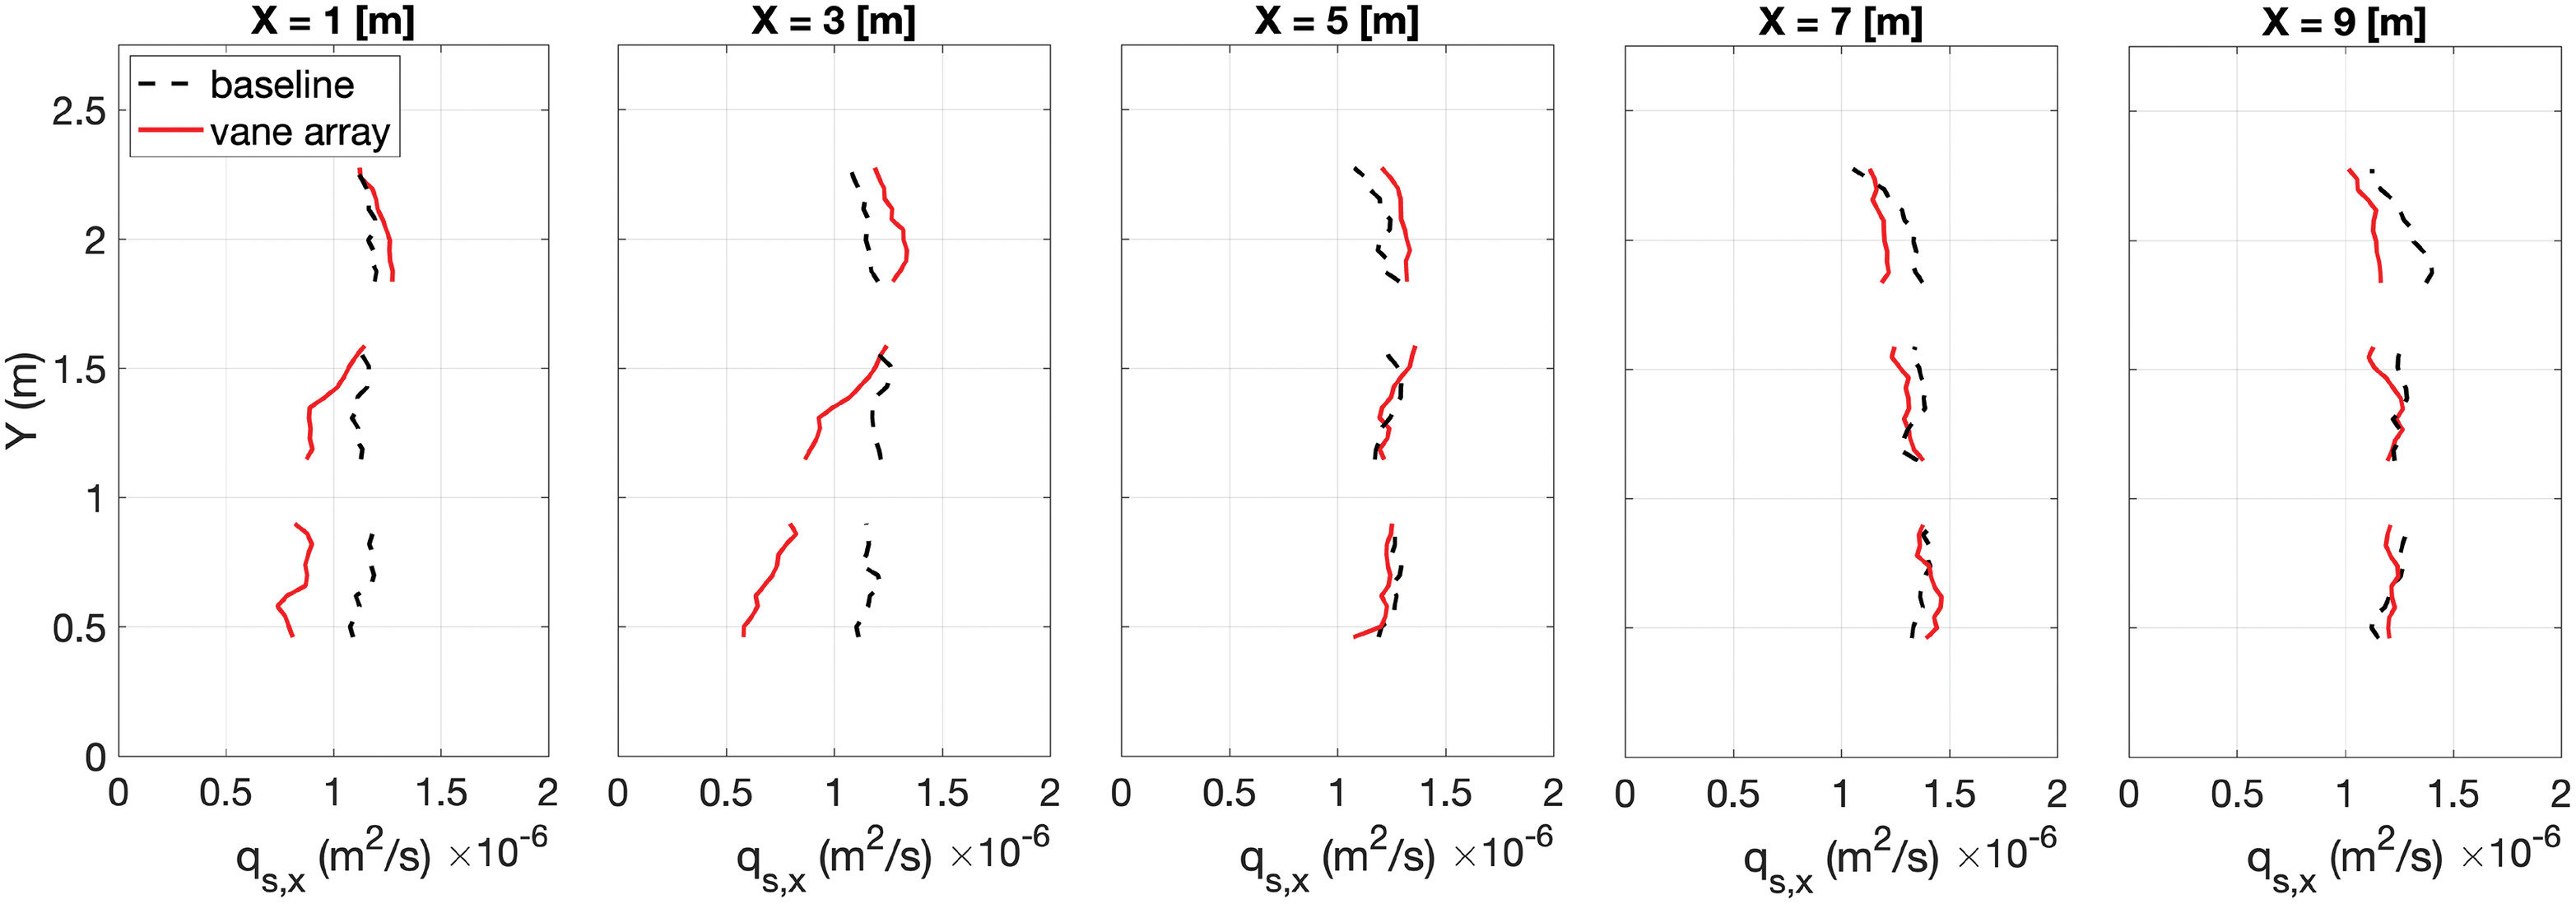
To further investigate the local spanwise variations of bedload transport rates along the channel, cross-stream profiles at five locations (, , , , and ) were plotted in Fig. 8, showing the comparison between the baseline case (black dashed line) and the vane array case (red solid line). The result shows a clear reduction of within the vane array region () and a slight increase on the unobstructed side () at for the case with submerged vanes. However, the bedload transport system tends to adjust itself back to the baseline flow condition downstream of the vanes, as two cases show nearly the same profiles at . A first quantitative estimate of the vane array effect on the sediment transport can be based on the spanwise distribution of the bedform mass flux (see the red line in Fig. 8). Downstream of the center of the array (), in the unobstructed flow region, at , the mass flux peaks at , while the corresponding mass flux within the array, at , is in the range of to . The percentage difference quantifiable as ranges from 32% to 66%. Conversely, note that the spanwise distribution of for the baseline in the same location (black dashed line) is homogeneous, as expected. This maximum observable change in the spanwise distribution of the streamwise mass flux reflects all the physical mechanisms occurring at the array scale, including (1) bedform and bedload lateral steering by single vanes (Fig. 5), along with (2) the distortion of the mean flow because of the asymmetric distribution of the vanes in the channel inducing an accelerated flow in the unobstructed side, as opposed to a velocity deficit zone within the array. This inferred flow distortion has been observed along with the formation of forced bars induced by a relatively wide porous wall perpendicular to the flow Redolfi et al. (2021) and by a spanwise array of hydrokinetic turbines Musa et al. (2019). In both cases, the obstructions (i.e., the wall and the turbines) were installed on half-side of the channel, creating an accelerated flow on the unobstructed side and a velocity deficit, i.e., a wake, downstream of the obstruction. The flow distortion affected bedload sediment transport, generating faster bedforms–higher transport on the unobstructed side (where erosion was observed) and slower bedforms–lower transport in the wake (where deposition was observed), overall resulting in a streamwise mass flux imbalance. Therefore, we expect that strongly asymmetric roughness distributions play a significant role in the spanwise modulation of the mass flux, even when single roughness elements are not designed to induce a lateral component of the bed shear stress, sustaining lateral transport or bedform steering, as the vane tested here.
Lateral Bedload Transport Induced by a Yawed Submerged Vane Array
Following the control volume approach discussed in the section “Lateral Bedload Transport Quantification,” we set the upstream boundary of the two CVs right upstream of the submerged vane array at and varied the CVs’ length by moving the downstream boundary from to with a increment as shown in Fig. 9(a). This is set to obtain a different, robust discretization of in control volume subsets. The corresponding x-dependent averages of the lateral bedload transport rate, , according to Eq. (9), are hereinafter, defined as the evolutionary means within the control volumes.
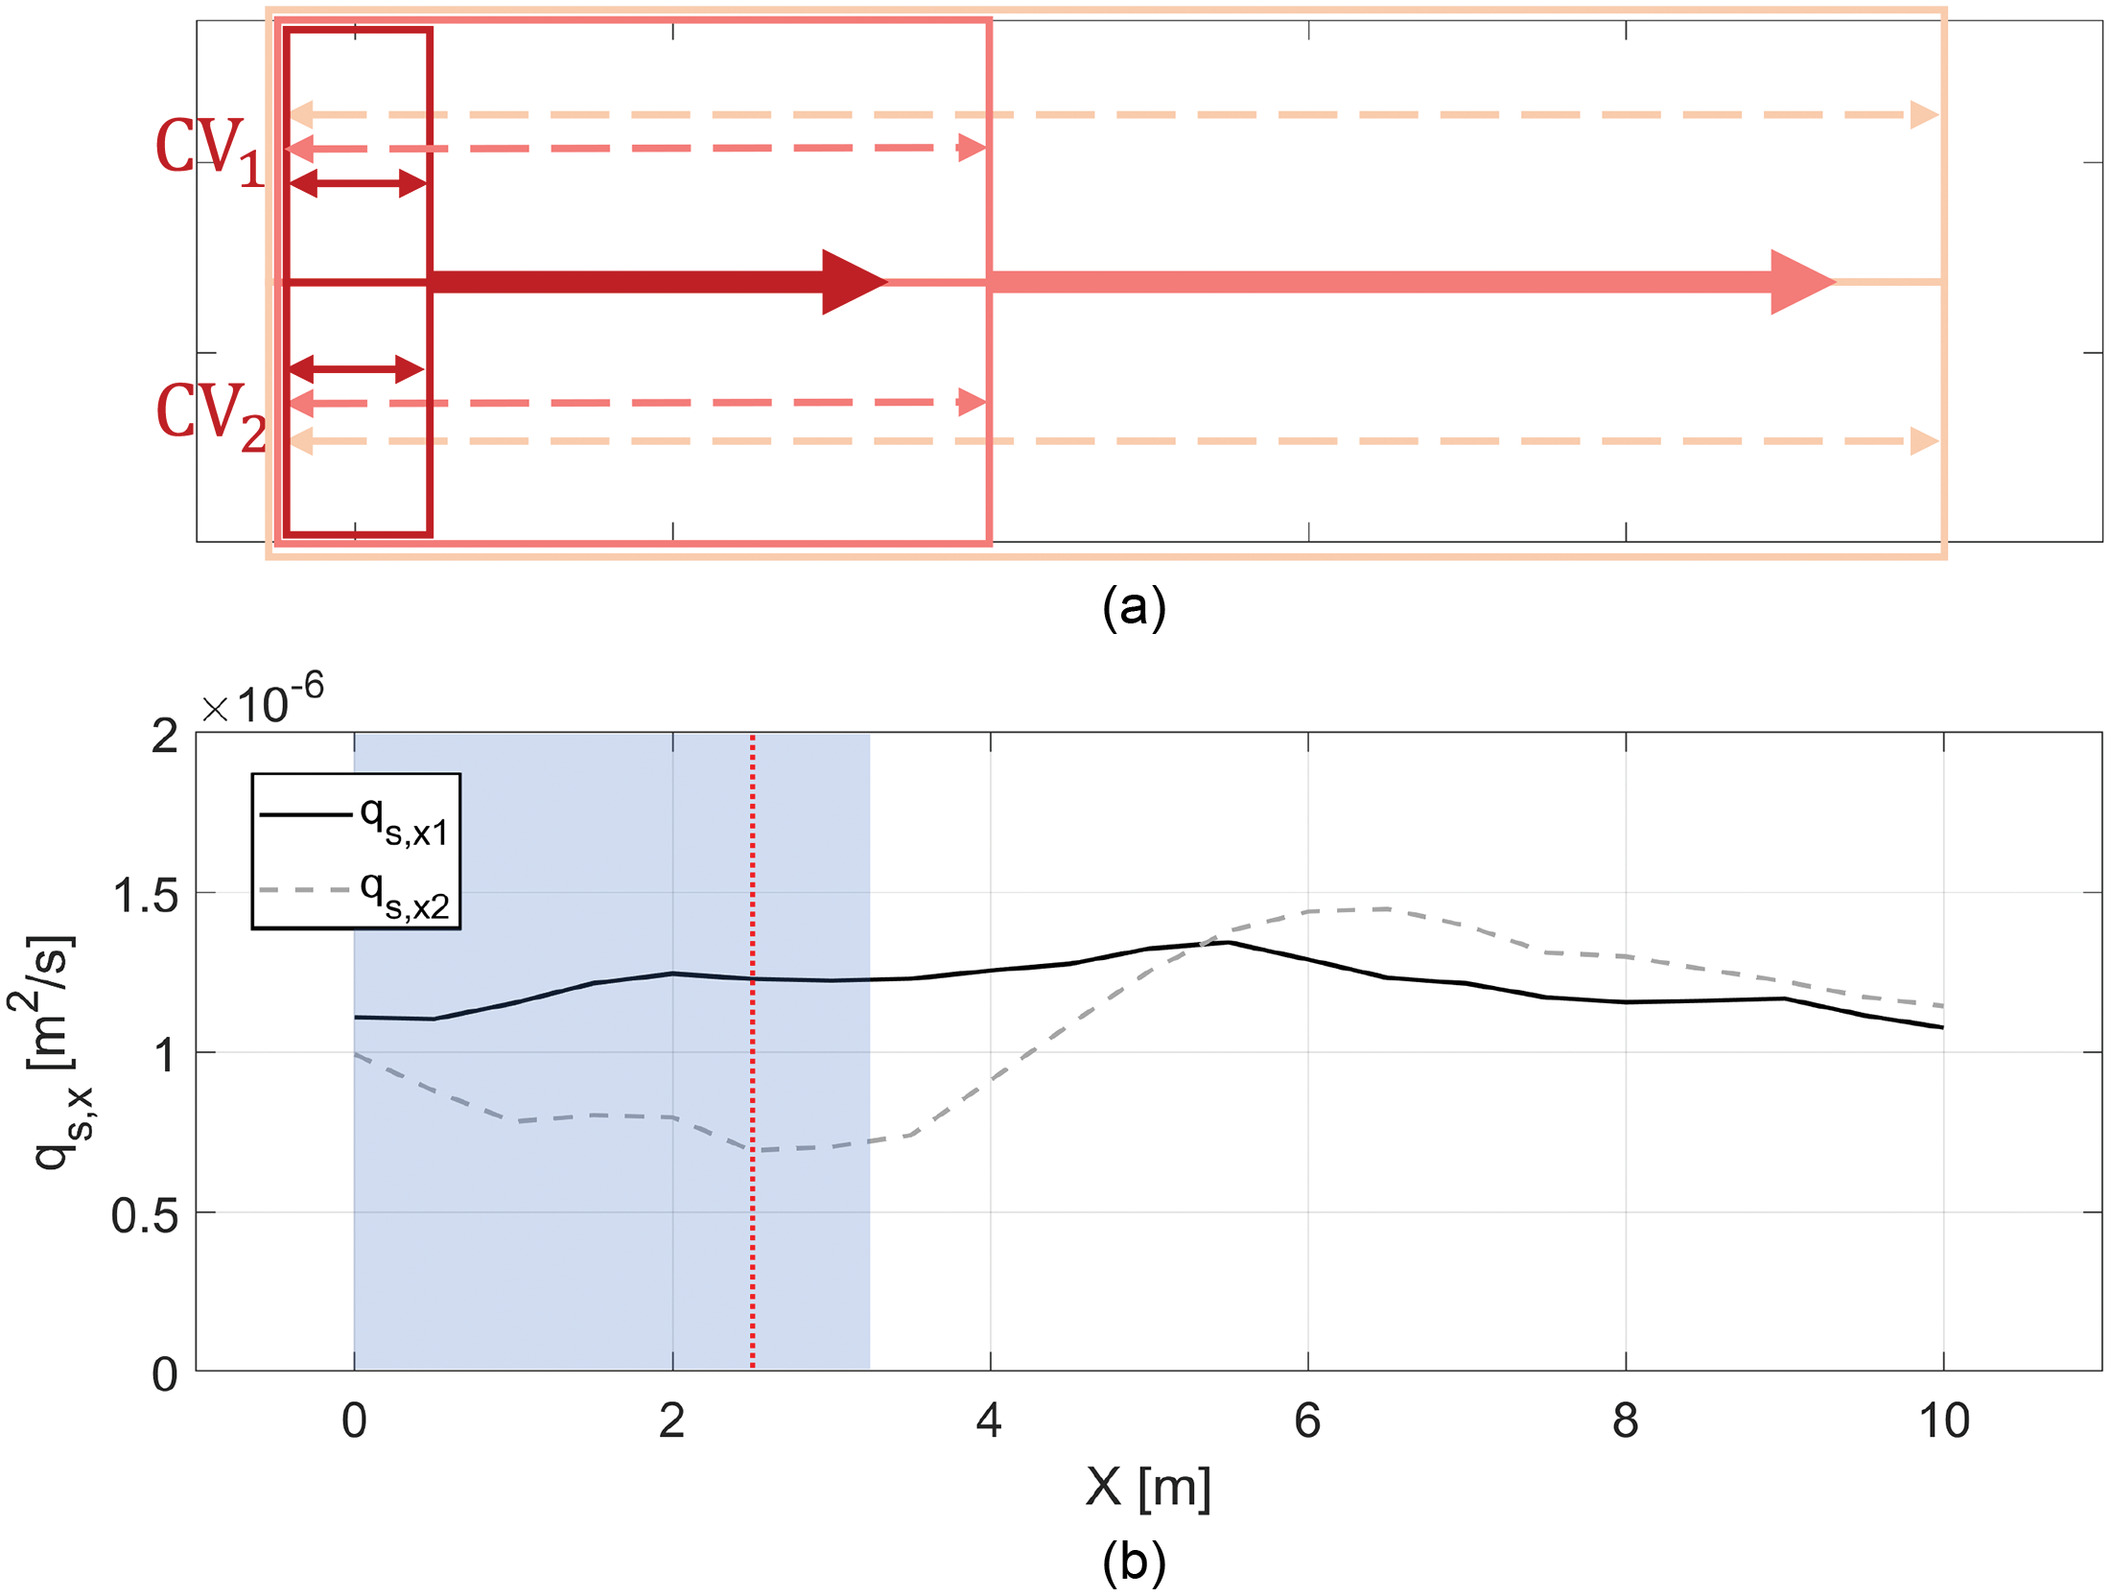
As indicated by Eq. (9), the final form of depends on the difference of volumetric sediment outflux from and (). Fig. 9(b) shows the varying (solid black line) and (dashed grey line) with the changing size of and in the vane array case, in fact showing the longitudinal profile of the averaged streamwise sediment flux of the two-channel regions. As discussed, when comparing spanwise heterogeneity in the streamwise mass flux distribution, within the region of , the submerged vanes hinder the streamwise bedload transport, resulting in a lower that infers an upward lateral bedload transport. Then, starts to increase near the downstream edge of the array (indicated by the right boundary of the shaded area) and surpasses further downstream () as the system tends to readjust itself back to the uniform condition with no in-stream obstacles.
The difference between and results in an evolutionary lateral bedload transport as presented in Fig. 10(a). The grey bars show nearly zero lateral transport in the baseline case. However, the black bars display a net positive from to , with the maximum value at , followed by a gradual decrease, eventually reaching a net value when . The positive values along the channel highlight the extent of the desired sediment redirection by deploying a yawed submerged vane array. Compared to the baseline case where is nearly zero, the value of within the vane array ranges from to , which is between 9% to 18% of the averaged streamwise transport rate, (). Note that the represents the average lateral transport per unit width. To identify the region within the array, most affected by lateral transport under the current setup, we can look at the cumulative, or total, lateral transport , integrated over the range. Following Eq. (10), the total lateral bedload transport flux in the varying size of the control volumes is shown in Fig. 10(b). The location of the total lateral transport flux peak is at about , corresponding to 2.3 times the row distance , or 0.77 the total length of the array (). The peak location is consistent with the observed maximum difference between and , as shown by the dotted red line in Fig. 9(b). This occurs near the third row of the vane array, suggesting that perhaps the last set of vanes is too sheltered by upstream wakes to perform optimally. Although the bedform characteristics seem to recover downstream of the array, the vanes’ net effect on the lateral transport, driven primarily by contributions from the upstream vanes of the array, remains until , which corresponds to the switch point of the evolutionary shown in Fig. 10(a).
We acknowledge that the correct scaling parameters for the peak location of and the overall streamwise extent of the vane are not unambiguously defined, and more experiments will be needed. We also note a weak dampened oscillation of the lateral transport , which could be a signature of channel bathymetric distortion and thus deserve further analysis.
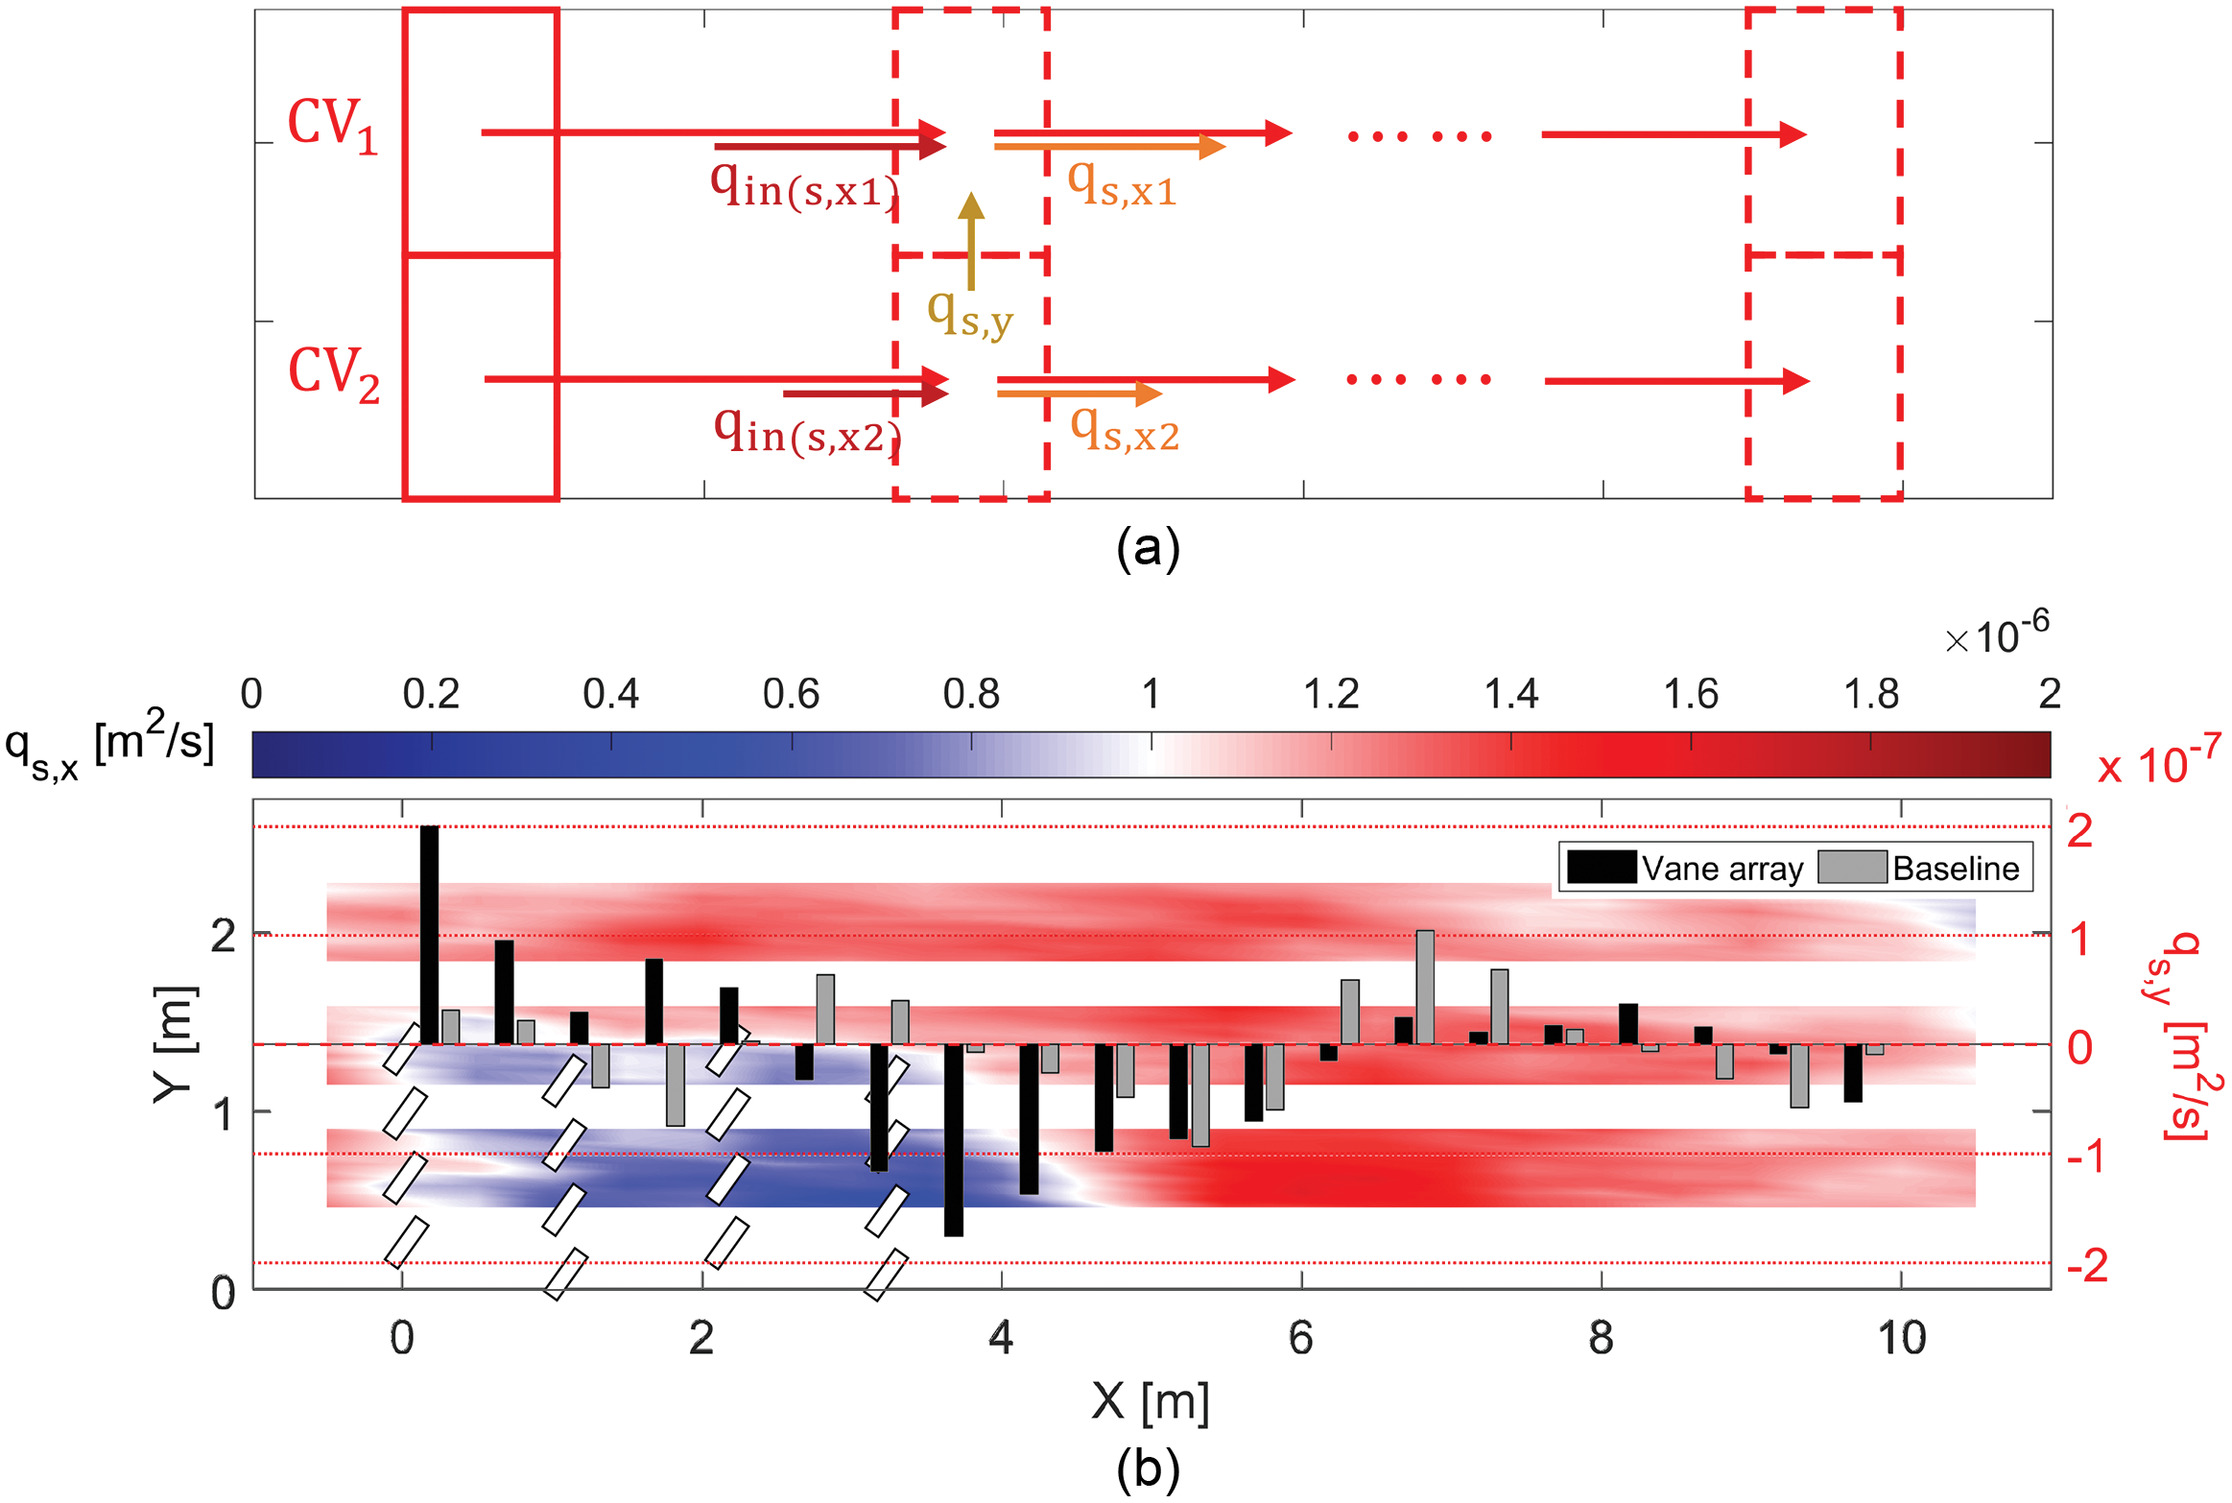
To obtain a more local description of lateral transport, we now applied mass conservation of sediments in progressive channel bed areas with a pair of moving control volumes [Fig. 11(a)]. The control volumes are designed under a fixed length, , and a 50% () overlapped area between each moving window. In this case, the volumetric sediment influx is no longer the domain-averaged streamwise bedload transport rate as we applied previously [Eq. (3)]. Instead, the sediment influxes at () and () might be different (at least within the array region), and they can vary depending on the locations of the two control volumes. Therefore, Eqs. (4) and (5) will need to be revised for the moving control volume approach:
(11)
(12)
Following the same procedure for obtaining Eq. (6), the mean lateral bedload transport rate in the moving control volumes will be updated as [Eqs. (11) and (12)]:
(13)
According to mass conservation, the lateral averaged streamwise bedload transport rate should be constant across the whole channel. That is to say, no matter where the moving control volumes move to, the average streamwise bedload transport rates entering or exiting the control volumes should be the same, which has proven to be . Therefore, another mass balance factor, , would be required for the measured sediment influx to correct the potential errors because of the blank gaps between the three laser scanning regions, like introducing to correct the measured sediment outflux:
(14)
Finally, Eq. (13) can be rewritten as
(15)
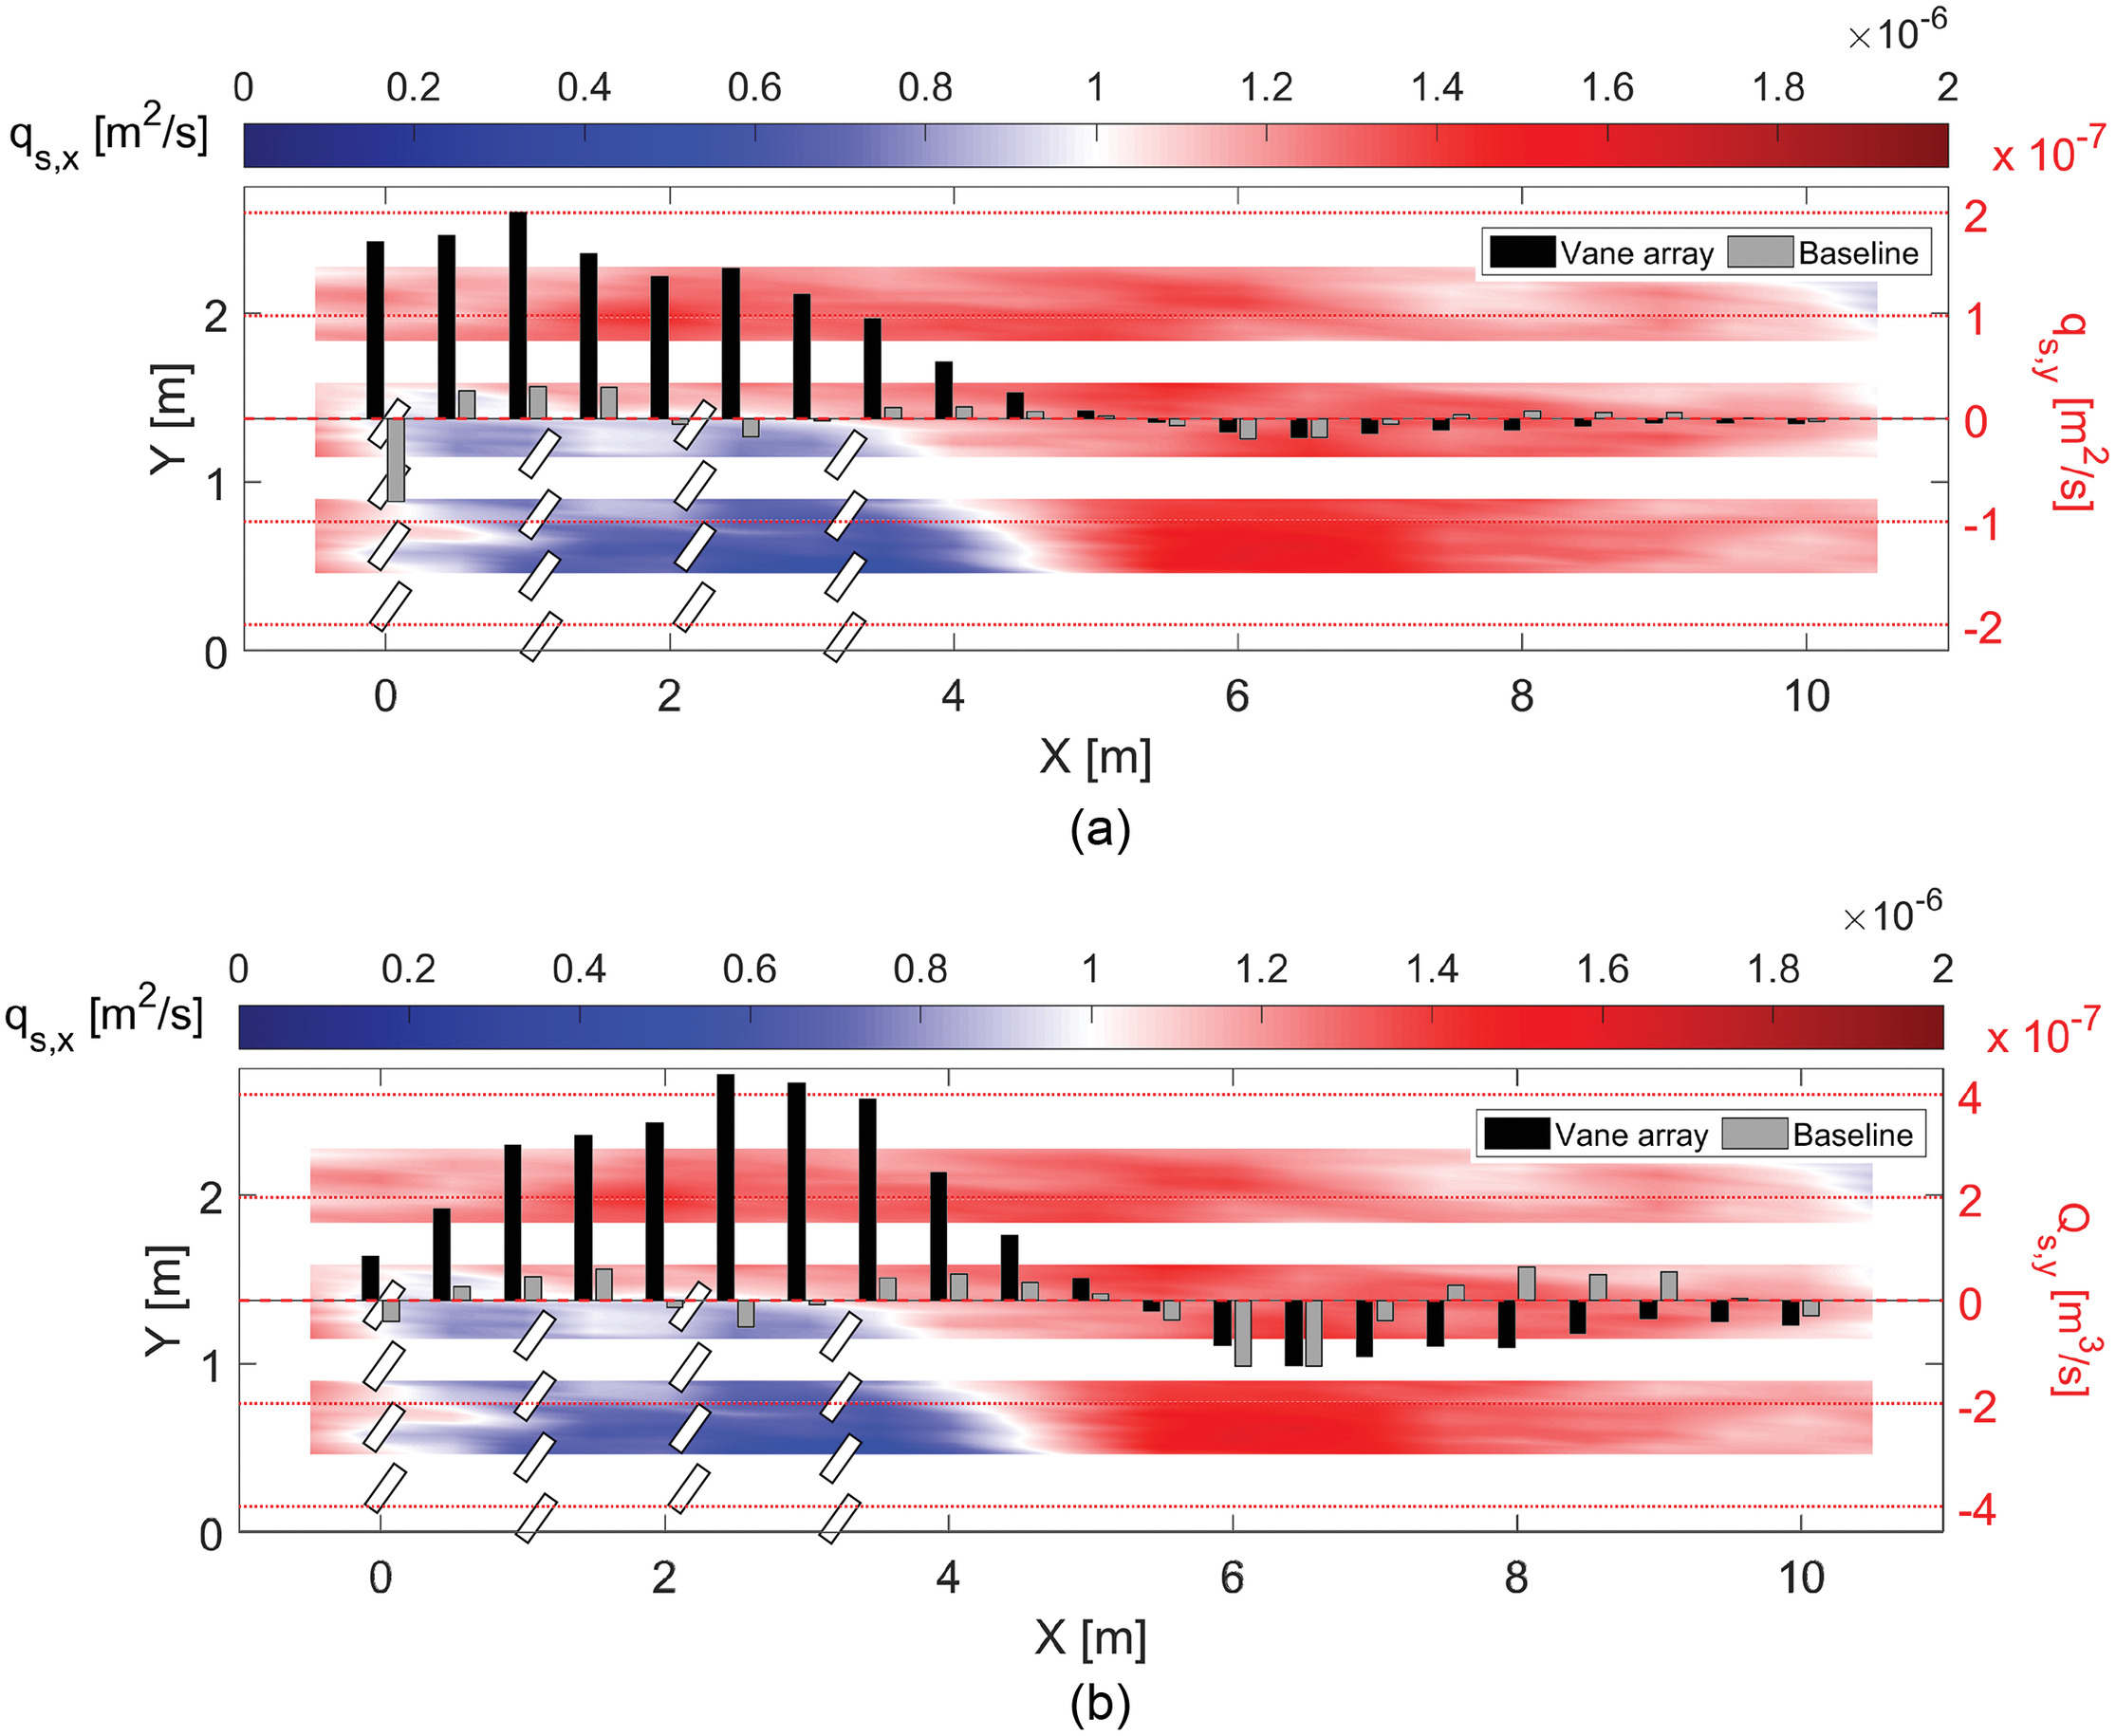
Fig. 11(b) presents the local (as opposed to the evolutionary) along the channel. The gray bars once again illustrate a relatively low lateral transport in the baseline scenario, whereas the black bars depict elevated positive local values of at the beginning of the upstream vane array region from to . This shift is attributed to transitioning from a uniform downstream-migrating bedform field to an upward-redirected field induced by the yawed submerged vanes. As the vanes’ wakes merge, the central portion of the array experiences a likely reduced flow velocity (Lee et al. 2022a), and the distortion of the bedforms contributing to lateral transport is diminished. At approximately midlength of the array (), the local effect is negligible, and the lateral flux starts to switch, bringing sediment back toward the array side. The switch point () marks the extension of the local vanes-induced lateral mobility, and it corresponds to the maximum total lateral transport flux [Fig. 10(b)]. Therefore, it is inferred that this would be the recommended location on the unobstructed channel side where an ideal sediment-capturing system or the uptake for a sediment bypass tunnel can be placed.
Note that this negative at the exit of the vane array revealed by the lateral flux estimation methods is not reflected by a clear yaw in the bedforms movement in the same direction (see Video S1 ). We speculate that, in this specific location, bedforms migration might not be the dominant transport mechanism for the lateral flux of sediments, which might be locally mobilized via sliding because of a local increase and distortion of the mean flow and the shear stress. This is supported by the lower order of magnitude of compared to . This argument reinforces the CV approach. It allows us to capture the lateral flux, which may result from different, weaker transport mechanisms, as opposed to the streamwise flux, which is dominated by bedform dynamics and is, in fact, measured by tracking their kinematics and morphology. This variation in lateral transport directionality is likely an array-scale effect that redistributes sediments in the cross-flow direction to reestablish the baseline bedform transport downstream. The transition is fairly gradual, as we observe here. Then, after the lateral flux reverts toward the array side within the last row, small dampening oscillations are observed along the channel. This behavior can be observed in both the integrated and local fluxes in Figs. 10(b) and 11(b), respectively. This oscillating sediment flux resembles the steady, spatially decaying bed distortion effects observed by Musa et al. (2018b) and Redolfi et al. (2021). Based on the latter work and predictive modeling, we speculate that under specific hydraulic conditions—defined by the channel ratio and defined as resonant in Redolfi et al. (2021)—the spatial oscillations of lateral bedform transport may extend farther downstream. However, it is worth mentioning that our experiments were performed without the envisioned sediment collector system. Effectively removing sediments precisely where the lateral transport initiates and peaks may potentially prevent the observed directional shift in the first place or, at the least, dampen the ensuing oscillations of the lateral flux.
Conclusion
A series of experiments in a large-scale channel in live-bed conditions were conducted to monitor and quantify the lateral sediment transport steered by an array of yawed submerged vanes. The methodology was based on the estimate of local streamwise transport by bedform migration and on the conservation of mass in control volumes of different sizes and locations for lateral transport estimation. The vanes in the array were observed to induce a spanwise modulation in the streamwise mass flux, with peak differences between the array side and the unobstructed side estimated to be between 32% and 66%. This is partly because of an array-scale flow distortion, reducing transport in the vane region where resistances are increased, and partly to the lateral mass flux component induced by each vane. The latter, underlying physical mechanism is the redirection of bedforms toward the unobstructed side of the channel, where sediment transport is maximized. The result shows that the vanes were able to effectively redirect 9% to 18% of the streamwise-transport sediment laterally toward the side of the channel. The effect was local, within the scale of the array, with the lateral mass flux peaking at approximately the third row of vanes (for this specific configuration). Starting at the downstream end of the array, the steering effect of the vanes is inferred to be counteracted by a mean flow and shear stress distortion that contributes to restoring a nearly uniform spanwise distribution of the sediment flux. The spatial transition to uniform conditions seems to extend up to one array length downstream of the vanes. The main takeaway messages are (1) permeable vanes can steer the sediment, as previously observed in Lee et al. (2022a), even when they are significantly submerged and in live-bed conditions; (2) the spacing of the vanes within the array, based on the wake induced by the single component and thus scaling with the vane width, works as previously observed in critical mobility conditions (Lee et al. 2022a); (3) the overall sediment steering induced by the array is maximized at the end of third row of vanes, before the downstream end of the array; and (4) the methodology developed for the quantification of lateral sediment flux, from bedform tracking (Lee et al. 2021) to a regular grid remapping, can be extended to study alternative engineering methods for controlling downstream sediment transport.
The proposed implementation of the strategically positioned array of yawed porous vanes is envisioned to improve the efficiency of sediment collection upstream of reservoirs and redirect it downstream of dams via sediment bypass channels. This design would mitigate reservoir sedimentation and allow sediments to follow a more natural path through the river. This pilot study successfully developed the methodology and metrics to identify optimal sediment capture locations. However, it should be noted that the study was conducted without side channels (or any type of sediment collectors) to isolate the effects of the vane array. As discussed, adding a side channel or sediment collectors to simulate a bypass tunnel will likely alter local hydrodynamics and sediment transport patterns. Therefore, future studies should focus on investigating the combined effects of sediment redirection by submerged vanes and sediment extraction by bypass channels. Testing the combination of the vane array with a sediment capture system may also reveal whether the array-scale effect would still lead to sediment flux restoration or, instead, be characterized by amplified large-scale oscillations, such as those observed by Redolfi et al. (2021).
Future work should also be devoted to investigating how the submergence ratio and the vane drag area, relative to the cross-section, would affect the lateral transport efficiency and the streamwise location of maximum lateral transport. In general, even if the array configuration design, based on the critical mobility study by Lee et al. (2022a), produced the same steering mechanism in the current experiments, further tests should be performed to verify that the adopted design parameters remain optimal in live bed as well. It is crucial to ensure that the effectiveness of the array in steering sediment is maximized across different flow regimes and bed material compositions, in particular under the various hydraulic, bedform, and sediment transport conditions encountered in natural settings.
Another important mechanism to be studied in the future is the role of suspended loads on the lateral sediment flux redirectionality by vanes. More complex intertwined interactions among turbulent flows, suspended loads, and migrating bedforms are expected when suspended load contributions become significant. Simultaneous measurements of flow velocity, bed load transport, suspended sediment concentration, and characteristics of migrating bedforms are experimentally challenging. Fully coupled hydromorphodynamic computational fluid dynamic simulations (Khosronejad and Sotiropoulos 2014; Sotiropoulos and Khosronejad 2016) can be valuable tools to investigate the effect of different transport regimes in such complicated sediment–structure interactions. We, however, expect that the lateral drag component will still act on the flow and on the suspended sediment but that the lateral mass flux will likely be dependent on the vane height to flow depth ratio.
Supplemental Materials
File (supplemental materials_jhend8.hyeng-14076_tseng.zip)
- Download
- 117.01 MB
Data Availability Statement
Some or all data, models, or code that support the findings of this study are available from the corresponding author upon reasonable request. The 2D spatiotemporal bed surface elevation data to reproduce the analysis in this paper is available at https://hdl.handle.net/11299/262210. The bedform tracking tool used in this study is available at the UMN data repository (https://doi.org/10.13020/e1fe-sb56).
Acknowledgments
The project was supported by the Department of Energy under Award No. DE-EE0008947. This manuscript has been authored by UT-Battelle, LLC, under Contract DE-AC05-00OR22725 with the US Department of Energy (DOE). The US government retains and the publisher, by accepting the article for publication, acknowledges that the US government retains a nonexclusive, paid-up, irrevocable, worldwide license to publish or reproduce the published form of this manuscript or allow others to do so, for US government purposes. DOE will provide public access to these results of federally sponsored research in accordance with the DOE Public Access Plan (http://energy.gov/downloads/doe-public-access-plan).
References
Annandale, G. W. 1987. Reservoir sedimentation. Amsterdam, Netherlands: Elsevier.
Annandale, G. W., G. L. Morris, and P. Karki. 2016. Extending the life of reservoirs. Washington, DC: World Bank.
Auel, C. 2014. “Flow characteristics, particle motion and invert abrasion in sediment bypass tunnels.” Doctoral dissertation, Laboratory of Hydraulics, Hydrology and Glaciology, ETH Zurich.
Auel, C., and R. M. Boes. 2011. “Sediment bypass tunnel design–review and outlook.” In Proc., 79 Annual Meeting on Dams and Reservoirs under Changing Challenges of ICOLD, edited by A. J. Schleiss and R. M. Boes, 403–412. London: Taylor & Francis.
Barkdoll, B. D., R. Ettema, and A. J. Odgaard. 1999. “Sediment control at lateral diversions: Limits and enhancements to vane use.” J. Hydraul. Eng. 125 (8): 862–870. https://doi.org/10.1061/(ASCE)0733-9429(1999)125:8(862).
Bastankhah, M., and F. Porté-Agel. 2014. “A new analytical model for wind-turbine wakes.” Renewable Energy 70 (Oct): 116–123. https://doi.org/10.1016/j.renene.2014.01.002.
Bennett, S. J., T. Pirim, and B. D. Barkdoll. 2002. “Using simulated emergent vegetation to alter stream flow direction within a straight experimental channel.” Geomorphology 44 (1–2): 115–126. https://doi.org/10.1016/S0169-555X(01)00148-9.
Best, J. 2019. “Anthropogenic stresses on the world’s big rivers.” Nat. Geosci. 12 (1): 7–21. https://doi.org/10.1038/s41561-018-0262-x.
Boes, R., M. Müller-Hagmann, and I. Albayrak. 2019. “Design, operation and morphological effects of bypass tunnels as a sediment routing technique.” In Proc., 3rd Int. Workshop on Sediment Bypass Tunnels, 40–50. Taipei, Taiwan: National Taiwan Univ.
Brandt, S. A. 2000. “Classification of geomorphological effects downstream of dams.” Catena 40 (4): 375–401. https://doi.org/10.1016/S0341-8162(00)00093-X.
Chamoun, S., G. De Cesare, and A. J. Schleiss. 2016. “Managing reservoir sedimentation by venting turbidity currents: A review.” Int. J. Sediment Res. 31 (3): 195–204. https://doi.org/10.1016/j.ijsrc.2016.06.001.
Cheng, N.-S. 2009. “Comparison of formulas for drag coefficient and settling velocity of spherical particles.” Powder Technol. 189 (3): 395–398. https://doi.org/10.1016/j.powtec.2008.07.006.
De Cesare, G., A. Schleiss, and F. Hermann. 2001. “Impact of turbidity currents on reservoir sedimentation.” J. Hydraul. Eng. 127 (1): 6–16. https://doi.org/10.1061/(ASCE)0733-9429(2001)127:1(6).
Dey, L., A. K. Barbhuiya, and P. Biswas. 2017. “Experimental study on bank erosion and protection using submerged vane placed at an optimum angle in a 180 laboratory channel bend.” Geomorphology 283 (Apr): 32–40. https://doi.org/10.1016/j.geomorph.2017.01.022.
DOE. 2022. “HydroWIRES initiative research roadmap.” Accessed July 30, 2024. https://www.energy.gov/eere/water/hydrowires-initiative.
Dou, B., M. Guala, L. Lei, and P. Zeng. 2019. “Wake model for horizontal-axis wind and hydrokinetic turbines in yawed conditions.” Appl. Energy 242 (May): 1383–1395. https://doi.org/10.1016/j.apenergy.2019.03.164.
Duan, J. G., L. He, X. Fu, and Q. Wang. 2009. “Mean flow and turbulence around experimental spur dike.” Adv. Water Resour. 32 (12): 1717–1725. https://doi.org/10.1016/j.advwatres.2009.09.004.
Engelund, F., and E. Hansen. 1967. A monograph on sediment transport in alluvial streams. Copenhagen, Denmark: Technical Univ. of Denmark.
Facchini, M., D. F. Vetsch, R. M. Boes, and A. Siviglia. 2024. “Modeling the morphological response of gravel–bed rivers subject to repeated sediment bypass tunnel operations.” Front. Earth Sci. 12 (Apr): 1357759. https://doi.org/10.3389/feart.2024.1357759.
Fan, J., and G. L. Morris. 1992a. “Reservoir sedimentation. I: Delta and density current deposits.” J. Hydraul. Eng. 118 (3): 354–369. https://doi.org/10.1061/(ASCE)0733-9429(1992)118:3(354).
Fan, J., and G. L. Morris. 1992b. “Reservoir sedimentation. II: Reservoir desiltation and long term storage capacity.” J. Hydraul. Eng. 118 (3): 370–384. https://doi.org/10.1061/(ASCE)0733-9429(1992)118:3(370).
Follett, E. M., and H. M. Nepf. 2012. “Sediment patterns near a model patch of reedy emergent vegetation.” Geomorphology 179 (Dec): 141–151. https://doi.org/10.1016/j.geomorph.2012.08.006.
Ghorbani, B., and J. Kells. 2008. “Effect of submerged vanes on the scour occurring at a cylindrical pier.” J. Hydraul. Res. 46 (5): 610–619. https://doi.org/10.3826/jhr.2008.3003.
Göçmen, T., P. van der Laan, P.-E. Réthoré, A. P. Diaz, G. C. Larsen, and S. Ott. 2016. “Wind turbine wake models developed at the technical University of Denmark: A review.” Renewable Sustainable Energy Rev. 60 (Jul): 752–769. https://doi.org/10.1016/j.rser.2016.01.113.
Grams, P. E., J. C. Schmidt, and D. J. Topping. 2007. “The rate and pattern of bed incision and bank adjustment on the Colorado River in Glen Canyon downstream from Glen Canyon Dam, 1956–2000.” Geol. Soc. Am. Bull. 119 (5–6): 556–575. https://doi.org/10.1130/B25969.1.
Gumgum, F., and A. H. Cardoso. 2023. “Optimizing the desilting efficiency of submerged vane fields at lateral diversions.” J. Hydraul. Eng. 149 (1): 04022031. https://doi.org/10.1061/(ASCE)HY.1943-7900.0002030.
Han, X., P. Lin, and G. Parker. 2022. “Influence of layout angles on river flow and local scour in grouped spur dikes field.” J. Hydrol. 614 (Nov): 128502. https://doi.org/10.1016/j.jhydrol.2022.128502.
Hansen, C., G. R. Ghimire, and S.-C. Kao. 2022. “Evaluation of nominal energy storage at existing hydropower reservoirs in the US.” Water Resour. Res. 58 (11): e2022WR032210. https://doi.org/10.1029/2022WR032210.
Hauer, C., et al. 2018. “State of the art, shortcomings and future challenges for a sustainable sediment management in hydropower: A review.” Renewable Sustainable Energy Rev. 98 (Dec): 40–55. https://doi.org/10.1016/j.rser.2018.08.031.
Hazel, J. E., Jr., D. J. Topping, J. C. Schmidt, and M. Kaplinski. 2006. “Influence of a dam on fine-sediment storage in a canyon river.” J. Geophys. Res.: Earth Surf. 111 (F1): 1–16. https://doi.org/10.1029/2004JF000193.
Herbich, J. B. 2000. Handbook of dredging engineering. 2nd ed. New York: McGraw-Hill.
Hill, C., M. Musa, L. P. Chamorro, C. Ellis, and M. Guala. 2014. “Local scour around a model hydrokinetic turbine in an erodible channel.” J. Hydraul. Eng. 140 (8): 04014037. https://doi.org/10.1061/(ASCE)HY.1943-7900.0000900.
Ismail, H., Y. Xu, and X. Liu. 2021. “Flow and scour around idealized porous engineered log jam structures.” J. Hydraul. Eng. 147 (1): 04020089. https://doi.org/10.1061/(ASCE)HY.1943-7900.0001833.
Jenzer Althaus, J. M., G. De Cesare, and A. J. Schleiss. 2015. “Sediment evacuation from reservoirs through intakes by jet-induced flow.” J. Hydraul. Eng. 141 (2): 04014078. https://doi.org/10.1061/(ASCE)HY.1943-7900.0000970.
Kang, S., X. Yang, and F. Sotiropoulos. 2014. “On the onset of wake meandering for an axial flow turbine in a turbulent open channel flow.” J. Fluid Mech. 744 (Apr): 376–403. https://doi.org/10.1017/jfm.2014.82.
Kantoush, S. A., A. Mousa, E. M. Shahmirzadi, T. Toshiyuki, and T. Sumi. 2021. “Pilot field implementation of suction dredging for sustainable sediment management of dam reservoirs.” J. Hydraul. Eng. 147 (2): 04020098. https://doi.org/10.1061/(ASCE)HY.1943-7900.0001843.
Khosronejad, A., J. Kozarek, P. Diplas, C. Hill, R. Jha, P. Chatanantavet, N. Heydari, and F. Sotiropoulos. 2018. “Simulation-based optimization of in-stream structures design: Rock vanes.” Environ. Fluid Mech. 18: 695–738.
Khosronejad, A., J. L. Kozarek, M. L. Palmsten, and F. Sotiropoulos. 2015. “Numerical simulation of large dunes in meandering streams and rivers with in-stream rock structures.” Adv. Water Resour. 81 (Jul): 45–61. https://doi.org/10.1016/j.advwatres.2014.09.007.
Khosronejad, A., J. L. Kozarek, and F. Sotiropoulos. 2014. “Simulation-based approach for stream restoration structure design: Model development and validation.” J. Hydraul. Eng. 140 (9): 04014042. https://doi.org/10.1061/(ASCE)HY.1943-7900.0000904.
Khosronejad, A., and F. Sotiropoulos. 2014. “Numerical simulation of sand waves in a turbulent open channel flow.” J. Fluid Mech. 753 (Aug): 150. https://doi.org/10.1017/jfm.2014.335.
Kim, H. S., I. Kimura, and Y. Shimizu. 2015. “Bed morphological changes around a finite patch of vegetation.” Earth Surf. Processes Landforms 40 (3): 375–388. https://doi.org/10.1002/esp.3639.
Kougias, I., et al. 2019. “Analysis of emerging technologies in the hydropower sector.” Renewable Sustainable Energy Rev. 113 (Oct): 109257. https://doi.org/10.1016/j.rser.2019.109257.
Lai, J.-S., and H. W. Shen. 1996. “Flushing sediment through reservoirs.” J. Hydraul. Res. 34 (2): 237–255. https://doi.org/10.1080/00221689609498499.
Lai, Y. G., J. Huang, and B. P. Greimann. 2024. “Hydraulic flushing of sediment in reservoirs: Best practices of numerical modeling.” Fluids 9 (2): 38. https://doi.org/10.3390/fluids9020038.
Lee, J., J. Marr, and M. Guala. 2022a. “On sediment mass flux directionality induced by yawed permeable vanes under near-critical mobility conditions.” J. Hydraul. Eng. 148 (10): 04022019. https://doi.org/10.1061/(ASCE)HY.1943-7900.0002006.
Lee, J., M. Musa, and M. Guala. 2021. “Scale-dependent bedform migration and deformation in the physical and spectral domains.” J. Geophys. Res.: Earth Surf. 126 (5): e2020JF005811. https://doi.org/10.1029/2020JF005811.
Lee, J., A. Singh, and M. Guala. 2022b. “Reconstructing sediment transport by migrating bedforms in the physical and spectral domains.” Water Resour. Res. 58 (7): e2022WR031934. https://doi.org/10.1029/2022WR031934.
Lee, J., A. Singh, and M. Guala. 2023. “On the scaling and growth limit of fluvial dunes.” J. Geophys. Res.: Earth Surf. 128 (6): e2022JF006955. https://doi.org/10.1029/2022JF006955.
Li, D., et al. 2022. “High mountain Asia hydropower systems threatened by climate-driven landscape instability.” Nat. Geosci. 15 (7): 520–530. https://doi.org/10.1038/s41561-022-00953-y.
Magilligan, F. J., and K. H. Nislow. 2005. “Changes in hydrologic regime by dams.” Geomorphology 71 (1–2): 61–78. https://doi.org/10.1016/j.geomorph.2004.08.017.
Modali, P. K., A. Vinod, and A. Banerjee. 2021. “Towards a better understanding of yawed turbine wake for efficient wake steering in tidal arrays.” Renewable Energy 177 (Nov): 482–494. https://doi.org/10.1016/j.renene.2021.05.152.
Morris, G. L., and J. Fan. 1998. Reservoir sedimentation handbook: Design and management of dams, reservoirs, and watersheds for sustainable use. New York: McGraw-Hill.
Musa, M., M. Heisel, and M. Guala. 2018a. “Predictive model for local scour downstream of hydrokinetic turbines in erodible channels.” Phys. Rev. Fluids 3 (2): 024606. https://doi.org/10.1103/PhysRevFluids.3.024606.
Musa, M., C. Hill, and M. Guala. 2019. “Interaction between hydrokinetic turbine wakes and sediment dynamics: Array performance and geomorphic effects under different siting strategies and sediment transport conditions.” Renewable Energy 138 (Aug): 738–753. https://doi.org/10.1016/j.renene.2019.02.009.
Musa, M., C. Hill, F. Sotiropoulos, and M. Guala. 2018b. “Performance and resilience of hydrokinetic turbine arrays under large migrating fluvial bedforms.” Nat. Energy 3 (10): 839–846. https://doi.org/10.1038/s41560-018-0218-9.
Musa, M., G. Ravanelli, W. Bertoldi, and M. Guala. 2020. “Hydrokinetic turbines in yawed conditions: Toward synergistic fluvial installations.” J. Hydraul. Eng. 146 (4): 04020019. https://doi.org/10.1061/(ASCE)HY.1943-7900.0001707.
Neary, V., F. Sotiropoulos, and A. Odgaard. 1999. “Three-dimensional numerical model of lateral-intake inflows.” J. Hydraul. Eng. 125 (2): 126–140. https://doi.org/10.1061/(ASCE)0733-9429(1999)125:2(126).
Odgaard, A. J., and J. F. Kennedy. 1983. “River-bend bank protection by submerged vanes.” J. Hydraul. Eng. 109 (8): 1161–1173. https://doi.org/10.1061/(ASCE)0733-9429(1983)109:8(1161).
Odgaard, A. J., and Y. Wang. 1991a. “Sediment management with submerged vanes. I: Theory.” J. Hydraul. Eng. 117 (3): 267. https://doi.org/10.1061/(ASCE)0733-9429(1991)117:3(267).
Odgaard, A. J., and Y. Wang. 1991b. “Sediment management with submerged vanes. II: Applications.” J. Hydraul. Eng. 117 (3): 284–302. https://doi.org/10.1061/(ASCE)0733-9429(1991)117:3(284).
Ohori, H., M. Ono, Y. Takata, G. Nagatani, and T. Sumi. 2018. “Case analysis of sediment bypass tunnels (Switzerland, Taiwan, Japan).” In Proc., 26th Int. Congress on Large Dams, 351–366. Kyoto, Japan: Kyoto Univ.
Podolak, C. J., and M. W. Doyle. 2015. “Reservoir sedimentation and storage capacity in the United States: Management needs for the 21st century.” J. Hydraul. Eng. 141 (4): 02515001. https://doi.org/10.1061/(ASCE)HY.1943-7900.0000999.
Randall, R. E. 2022. “Fluid dynamics of dredging.” Phys. Fluids 34 (1): 013304. https://doi.org/10.1063/5.0076904.
Randle, T. J., G. L. Morris, D. D. Tullos, F. H. Weirich, G. M. Kondolf, D. N. Moriasi, G. W. Annandale, J. Fripp, J. T. Minear, and D. L. Wegner. 2021. “Sustaining United States reservoir storage capacity: Need for a new paradigm.” J. Hydrol. 602 (Nov): 126686. https://doi.org/10.1016/j.jhydrol.2021.126686.
Redolfi, M., M. Musa, and M. Guala. 2021. “On steady alternate bars forced by a localized asymmetric drag distribution in erodible channels.” J. Fluid Mech. 916 (Jun): A13. https://doi.org/10.1017/jfm.2021.122.
Rominger, J. T., A. F. Lightbody, and H. M. Nepf. 2010. “Effects of added vegetation on sand bar stability and stream hydrodynamics.” J. Hydraul. Eng. 136 (12): 994–1002. https://doi.org/10.1061/(ASCE)HY.1943-7900.0000215.
Sandoval, J., K. Soto-Rivas, C. Gotelli, and C. Escauriaza. 2021. “Modeling the wake dynamics of a marine hydrokinetic turbine using different actuator representations.” Ocean Eng. 222 (Feb): 108584. https://doi.org/10.1016/j.oceaneng.2021.108584.
Schalko, I., C. Lageder, L. Schmocker, V. Weitbrecht, and R. Boes. 2019. “Laboratory flume experiments on the formation of spanwise large wood accumulations: Part II—Effect on local scour.” Water Resour. Res. 55 (6): 4871–4885. https://doi.org/10.1029/2019WR024789.
Schleiss, A. J., M. J. Franca, C. Juez, and G. De Cesare. 2016. “Reservoir sedimentation.” J. Hydraul. Res. 54 (6): 595–614. https://doi.org/10.1080/00221686.2016.1225320.
Schmidt, J. C., and P. R. Wilcock. 2008. “Metrics for assessing the downstream effects of dams.” Water Resour. Res. 44 (4): 1–19. https://doi.org/10.1029/2006WR005092.
Schmitt, R. J., S. Bizzi, A. Castelletti, J. Opperman, and G. M. Kondolf. 2019. “Planning dam portfolios for low sediment trapping shows limits for sustainable hydropower in the Mekong.” Sci. Adv. 5 (10): eaaw2175. https://doi.org/10.1126/sciadv.aaw2175.
Simons, D. B., E. V. Richardson, and C. F. Nordin. 1965. Bedload equation for ripples and dunes. Washington, DC: US Government Printing Office.
Sotiropoulos, F., and A. Khosronejad. 2016. “Sand waves in environmental flows: Insights gained by coupling large-eddy simulation with morphodynamics.” Phys. Fluids 28 (2): 021301. https://doi.org/10.1063/1.4939987.
Sumi, T. 2008. “Evaluation of efficiency of reservoir sediment flushing in Kurobe River.” In Proc., 4th Int. Conf. on Scour and Erosion, 5–7. Tokyo: Japanese Geotechnical Society.
Sumi, T., M. Okano, and Y. Takata. 2004. “Reservoir sedimentation management with bypass tunnels in Japan.” In Proc., 9th Int. Symp. on River Sedimentation, 1036–1043. Beijing: Tsinghua University Press.
Uijttewaal, W. S. 2005. “Effects of groyne layout on the flow in groyne fields: Laboratory experiments.” J. Hydraul. Eng. 131 (9): 782–791. https://doi.org/10.1061/(ASCE)0733-9429(2005)131:9(782).
Van Dijk, W., R. Teske, W. Van de Lageweg, and M. Kleinhans. 2013. “Effects of vegetation distribution on experimental river channel dynamics.” Water Resour. Res. 49 (11): 7558–7574. https://doi.org/10.1002/2013WR013574.
Wild, T. B., P. M. Reed, D. P. Loucks, M. Mallen-Cooper, and E. D. Jensen. 2019. “Balancing hydropower development and ecological impacts in the Mekong: Tradeoffs for Sambor Mega Dam.” J. Water Resour. Plann. Manage. 145 (2): 05018019. https://doi.org/10.1061/(ASCE)WR.1943-5452.0001036.
Winton, R. S., E. Calamita, and B. Wehrli. 2019. “Reviews and syntheses: Dams, water quality and tropical reservoir stratification.” Biogeosciences 16 (8): 1657–1671. https://doi.org/10.5194/bg-16-1657-2019.
Xu, H., Z. Cao, and Q. Wang. 2023. “Experimental investigation on reservoir sediment flushing through a bottom tunnel with an initially covered intake.” J. Hydraul. Eng. 149 (8): 04023024. https://doi.org/10.1061/JHEND8.HYENG-13580.
Zomer, J., S. Naqshband, B. Vermeulen, and A. Hoitink. 2021. “Rapidly migrating secondary bedforms can persist on the lee of slowly migrating primary river dunes.” J. Geophys. Res.: Earth Surf. 126 (3): e2020JF005918. https://doi.org/10.1029/2020JF005918.
Information & Authors
Information
Published In

Journal of Hydraulic Engineering
Volume 150 • Issue 6 • November 2024
Copyright
This work is made available under the terms of the Creative Commons Attribution 4.0 International license, https://creativecommons.org/licenses/by/4.0/.
History
Received: Jan 22, 2024
Accepted: Jul 5, 2024
Published online: Aug 14, 2024
Published in print: Nov 1, 2024
Discussion open until: Jan 14, 2025
ASCE Technical Topics:
- Bed forms
- Bed loads
- Bodies of water (by type)
- Channels (waterway)
- Coasts, oceans, ports, and waterways engineering
- Engineering fundamentals
- Engineering mechanics
- Equipment and machinery
- Hydraulic engineering
- Hydraulic structures
- River and stream beds
- River engineering
- Rivers and streams
- Sediment
- Sediment transport
- Static loads
- Statics (mechanics)
- Structural analysis
- Structural engineering
- Structures (by type)
- Thermodynamics
- Transport phenomena
- Transport rates
- Vanes
- Water and water resources
- Water management
- Waterways
Authors
Metrics & Citations
Metrics
Citations
Download citation
If you have the appropriate software installed, you can download article citation data to the citation manager of your choice. Simply select your manager software from the list below and click Download.