Effects of Air Vent Size and Location Design on Air Supply Efficiency in Flood Discharge Tunnel Operations
Publication: Journal of Hydraulic Engineering
Volume 149, Issue 12
Abstract
Low-level outlets are essential flood discharge structures for high-head dams. High-speed free-surface flows releasing into tunnels lead to substantial air discharge, and the air supply is important for gate vibration mitigation, cavitation protection by aeration, and slug flow transition phenomena. An additional challenge is the excessive wind noise due to low air supply efficiency, threatening staff working conditions in flood discharge operations. However, the current understanding of the effects of air vent sizes and locations on the air supply efficiency is still limited. In the present study, based on a series of experimental tests, air vent designs of long flood discharge tunnels, including a single vent and two combined working vents, are analyzed with respect to the air discharge variation. For air vent designs with a small vent size and an installation location downstream, the air discharge into the tunnel is low, and the air supply efficiency is low even for two combined working vents. Equations for the air supply efficiency are proposed, which enables quantifying the ventilation performance, and related vent parameters are recommended for favorable air ventilation designs. The present investigation provides a reference for the flood discharge tunnel design and ventilation operation assessment in hydraulic engineering.
Practical Applications
Air ventilation design is an important part of flood discharge tunnels and water supply and drainage systems. The single air vent sizes, locations, and combined working vents are considered in the present studies. The single air vent sizes, air vent downstream locations, and two vent distances are effect factors, providing reasonable assessment methods to predict the air supply efficiency for different structural and hydraulic conditions. A reasonable hydraulic design can obtain high air supply efficiency and regulate air discharge distributions in multiple air vents. The guidelines in the present analyses are effective to optimize the multiple air ventilation system and to obtain safety operations and acceptable staff working conditions.
Introduction
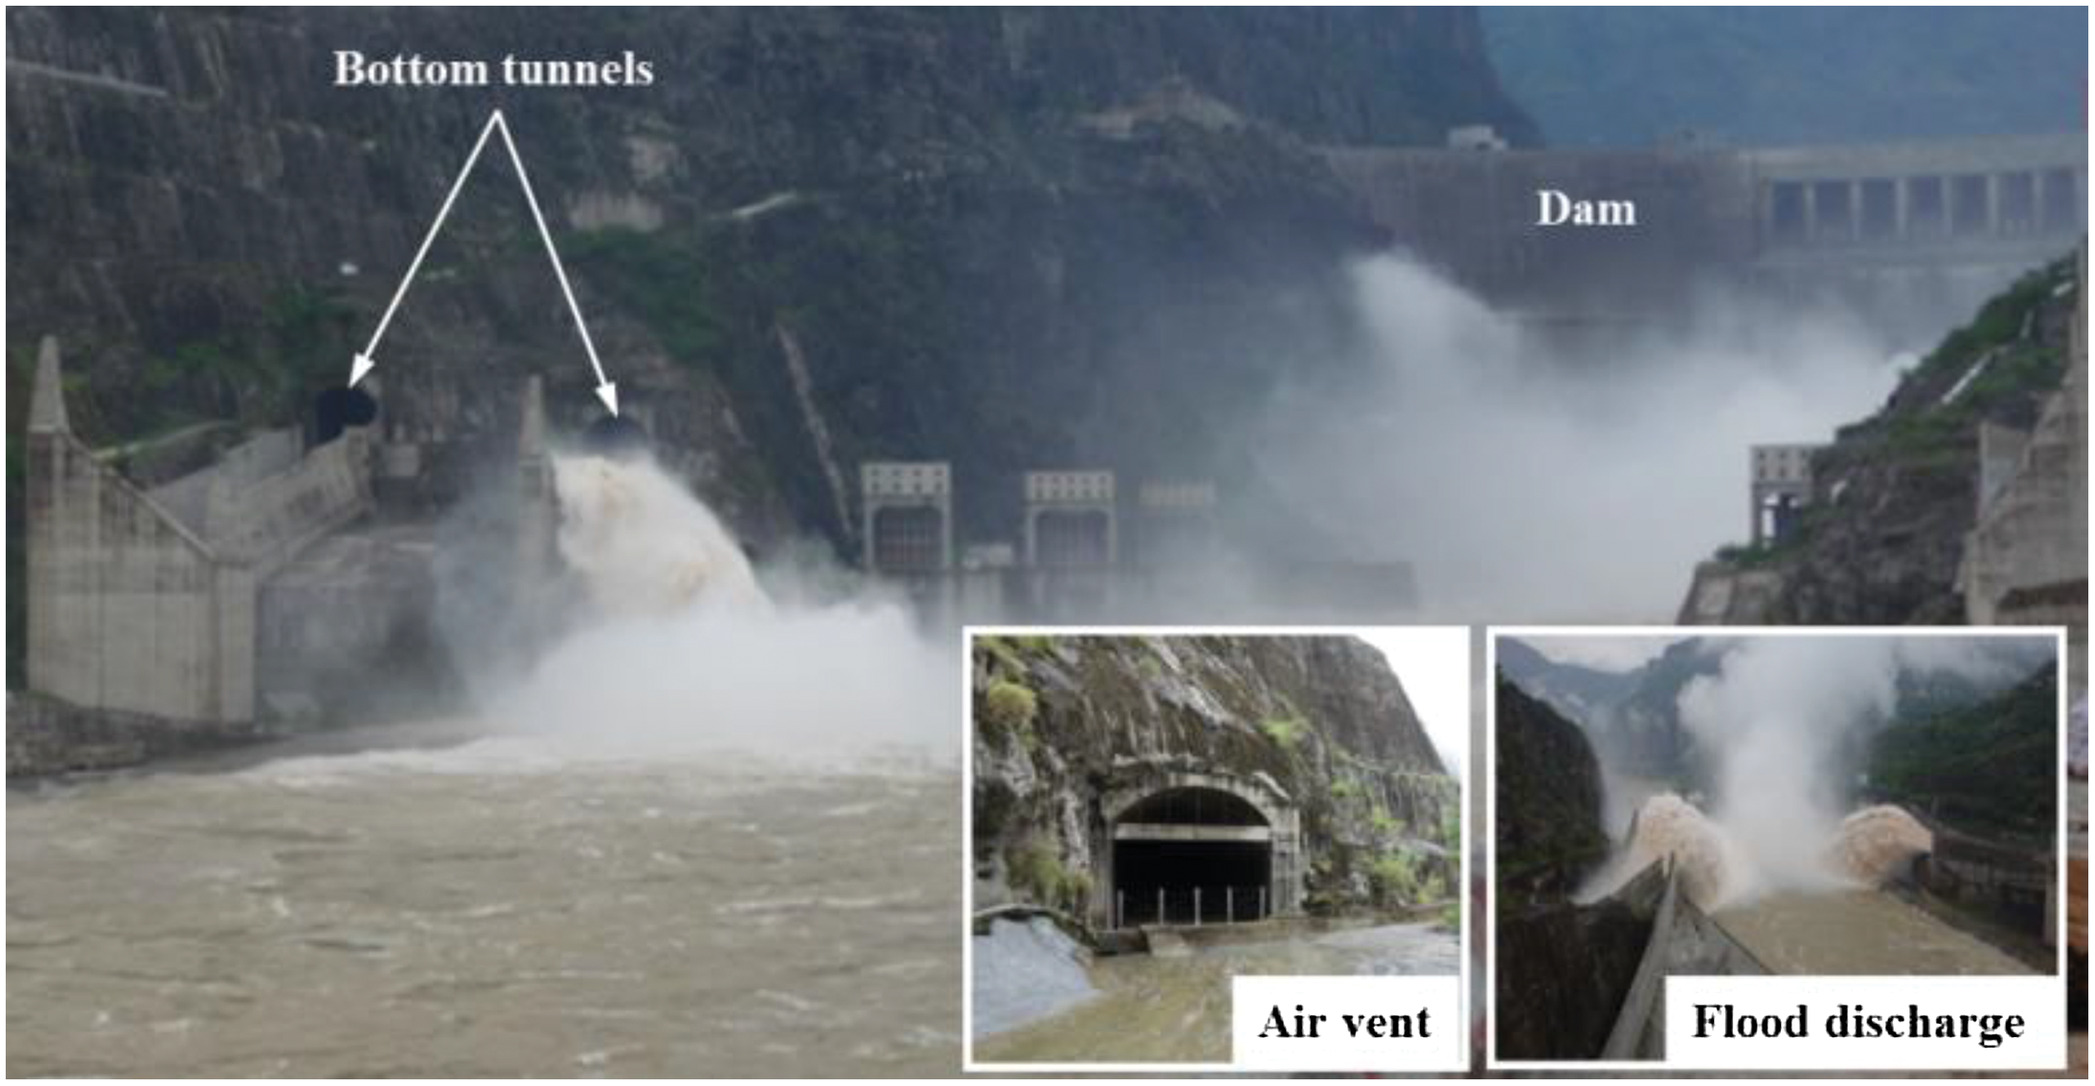
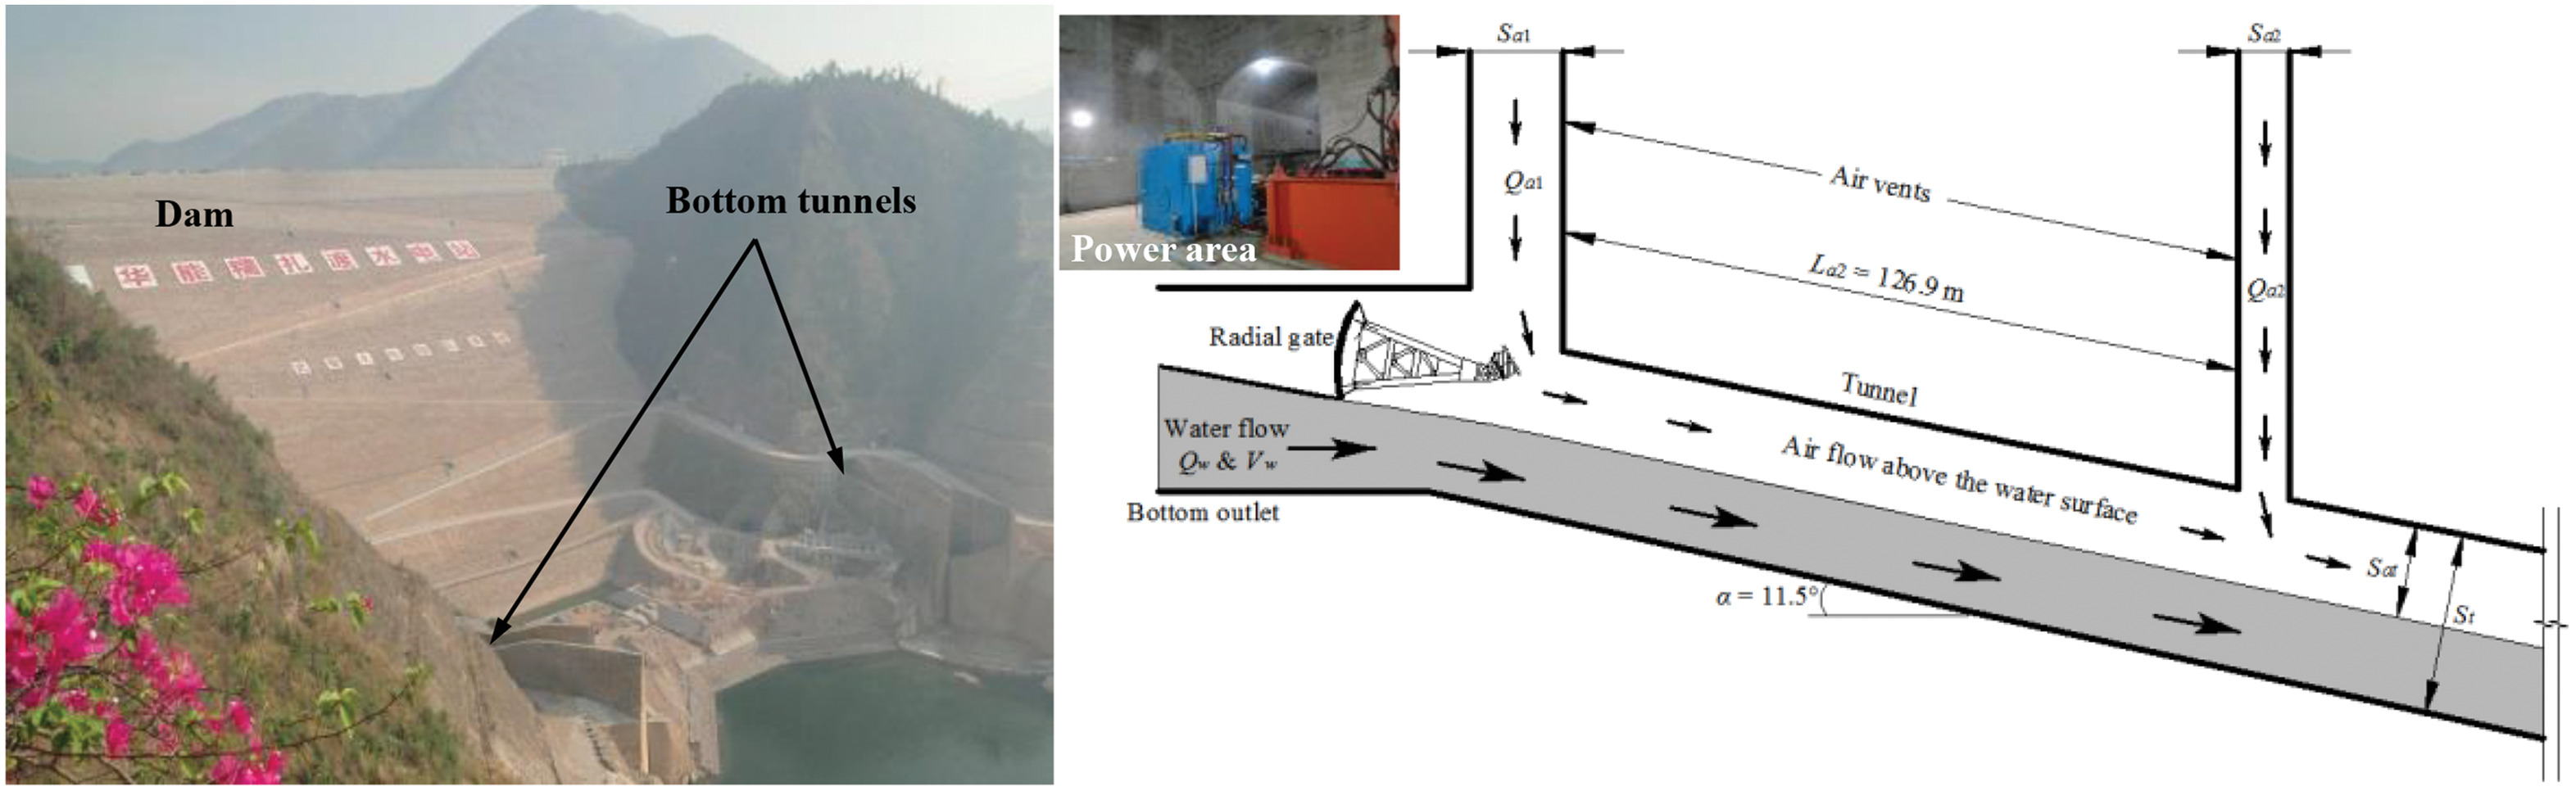
Low-level outlets are important hydraulic structures in high-head dams for emergency flood discharge operations, sediment flushing, and water level control in reservoirs (Ma and Chi 2016; Kundzewicz et al. 2019). The high water head results in a high-velocity free-surface flow in the flood discharge tunnel, as shown in Fig. 1. The approach flow velocity through a pressurized low-level outlet can exceed , and the high-speed free-surface flow entrains and drags a lot of air downstream. Thus, air ventilation structures are designed to supply air into the flood discharge tunnel. In high-head dams, the water flow leads to a large air pressure drop and high air velocities in vents and tunnels. The air supply system is typically designed based on the tunnel geometry, air vent size, and operating flow hydraulic conditions (Campbell and Guyton 1953; Aydin 2002; Shao et al. 2016). Insufficient air discharge could result in cavitation erosion problems affecting the safety operation of low-level outlets (Falvey 1980; Volkart and Rutschmann 1991). Insufficient air discharge could result in cavitation erosion problems affecting the safety operation of low-level outlets (Falvey 1990). Moreover, an additional challenge may be the excessive wind noise in flood discharge operations. Although the tunnel operation safety was satisfied even at low air supply efficiency, the high air velocity with wind noise exceeding 85 dB threatened staff working conditions (Davies and Williams 1968; Falvey 1980). The feasible options included vent size variation and an additional vent to generate two combined working vents (Chen and Huang 1984; Luo 1984). A couple of combined working vents were installed downstream of a long flood discharge tunnel, such as the Rumei tunnel, Houziyan tunnel, and Lianghekou tunnel (Xu 2016; Du et al. 2021; Ma et al. 2022). More detailed recommendations for the vent design are required to improve the air supply performance in flood discharge tunnels.
For the air discharge estimation in flood discharge tunnels, a series of relations were developed based on different flow patterns, including spray flow, supercritical free surface flow, and hydraulic jump flow (Wisner 1967; Sharma 1973; Huang and Griffin 2014). Some valuable prototype investigations on high-head tunnels emphasized that the air supply was determined by flow patterns, tunnel layouts, and air vent loss coefficients (Lier and Volkart 1994; Volkart and Speerli 1994; Hohermuth et al. 2021a). In addition to flow parameter effects, such as the water discharge rate and flow Froude number, the effect of the ratio of the residual air area over the total tunnel cross-section was introduced (Sharma 1976; Speerli 1999; Tullis and Larchar 2011; Wright and Tullis 2014). Although the air space was a dependent variable in a certain closed tunnel (Goldring 1983), its effect on the air flow prediction was essential for the assessment on multiple hydraulic structures. Speerli and Hager (2000) suggested that the residual air area ratio should be larger than 30% to avoid slug flow filling the tunnel. Using numerical simulations, Song et al. (2022) suggested that the relative residual air area determined not only the air discharge but also air flow velocity distributions for different vent sizes. Wei et al. (2021) proposed a relation between the residual air area and average air velocity, which achieved the air discharge estimation of the prototype tunnel with velocities up to .
The air vent is usually set near the low-level outlet where the negative air pressure is minimal to supply air as much as possible (Fuentes and Garcia 1984; Speerli 1999; Edwini-Bonsu and Steffler 2006; Hohermuth 2019). Previous studies focused on the air discharge affected by approach water flow, air vent cross-section, and tunnel size conditions. Experimental observations showed that the air discharge decreased with decreasing cross-sectional area of the air vent (Rabben and Rouvé 1984; Safavi et al. 2008; Husain et al. 2014). To clarify the main factors determining the air discharge, Hohermuth et al. (2020) conducted a large-scale experimental model to obtain systemic air supply data, and the results emphasized the effects of air vent geometry and the loss coefficient. The increasing relative air vent size led to a larger air discharge, and this effect should be modified by the air vent loss coefficient. The specific loss coefficient increased with the differential negative pressure in the vent, reducing the air discharge especially for long tunnels. Combined with the related the prototype observations on the high-speed flood discharge (Hohermuth et al. 2021a), obvious changes of free surface drag effects indicated that the residual air area related to the tunnel and air ventilation geometries should be considered as a specific factor influencing the air supply performance. The tunnel length and slope were also considered for the air supply performance as they affected the negative pressure distributions in the bottom tunnel (Hohermuth 2017). Although the previous studies have provided some important understanding of the air supply in low-level outlets, investigations about the air supply efficiency affected by multiple air vents of different sizes have been limited so far.
To provide practical references for air vent designs for low-level outlets, the present study focuses on the air supply efficiency for different vent layouts, using systematic hydraulic model tests. Single air vent sizes, locations, and two combined working vents are considered for different approach flow conditions. According to the differences in air supply efficiency, the effects of a single air vent and two working air vents on the air discharge are determined. Based on the quantitative estimation for the air discharge, the principles of air vent parameters are discussed, incorporating the assessment of prototype air ventilation and flood discharge operations.
Experimental Setup and Parameter Designs
A physical model of a typical flood discharge tunnel with a low-level outlet was built at the State Key Laboratory of Hydraulics and Mountain River Engineering, Sichuan University (Fig. 2). The gate chamber, flume, and air vents were made of acrylic glass. Using a pump for water discharge supply with a maximum capacity of , the low-level outlet was set with a pump pipe, and the outlet height operated in a range from 0.08 m to 0.20 m. A rectangular flume was connected to the outlet with a length of , as shown in Fig. 3. The tunnel slope was . The tunnel had a constant width of , which was the same as the outlet width. The water discharge was measured by a thin rectangular weir downstream. The approach water flow velocity was computed by . A series of detachable plates was set as the tunnel roof, which were fixed by a series of screw bolts, allowing for a continuous variation in the tunnel height. A single air vent or two air vents were set at the tunnel roof with a 0.25 m width, and the air vent size in flow direction was variable.
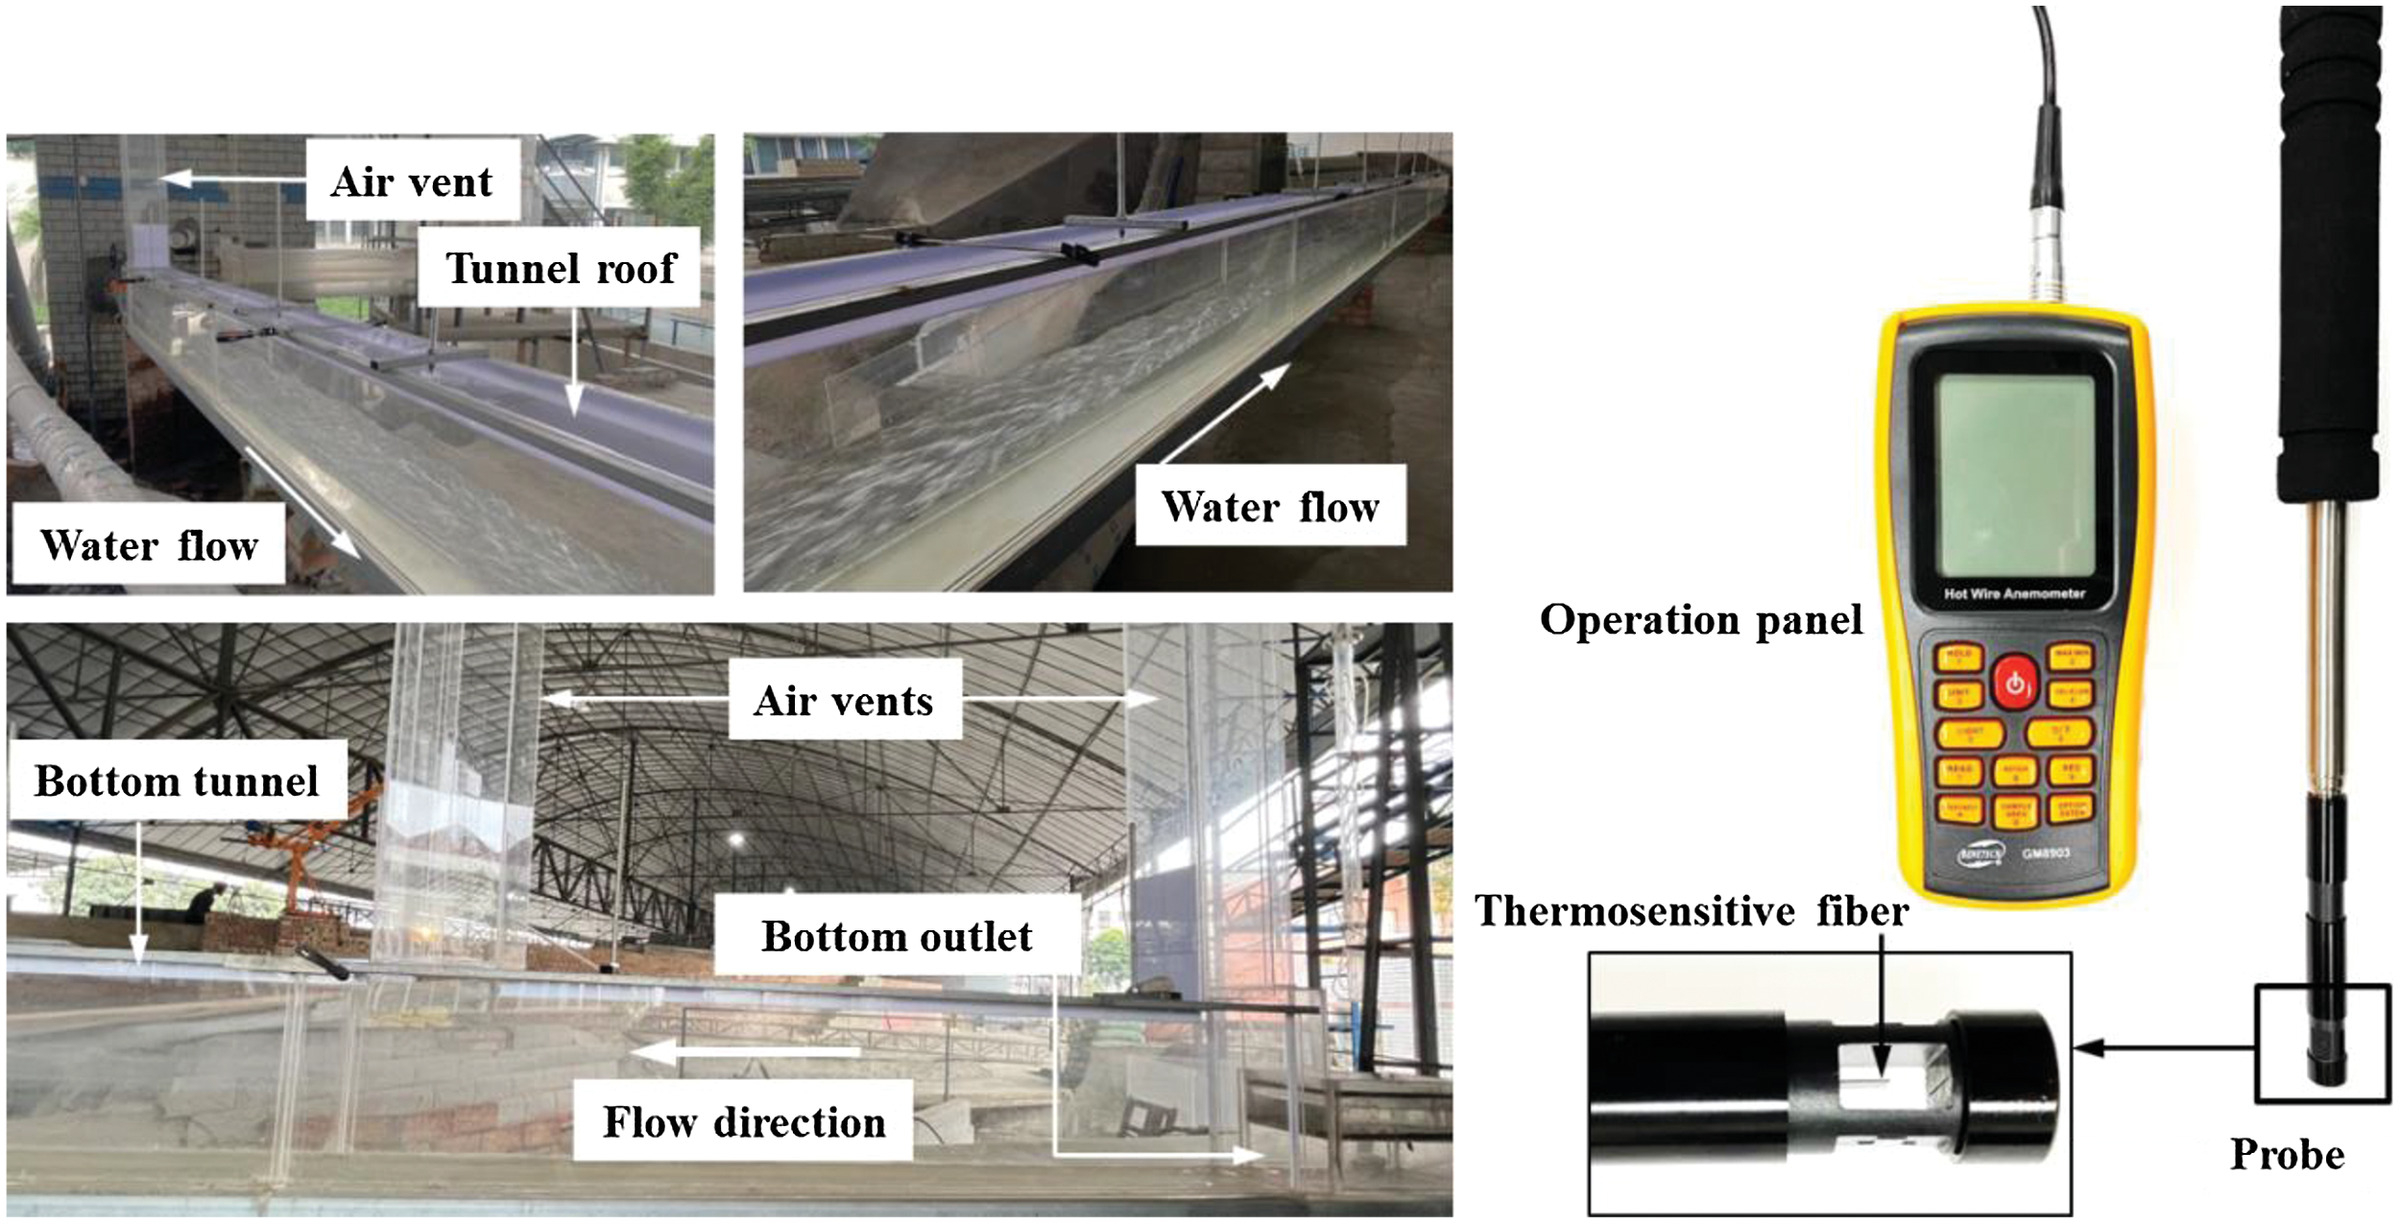
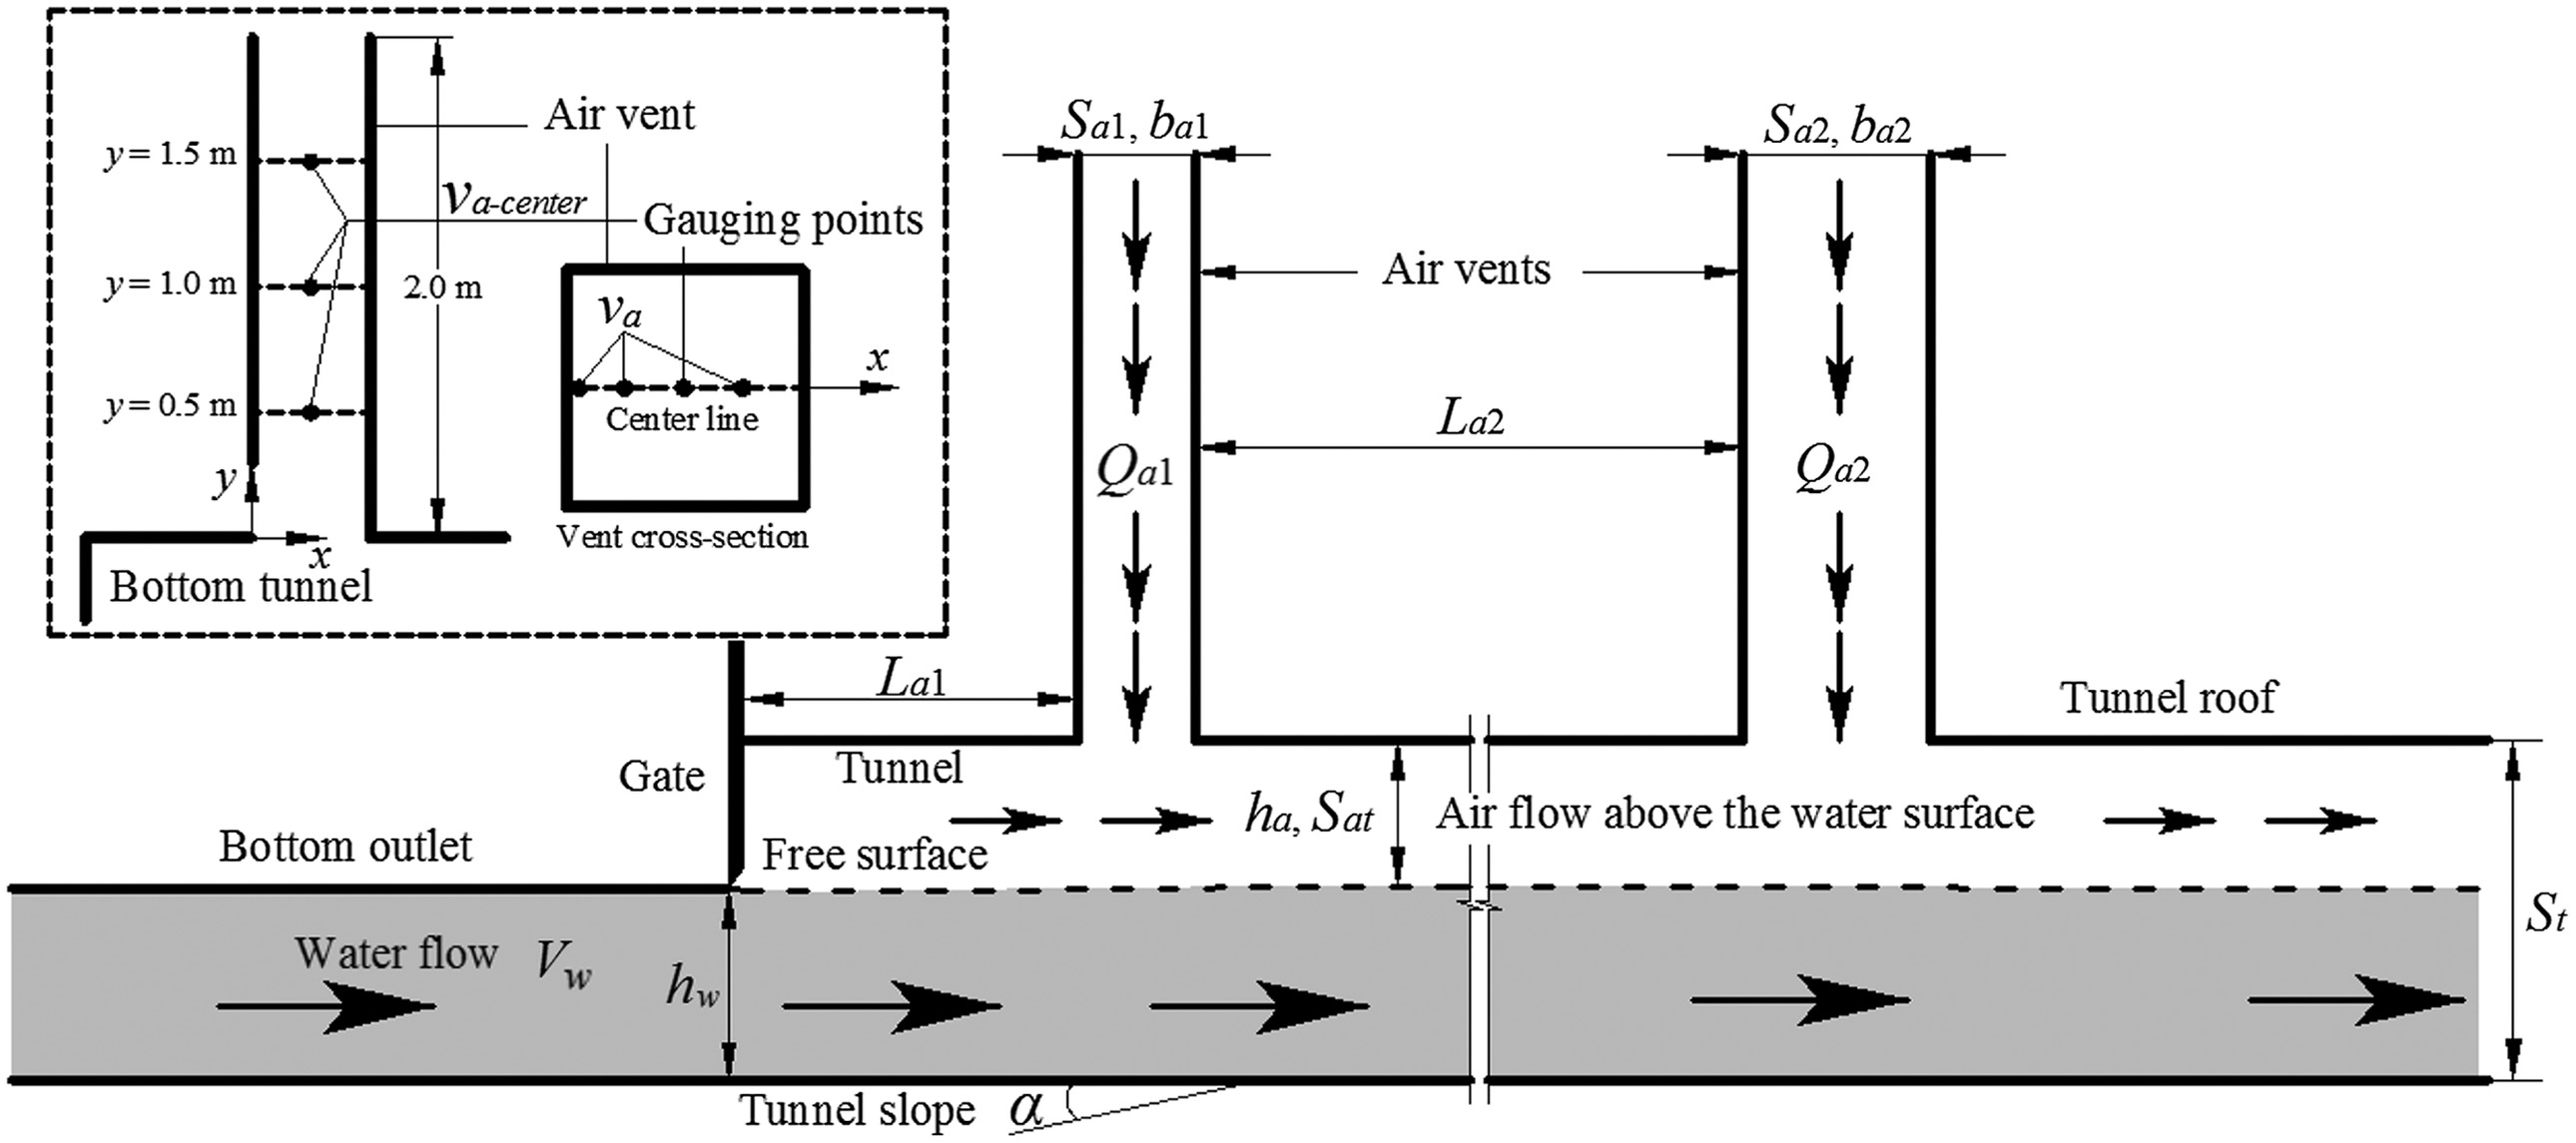
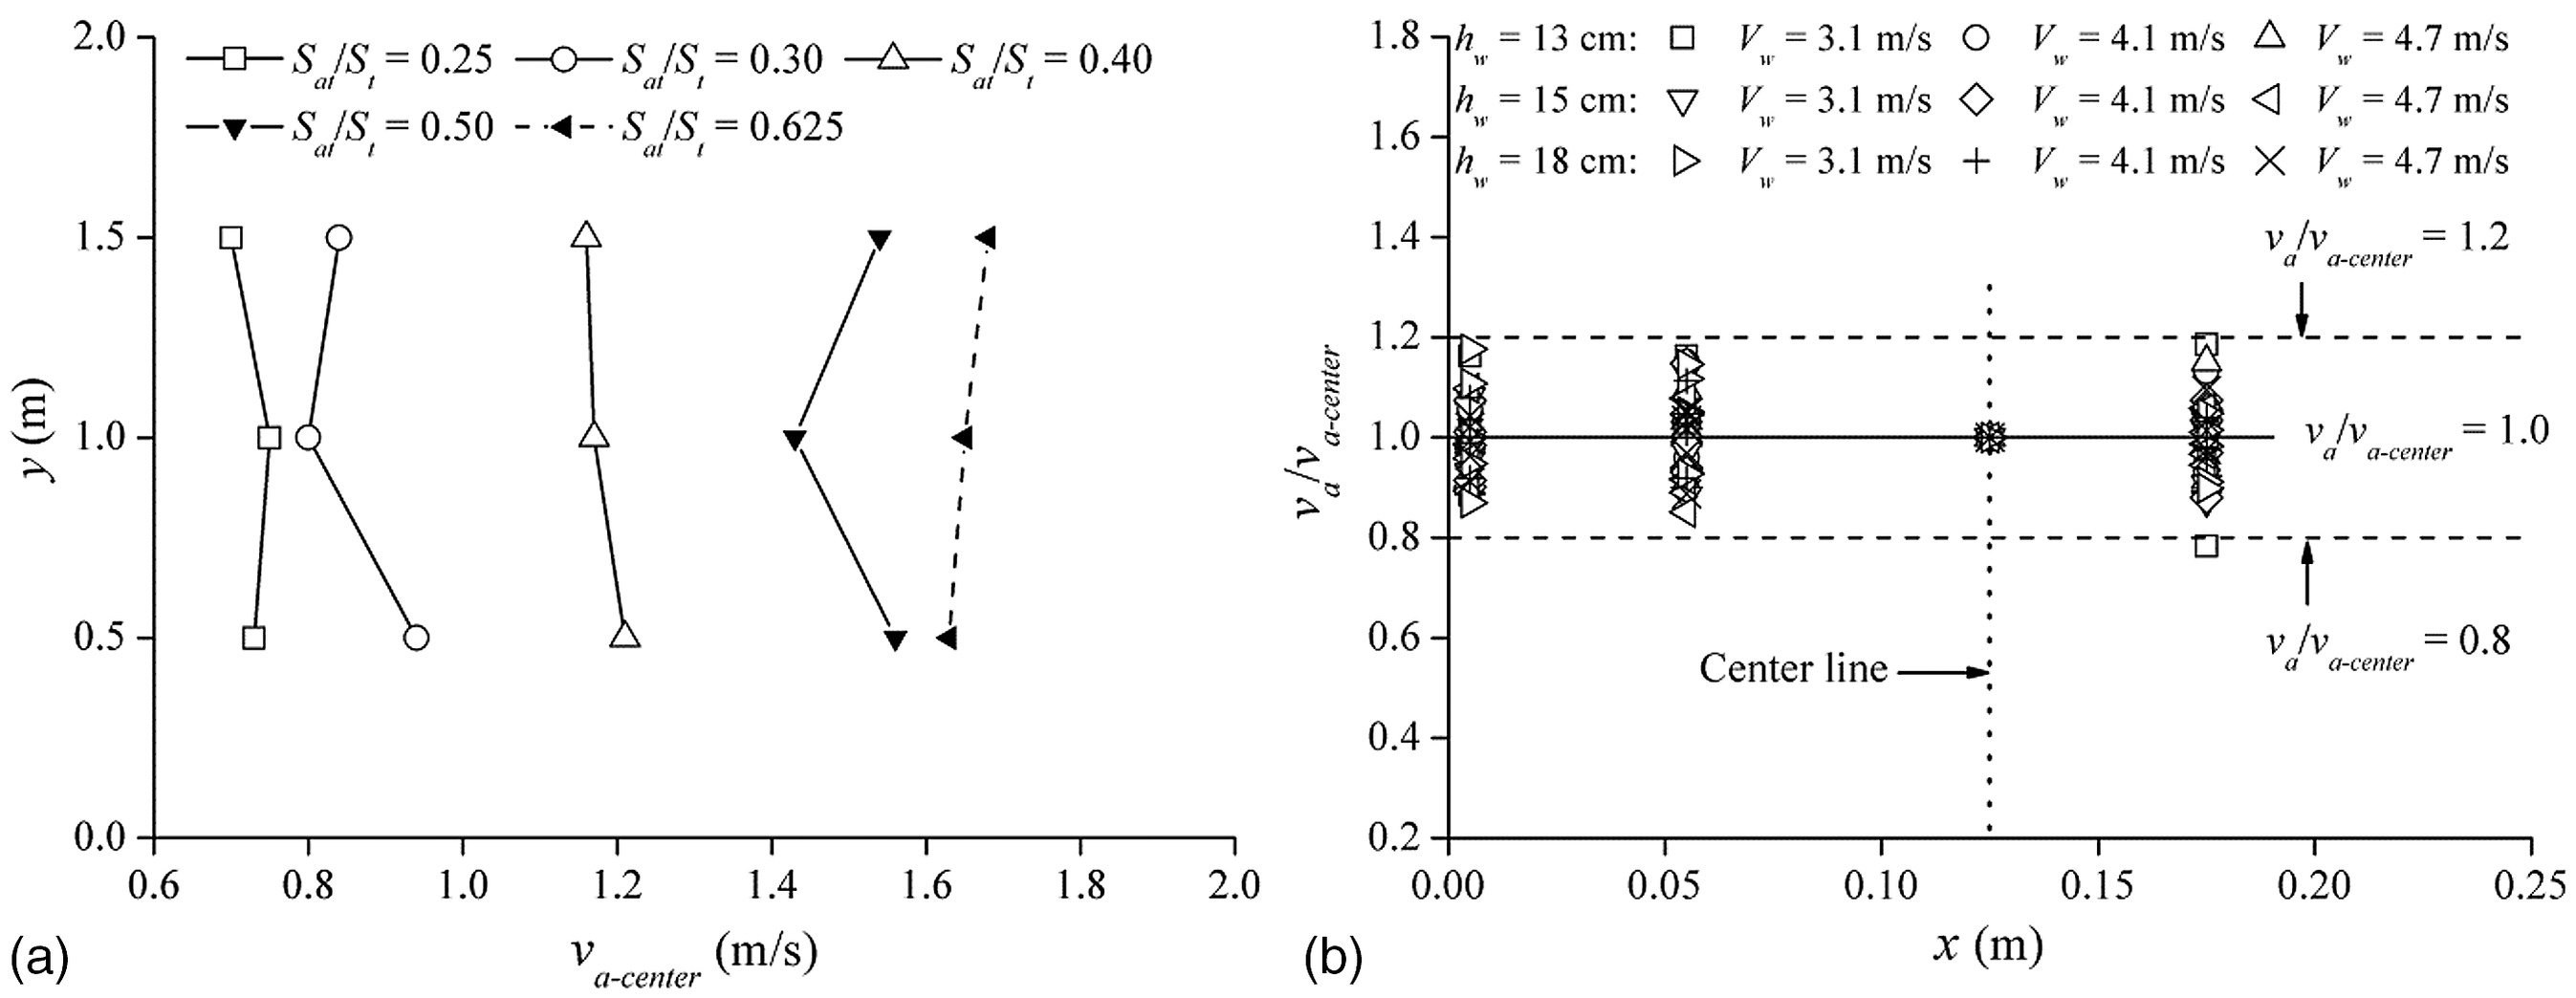
The air vent height was 2 m height, about 5–10 times of the tunnel height. The air velocity in the vent was measured along the center line from 1.5 m to 0.5 m using a thermal anemometer (GM8903, China) with an accuracy of (Fig. 3). Four gauging points at the vent cross-section were set, and the specific positions from the upstream vent sidewall were , 0.055 m, 0.125 m, and 0.175 m, respectively. For each measurement point, the sampling frequency and duration was 1 Hz and 120 s, respectively, to obtain a relatively stable value of the air flow velocity. Fig. 4 shows measurement results of air flow velocities in the tested air vents. According to the measured cross-sectional air velocities in the air vent, the cross-sectional distributions are close to uniform and there is no obvious trend. This is mainly because the air flow velocity is low in the model vent within the boundary layer induced by the smooth acrylic glass. Most values fluctuate within of . Thus, the air discharge through the air vent was computed from the product of and the vent cross-section square. It should be noted that compared to the experimental model, air vents in prototype flood discharge tunnels are significantly longer, and the head loss in long air vents needs to be considered.
All parameter combinations were tested for three approach water velocities, namely, , , and . The approach flow depth or the outlet height was varied from 0.13 m to 0.18 m. A series of relative areas of the air flow in the tunnel cross-section were controlled with , 0.30, 0.40, 0.50, 0.625, and 0.675, by adjusting the tunnel height . For different approach flow depths, the air layer height above the flow free surface varied from 0.03 m to 0.25 m. To investigate the effects of vent layouts on the air supply discharge, in the present experimental tests, a single air vent and two combined working vents were used. For single air vent effects, the vent length size and distance location to the bottom outlet conditions were tested. Seven sizes ranged from 0.03 m to 0.25 m with , and 4 m. For the two air vent tests, the upstream air vent was set near the gate chamber () with a minimum size design . The second air vent was set 4 m downstream () with size ranging from 0.03 to 0.27 cm. All these flow and air vent conditions led to a total of 225 runs with free surface flows in the tunnel.
According to different flow patterns in tunnels, air flow discharges transported by water flows were formulated using different equations (Rabben 1984; Huang and Griffin 2014). For this study, the flow Froude number ranged from 2.07 to 5.30, which indicated that the supercritical flow was satisfied for each test run. The total air discharge for a free-flow tunnel contains the air discharge entrained into the water and the air flow above the free surface (Qian et al. 2017; Hohermuth et al. 2021b). For the present flow conditions with a small chute slope, the flow velocity was too small for significant free surface aeration. The rectangular outlet design ensured the stable water flow as a stratified free-surface flow, which prevailed for large gate opening operations. This avoided the effects of different water flow patterns (e.g., spray flow, foam flow, hydraulic jump flow, or pressurized flow) on the air supply efficiency. The previous investigation suggested that the tunnel was long with the ratio of was greater than 36.5, for which the air was mainly supplied from the air vent (Gongchun and Chupei 1987). If the tunnel was short with the was less than 27.5, a considerable amount of air was supplied from the tunnel end and the counter-current air flow generated above the free surface flow. The present tunnel length ranged from 40 to 92.5, indicating that the air discharge was supplied by vents and the counter-current could be neglected for the air vents considered herein.
Results and Discussion
Effects of Single Air Vent Size on Air Supply
For a single vent near the gate chamber () with air vent size for , Fig. 5(a) shows the air discharge variations in the tunnel, and there is no obvious effect of the flow depth on the air supply discharge. This indicates that the effect of self-aeration on the air discharge is weak, and the air discharge is mainly determined by the residual air area, in which the air flow is dragged by the free surface. For , the air discharge through the vent increases with the vent size [Fig. 5(b)]. For a certain , the air discharge increases with the air vent size . With identical water flow conditions, the values get greater with the because the air supply discharge increases for the high air layer above the flow free surface. While for , the test data show the air discharge supplied by the air vent is hardly affected by the vent size. Under this present condition, the air vent works at its maximum efficiency, and the corresponding air discharge is defined independent of the air vent size. Compared to the previous estimation in the tunnel (Wei et al. 2021), Fig. 5(c) shows that the measured results for capture the overall trend reasonably well within of the calculated values. The results indicate the present air vent size can satisfy the maximum efficiency for the tunnel. Thus, the present is obtained from the average value of for , and the effects of vent parameters on the air supply capacity can be considered.
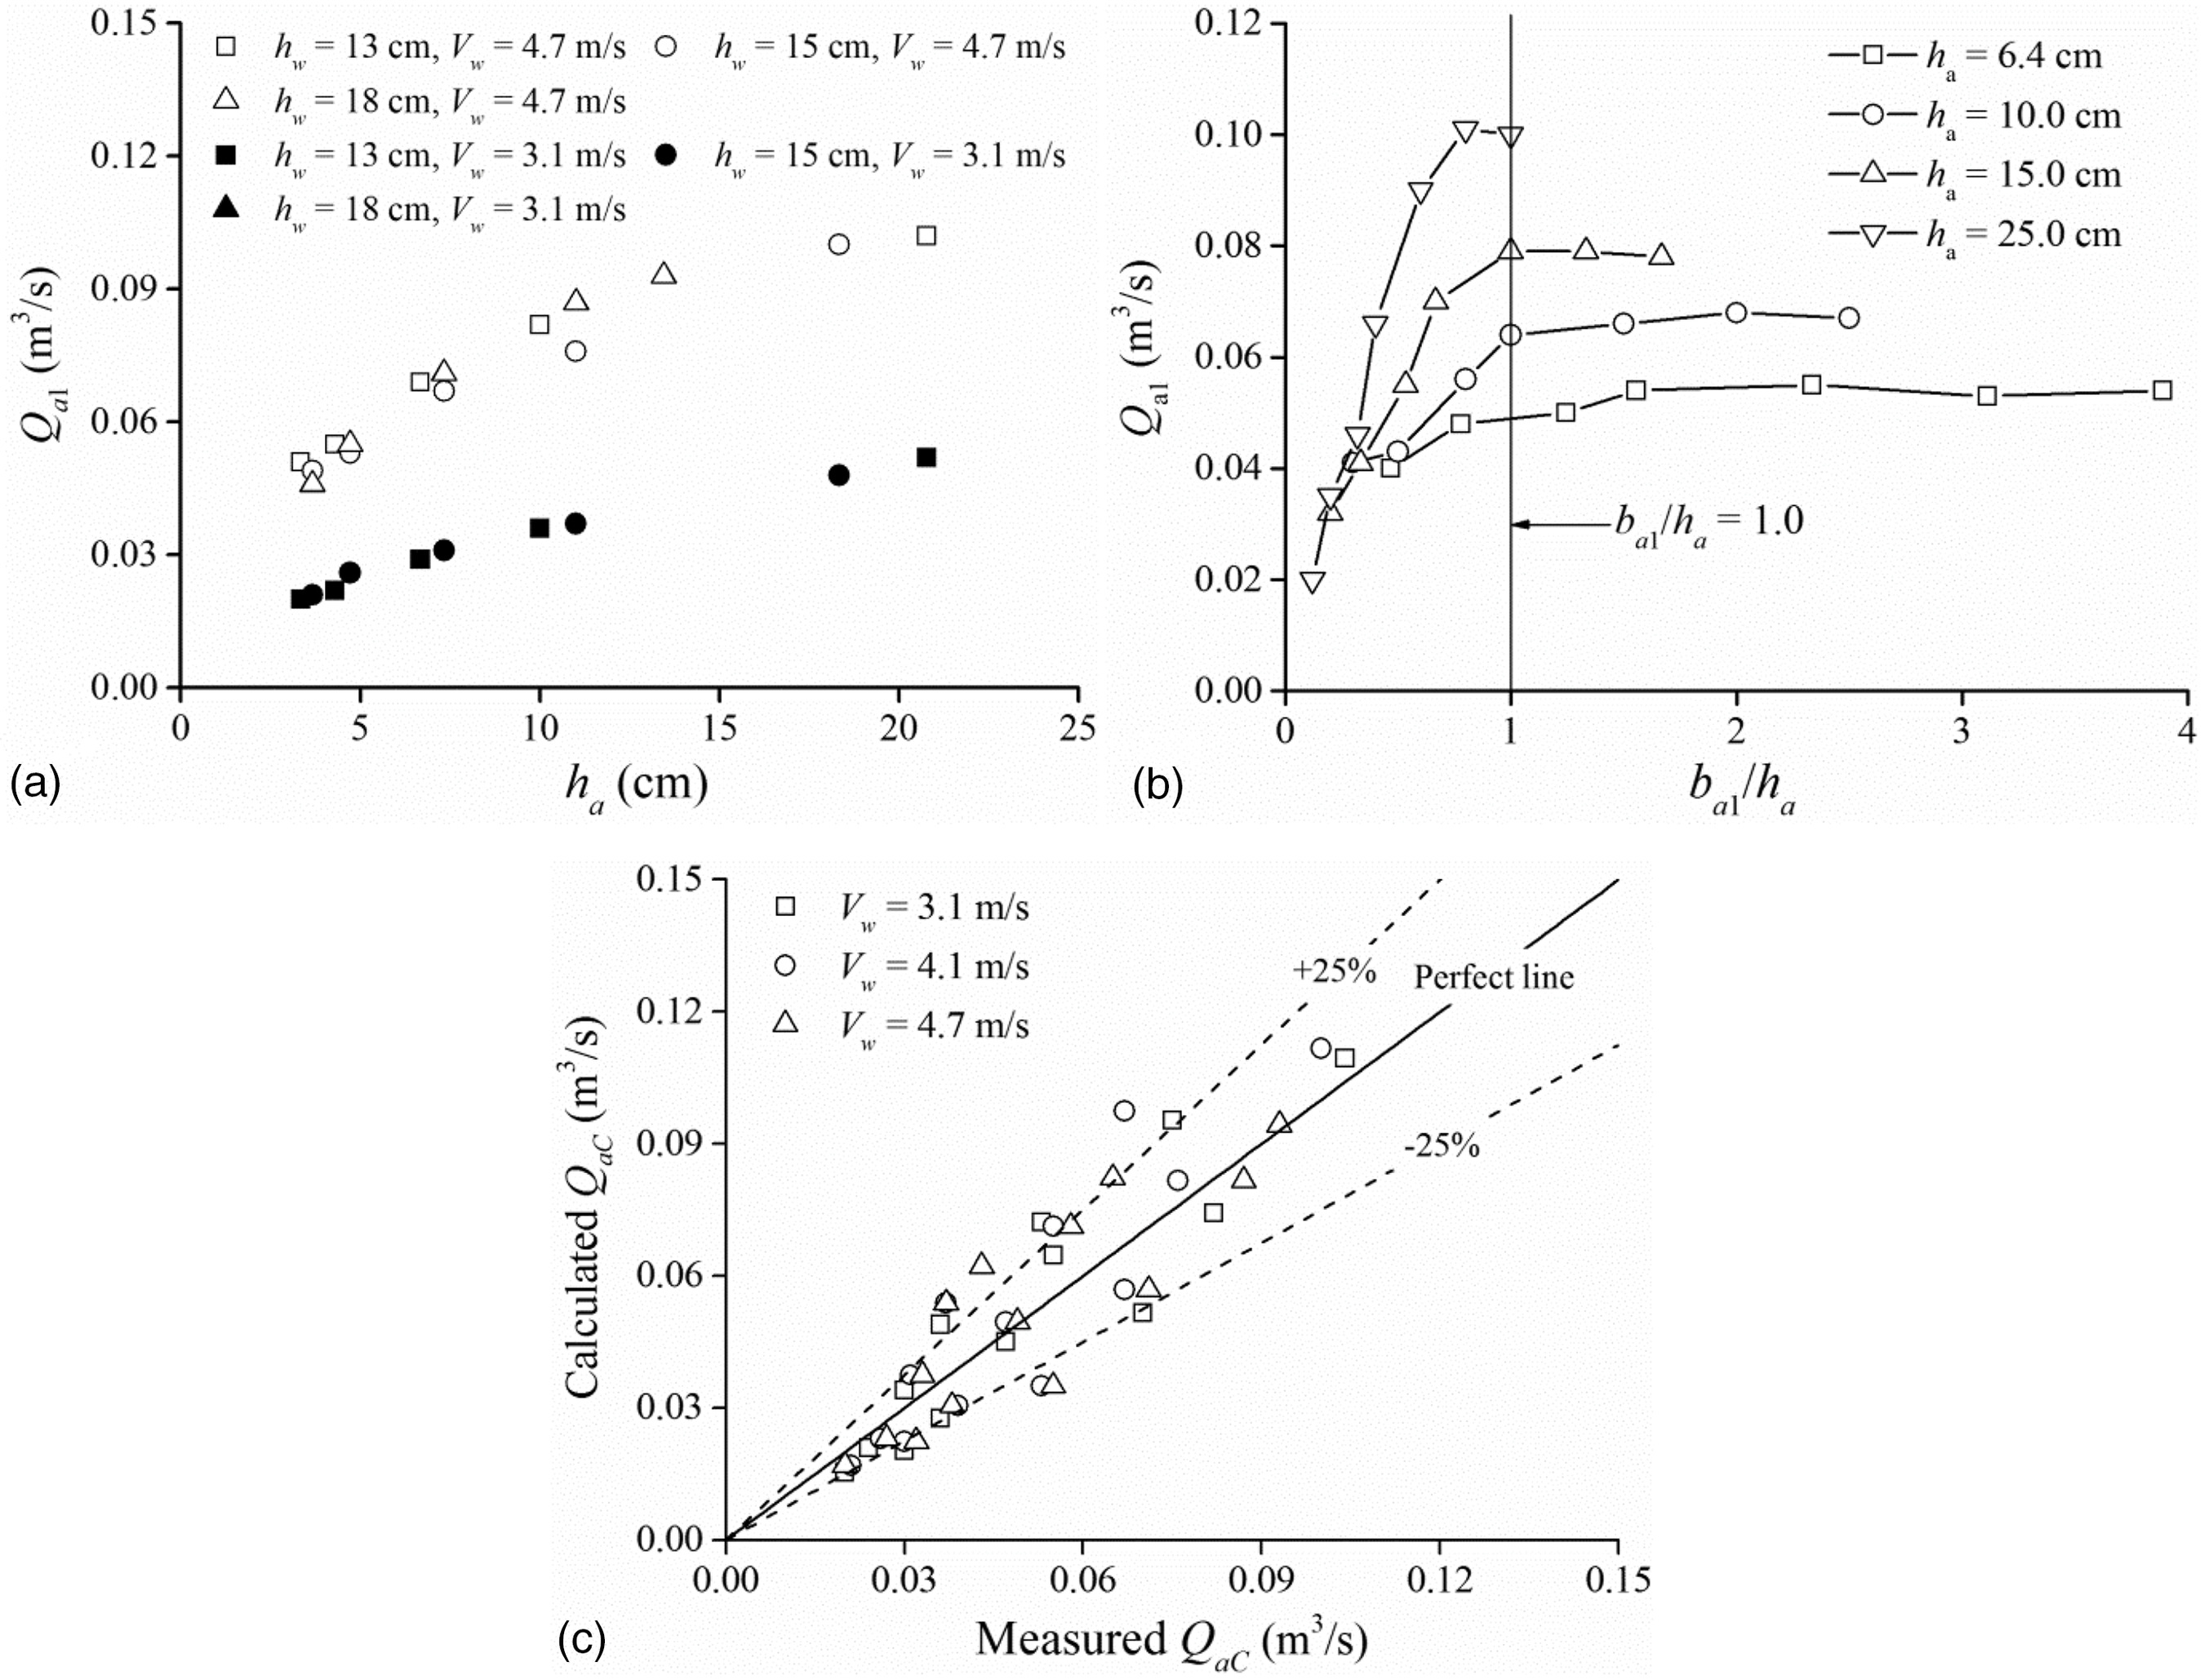
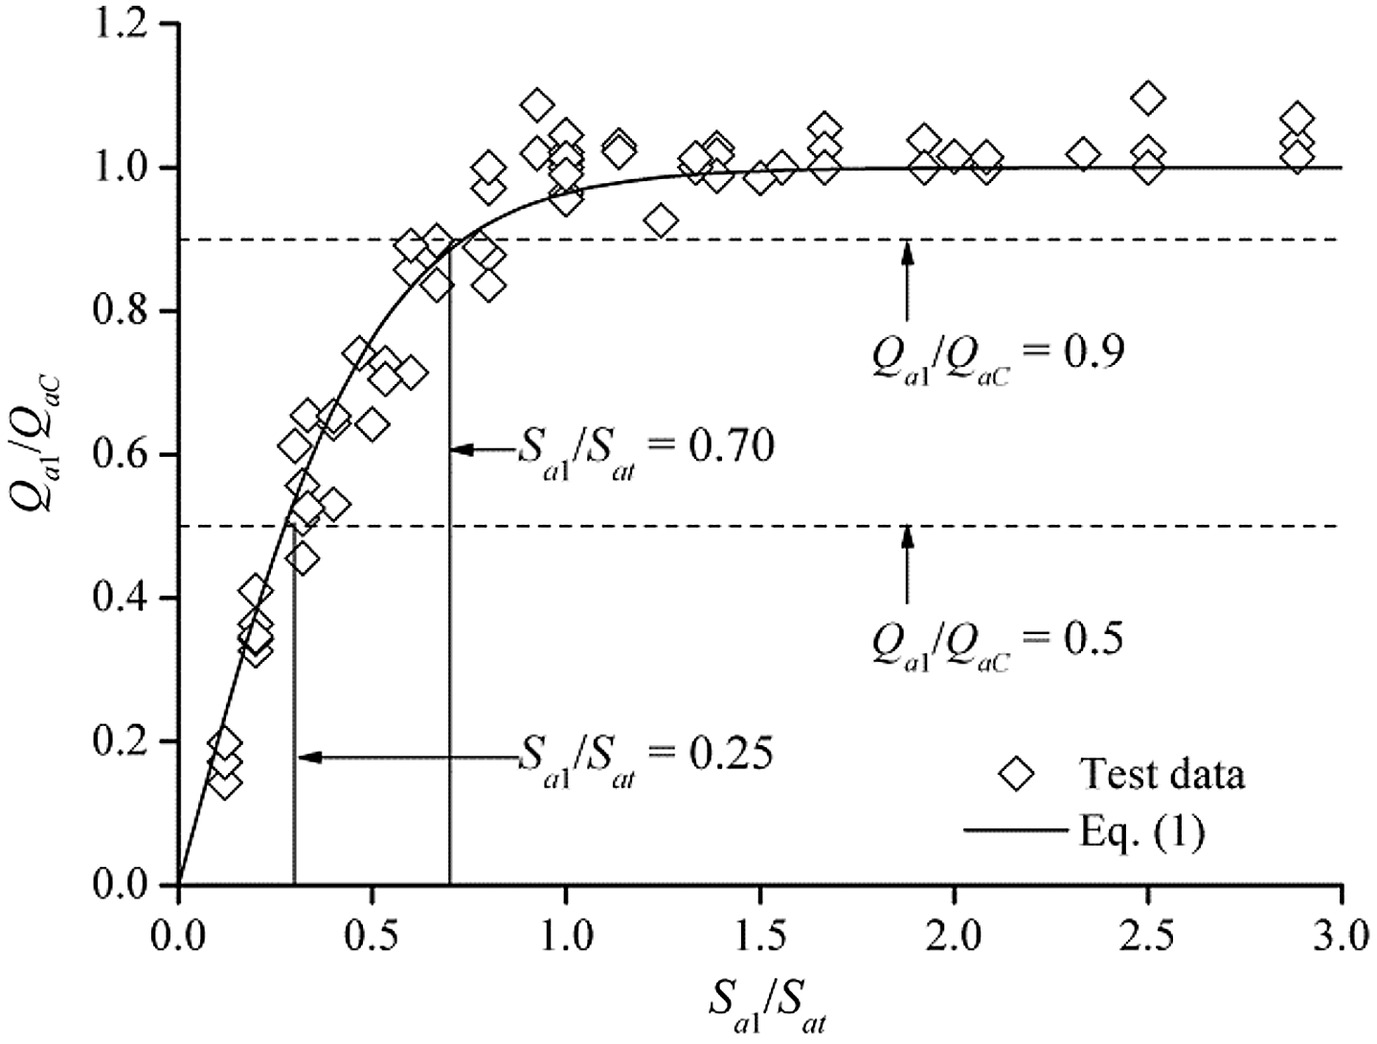
According to the single vent results for , the relative air discharges primarily depend on , as shown in Fig. 6. The increasing trend of can be expressed asresulting in . In terms of the air supply efficiency affected by the air vent size, for , and for . The air flow in the flood discharge tunnel is driven by the water flow and given pressure difference, analogy to the water aspirator, and the air velocity in the air vent is related to the air space in the tunnel. Thus, for low air supply performance () of the low-level outlet, air vent size defines the air discharge, leading to the uniform data trend. This indicates that a slightly larger vent size is valid to improve the air supply efficiency of the air ventilation system. It can be deduced that with the further increase of vent size, the relative differential pressure decreases gradually, accompanied by the air velocity reduction in the vent (Hohermuth 2017).
(1)
Effects of Single Air Vent Location on Air Supply
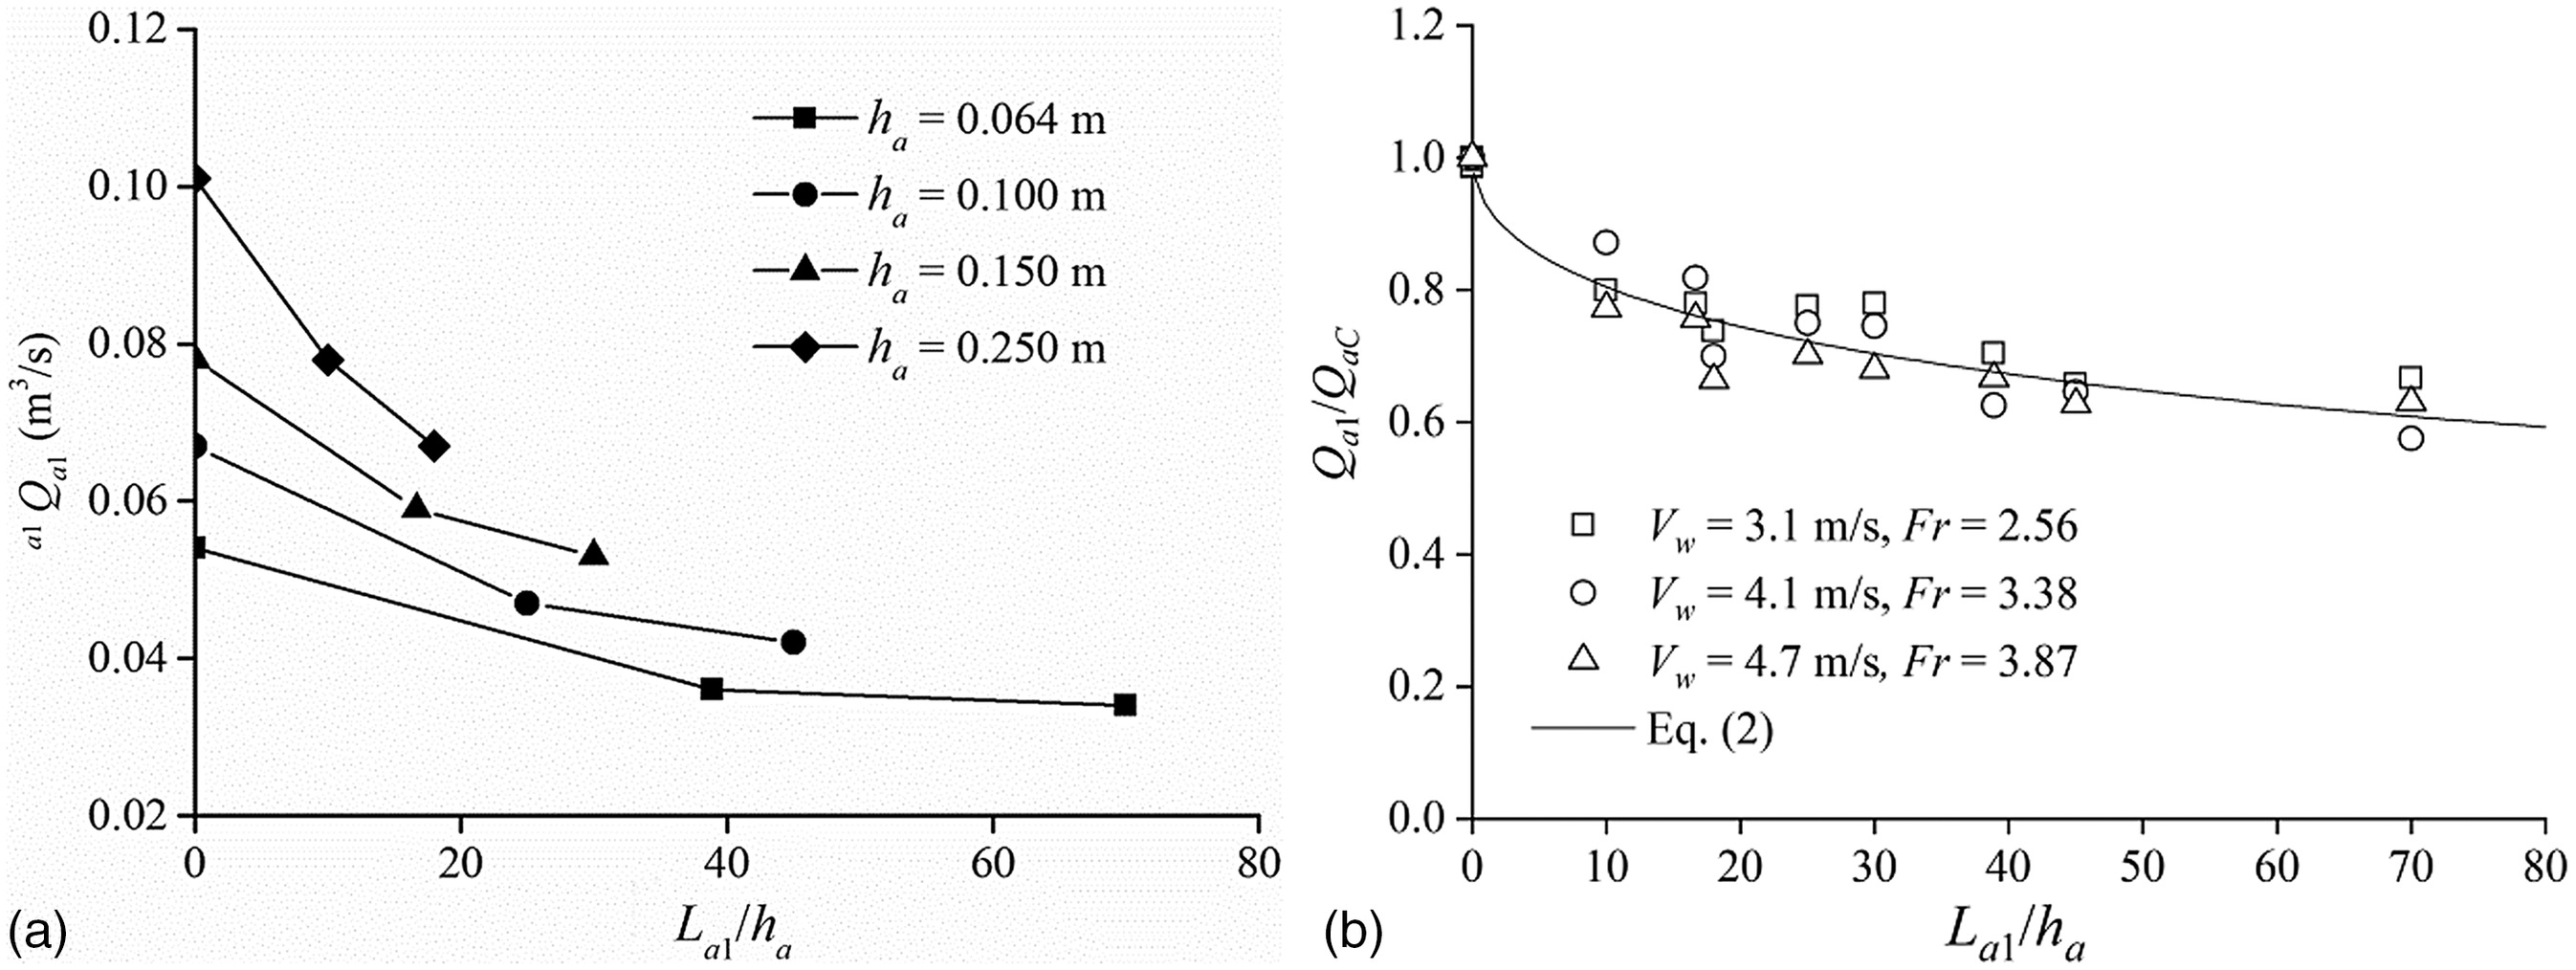
For the single air vent set a distance downstream to the low-level outlet, due to the strong effect of , the ratio of is used as a relative distance location affecting the air discharge. For a large vent size case with in Fig. 7(a), with increasing to 20–80, there is an obvious decrease in . It is deduced that the reduction in the air supply discharge is due to the pressure difference variation along the tunnel. The air drag effect through the air vent into the tunnel weakens with decreasing pressure difference at the tunnel section downstream of the air vent to the atmospheric pressure. This results in a reduction in air discharge (Safavi et al. 2008; Hohermuth 2017), especially for a large air layer in the tunnel, which is in accordance with the present phenomenon for and 0.25 m. Thus, a vent set far downstream reduces the air supply efficiency, and the decrease trend of can be expressed as a function of in Fig. 7(b)resulting in . The data trend indicates that when , the air discharge reduces to approximately 60%–80% of the maximum air supply efficiency. For a long flood discharge tunnel, the location away from the gate chamber results in low air supply efficiency, which may increase the adverse risks of low-level outlet operations, even for a large air vent size.
(2)
Effects of Two Air Vents on Air Supply
If the air supply efficiency of the single air vent is low, the air velocity in the ventilation system may be high and the corresponding wind noise threatens staff working. To reduce the adverse effects of insufficient air supply, additional vents set downstream are a feasible option to improve the ventilation system; thus, combined working vents with regard to air supply performance should be understood for ventilation system assessments. For with and , the air supply efficiency of the single vent is approximately 19.8%, which is a typical case in which the single air vent design is not enough. By setting an additional air vent with and downstream, the supplied air flow discharge through two combined working vents is shown in Fig. 8(a). First, with increase of , the air discharge by the upstream vent decreases gradually; simultaneously, the air discharge by downstream vent increases. The total air discharge by two combined working vents can reach approximately 90% of the maximum level, independent of . This shows that the suitable design of additional air vents can be an effective way to improve the air supply capacity for the flood discharge tunnel. Moreover, Fig. 8(b) shows that the ratio of decreases with , and the relation of air discharge by combined working vents follows an accordant trend.
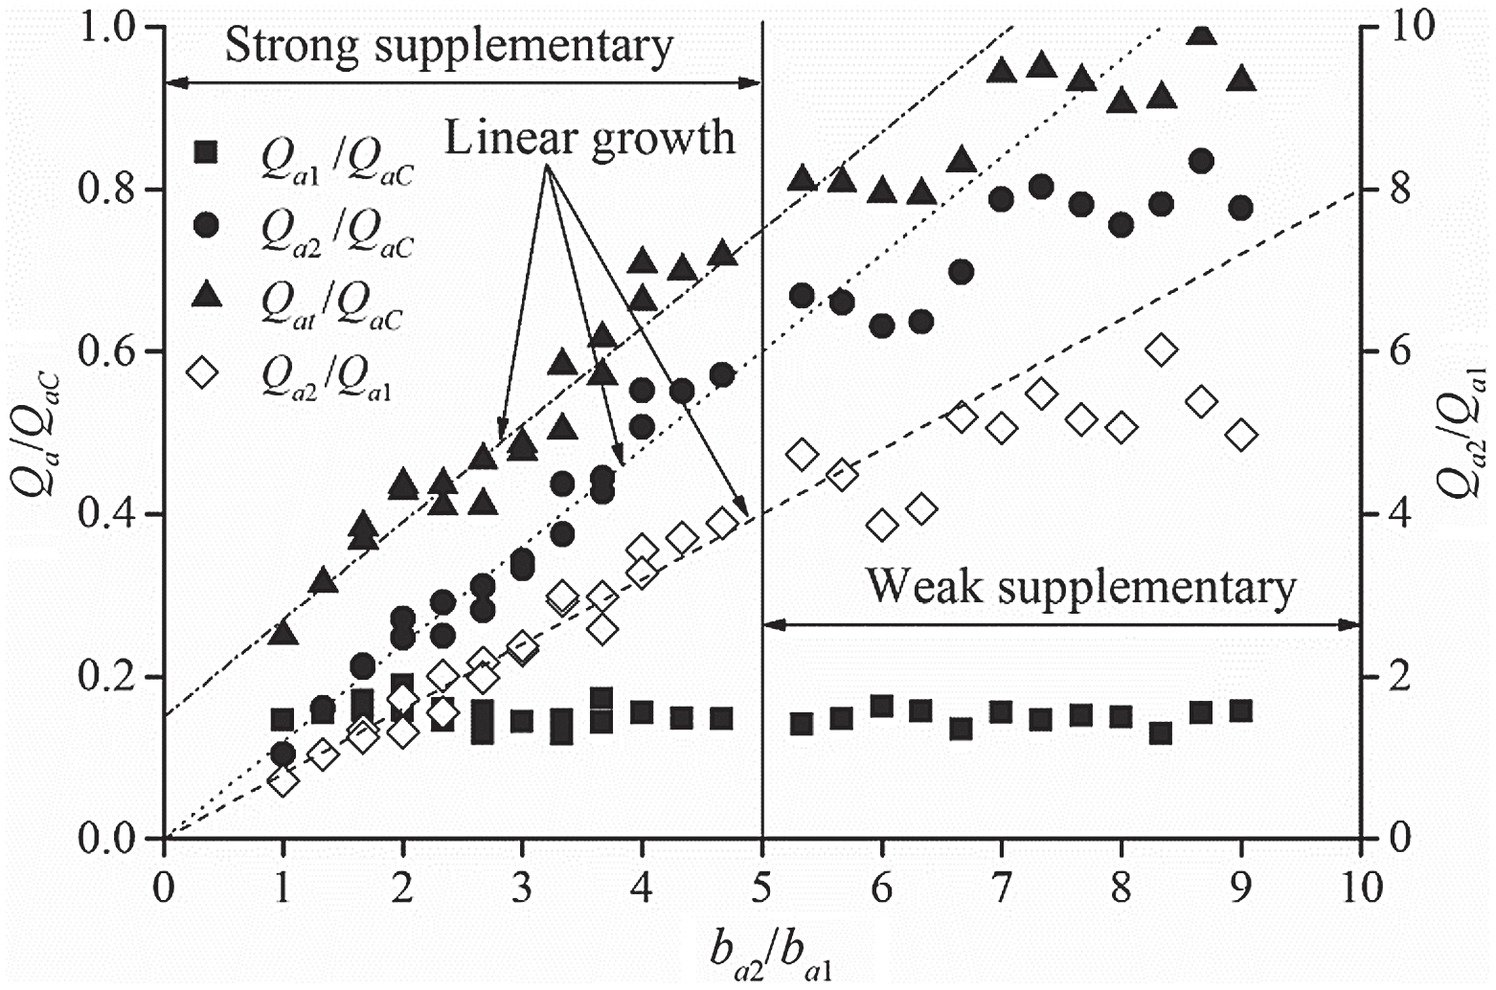
In terms of the vent size effect of the two combined working vents, the comprehensive data analysis is shown in Fig. 9. For a small upstream vent (), the air supply efficiency is too low and the air discharge by the upstream vent remains unchanged. The air discharge by the downstream vent increases with , which indicates that the additional air vent mainly works to replenish the air supply for the tunnel. The approximate linear growths of and are observed first (). Then, the increase in trends of the air discharge by the two combined working vents slow down and the data deviate from the related linear trends. The values of and can reach approximately 0.70 and 4.0 for , while for , the two parameters only increase to 0.90 and 5.0, respectively. Thus, the air replenishment capacity of the second air vent downstream is relatively effective for , and further improvement of the air size leads to a weak air supplementary performance of the two combined working vents.
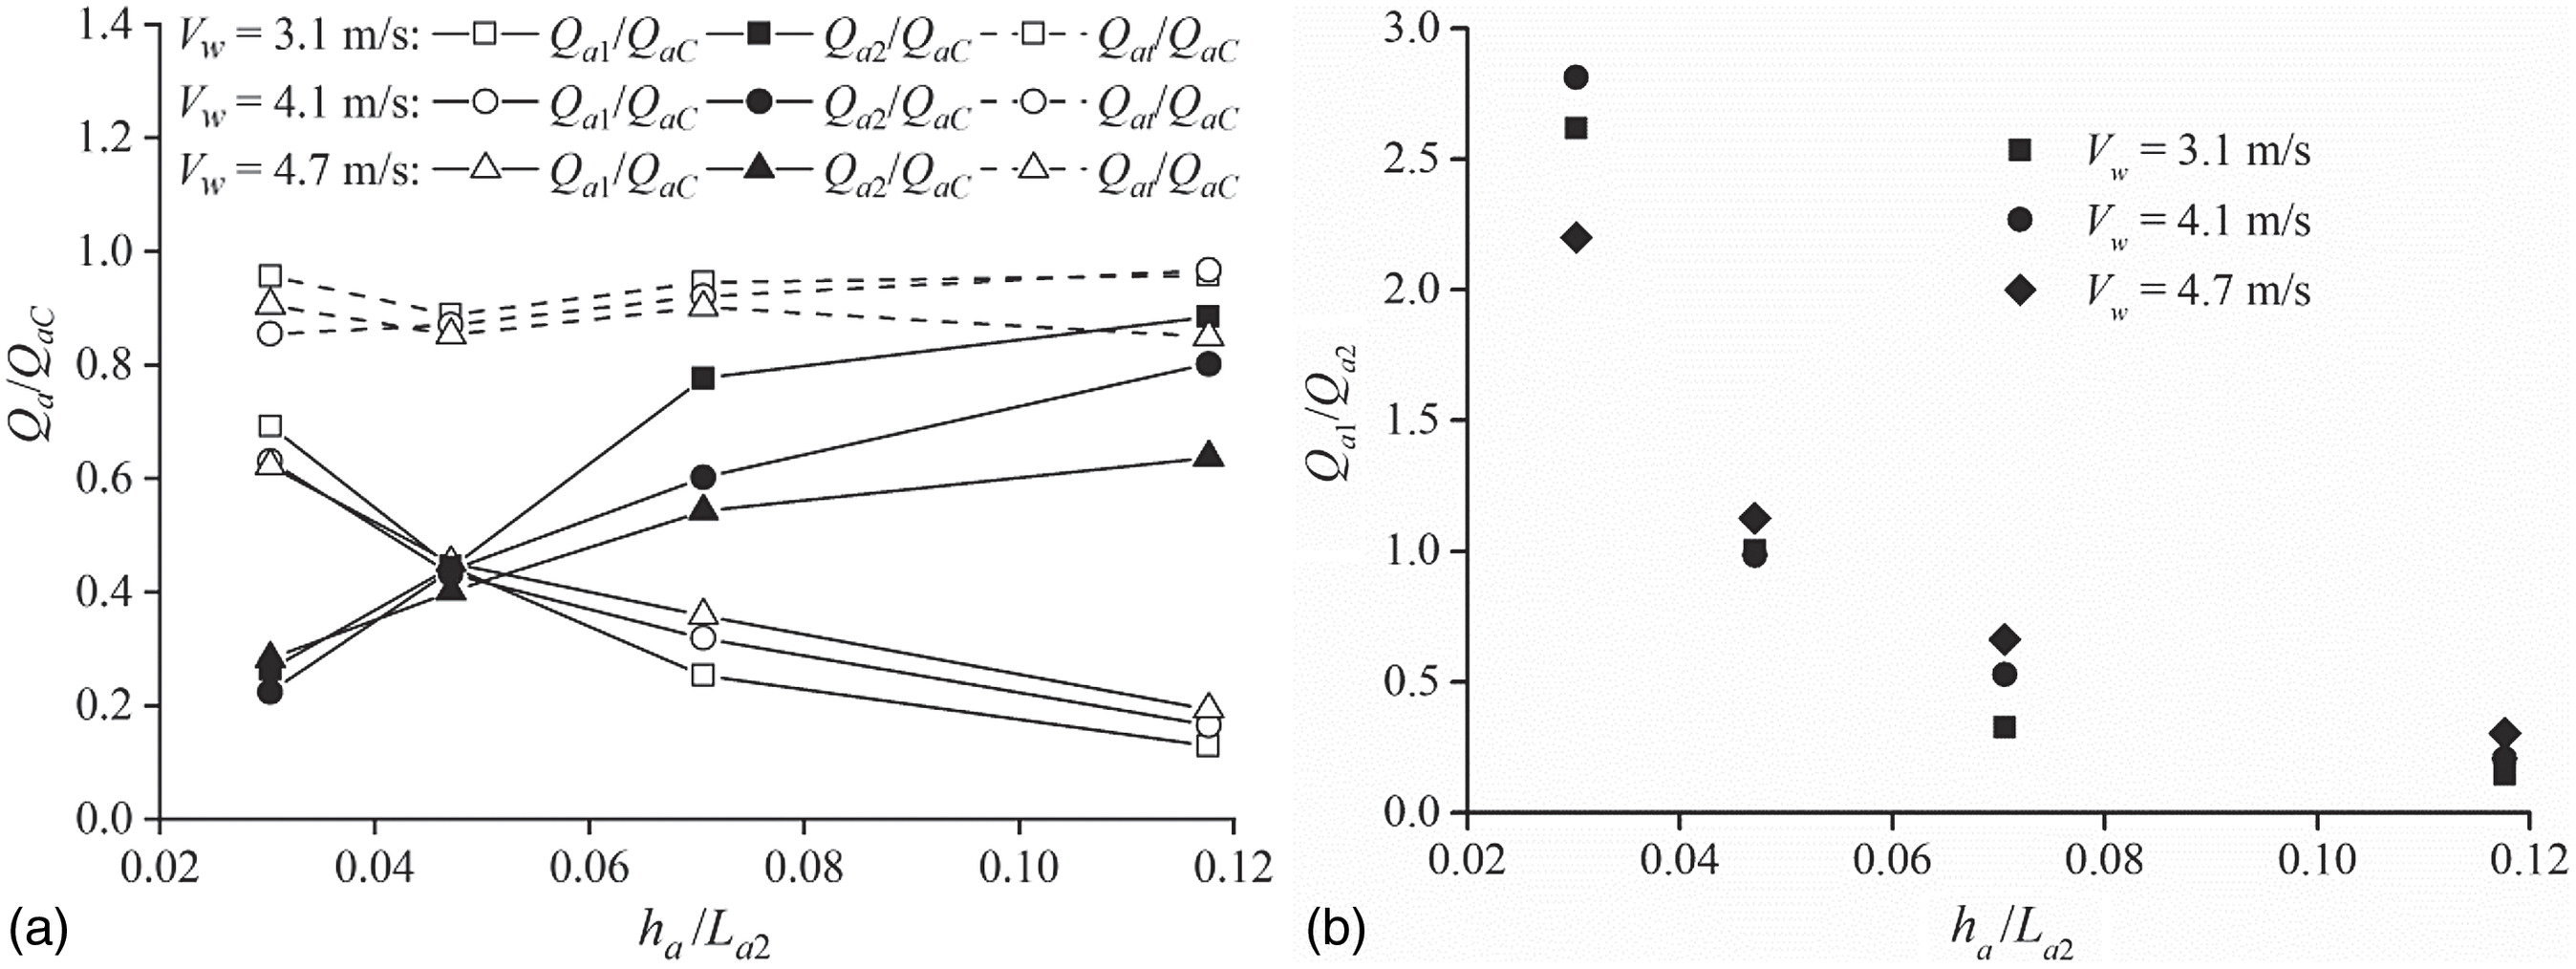
A comparison of air vent size effects between a single vent and two combined working vents is shown in Fig. 10(a). Compared to the values of , remains unaffected by with identical for a single vent design. The comparison results indicates that besides the low efficiency of the air vent downstream, the air supply efficiency of the upstream vent is lower than the single vent condition for identical size conditions. Using the ratio of air vent cross-sectional area and the air area in the tunnel, two similar relationships of hyperbolic tangent functions are proposed as
(3)
(4)
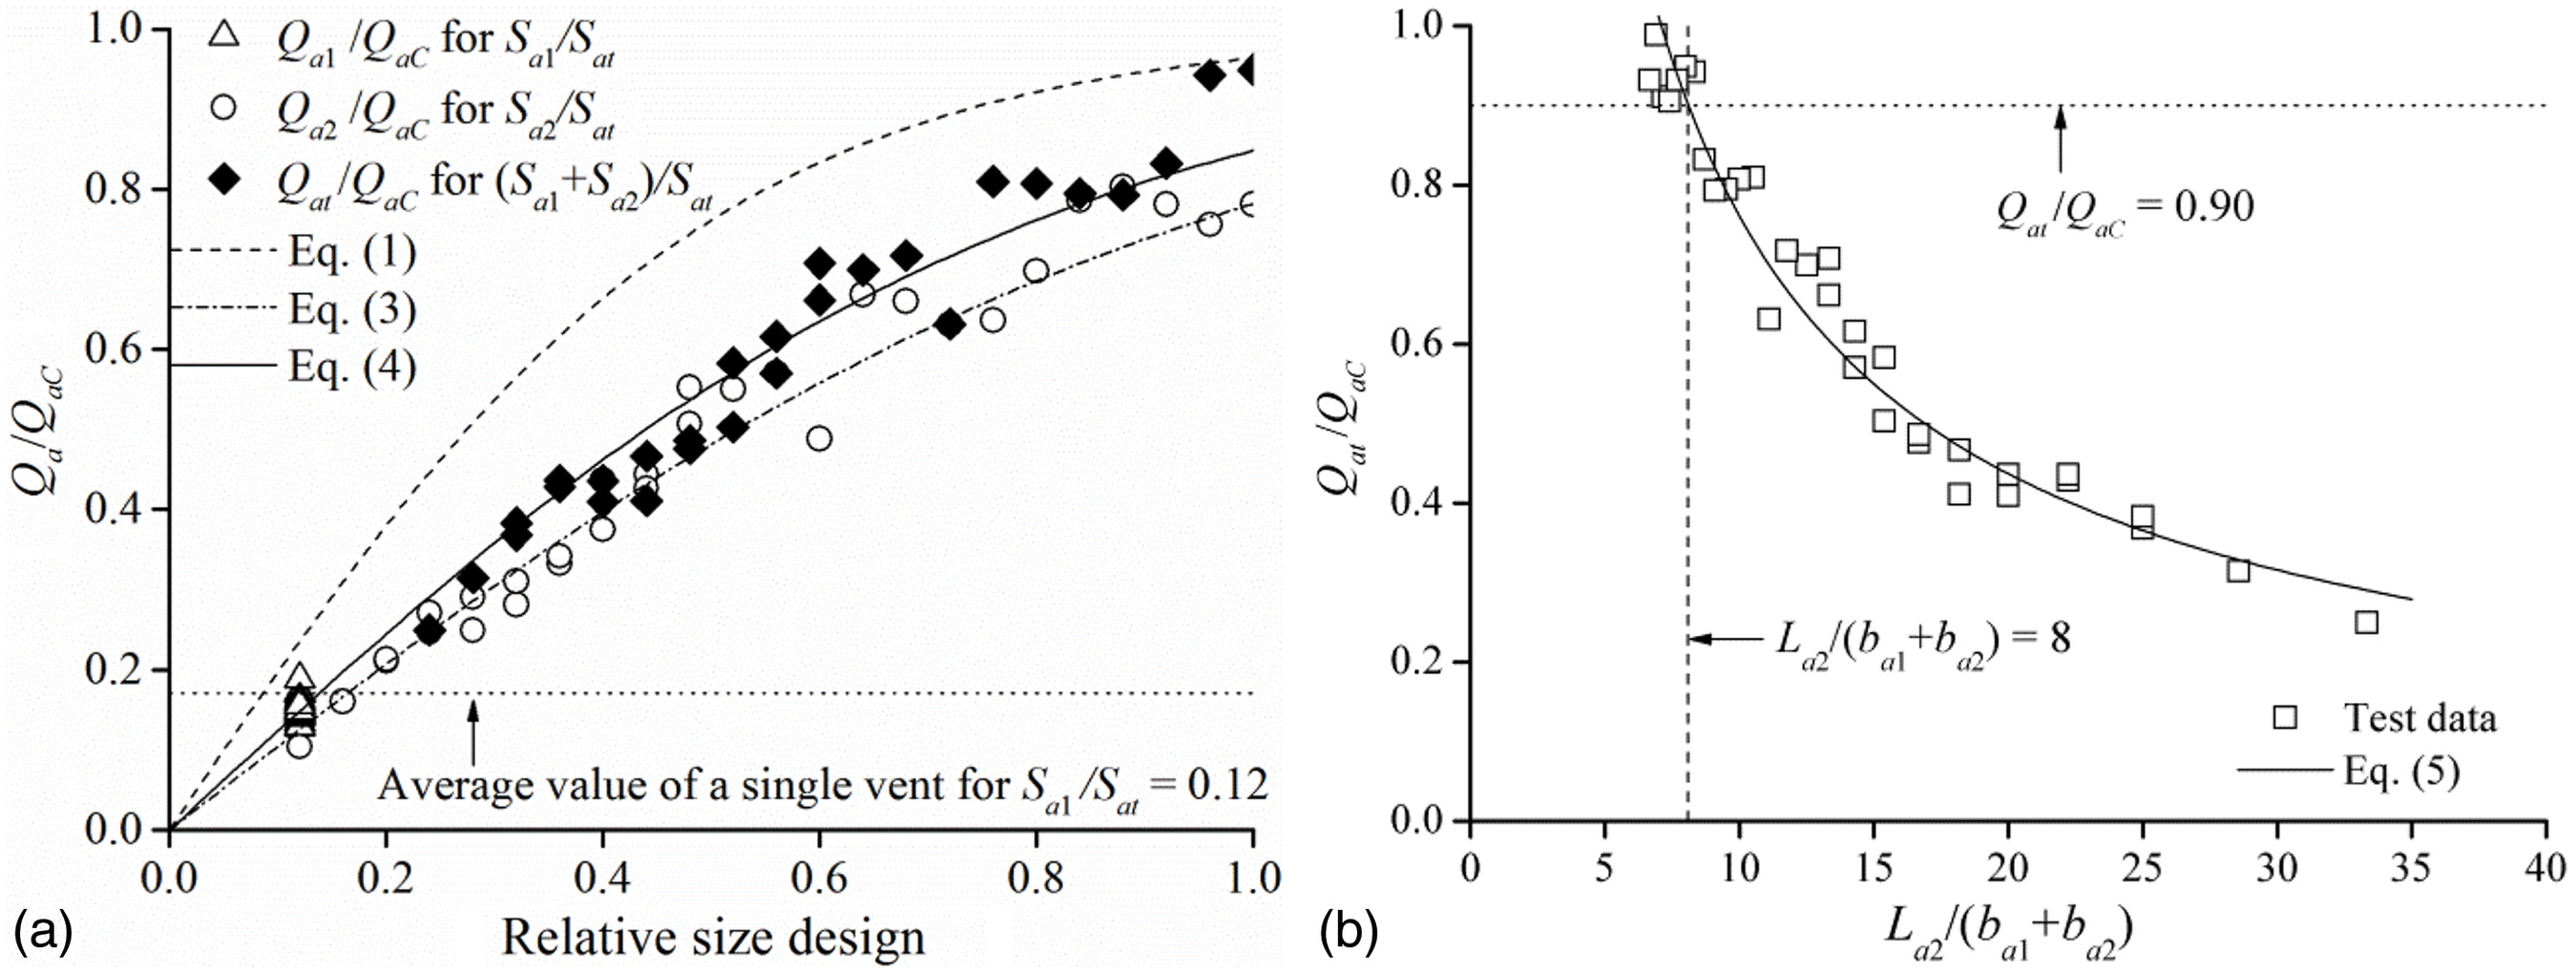
The air supply efficiency for the two combined working vents is lower than that for a single air vent near the low-level outlet for an identical relative air vent size. Because of the negative effect of the downstream vent position on the air supply efficiency, the factor is introduced into the two combined working vents with the total vent size (). Fig. 10(b) shows that the air supply efficiency as a function of the relative distance between two vents follows an exponential trendwhere , resulting in . It should be noted that the upstream air vent is set close to the gate as a primary design principle. With increasing , the total air discharge obviously decreases. The air supply efficiency remains larger than 0.90 for , and the value of becomes smaller than 0.5 for .
(5)
Assessment of Prototype Data
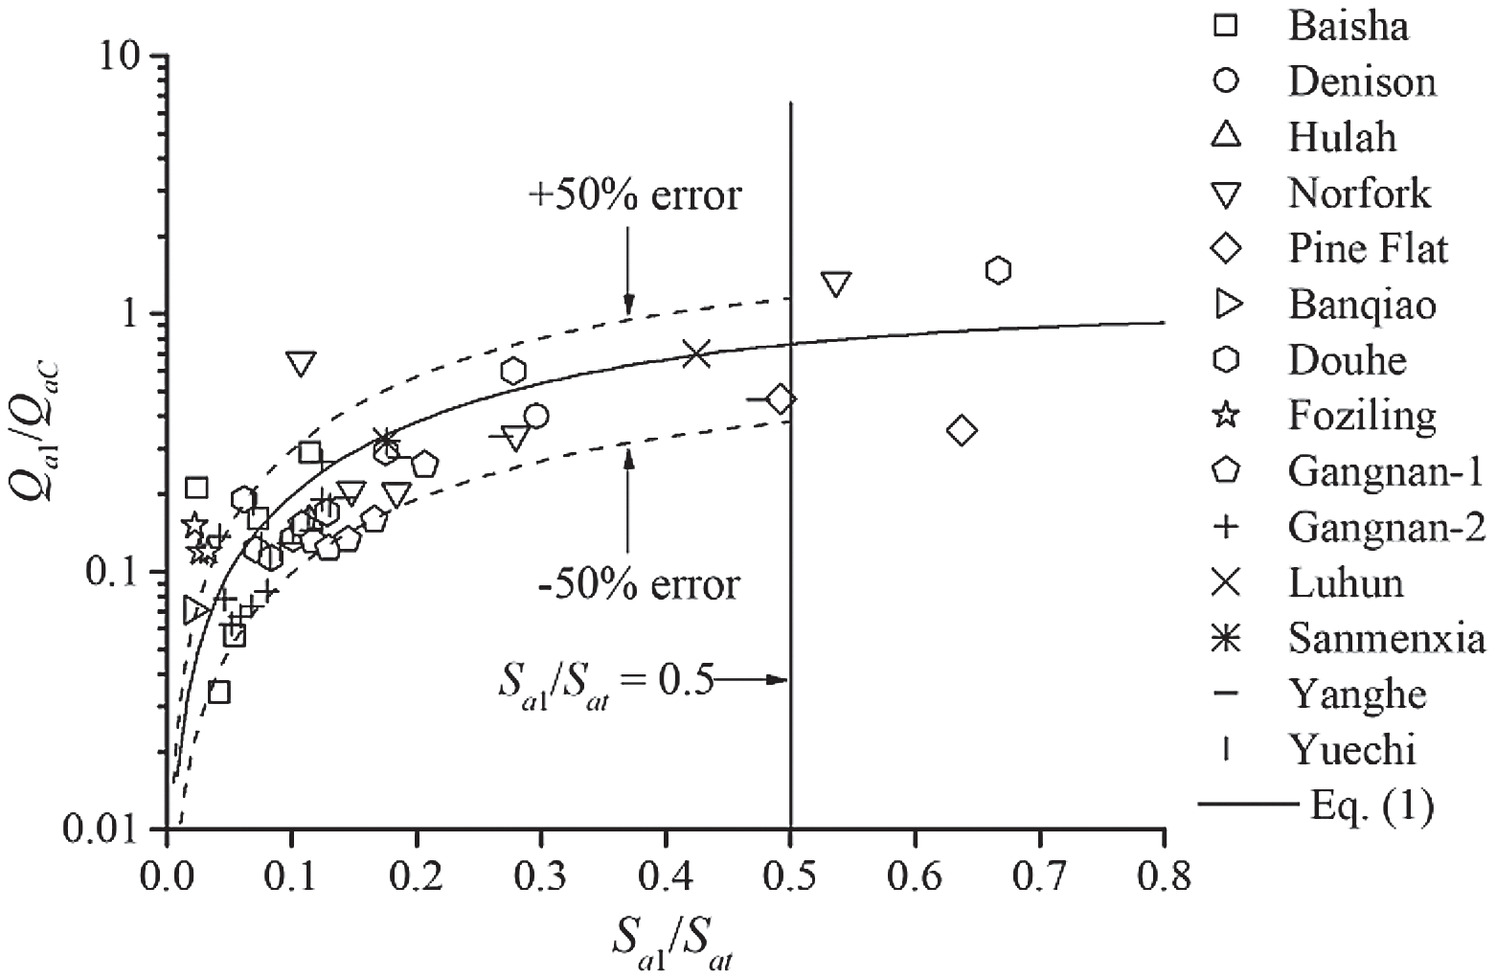
For prototype low-level outlet operations, the flow velocity can reach up to , and the order of magnitude of tunnel sizes ranges from to . Table 1 summarizes bottom tunnel parameters from 14 prototype dam projects, and an assessment analysis of the air vent size principle from the present experiments is shown in Fig. 11. To assess the air supply efficiency for different prototype tunnels, there are some simplifications and assumptions. First, the gate opening is used as the flow depth to calculate within the stratified free-surface flow pattern. This is a simplification of the flow pattern in long flood discharge tunnels. It should be noted that the flow characteristics of low-level outlets vary from the vena contracta (near the gate chamber) to developing flow and fully developed flow until the end of the tunnel. The effects of flow development on the dragged air are not considered in the present study. Second, the effects of shock waves and counter-current air flow near the gate chamber are neglected, and the flow is assumed to be stable without considering intensive flow depth fluctuations along the long flood discharge tunnel. Third, because of the complex vent designs in prototype tunnels, it is hard to obtain accurate vent loss coefficients; thus, the calculations are conducted without considering vent loss coefficients. The ranges from 0.02 to 0.68 with , and the values of are deduced by the methods of Wei et al. (2021). Eq. (1) captures the overall data trend of the air supply efficiency in prototype low-level outlets. For a specific single vent design with , most of the prototype data are enveloped by the predicted trend lines within of Eq. (1). The effects of vent size on the air discharge are considered reasonable, and an underestimated design of the single vent size can result in low air supply efficiency. The present comparison with prototype air supply performance demonstrates that for a single air vent near the bottom outlet, a specific size design with can mainly ensure an air supply efficiency . Both the air drag and air entrainment capacities for prototype high-speed flows are higher than those of scaled model flows, and an underestimation of the air supply efficiency for flood discharge tunnels should be considered as well.
| No. | Project tunnel | Gate | Tunnel length (m) | () | (m) | () | |
|---|---|---|---|---|---|---|---|
| 1 | Banqiao | Slide | 58 | 0.07 | 0.02 | 1.53 | 15.7 |
| 2 | Sanmenxia | Radial | 138 | 15.10 | 0.18 | 2.00 | 24.0 |
| 3 | Denison | Slide | 256 | 2.06 | 0.30 | 4.06 | 22.2 |
| 4 | Hulah | Slide | — | 0.13 | 0.11 | 1.23 | 11.9 |
| 5 | Pine flat | Slide | 88 | 0.45 | 0.49 | 2.14 | 23.5 |
| 0.64 | 2.27 | 23.4 | |||||
| 6 | Luhun | Slide | 491 | 8.70 | 0.42 | 7.00 | 18.2 |
| 0.42 | 7.00 | 17.5 | |||||
| 7 | Foziling | Slide | 63 | 0.05 | 0.02 | 1.28 | 22.7 |
| 0.03 | 1.92 | 22.1 | |||||
| 0.03 | 2.56 | 26.8 | |||||
| 8 | Baisha | Slide | 11 | 0.06 | 0.04 | 0.90 | 24.6 |
| 0.05 | 1.08 | 24.6 | |||||
| 0.02 | 0.25 | 24.8 | |||||
| 0.07 | 1.26 | 24.5 | |||||
| 0.10 | 1.44 | 24.4 | |||||
| 9 | Norfork | Slide | 39 | 0.20 | 0.11 | 0.27 | 30.0 |
| 0.15 | 0.70 | 30.0 | |||||
| 0.18 | 0.92 | 30.0 | |||||
| 0.30 | 1.23 | 30.0 | |||||
| 0.54 | 1.52 | 29.9 | |||||
| 10 | Yanghe | Slide | 105 | 0.75 | 0.10 | 1.40 | 14.5 |
| 0.12 | 1.75 | 14.2 | |||||
| 0.14 | 2.10 | 13.8 | |||||
| 0.19 | 2.45 | 13.3 | |||||
| 0.27 | 2.80 | 12.7 | |||||
| 0.48 | 3.15 | 11.7 | |||||
| 11 | Gangnan-1 | Radial | 200 | 2.75 | 0.11 | 1.80 | 23.8 |
| 0.12 | 2.30 | 23.4 | |||||
| 0.13 | 2.70 | 23.2 | |||||
| 0.15 | 3.30 | 22.4 | |||||
| 0.17 | 3.80 | 21.6 | |||||
| 0.21 | 4.50 | 18.4 | |||||
| 12 | Gangnan-2 | Radial | 60 | 1.00 | 0.04 | 1.00 | 25.1 |
| 0.05 | 1.50 | 25.1 | |||||
| 0.05 | 2.00 | 25.0 | |||||
| 0.06 | 2.50 | 24.9 | |||||
| 0.07 | 3.00 | 24.8 | |||||
| 0.08 | 3.50 | 24.7 | |||||
| 0.12 | 4.50 | 24.2 | |||||
| 0.12 | 4.50 | 25.4 | |||||
| 13 | Yuecheng | Radial | 202 | 2.01 | 0.07 | 1.50 | 20.7 |
| 0.08 | 2.00 | 20.6 | |||||
| 0.08 | 2.50 | 20.4 | |||||
| 0.09 | 3.00 | 20.2 | |||||
| 0.10 | 3.50 | 20.0 | |||||
| 0.11 | 4.00 | 19.8 | |||||
| 0.13 | 4.50 | 19.1 | |||||
| 14 | Douhe | Slide | 112 | 0.50 | 0.06 | 0.60 | 13.8 |
| 0.07 | 0.90 | 13.7 | |||||
| 0.08 | 1.20 | 13.6 | |||||
| 0.10 | 1.50 | 13.4 | |||||
| 0.13 | 1.80 | 13.3 | |||||
| 0.18 | 2.10 | 13.2 | |||||
| 0.28 | 2.40 | 12.9 | |||||
| 0.67 | 2.70 | 9.50 |
The typical prototype flood discharge tunnel in Nuozhadu Dam, China, is used for the analysis of two combined working air vents upstream. The dam is a rock-fill dam with a height of 261.5 m. Two low-level outlets for flood discharge operations are set separately on the two sides of the dam, as shown in Fig. 12. The bottom tunnel slope is . The radial gate is used to control the gate opening (considered as the approach flow depth). During cumulate 920-h flood discharge operations, high wind noise was monitored exceeding over 100 dB due to the high air velocities in the air vent system of the bottom tunnel (Deng 2017). Although the operational safety of the tunnel is satisfied at the observed air supply efficiency, the high air velocity phenomena resulting in adverse staff working conditions is the reason for an air supply assessment leading to an air vent reconstruction. In terms of the ventilation system, two air vents with two circular cross-sections are set upstream. The diameters of the vent conduit are 6.8 m and 2.0 m, respectively. The upstream air vent is set close to the gate with , and the second vent with is set downstream. Four recent flood discharges, during which air discharge was measured, are shown in Table 2. The water head is approximately 107.2–109.7 m with . The basic water flow conditions are with .
| No. | () | () | () | (m) | () | () |
|---|---|---|---|---|---|---|
| 1 | 36.30 | 3.14 | 145 | 3.4 | 28.2 | 2,397 |
| 2 | 36.30 | 3.14 | 137 | 5.1 | 32.2 | 2,738 |
| 3 | 36.30 | 3.14 | 125 | 6.8 | 36.1 | 3,067 |
| 4 | 36.30 | 3.14 | 103 | 8.5 | 37.1 | 3,154 |
Due to the water flow velocity increasing from to , the measured air discharge in the upstream air vent rises from 1,310.4 to , as shown in Fig. 13(a), and the measured air discharge in the downstream air vent rises from to . For the second air vent, the low air supply efficiency is mainly due to the small size and the location away from the gate chamber. Based on the flow velocity conditions, the maximum air supply level is calculated, resulting in the air discharge ranging from 1,434.3 to . The air supply efficiency of the two combined working vents is still low. This mainly causes the high air velocity and large wind noise phenomena during the flood discharge operation monitor (Devenport et al. 2018; Xiong et al. 2018). For a high velocity , the design parameters of air vent sizes and are 0.352 and 0.030, respectively. These results illustrate that the air vent size is small for the air discharge replenishment on the basis of present air vent design principles. Using the air supply discharge calculation methods of the free surface flow pattern in literature (Table 3), the various results show that the data scatter is large over one order of magnitude. (The contraction flow is approximately deduced by the gate opening.) The relative error of Sharma (1973) is smaller than that of Campbell and Guyton (1953). Given two vent loss coefficient values and , the results of Hohermuth (2019) infer that the air discharge is sensitive to the vent and tunnel geometrical parameters. Note that the Froude numbers for the prototype flows are below 5 and thus are outside of the application range of these approaches. Speerli (1999) suggested to use the water head as the dominate flow parameter. The various prediction methods indicate that for the prototype low-level outlets, the scale effects of dominant factors related to the air phase properties, including high energy head, air vent loss coefficient, and air–water mixture structure, likely play a role in the underestimation of air supply performance in flood discharge tunnels.
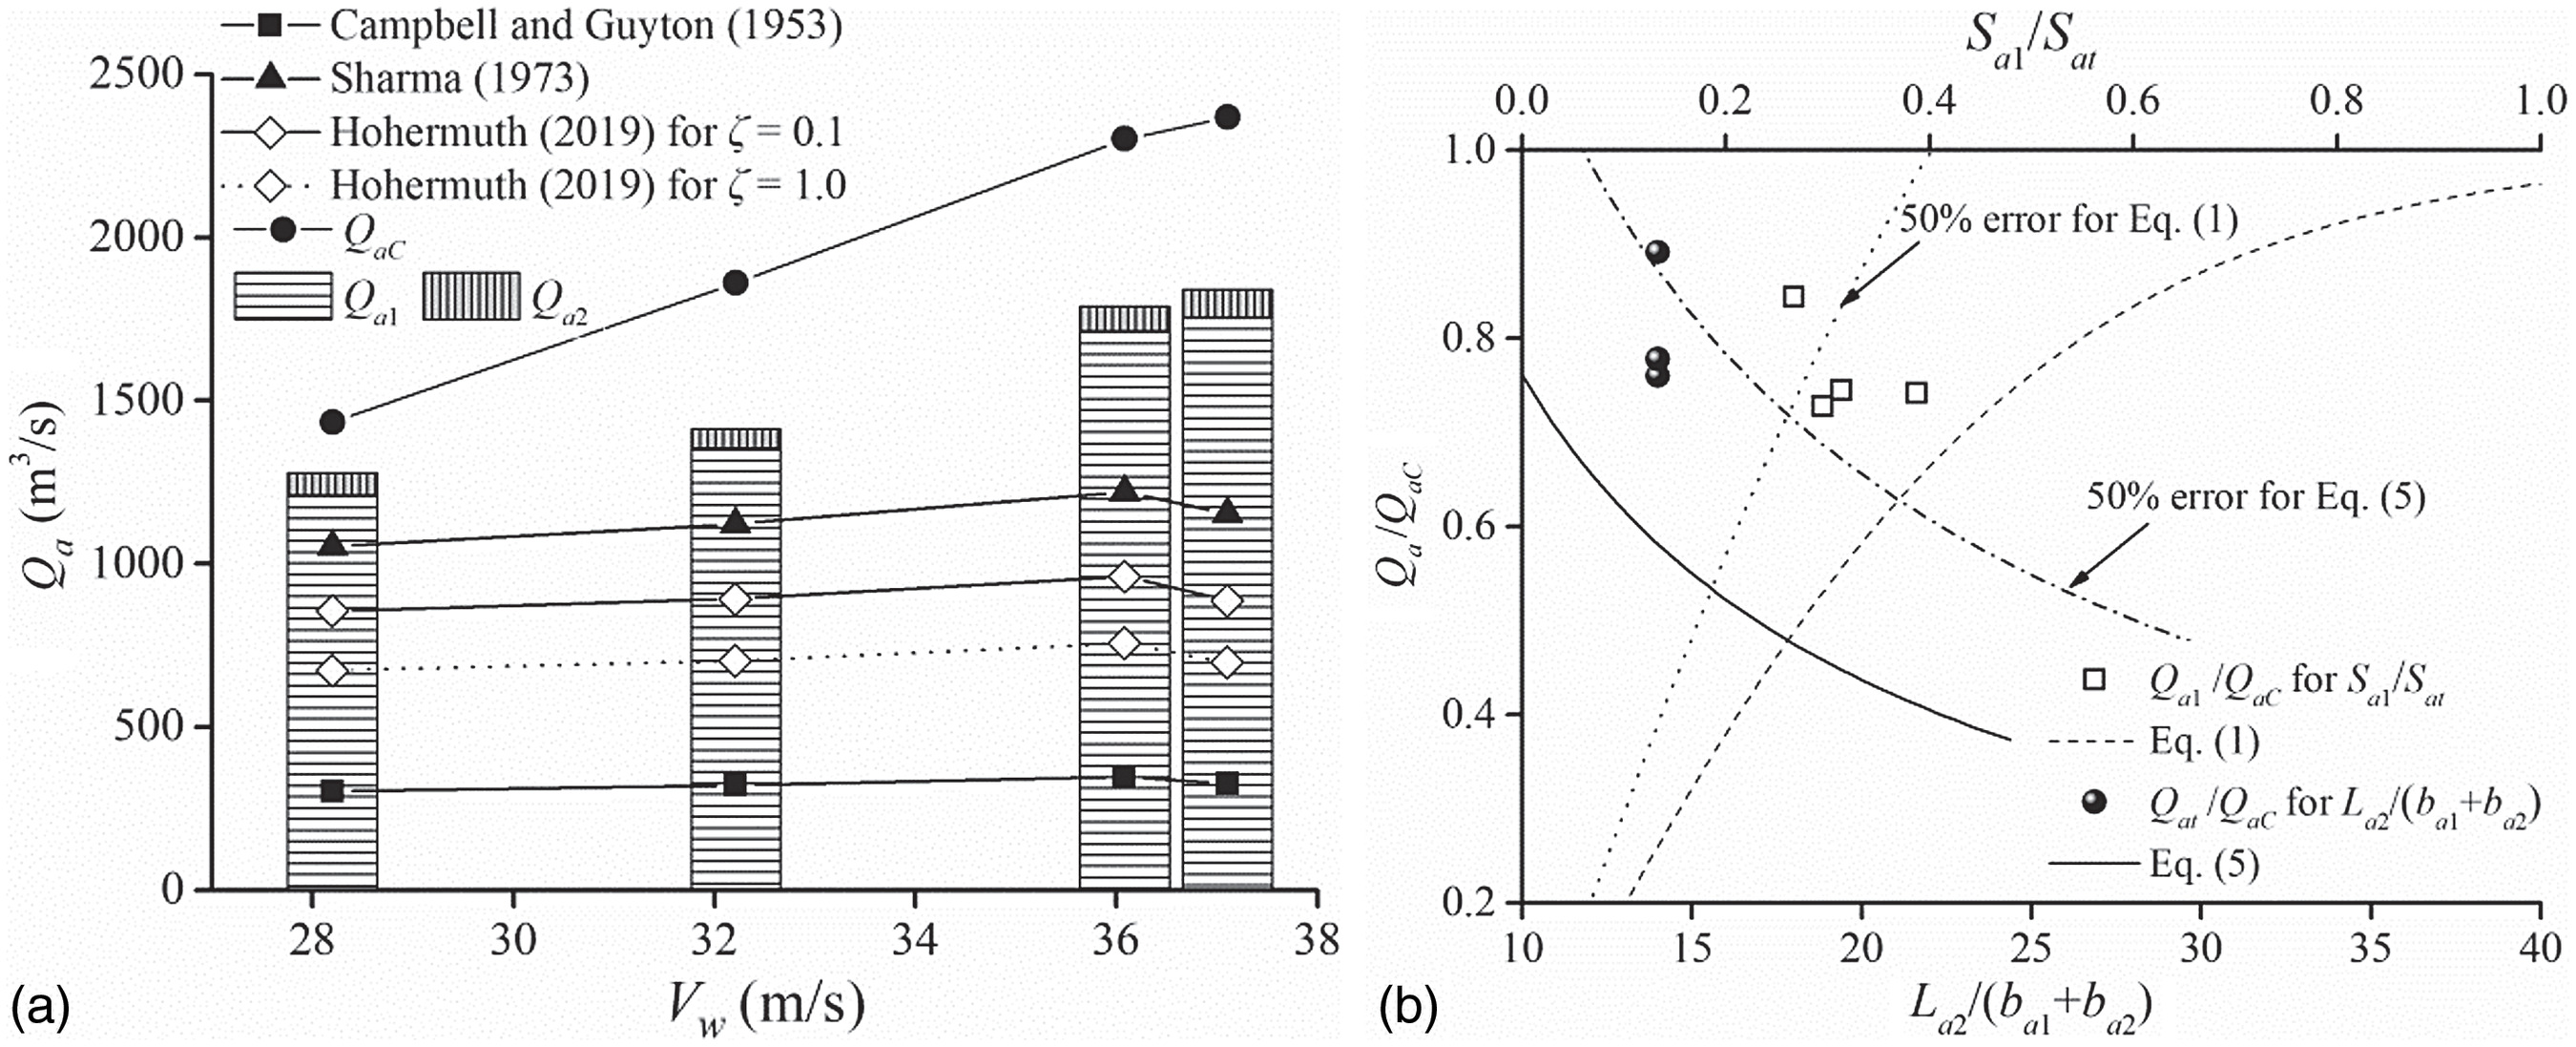
By plotting the prototype data in Fig. 13(b), detailed comparisons with the design equations are evaluated. For the air vent near the low-level outlet, the air supply efficiency does not reach the maximum level for the four cases, and the air supply efficiency from the two combined working vents is not obviously affected due to the relative small vent size. The present experimental results estimate the predictions of within an approximately 50% error. The data deviations of the predicted air discharge mainly result from three aspects. First, the high speed velocity of tunnel flows may cause the scale effects of air–water flows on the free surface drag capacity. Although the high flow velocity leads to a large air discharge in prototype tunnels, the strong breakup free surface with small air–water mixture structures may reduce the air flow drag performance (Jiang et al. 2020). This coupling effect on the air supply efficiency remains unclear. Second, the specific bottom gate types, such as radial and slide gates, can lead to different flow disturbances in prototype tunnels once the pressurized water flow is released into the chute section (Vischer and Hager 1998; Speerli and Hager 2000). The shock waves and flow recirculation phenomena can cause a differential pressure near the gate area (Safavi et al. 2008). The local pressure variation is sensitive for the air supply in tunnels for a constant flow condition. Third, the air velocity distribution in prototype vents is nonuniform due to the rough walls and curving conduits. The effects of height, length, curve type, and roughness factors of air vents on the potential air supply could not be determined from the present data.
The present analysis concentrates on the air supply efficiency in association with preliminary ventilation design parameters for low-level outlets. For the free surface flow pattern in a long bottom tunnel, the vent parameter range includes relative size , relative length for the single vent, and two vent size and relative interval . Although the present prediction cannot include high aeration and complex flow patterns, the quantitative assessment is able to provide a reasonable reference for the air supply design. The relative air vent size should be appropriate, as a general recommendation for a high air supply efficiency. The air discharge decreases as the air vent is set downstream of the tunnel and should be avoided for the single vent location. Additional air vents designed downstream can replenish the air supply. The relative interval between the two vents is suggested as due to the air supply efficiency reduction for the combined working vents.
It should be noted that the present analysis on the efficient air supply of air vents is under low flow Froude number conditions () and applies for the stratified free-surface flow pattern in flood discharge tunnels. The deviations of the comparison with prototype data shows the limitations of current investigations, including the multiple influence factors of spray flow properties and air vent loss coefficients. Detailed measurements of air supply properties in prototype low-level outlets are essential to promote the understanding of the flood discharge tunnel system.
Conclusions
In the present study, the air supply by air ventilation devices is systematically studied by experimental models. The effects of air vent sizes, locations, and two combined working operations on the air supply efficiency are presented. The following conclusions can be drawn.
The air discharge through a single vent increases with vent size until the maximum air supply level is reached. For the single vent set downstream away from the low-level outlet, the air supply efficiency decreases for identical vent geometry conditions. For two combined working vents, the downstream vent can replenish air discharge into the tunnel if the size of upstream air vent is small. The air supply efficiency of the two vents is lower than that of the single air vent with an identical size. These effects are summarized in the model-based design equations. Based on the available comparison with prototype air discharge data, the present analyses are able to assess the prototype air ventilation design. For a relatively high air supply efficiency of the flood discharge tunnel, the design recommendations are suggested as relative air vent , and two combining working vents . Further prototype measurements of air supply for low-level outlets are needed to understand the model limitation and improve the accurate prediction method.
Notation
The following symbols are used in this paper:
- upstream air vent length (m);
- downstream air vent length (m);
- flow Froude number;
- contraction flow Froude number;
- water head (m);
- air space height of the tunnel residual area (m);
- tunnel height (m);
- water depth at the bottom outlet (m);
- distance to the bottom outlet of the upstream air vent (m);
- distance between upstream and downstream air vents (m);
- tunnel length (m);
- air discharge for maximum air supply efficiency ();
- total air discharge by two air vents ();
- air discharge by upstream air vent ();
- air discharge by downstream air vent ();
- water discharge ();
- air flow cross-section area above the water flow ();
- upstream air vent area ();
- downstream air vent area ();
- tunnel cross-section area ();
- approach water flow velocity ();
- air flow velocity at vent cross-sections ();
- air flow velocity at the center line of vents ();
- tunnel width (m);
- streamwise direction (m);
- vertical direction (m);
- tunnel slope (degrees); and
- vent loss coefficient.
Data Availability Statement
All data, models, and code generated or used during the study appear in the published article.
Acknowledgments
The authors gratefully acknowledge the suggestions provided by the reviewers and technical paper revisions by editors. The paper was completed within the research projects funded by the National Natural Science Foundation of China (Grant Nos. 51979182 and 51939007).
References
Aydin, I. 2002. “Air demand behind high head gates during emergency closure.” J. Hydraul. Res. 40 (1): 83–93. https://doi.org/10.1080/00221680209499876.
Campbell, F. B., and B. Guyton. 1953. “Air demand in gated outlet works.” In Proc., 5th IAHR Congress: A Joint Meeting of Int. Association for Hydraulic Research and Hydraulics Division, 529–533. Reston, VA: ASCE.
Chen, Z., and W. Huang. 1984. “A study of prototype air-demand of three large reservoir spillway tunnels in Hebei province.” [In Chinese.] J. North China Univ. Water Resour. Electr. Power 6 (1): 4–18.
Davies, H. G., and J. E. F. Williams. 1968. “Aerodynamic sound generation in a pipe.” J. Fluid Mech. 32 (4): 765–778. https://doi.org/10.1017/S0022112068001011.
Deng, J. 2017. Investigation report on the air demand in flood discharge tunnel of high dam engineering. [In Chinese.] Chengdu, China: State Key Laboratory of Hydraulics and Mountain River Engineering, Sichuan Univ.
Devenport, W., N. Alexander, S. Glegg, and M. Wang. 2018. “The sound of flow over rigid walls.” Annu. Rev. Fluid Mech. 50 (Jan): 435–458. https://doi.org/10.1146/annurev-fluid-122316-045056.
Du, Z., J. Chen, J. Xie, and Y. Liu. 2021. “Design techniques of vortex drop tunnels in Lianghekou hydropower station.” [In Chinese.] Des. Hydropower Station 37 (4): 12–15. https://doi.org/10.16671/j.cnki.cn51-1382/tv.2021.04.004.
Edwini-Bonsu, S., and P. M. Steffler. 2006. “Dynamics of air flow in sewer conduit headspace.” J. Hydraul. Eng. 132 (8): 791–799. https://doi.org/10.1061/(ASCE)0733-9429(2006)132:8(791).
Falvey, H. T. 1980. Air-water hydraulic flow in structures. Denver: US Department of the Interior, Water and Power Resources Service.
Falvey, H. T. 1990. Cavitation in chutes and spillways. Denver: US Department of the Interior, Bureau of Reclamation.
Fuentes, R., and J. J. Garcia. 1984. “Influence of the tunnel length on the hydraulic modeling of the air entrainment in the flow downstream of a high head gate.” In Proc., Symp. on Scale Effects in Modeling Hydraulic Structures, 1–2. Madrid, Spain: International Association for Hydro-Environment Engineering and Research.
Goldring, B. T. 1983. “Air voids at downshaft-tunnel bends.” J. Hydraul. Eng. 109 (2): 189–198. https://doi.org/10.1061/(ASCE)0733-9429(1983)109:2(189).
Gongchun, C., and Z. Chupei. 1987. “Some problems concerning two ways aeration in open pipe flow behind gates.” In Proc., 22th IAHR World Congress, 196–202. Madrid, Spain: International Association for Hydro-Environment Engineering and Research.
Hohermuth, B. 2017. “Air demand of high-head bottom outlets.” In Proc., 37th IAHR World Congress, 2956–2965. Madrid, Spain: International Association for Hydro-Environment Engineering and Research.
Hohermuth, B. 2019. “Aeration and two-phase flow characteristics of low-level outlets.” Ph.D. thesis, Laboratory of Hydraulics, Hydrology and Glaciology, Eidgenössische Technische Hochschule Zurich.
Hohermuth, B., R. M. Boes, and S. Felder. 2021a. “High-velocity air–water flow measurements in a prototype tunnel chute: Scaling of void fraction and interfacial velocity.” J. Hydraul. Eng. 147 (11): 04021044. https://doi.org/10.1061/(ASCE)HY.1943-7900.0001936.
Hohermuth, B., L. Schmocker, and R. M. Boes. 2020. “Air demand of low-level outlets for large dams.” J. Hydraul. Eng. 146 (8): 04020055. https://doi.org/10.1061/(ASCE)HY.1943-7900.0001775.
Hohermuth, B., L. Schmocker, R. M. Boes, and D. F. Vetsch. 2021b. “Numerical simulation of air entrainment in uniform chute flow.” J. Hydraul. Res. 59 (3): 378–391. https://doi.org/10.1080/00221686.2020.1780492.
Huang, Y., and M. J. Griffin. 2014. “The relative discomfort of noise and vibration: Effects of stimulus duration.” Ergonomics 57 (8): 1244–1255. https://doi.org/10.1080/00140139.2014.914580.
Husain, S. M., J. R. Muhammed, H. U. Karunarathna, and D. E. Reeve. 2014. “Investigation of pressure variations over stepped spillways using smooth particle hydrodynamics.” Adv. Water Resour. 66 (Apr): 52–69. https://doi.org/10.1016/j.advwatres.2013.11.013.
Jiang, F., W. Xu, J. Deng, and W. Wei. 2020. “Flow structures of the air-water layer in the free surface region of high-speed open channel flows.” Math. Probl. Eng. 2020 (Nov): 1–10. https://doi.org/10.1155/2020/5903763.
Kundzewicz, Z. W., B. Su, Y. Wang, J. Xia, J. Huang, and T. Jiang. 2019. “Flood risk and its reduction in China.” Adv. Water Resour. 130 (Aug): 37–45. https://doi.org/10.1016/j.advwatres.2019.05.020.
Lier, P., and P. Volkart. 1994. “Prototype investigation on aeration and operation in the Cumera high head bottom outlet.” In Proc., 18th ICOLD Congress, 535–553. Paris: International Commission on Large Dams.
Luo, H. 1984. “Study on air supply in flood discharge tunnels.” [In Chinese.] Shuili Xuebao 8 (1): 64–70.
Ma, B., J. Wei, X. Wang, S. Du, and J. Lian. 2022. “Operating characteristics of multi-tunnel joint flood discharge and ventilation system.” [In Chinese.] J. Water Resour. Water Eng. 33 (2): 115–123. https://doi.org/10.11705/j.issn.1672-643X.2022.02.15.
Ma, H., and F. Chi. 2016. “Major technologies for safe construction of high earth-rockfill dams.” Engineering 2 (4): 498–509. https://doi.org/10.1016/J.ENG.2016.04.001.
Qian, Y., D. Z. Zhu, W. Zhang, N. Rajaratnam, S. Edwini-Bonsu, and P. Steffler. 2017. “Air movement induced by water flow with a hydraulic jump in changing slope pipes.” J. Hydraul. Eng. 143 (4): 04016092. https://doi.org/10.1061/(ASCE)HY.1943-7900.0001252.
Rabben, S. L. 1984. Investigation of aeration of high-head gates under special consideration of scale effects. [In German.]. Aachen, Germany: Institute of Hydraulic Engineering and Water Resources Management.
Rabben, S. L., and G. Rouvé. 1984. “Air demand of high head gates-model-family studies to quantify scale effects.” In Proc., Symp. on Scale Effects in Modeling Hydraulic Structures, 1–3. Madrid, Spain: International Association for Hydro-Environment Engineering and Research.
Safavi, K., A. R. Zarrati, and J. Attari. 2008. “Experimental study of air demand in high head gated tunnels.” Proc. Inst. Civ. Eng. Water Manage. 161 (2): 105–111. https://doi.org/10.1680/wama.2008.161.2.105.
Shao, S., X.-G. Yang, and J.-W. Zhou. 2016. “Numerical analysis of different ventilation schemes during the construction process of inclined tunnel groups at the Changheba Hydropower Station, China.” Tunnelling Underground Space Technol. 59 (Oct): 157–169. https://doi.org/10.1016/j.tust.2016.07.007.
Sharma, H. R. 1973. “Air demand for high head gated conduits.” Ph.D. thesis, Dept. of Engineering Science and Technology, Univ. of Trondheim.
Sharma, H. R. 1976. “Air-entrainment in high head gated conduits.” J. Hydraul. Div. 102 (11): 1629–1646. https://doi.org/10.1061/JYCEAJ.0004650.
Song, K., W. Wei, S. Wu, L. Zhang, and Z. Yang. 2022. “Numerical investigation on effect of air vent on air supply.” AIP Adv. 12 (8): 085221. https://doi.org/10.1063/5.0101976.
Speerli, J. 1999. “Air entrainment of free surface tunnel flow.” In Proc., 28th IAHR World Congress, 613–618. Madrid, Spain: International Association for Hydro-Environment Engineering and Research.
Speerli, J., and W. H. Hager. 2000. “Air-water flow in bottom outlets.” Can. J. Civ. Eng. 27 (3): 454–462. https://doi.org/10.1139/l99-087.
Tullis, B. P., and J. Larchar. 2011. “Determining air demand for small-to medium-sized embankment dam low-level outlet works.” J. Irrig. Drain. Eng. 137 (12): 793–800. https://doi.org/10.1061/(ASCE)IR.1943-4774.0000345.
USACE. 1964. Air demand—Regulated outlet works. Washington, DC: USACE.
Vischer, D., and W. H. Hager. 1998. Dam hydraulics. Chichester, UK: Wiley.
Volkart, P., and P. Rutschmann. 1991. “Aerators on spillways.” In Air entrainment in free-surface flows: IAHR hydraulic structures design manual 4.1, edited by I. R. Wood. Rotterdam, Netherlands: A.A. Balkema.
Volkart, P., and J. Speerli. 1994. “Prototype investigation of the high velocity flow in the high head tunnel outlet of the Panix dam.” In Proc., 19th ICOLD Congress. Paris: International Commission on Large Dams.
Wei, W., J. Deng, and W. Xu. 2021. “Numerical investigation of air demand by the free surface tunnel flows.” J. Hydraul. Res. 59 (1): 158–165. https://doi.org/10.1080/00221686.2020.1744747.
Wisner, P. 1967. “Air entrainment in high speed flows.” In Proc., 9th ICOLD Congress, 495–507. Paris: International Commission on Large Dams.
Wright, N. W., and B. P. Tullis. 2014. “Prototype and laboratory low-level outlet air demand comparison for small-to-medium-sized embankment dams.” J. Irrig. Drain. Eng. 140 (6): 04014013. https://doi.org/10.1061/(ASCE)IR.1943-4774.0000712.
Xiong, X.-H., A.-H. Li, X.-F. Liang, and J. Zhang. 2018. “Field study on high-speed train induced fluctuating pressure on a bridge noise barrier.” J. Wind Eng. Ind. Aerodyn. 177 (Jun): 157–166. https://doi.org/10.1016/j.jweia.2018.04.017.
Xu, W. 2016. “Research on hydraulic characteristics of the bottom tunnel in Houziyan hydropower station.” [In Chinese.] Des. Hydropower Station 32 (4): 24–28. https://doi.org/10.16671/j.cnki.cn51-1382/tv.2016.04.006.
Information & Authors
Information
Published In

Journal of Hydraulic Engineering
Volume 149 • Issue 12 • December 2023
Copyright
This work is made available under the terms of the Creative Commons Attribution 4.0 International license, https://creativecommons.org/licenses/by/4.0/.
History
Received: Apr 8, 2022
Accepted: Jun 14, 2023
Published online: Sep 23, 2023
Published in print: Dec 1, 2023
Discussion open until: Feb 23, 2024
ASCE Technical Topics:
Authors
Metrics & Citations
Metrics
Citations
Download citation
If you have the appropriate software installed, you can download article citation data to the citation manager of your choice. Simply select your manager software from the list below and click Download.