Experimental Study of the Earth Pressure Evolution on a Model Wall Rotating about Its Base
Publication: Journal of Geotechnical and Geoenvironmental Engineering
Volume 150, Issue 7
Abstract
Quantifying the earth pressure acting on retaining structures is essential for a number of engineering applications, including the assessment of damaged structures. In response to the widespread corrosion found in many cantilever retaining walls in Switzerland, this study investigates the evolution of the earth pressure acting on a retaining wall rotating about its base: the dominant deformation mode for such structures. In a controlled setup, a scaled cantilever retaining wall is first backfilled and then subjected to rotation about its base. An extensive experimental program was conducted to evaluate the effects of different soil properties, packing densities, and initial soil stresses on the earth pressure during the life of a wall. Accurate measurements allow the stick-slip behavior typical of granular soils to be observed. An analysis of this behavior suggests that its impact on the practical safety assessment of retaining walls is negligible. Tests performed under 3D conditions show how local damage to a section of the wall results in a lower active earth pressure value on that section due to stress redistribution, which causes an increase in pressure on adjacent sections. It is also observed how the initial earth pressure acting on retaining walls after backfilling results from a perturbed stress state due to wall deflection and wall friction. Its distribution is bilinear for uncompacted soil and nonlinear for compacted soil. Loosely packed soil exerts higher pressures than densely packed soil. The unloading process shows the expected behavior of loose and dense soil: it is slower and monotonic in loose soil and faster in dense soil, where the initial unloading is followed by reloading due to softening in the backfill. The experimental results are available in a public repository and can serve as a resource for the development and validation of improved verification procedures.
Introduction
In Switzerland and Austria, the structural integrity of cantilever retaining walls along highways and railways has attracted much attention after destructive tests revealed severe corrosion, resulting in a cross-sectional loss of the main tensile reinforcement (Groupement GUMA 2014). The observed damage was located at the construction joint between the wall stem and the base slab. It was attributed to poor concrete quality and was identified as a critical risk that could lead to abrupt, brittle failure of the affected walls (Vollenweider 2014; Groupement GUMA 2014). Haefliger and Kaufmann (2023a) observed that the load-deformation behavior of the stem of a cantilever retaining wall is predominantly characterized by a rigid body rotation about the construction joint (i.e., the base of the stem) due to the lap splice typically located directly above the construction joint. Considering this deformation mode, the bending moment acting on the wall in the ultimate (i.e., active) limit state can be estimated using the limit analysis solution proposed by Perozzi and Puzrin (2023b).
Typically, cantilever retaining walls are designed to withstand the active earth pressure under the implicit assumption that the rotational capacity of the wall is sufficient for the backfill to reach the active state. However, when dealing with a corroded wall, the localized loss of cross section reduces both the wall’s load-bearing and rotational capacity (Haefliger and Kaufmann 2022). Consequently, wall failure may occur abruptly at a small rotation value under increased earth pressure. Moreover, the nature of corrosion often leads to a variable degree of damage along the wall, especially in different sections of the same wall. In such cases, corroded sections experience more significant displacement, causing arching effects in the soil that partially redistribute horizontal soil stress to the stiffer, noncorroded adjacent sections. All of these factors emphasize the critical importance of gaining a deeper understanding of earth pressure behavior in these scenarios.
Previous research has investigated the evolution of earth pressure between the initial and ultimate states. For example, Sherif et al. (1984) observed that the initial earth pressure can be estimated using Jáky’s (1944) formula for the earth pressure at rest only for loose soil and that the active earth pressure is linearly distributed. Fang and Ishibashi (1986) conducted experimental investigations on the earth pressure behind walls subjected to different displacement modes. Although they conducted tests on different soil densities, they reported earth pressure data only for the loosest soil condition. In this test, they noticed rapid unloading of the upper wall section and suggested that the earth pressure distribution in the active state is nonlinear. This publication has become a standard reference for validating models predicting earth pressure on walls rotating around their base. Often, Fang and Ishibashi’s (1986) earth pressure data at a rotation of 1.5 mrad (shown in their publications Fig. 12) is assumed to represent the active state (e.g., Harrop-Williams 1989; Li et al. 2014; Tang et al. 2018), but Fig. 13 in the same publication shows that at this rotation, only the mobilized wall friction reached a steady state, while both the horizontal earth pressure and its location continue to change, indicating that the ultimate state is only reached after a rotation of 6 mrad. More recently, Patel and Deb (2020) examined the earth pressure on a 60-cm high wall subjected to rotation around its base. They found a nonlinear stress distribution in the active state, although their rationale for choosing the rotation at which active failure is reached is poorly supported, as only the displacement-dependent pressure reading from a pressure transducer located in the upper portion of the wall—which is known to be unloaded before the lower portion—is shown. tom Wörden (2010) conducted an extensive experimental study regarding three-dimensional earth pressure. It involved a series of parametric experiments on narrow walls with varying width-to-height ratios (always greater than or equal to 2), using backfill of varying densities. His results indicated a decrease in earth pressure compared to what is typically observed under plane strain conditions. In addition, he noted an increase in stress levels on the adjacent rigid walls; however, the magnitude of the additional load these walls had to bear was not quantified. Finally, Chen and Fang (2008) investigated the earth pressure acting on a stiff wall after vibration-induced compaction. In the upper part of the wall, they observed increased stresses close to the passive value, while the stresses in the lower part were closer to the active value, indicating unloading as deposition and compaction of additional layers progressed.
Despite these insightful yet limited investigations, a comprehensive study of the displacement-dependent evolution of the active earth pressure on rotating walls and its controlling parameters is still missing. This lack of knowledge, combined with the lack of knowledge on the structural behavior of corroded walls, has led to high uncertainties in the verification of existing retaining structures in the Alpine region, resulting in preventive strengthening campaigns (Cuennet and Schär 2016; Ekwall 2016), which caused high costs and environmental impact, in addition to traffic disruptions. This has led to the initiation of an extensive research effort in the Alpine region to provide improved knowledge for the safety assessment of these structures (e.g., Rebhan 2019; Haefliger and Kaufmann 2023b; Perozzi and Puzrin 2023a). This paper is a partial outcome of that research effort (Perozzi 2022; Perozzi and Puzrin 2023a) and presents the results of a comprehensive experimental study on the displacement-dependent earth pressure on a wall undergoing rotation about its base. Based on preliminary numerical analyses that emphasized soil stiffness, strength, and initial stress state as primary influences in the wall unloading process (Perozzi 2022), this study methodically investigates these variables in a scaled, controlled test setup. By utilizing accurate measurement devices, this research provides new insights into the loading history of a cantilever retaining wall, from its construction to a possible bending failure. In addition, the potential 3D effects of inhomogeneous deterioration in the longitudinal direction of the wall are investigated by simulating the damage of a single wall section.
Experimental Setup and Program
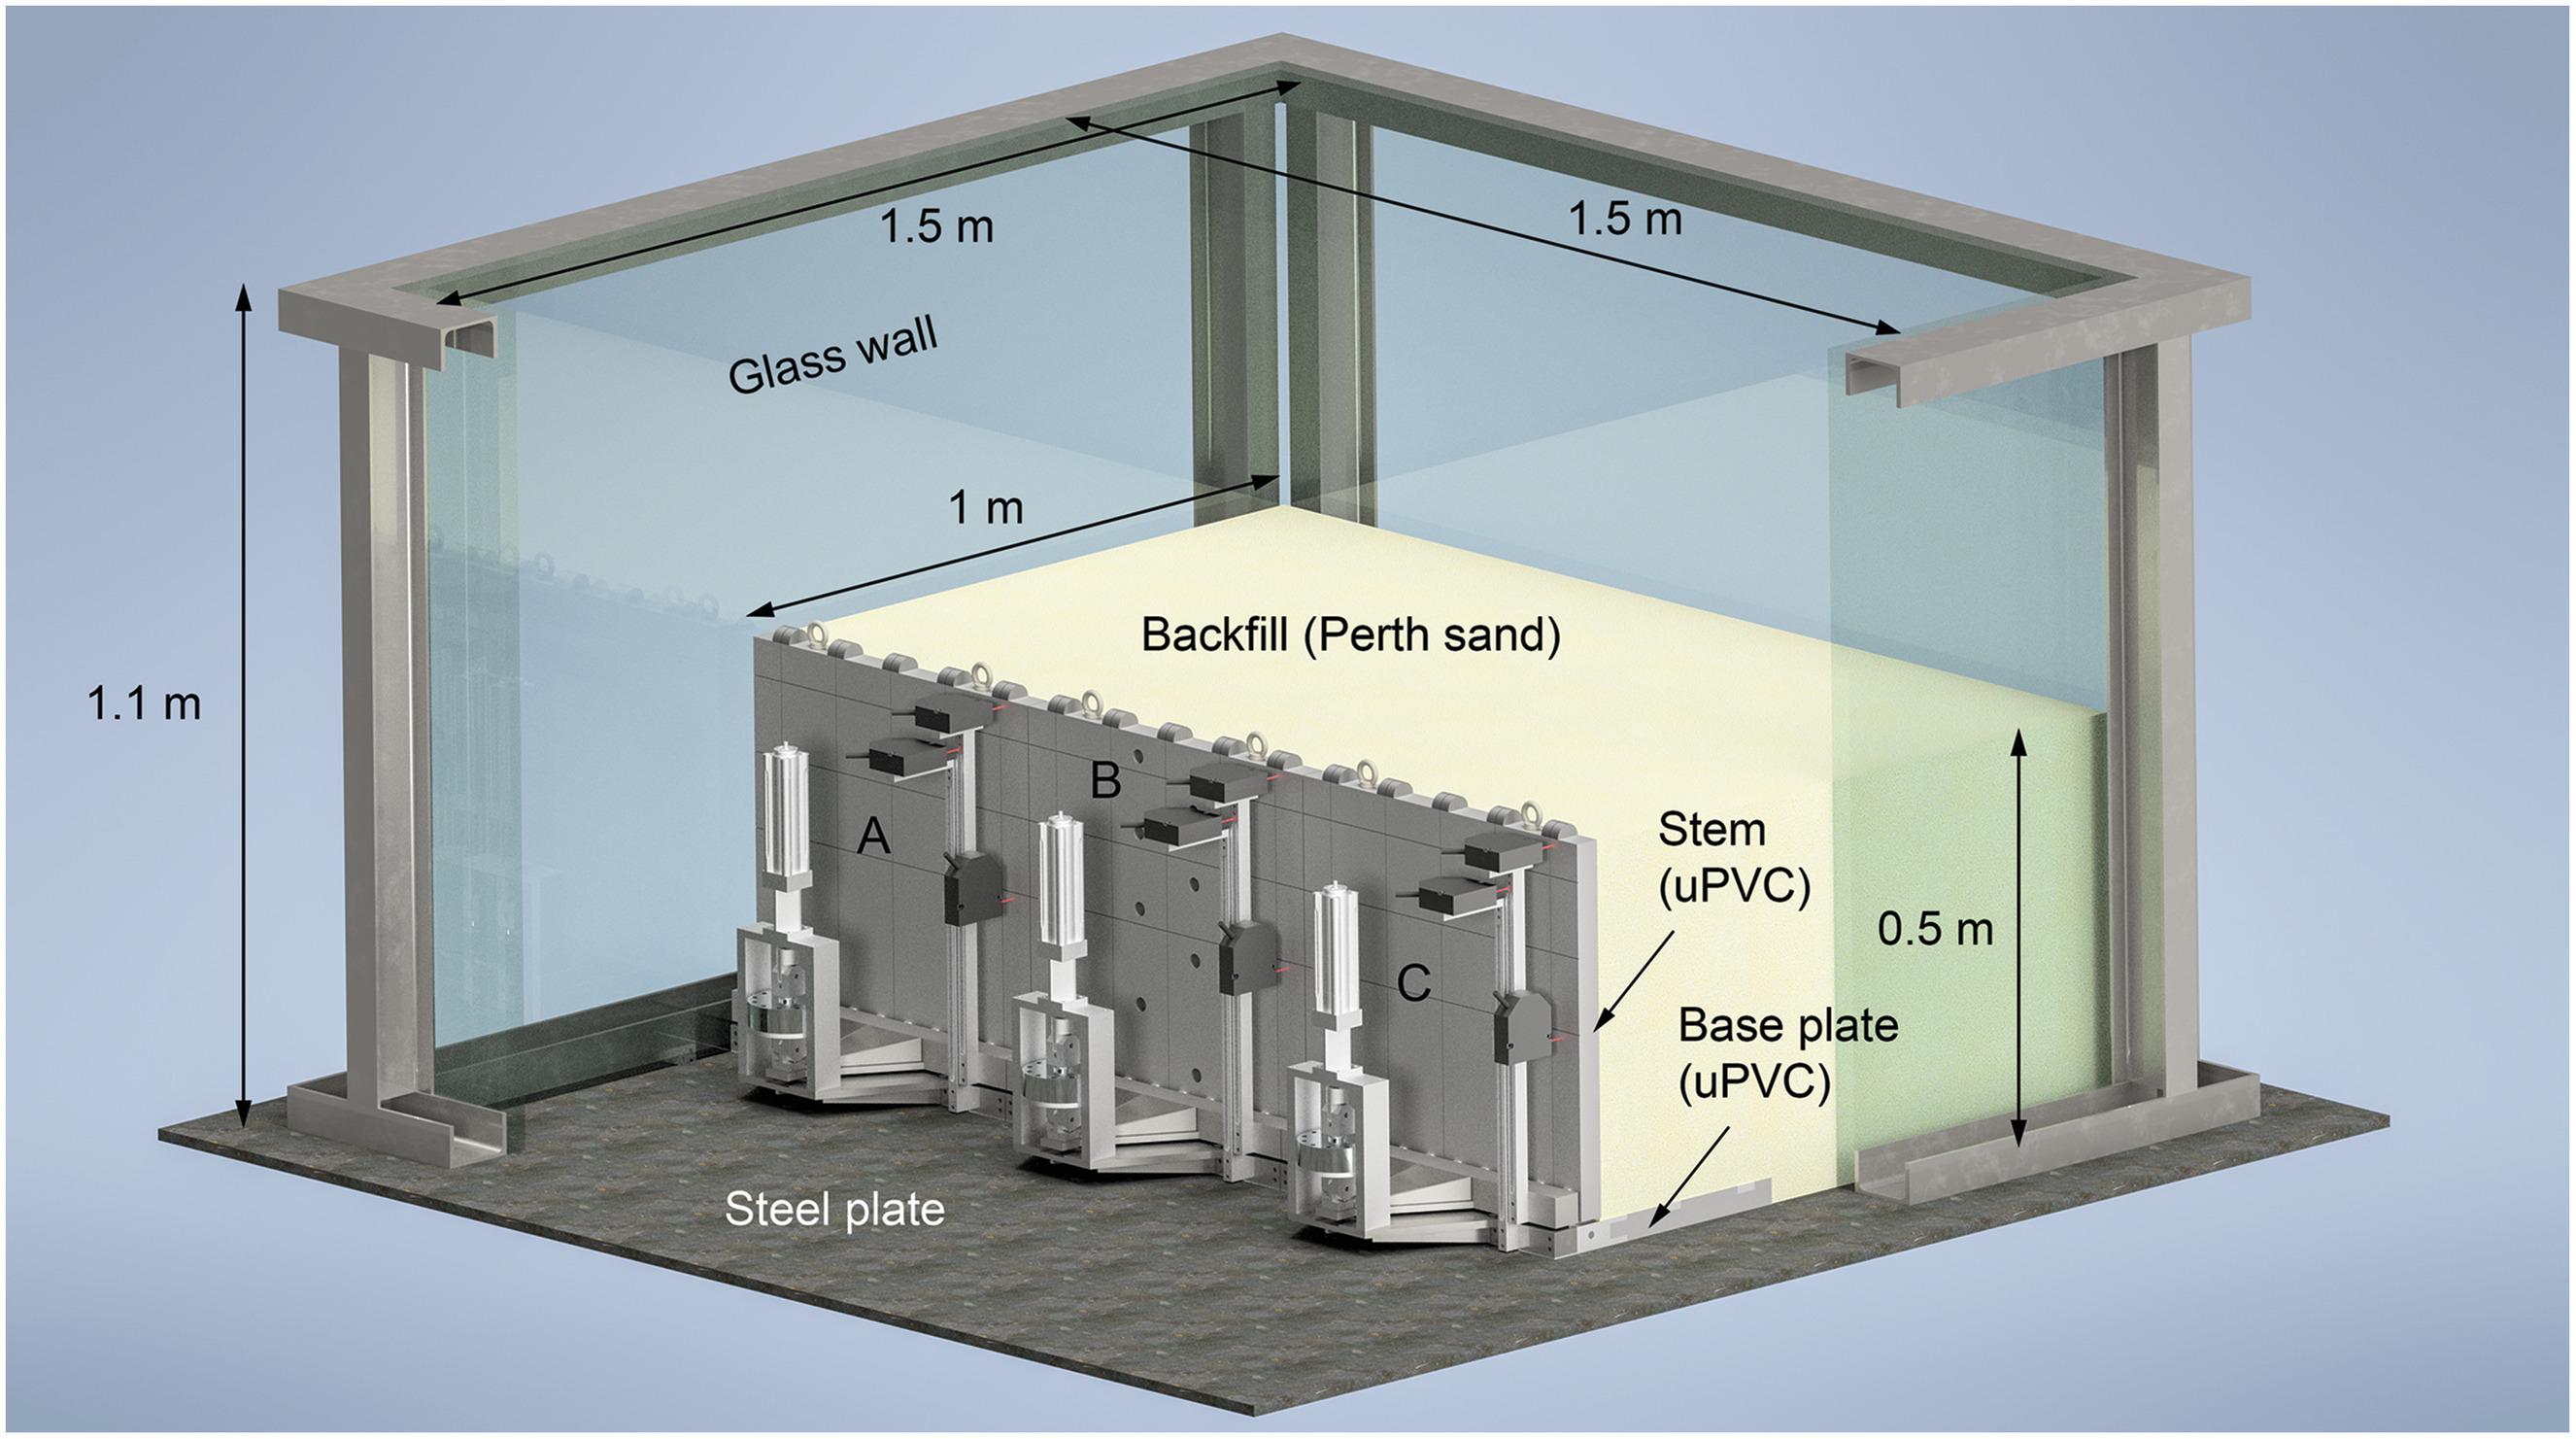
The experimental study aims to systematically quantify the earth pressure acting on a rotating retaining structure under various controlled and repeatable conditions, including different initial stress states and soil properties. The experimental setup is illustrated in Fig. 1. It features a scaled cantilever wall measuring 150 cm in length and having a 50-cm-high stem. The wall consists of three identical, independent sections, named A, B, and C, each 50 cm long and fully instrumented. This design choice ensures that wall B operates under plane strain conditions while boundary effects (specifically, the friction between backfill and box walls) partially influence only the outer sections. During a test, the wall sections are positioned side-by-side within a specially designed box with inner dimensions of (). The wall is then backfilled with soil methodically deposited by air pluviation to generate different densities. One wall side is lined with a soft felt strip to prevent force transmission between sections, reducing contact pressure and preventing sand leakage. Teflon tape is applied to the other side for low friction. The success of these measures was validated by applying a force or rotation to one section and confirming that no force was transmitted to the adjacent walls.
Test Wall
The test wall is designed as an L-shaped cantilever wall consisting of a base plate and a stem made of 35-mm-thick uPVC panels. This design replicates the maximum displacement-to-height ratio of a 10 times larger reinforced concrete wall, ensuring a realistic earth pressure distribution after backfill deposition. Key properties of uPVC include a density of , Young’s modulus of 3,500 MPa, Poisson’s ratio of 0.4, and a coefficient of thermal expansion of . Because of the relatively high coefficient of thermal expansion, it is important to perform the tests quickly and in a controlled environment to minimize temperature fluctuations. A temperature fluctuation of about 1°C–2°C was observed during the tests.
The base plate and stem are connected by an axle that allows differential rotation, as shown in Fig. 2. The rotation of the stem relative to the base plate is controlled by an off-center linear actuator mounted between a steel plate connected to the base and another connected to the stem. Two stiffening square steel bars ensure uniform wall rotation in the longitudinal direction. Although the structure supporting the linear actuator is very stiff, it cannot be considered rigid. In fact, due to the finite stiffness of all components (e.g., the steel plates, and the force transducer), the wall stem undergoes a finite (rigid body) rotation even when the actuator is not moving. This load-dependent rotation of the stem about the hinge is given by , where = bending moment acting on the hinge; and = (constant) rotational stiffness. The mechanical system of a wall section and the calibration of the rotational stiffness, , are detailed in the Supplemental Materials.
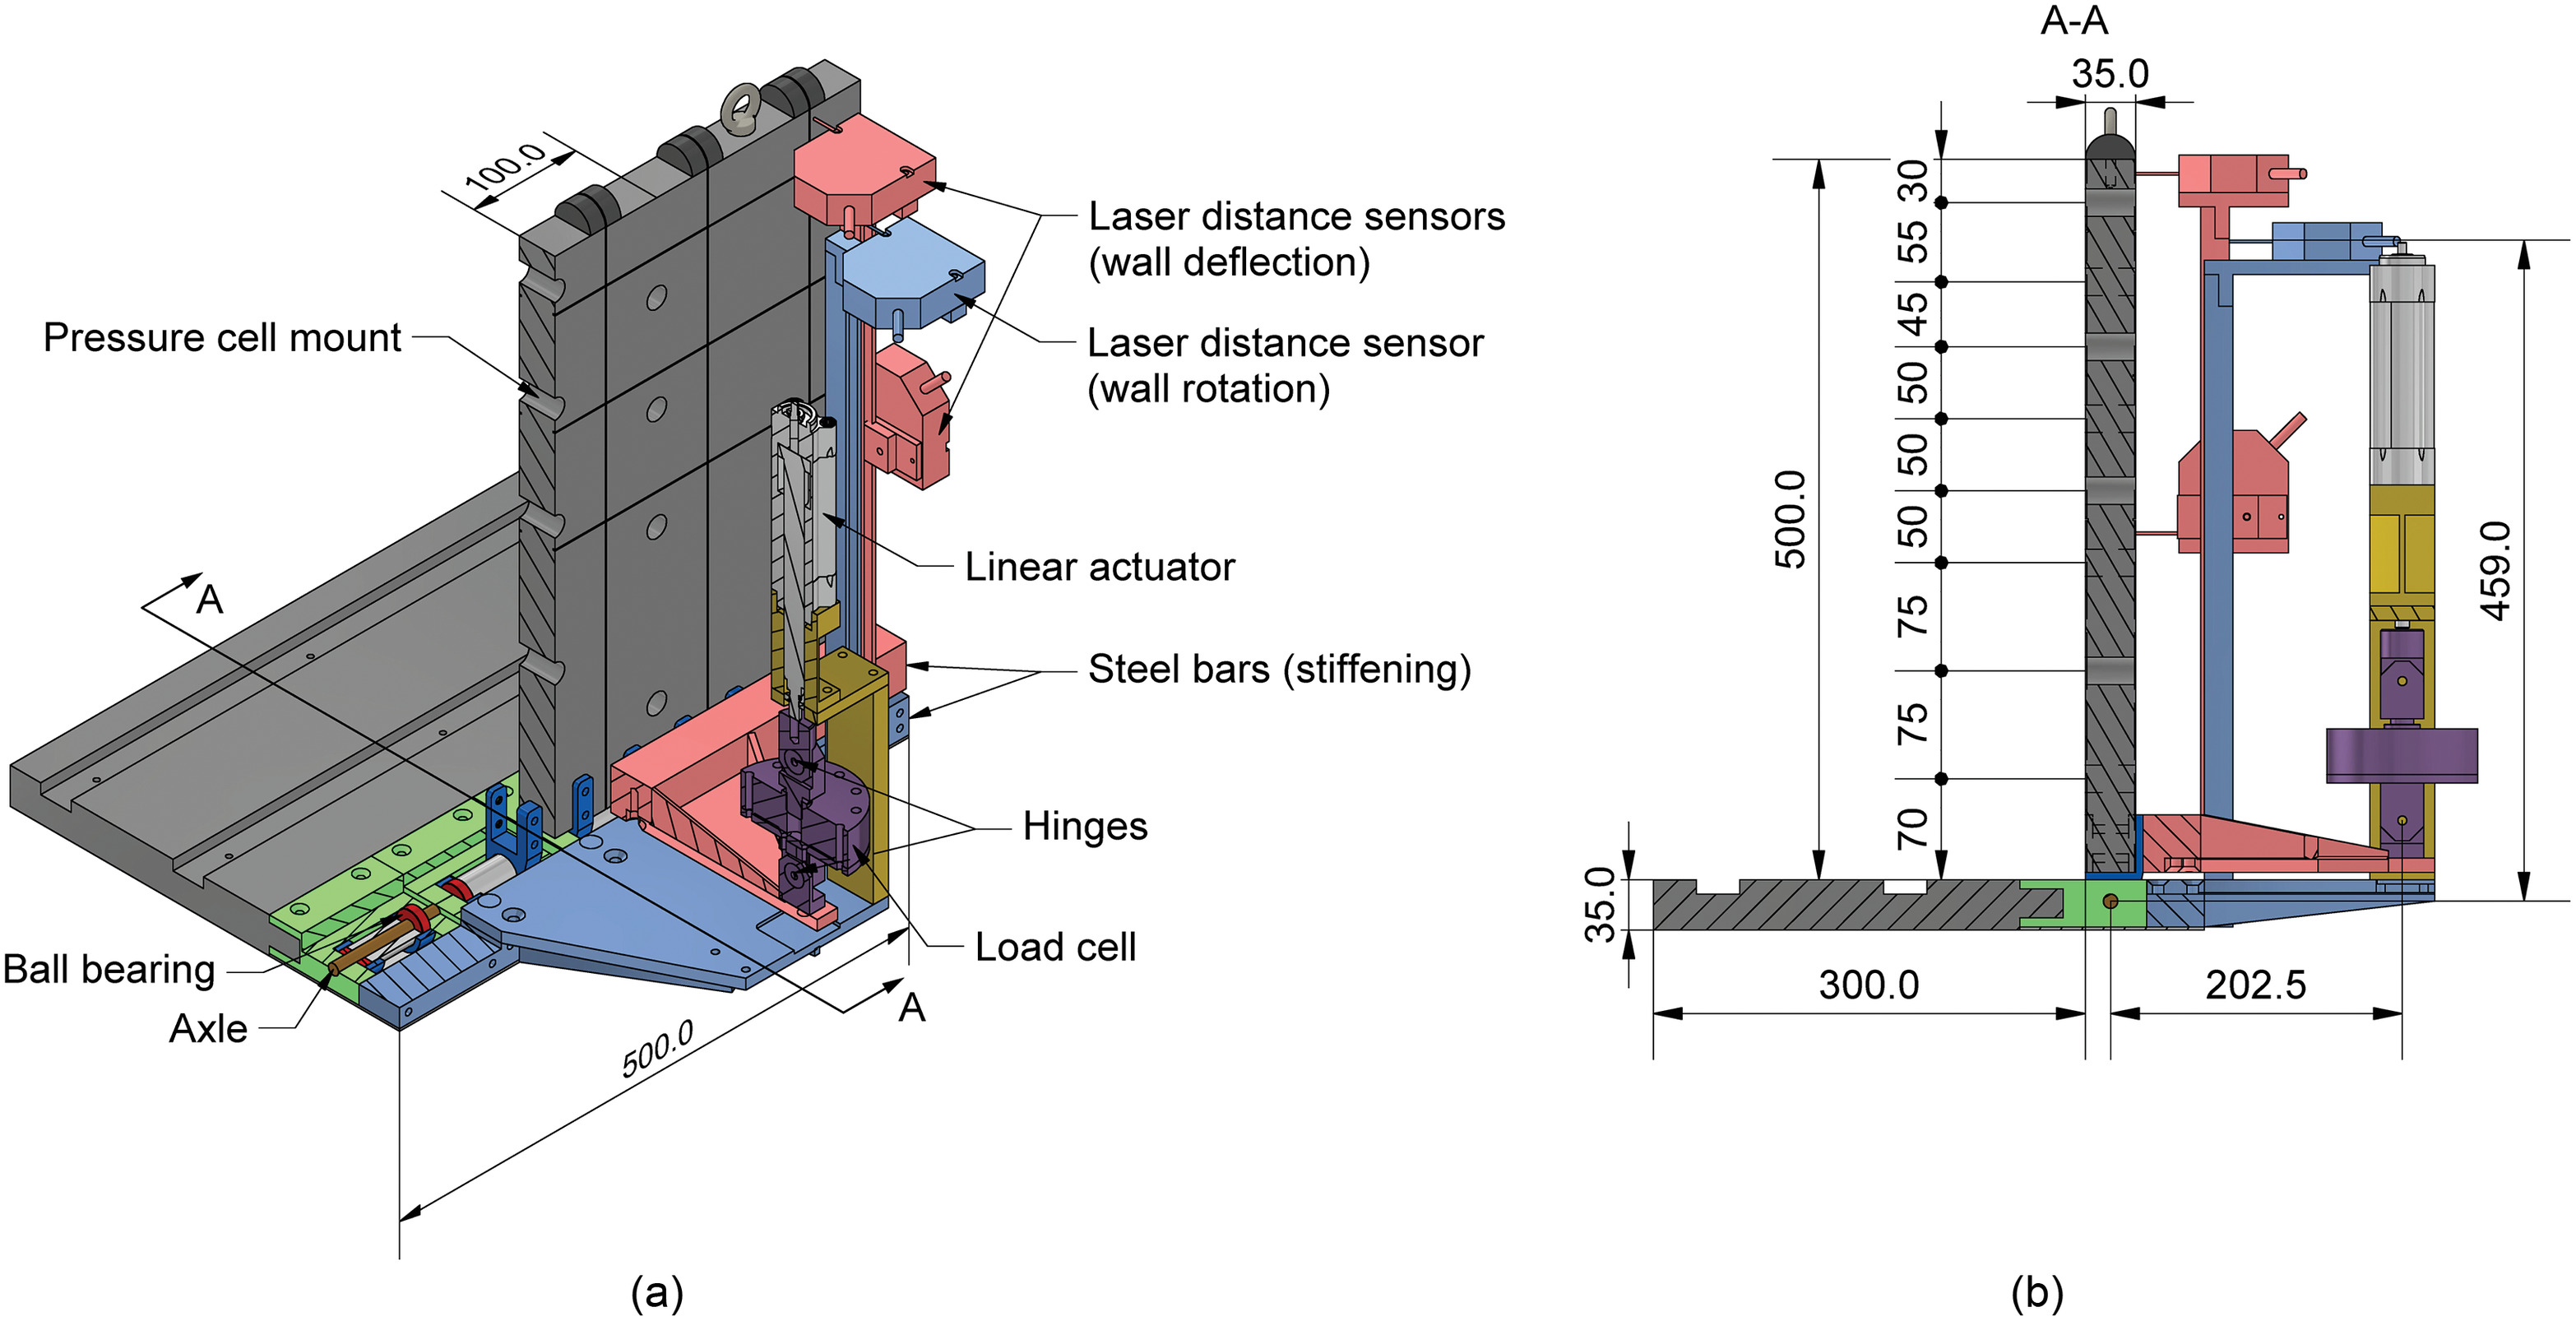
Two off-axis devices measure the moment and the rotation at the base of the stem. The moment is calculated from the force the actuator transfers from the stem to the base, measured by a force transducer (HBM model U10M, with an accuracy of 0.25 N), and then multiplied by a 202.5 mm lever arm. The stem rotation around the axle is determined by a laser sensor (shown in blue in Fig. 2) that tracks the linear distance between two bars attached to the foundation and the stem, respectively. This off-axis measurement provides superior accuracy and reliability over a rotary position sensor by reducing systematic error due to the large distance between the sensor and the axle.
Two laser sensors attached to the bar on the stem (shown in red in Fig. 2) measure the deflection at the top and middle of the wall, recording pure wall deflection without rotational components. In addition, fiber optic strain sensing on an embedded glass fiber grid is used to measure the wall strain. The validation of these measurements is shown in the Supplemental Materials.
In the center of wall B are eight pressure transducers (Honeywell model ABH015PGC1B, with an accuracy of 0.26 kPa and a diameter of 19 mm) that measure the normal stress from the soil backfill. The suitability of these transducers and their performance in the low-pressure range have been successfully tested at the Institute of Geotechnical Engineering of ETH Zurich using water and sand in a calibration box at a low-pressure range. In addition, a cross-validation of the measured stresses is presented in the Supplemental Materials. In fact, the developed measuring concept results in a robust system in which each quantity is redundantly measured by independent devices, allowing for cross-verification. For example, the wall rotation is verified by the actuator position, the moment is verified by the normal stress integration (see Supplemental Materials), and wall deflections are verified either by strain integration or by calculating the deflections of an elastic wall subjected to the measured earth pressure.
Test Soil
Dry, poorly graded silica sand from the Australian coast south of Perth (also known as Perth sand) was used. The grain size parameters are as follows: effective grain size , median grain size , and . It has minimum and maximum void ratios of and , respectively, measured following ASTM Standards D4253-16 and D4254-16 (ASTM 2016a, b). This results in a density range that varies between and . Computed tomography scans of sand grains analyzed by Perozzi (2022) showed a roundness ranging from about 0.45 to 0.75 and sphericity ranging from 0.7 to 0.9. The grains were described as subangular with medium sphericity.
The mechanical behavior of the soil was studied by Perozzi (2022) through element tests. As a first step, oedometer and triaxial tests were performed in the laboratory. The oedometer tests were performed up to a vertical stress of 500 kPa, including two unloading-reloading cycles. In the triaxial tests, soil samples were sheared from an initial isotropic stress state, with consolidation stresses varying between 25 and 100 kPa.
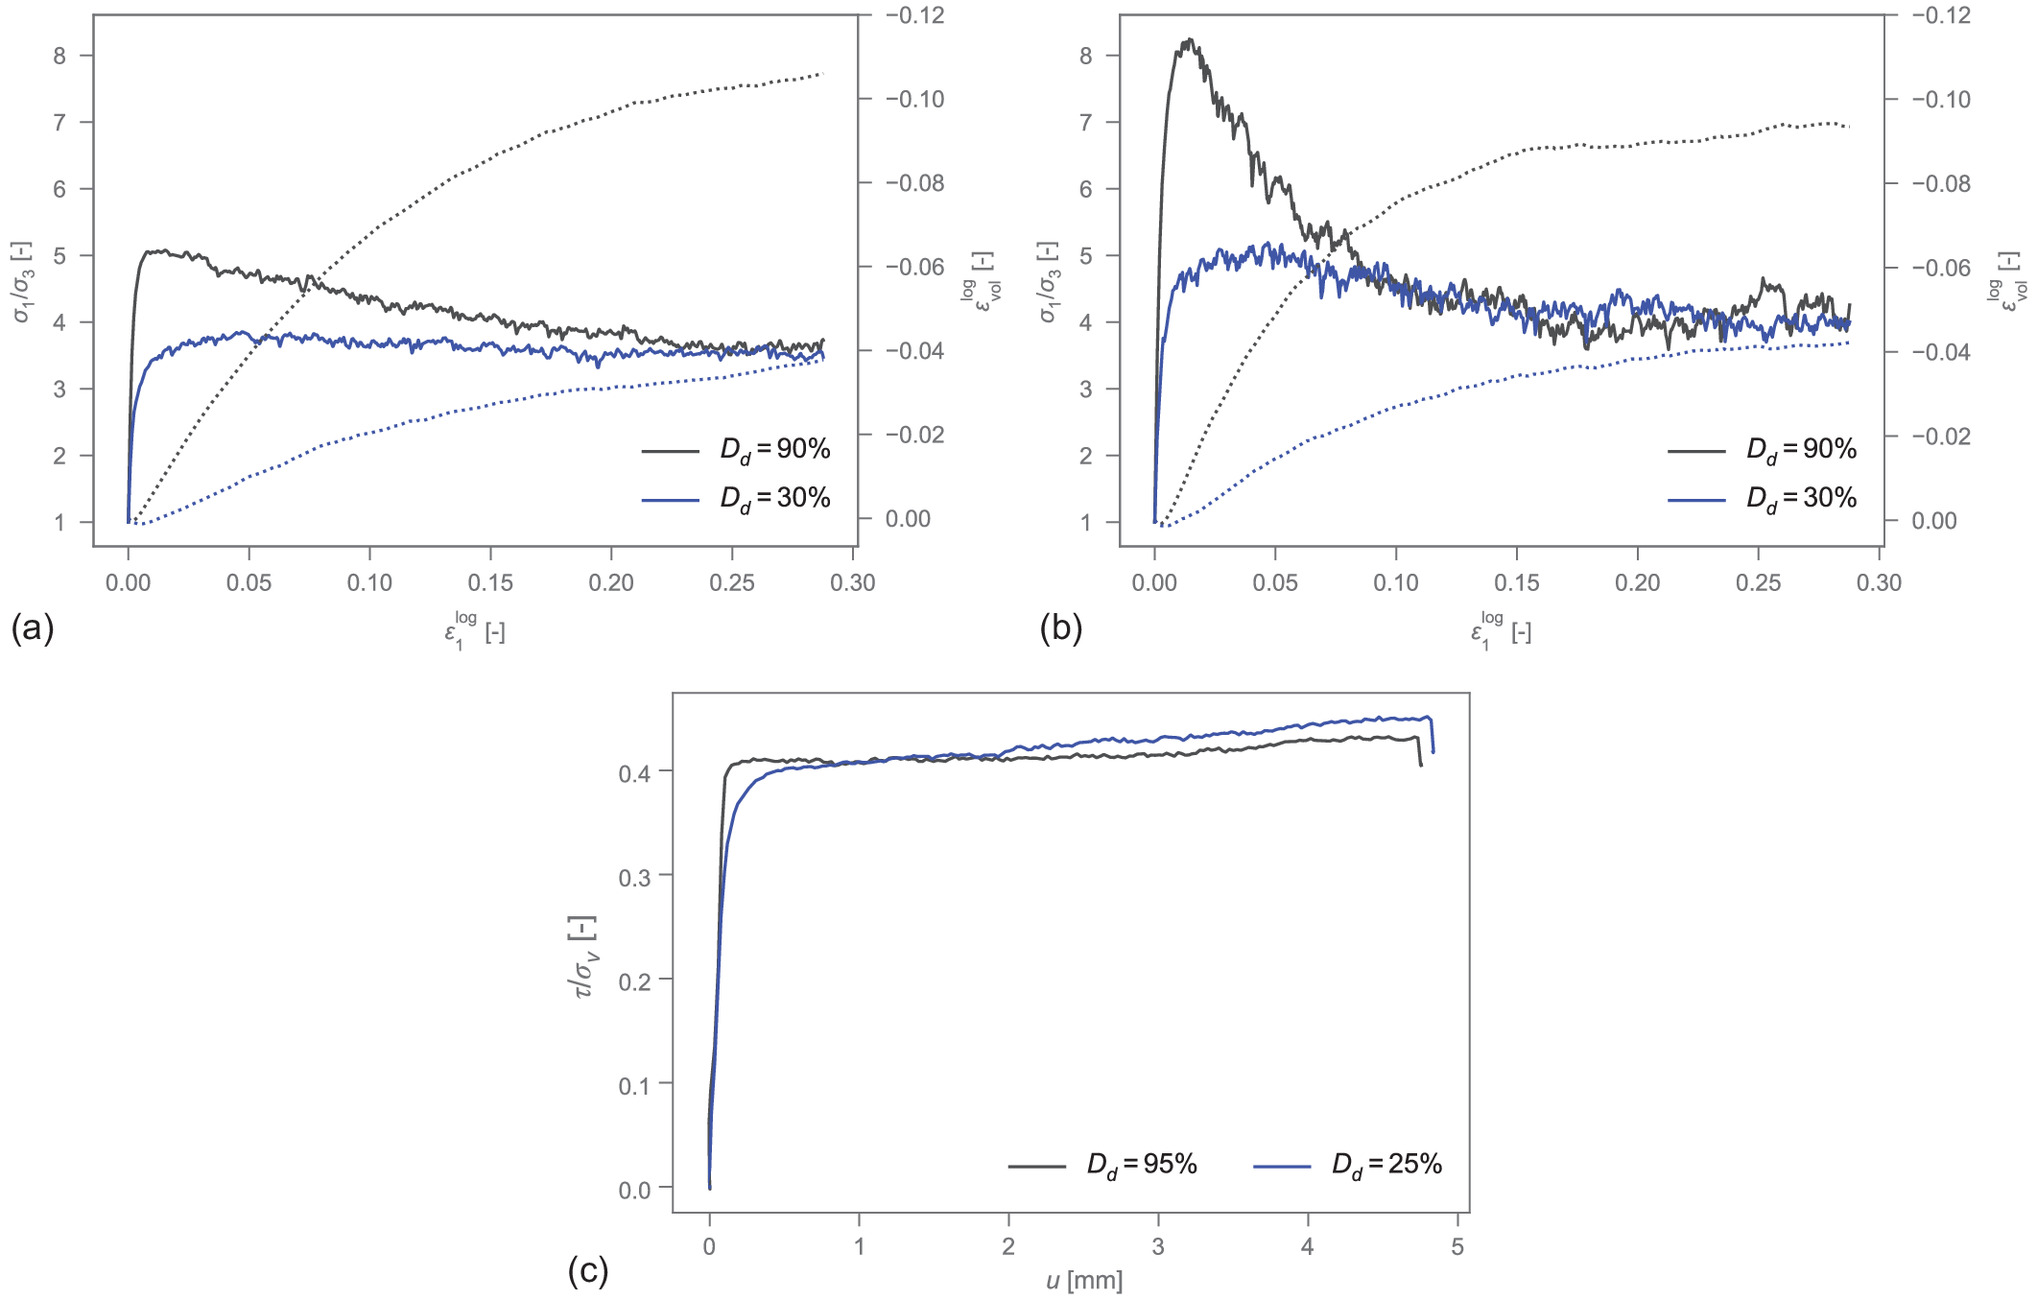
Adopting the mechanical properties of sand directly from the standard oedometer and triaxial tests should, however, be done with caution. Firstly, the stress state acting in the backfill of displacing retaining walls is biaxial and not triaxial. Second, scaled experiments typically operate at low stress levels. Conducting laboratory tests under these conditions is challenging due to boundary effects, gravity-induced stress gradients in the specimen, and the limited accuracy of the instrumentation (e.g., Kuerbis and Vaid 1990; Wu and Kolymbas 1991). Consequently, Perozzi (2022) opted for a numerical approach and investigated the soil behavior under such conditions using the level-set discrete element method (Kawamoto et al. 2016, 2018). The model parameters for the virtual specimen (namely, normal and tangential contact stiffness and interparticle friction) were calibrated against the laboratory tests performed at 25–100 kPa radial stress. The virtual specimen was then tested at various stress levels and under plane strain and triaxial conditions. The results showed no pressure dependence of soil strength and dilatancy. Instead, they showed the important influence of the stress path. In fact, the biaxial test showed an increased peak strength compared to the triaxial test. Both results have already been observed by Tatsuoka et al. (1986). The resulting soil behavior is shown in Fig. 3, and the derived plastic parameters (assuming the Mohr-Coulomb failure and yield criteria) are summarized in Table 1. Other parameters needed to model the elastoplastic behavior of the test soil can be found in Perozzi (2022, chaps 6, 8, and 10). All strain measures in Figs. 3(a and b) relate to the logarithmic strain tensor , where = deformation gradient [see also Holzapfel (2000)]. The dense specimen sheared under biaxial conditions reached a peak friction angle of 52° instead of the 42° measured in a triaxial test. This increased strength is supported by the dilatancy theory developed by Rowe (1969) and is confirmed by the semiempirical method proposed by Hanna (2001). Even the (medium-) loose sample with a relative density of 30% showed an increased peak strength in the biaxial test, although it did not show a clear peak under triaxial conditions. In addition, a slight increase in strength was observed in the residual state (from 34° to 37°). This is not supported by existing theories and requires further investigation as it may only be induced by the affine displacement boundary conditions used to model the virtual specimen (Perozzi 2022).
| Soil relative density (%) | (degrees) | (degrees) | (degrees) |
|---|---|---|---|
| 30 (loose) | 42 | 37 | 10 |
| 90 (dense) | 52 | 37 | 23 |
In addition, constant normal load direct shear tests were conducted using an uPVC plate and Perth sand at various densities to determine the soil-wall interface friction. The results are presented in Fig. 3(c). Regardless of the sand density, a friction coefficient of was obtained, corresponding to an approximate friction angle of . The independence of the interface friction from the sand density is supported by the findings of Porcino et al. (2003) and can be explained by the smooth surface, which favors sliding rather than soil shearing, as is also confirmed by the absence of a peak in the results.
Testing Procedure
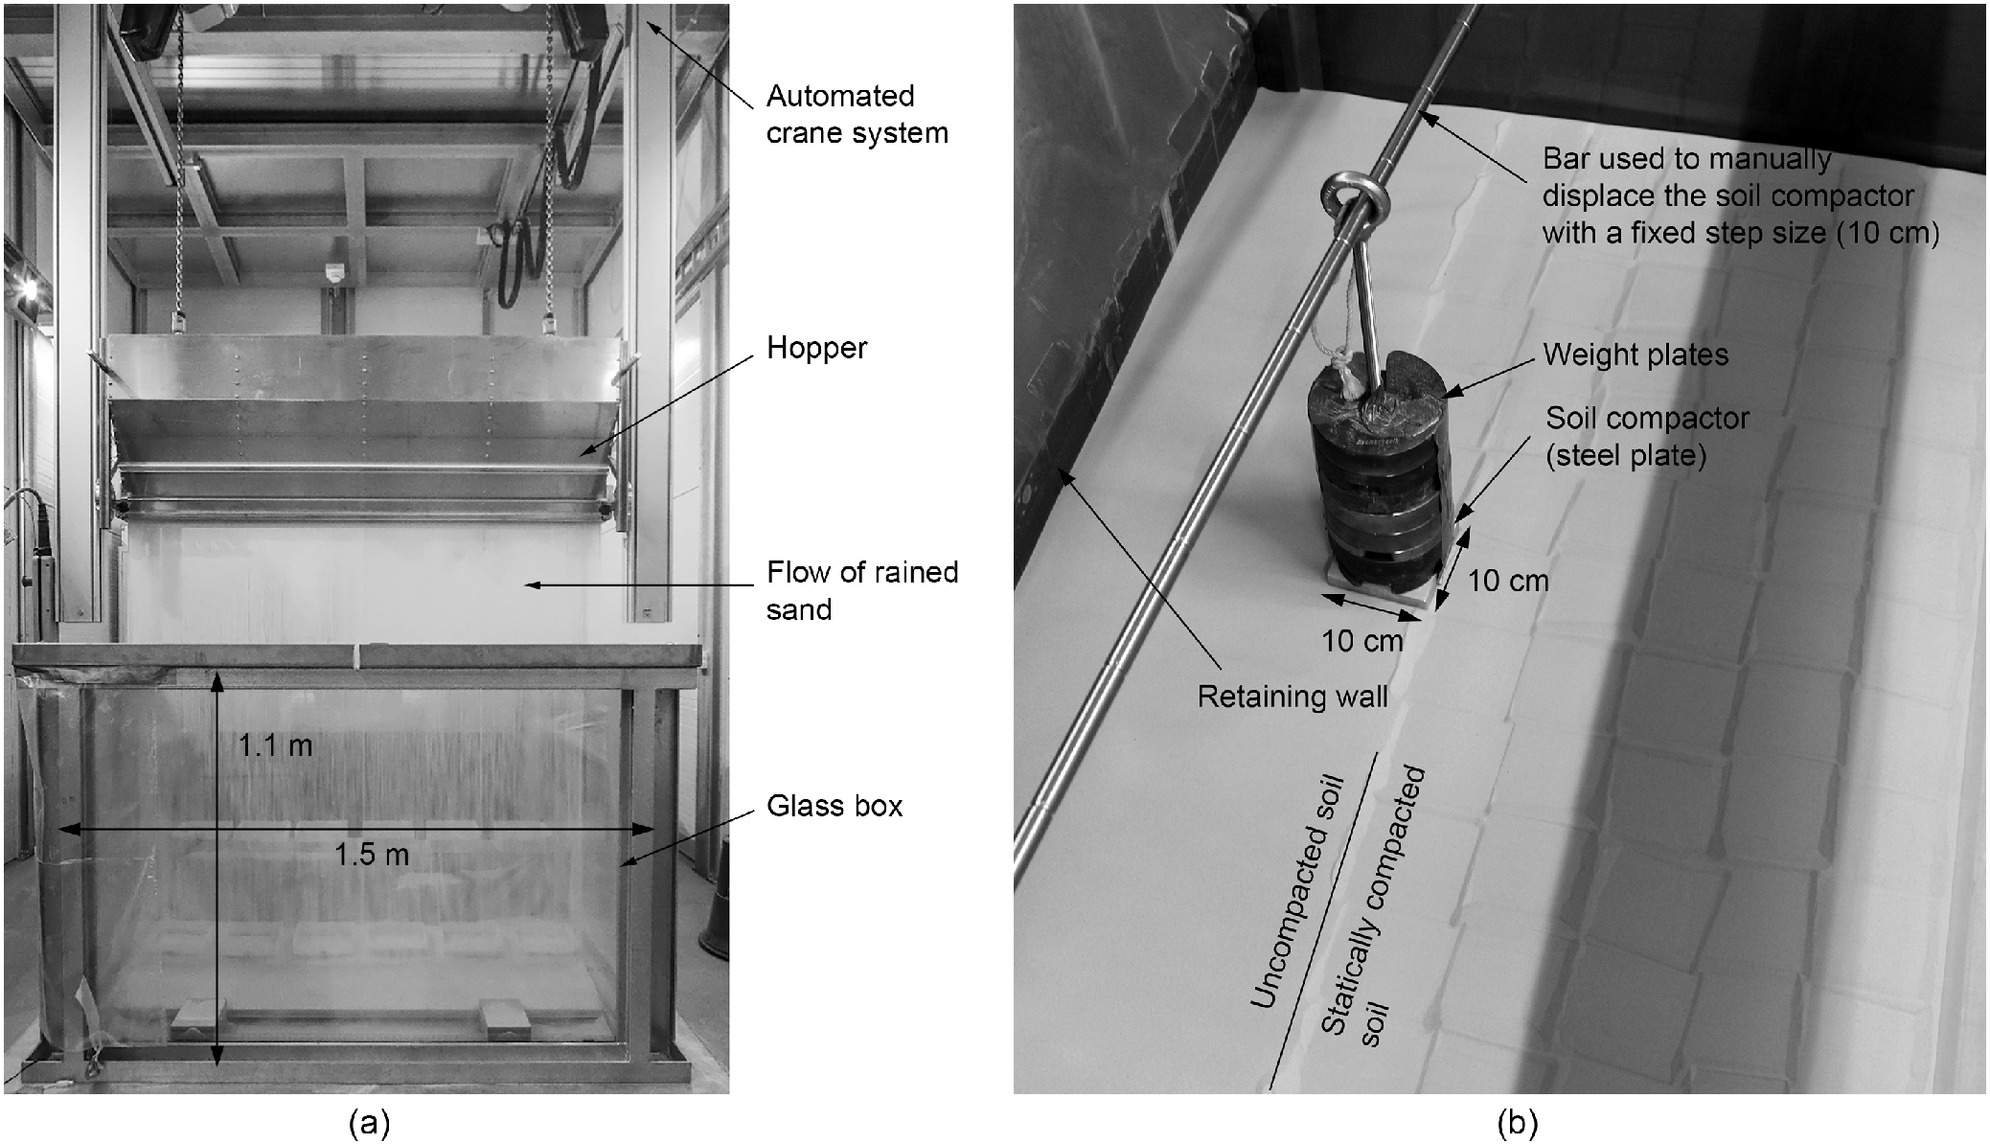
The tests consisted of two phases: backfilling and rotation. During backfilling, an automated system [Fig. 4(a)], including a crane and hopper, deposited soil in 6–8 cm thick layers at relative densities between 13% and 105% (a relative density higher than 100% indicates that the pluviation system can generate denser samples than the standard ASTM procedure). During the deposition, a constant raining height was maintained. In some tests, each deposited layer is statically compacted to study the effects of increased initial stresses on the wall unloading process. Static compaction was chosen and preferred over other methods, such as vibration, because it allows straightforward quantification of the compaction load and guarantees a negligible change in the relative density of the soil so that both contractive (low relative density) and contractive-dilative (high relative density) soil samples could be tested. Each layer was compacted using a rigid plate with a vertical stress of 20 kPa [Fig. 4(b)]. During soil deposition and compaction, the wall stem was free to deform as it would in a real retaining wall. Instead, the base plate of the wall was fixed to the ground to prevent sliding.
After backfilling was complete, the rotation phase was started. Here, the wall stem was rotated around its base by moving the linear actuator downward at a rate of , resulting in a rotational speed of approximately . This slow rotation ensured high temporal resolution of results and prevented dynamic effects. Each test was completed when a total rotation of approximately 35 mrad was reached.
Experimental Program
This study aims to understand the wall unloading process for different soil behavior and initial earth pressures. Essential information for each test is summarized in Table 2. Each test identifier begins with “C,” denoting the previously described cantilever retaining wall, followed by a unique number. Subsequent characters indicate whether the soil used was dense (“D”; exhibits hardening followed by softening behavior) or loose (“L”; predominantly hardens). Additional letters may indicate soil compaction after deposition (“c”) or rotation of the middle wall segment only (“3d”). The notation refers to the density of a single layer after deposition, leaving the density after compaction undefined.
| Identifier | Relative density (%) | Static compaction | Observations |
|---|---|---|---|
| C1L | 10 | No | All wall sections were rotated simultaneously to ensure plane strain conditions. |
| C2D | 95 | No | |
| C3L | 30 | No | |
| C4D | 105 | No | |
| C5Lc | 30 | Yes | |
| C6Dc | 95 | Yes | |
| C7D3d | 95 | No | Only the middle wall section was rotated to simulate three-dimensional conditions. |
| C8L3d | 30 | No |
A total of eight tests were conducted to study the unloading process for soils representing different behaviors: contractive-dilative (dense soil) and contractive (loose soil). Six tests were conducted under plane strain conditions by rotating all wall sections (A, B, and C in Fig. 1) simultaneously: four with uncompacted and two with statically compacted backfill. Two additional tests were conducted on uncompacted samples under three-dimensional conditions by rotating only the center wall section (section B in Fig. 1) to simulate scenarios where a damaged section experiences higher rotations than intact sections, e.g., due to variable corrosion along the wall. Extreme soil densities were chosen to emphasize these behaviors, and findings for medium-density soil can be inferred from these results.
Results and Discussion
Initial Stress State
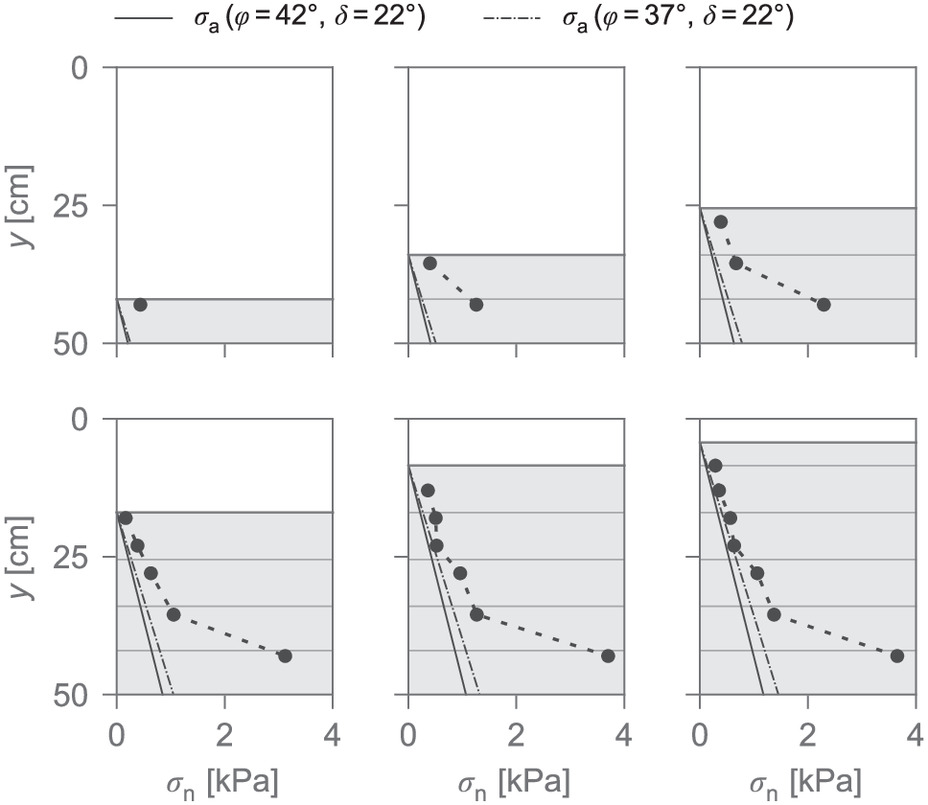
The initial stress state acting on a retaining wall is a perturbed state resulting from the backfilling process. This process is illustrated in Fig. 5, which shows the earth pressure measured on the central wall section in the C3L test after the deposition of each layer. The bilinear stress distribution observed when at least three pressure transducers were covered by soil (i.e., after the third layer was deposited) is caused by wall deflection and interface friction. As the soil shearing increases, induced by the increase in wall deformation due to the deposition of additional layers, the soil mobilizes increasing strength (because of deviatoric hardening) and the measured horizontal stress approaches the active value, plotted in Fig. 5 as for the peak and residual shear strength, where is calculated using the solution developed by Perozzi and Puzrin (2023b) and assuming a linear stress distribution.
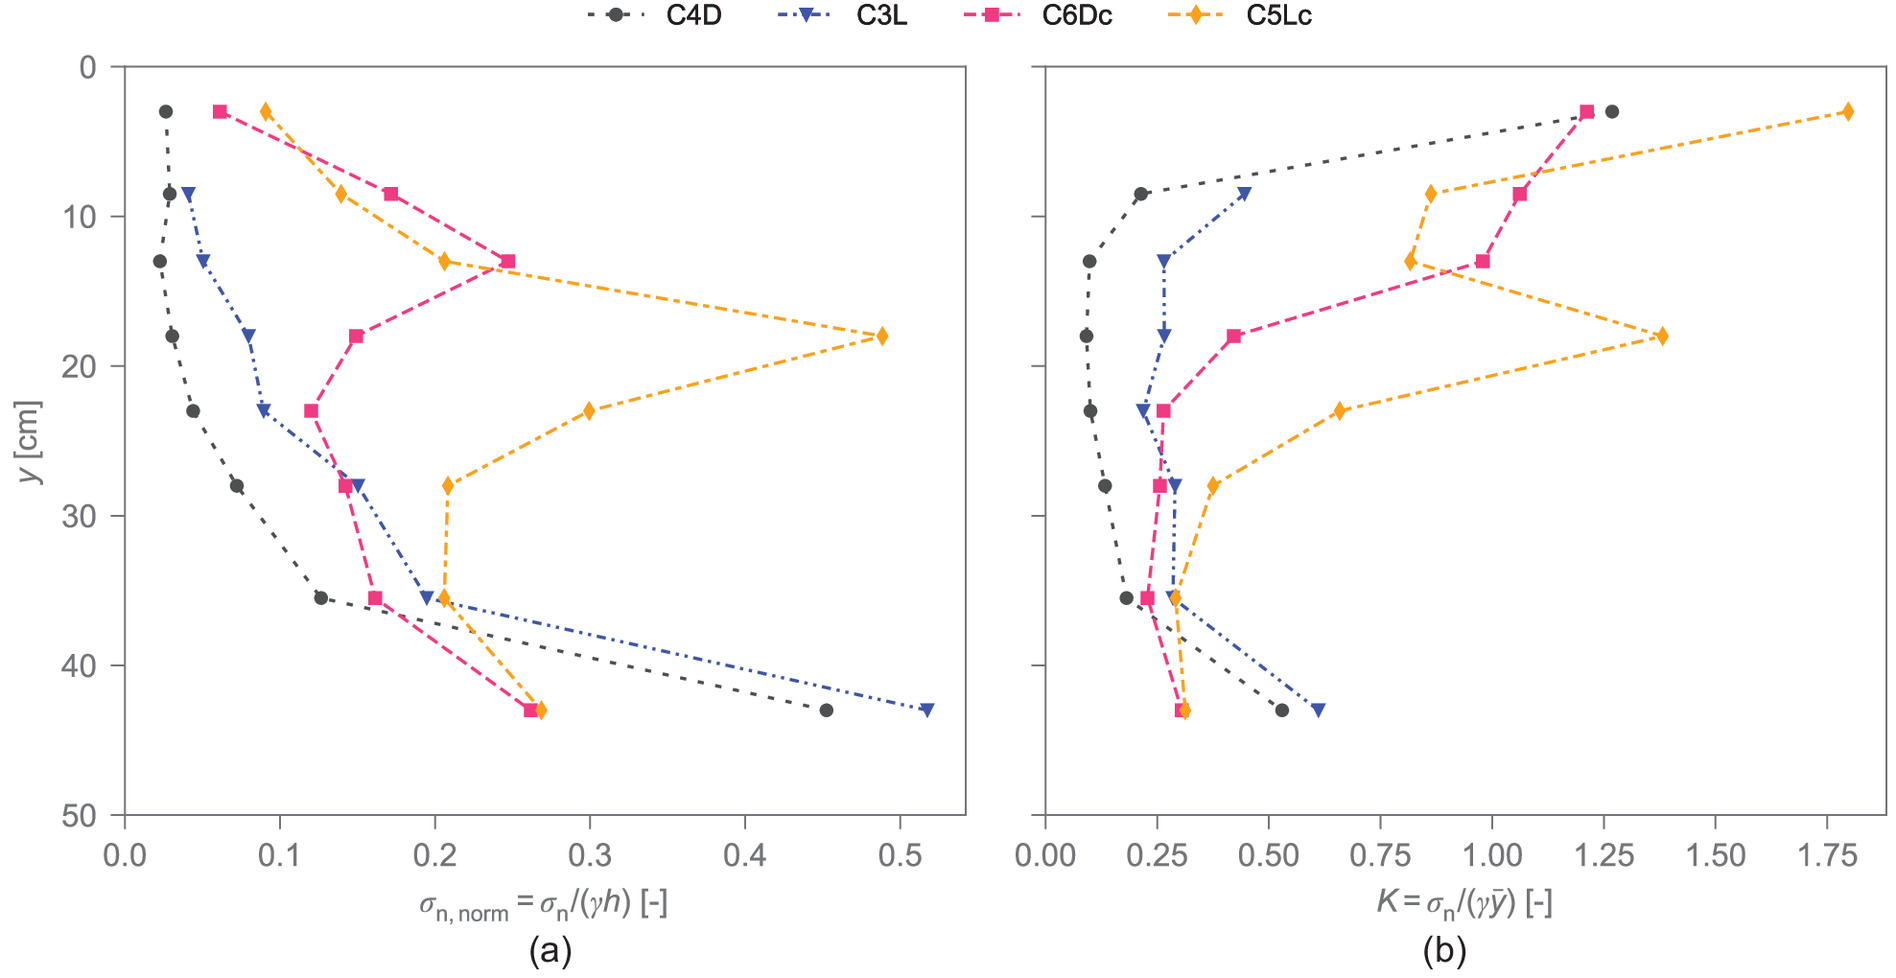
The final earth pressure distributions observed in the C3L (loose backfill) and C4D (dense backfill) tests are shown in Fig. 6. The results of the other two tests carried out with uncompacted backfills, C2D and C1L, were very similar and are not shown here to improve readability; however, they can be found in the Supplemental Materials. The decision to use the C4D test instead of the C2D test to analyze the stress distribution in the soil, even though the latter has a deposition density identical to that of the compacted C6Dc test, was influenced by a sensor malfunction during the C2D test, which initially affected a single sensor but eventually spread to all pressure transducers during the rotation phase, while no other devices were affected. Fig. 6(a) shows the normalized stress, confirming a similar bilinear distribution for both tests. Fig. 6(b) shows the coefficient of earth pressure obtained by dividing the measured stress by the overburden stress. Since dense soil can mobilize a higher strength than loose soil for the same amount of deviatoric plastic strain, the stress acting on the wall backfilled with dense soil is lower.
Compacted backfills were prepared by depositing 8-cm-thick layers in an initially loose (test C5Lc) or dense (test C6Dc) state and applying a static load as previously described. This compaction changed the stress state in a confined backfill region, causing plastic deformations in the soil. As a result, irreversible strains and increased lateral stresses remained after the load was removed, as observed by Broms (1971), Ingold (1979), and Chen and Fang (2008). Certainly, this compaction process alters the soil density, although to a negligible extent, since no vibrating device was used (thus, particle rearrangement is marginal). From a qualitative perspective, dense soil (close to a relative density of 100%) is likely to experience a decrease in density (i.e., dilation) due to compaction-induced shearing, while loose soil experiences an increase in density (i.e., contraction). However, based on visual and tactile assessments, none of the samples showed a significant alteration in density after compaction. Both samples maintained behaviors consistent with the deposited soil density (i.e., contractive for C5Lc and contractive-dilative for C6Dc), allowing investigation of the effects of increased stress on two different soil behaviors.
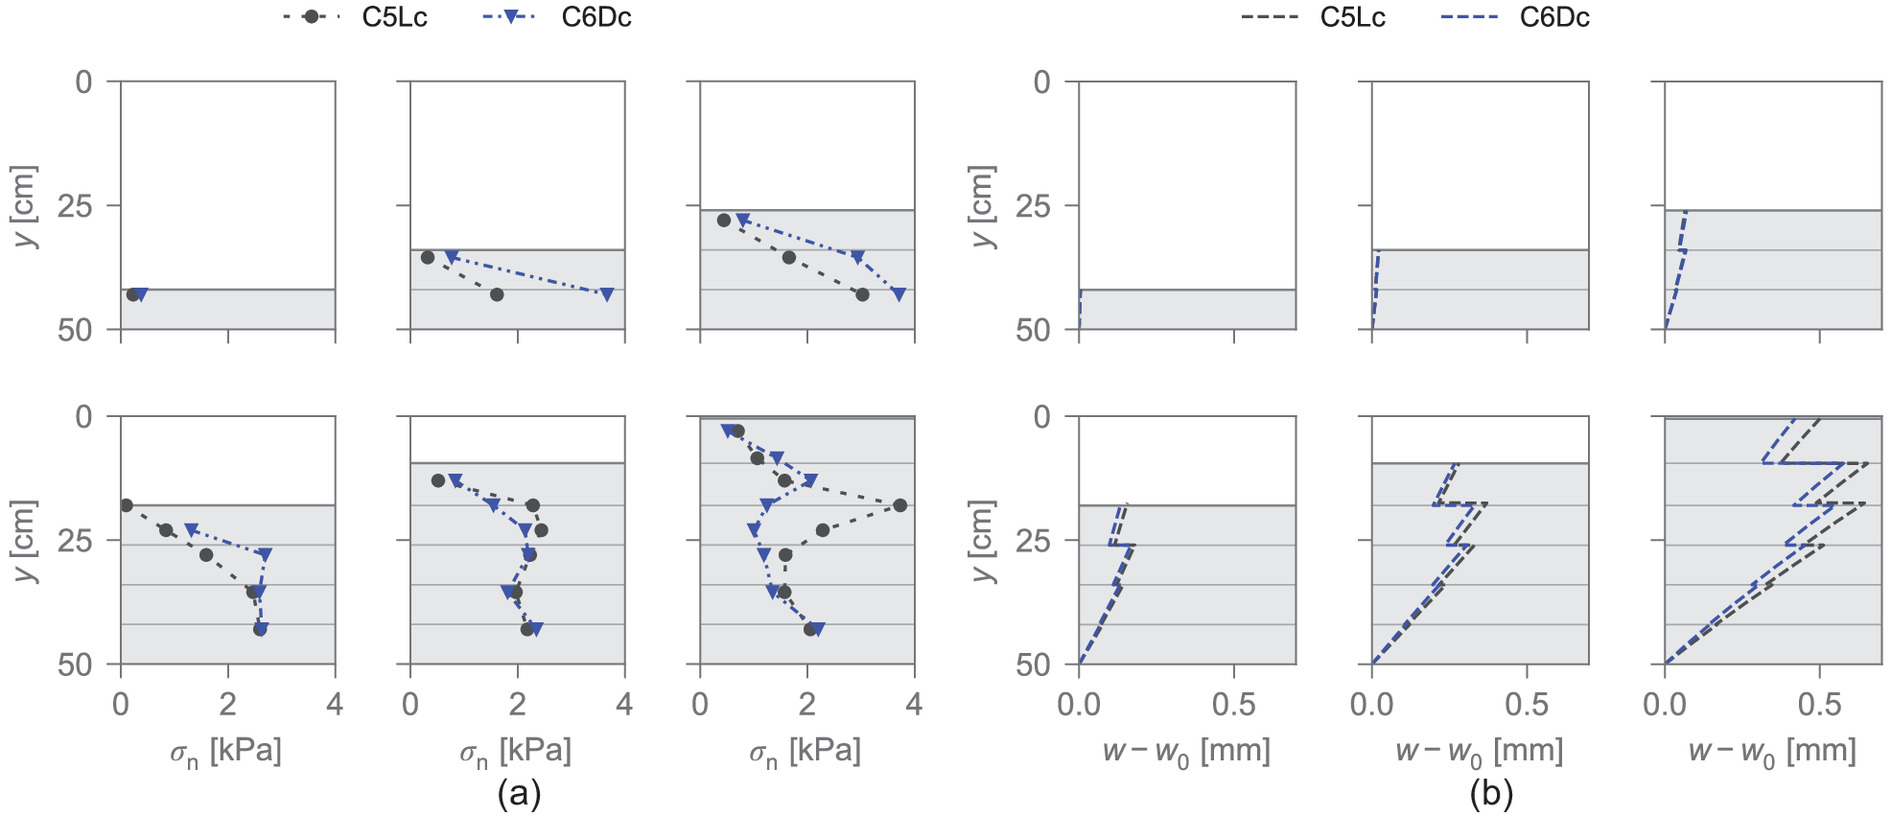
The earth pressure measured after the compaction of each layer in the C5Lc and C6Dc tests is shown in Fig. 7(a). Fig. 7(b) shows the cumulative horizontal displacement, , measured at the wall interface that each layer was subjected to from its deposition to the end of each compaction step. Here, is the wall displacement measured at depth after each compaction step, while is the displacement at the same location that occurred before the soil backfill reached that height. It can be seen that the central region of the backfill is subjected to the greatest cumulative displacement, resulting in a local depression in the measured stress distribution.
During the initial stages, the lateral stress measured in the contractive-dilative soil test (C6Dc) exceeded that of the contractive soil test (C5Lc). As for the uncompacted backfills, this is due to the differing hardening behaviors of the two soil densities. Dense soil mobilizes higher strength at lower deviatoric plastic deformation, leading to higher horizontal stress during compaction. However, when active unloading occurs in the lower backfill due to increased wall deflection, a higher strength results in lower admissible stresses, as observed in step 6 of the backfilling procedure shown in Fig. 7(a).
Fig. 8 illustrates the earth pressure in tests C5Lc and C6Dc, measured immediately after the deposition of a layer (blue), after compaction (black), and after the deposition of the next layer (pink). These plots allow a direct assessment of the influence of compaction and the deposition of a new layer on the soil lateral stress. Initially, both actions increased the lateral stress (although only compaction increased the lateral earth pressure coefficient). Once half-backfill height was reached, depositing additional layers caused a net decrease in stress. This reduction is mainly due to wall displacement, which counters the positive effect of increased overburden stress on lateral stress. On the other hand, compacting new layers increased stress, but only to the effective depth of compaction. Further, it is observed that the compaction-induced stress in dense soil decreased after a certain backfill level was reached. In the initial phases, the maximum stress increase was about 2 kPa, reducing to around 1.2 kPa in the final steps. The trend reversed in loose soil, with the maximum stress increase initially at about 0.8 kPa and rising to 1.6 kPa in the final steps. Due to the different behaviors of the soil and the wall deflection, the effective compaction depth varied between dense and loose soil: approximately 15 cm in dense soil and 20 cm in loose soil.
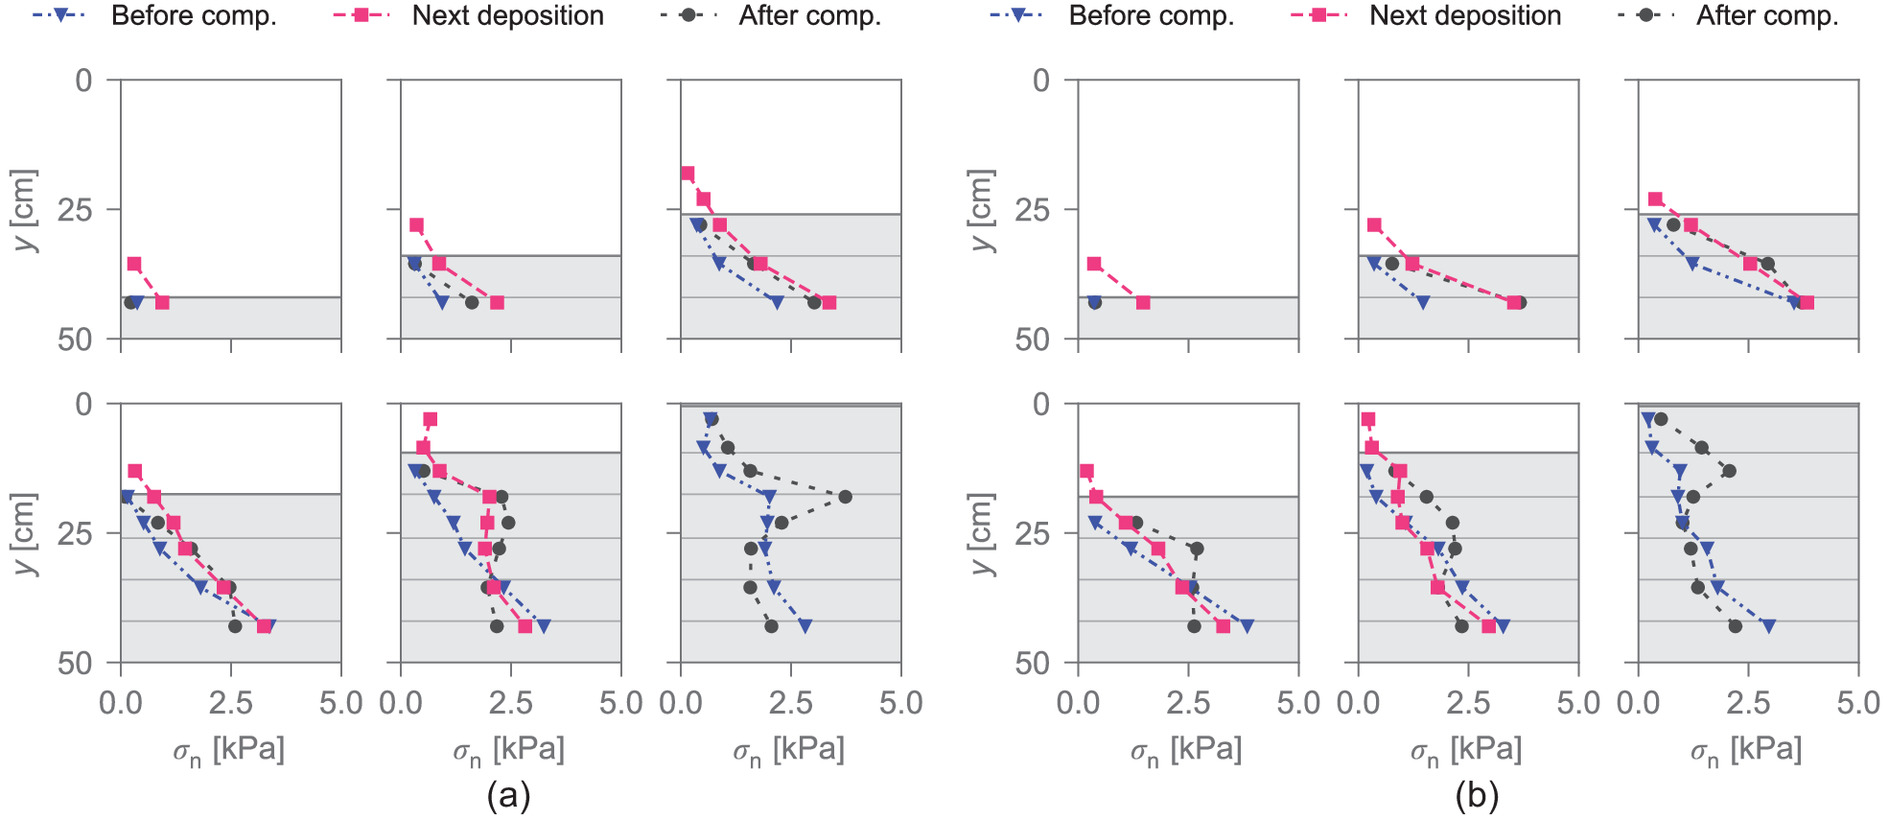
Fig. 6 shows a comparison of the earth pressure measured in compacted and uncompacted backfill, confirming the general observation that backfill consisting of identical soil but less densely packed exerts greater stress on retaining structures, with all other variables held constant. Compaction not only increases the resultant earth pressure but also causes this pressure to act higher up on the wall and thus have a dual increasing effect on the bending moment at the base.
While the initial stress state on a retaining wall is often estimated by the earth pressure at rest or by semiempirical solutions that neglect wall deformation and friction, such as Broms (1971), in reality it depends on several factors, the most important of which are the backfill method, the soil behavior, the soil-wall interface friction, and the wall stiffness. Nevertheless, it can usually be assumed that these solutions would lead to a conservative overestimation of the forces acting on the wall after construction (or during its service life).
In the presented tests, a rigid wall base was assumed. In reality, cantilever retaining walls are often built on compliant soil foundations. In that case, the wall would undergo rigid body rotations during the wall backfilling, usually leading to a further unloading. Finally, it is worth mentioning that while the wall stiffness influences the amount of wall displacement leading to a wall unloading, experimental work by Chen and Fang (2008) and Perozzi (2022) showed that even very stiff walls experienced unloading as the backfilling process progressed, resulting in stress bilinear distributions similar to those observed in this study, although characterized by higher stress values, due to the friction mobilized at the soil-wall interface.
Unloading Process under Plane Strain Conditions
After completion of the backfill, the unloading process of the wall was investigated by imposing a rotation of all three wall sections simultaneously. While the earth pressure acting on the outer sections is partially influenced by boundary effects (details provided in the Supplemental Materials), the central wall section (section B) can be assumed to operate under plane strain conditions. For this reason, only the earth pressure acting on the central section is shown and discussed in this section.
The evolution of the normalized moment, , as a function of the imposed wall rotation is plotted in Fig. 9(a). The normalization factor, , was chosen to be consistent with that in Perozzi and Puzrin (2023b) to allow for easier comparison with the active earth pressure coefficient familiar to most readers. In this section, the curve for test C2D has been included for better comparison with test C6Dc. Consistent with the earth pressure measurements, the wall had to resist a higher moment when backfilled with loose soil than with dense soil. When the backfill was compacted, the initial moment was approximately twice that of the tests carried out without compaction at the same relative density due to the increased pressure and the higher location of the resultant force on the wall. Due to the initial moment and the finite stiffness of the wall, an initial rotation (in the range of 0.5–1.4 mrad) was measured at the end of the backfilling phase.
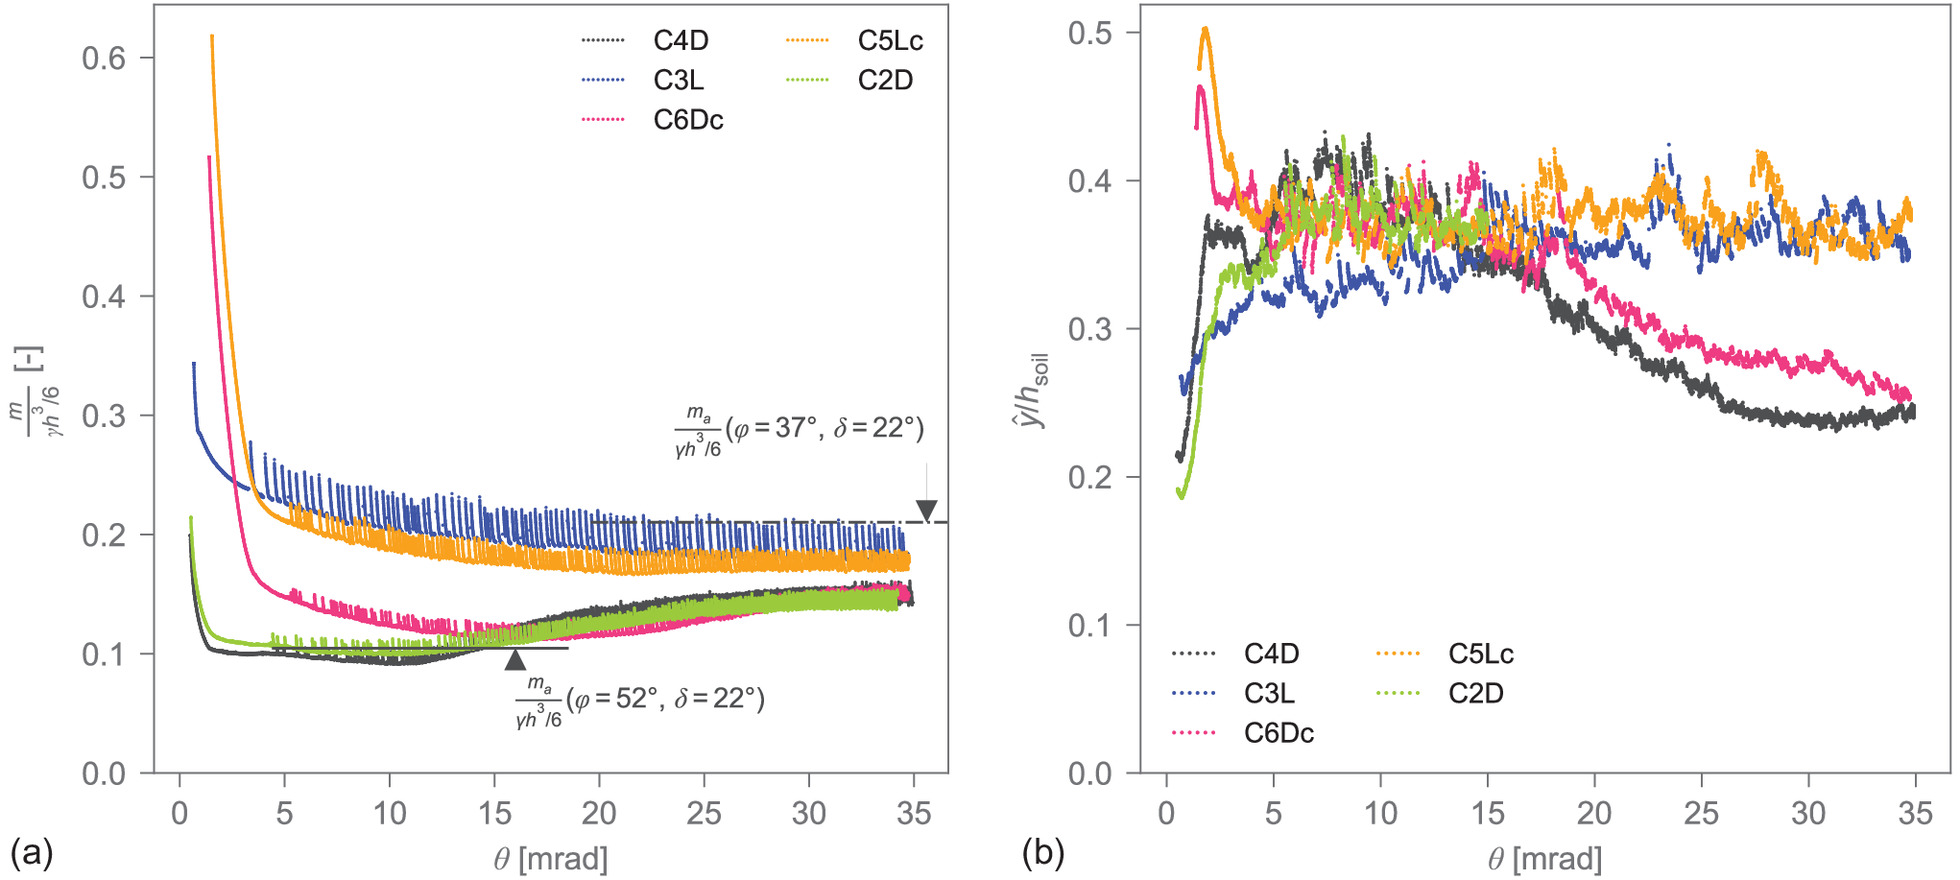
The wall rotation resulted in elastoplastic unloading of the soil, which ultimately caused active failure. The lower envelopes of the moment-rotation curves, excluding sudden increases, represent the typical loose and dense soil behavior: The moment acting on the wall decreased steadily when backfilled with loose soil, while a rapid unloading followed by a softening-induced increase was observed on the walls backfilled with dense soil. The sudden increases followed by slower decreases observed in all samples represent stick-slip events, which are discussed in a later section.
Fig. 9(b) shows how the location of the earth pressure resulted in changes with increasing wall rotation. This plot is better complemented by Fig. 10, which shows the earth pressure distribution for different tests at different stages of the rotation phase. In loose backfills, the earth pressure distribution transitioned from a nonlinear to an approximately linear distribution. Due to the gradual mobilization of strength in the loose soil, the transition was relatively slow. It required a rotation of approximately 20 mrad for test C3L and 30 mrad for test C5Lc. Once this degree of rotation was achieved, the position of the stress resultant and normalized moment remained relatively stable, indicating a condition close to the ultimate state. However, a slight, almost linear decrease in the moment was observed until the end of the rotation. This decrease can indicate second-order effects, such as the lowering of the stress resultant due to the continued deformation of the failed soil block, or that the soil strain induced by the wall rotation was insufficient to fully mobilize the residual soil strength. This could also explain the absence of softening in the test despite its observation in the biaxial test [as shown in Fig. 3(a)]. In any case, it is safe to say that the stress state reached at the end of the test is very close to the ultimate stress state. Therefore, the normalized ultimate moment acting on the wall backfilled with loose soil is approximately 0.18.
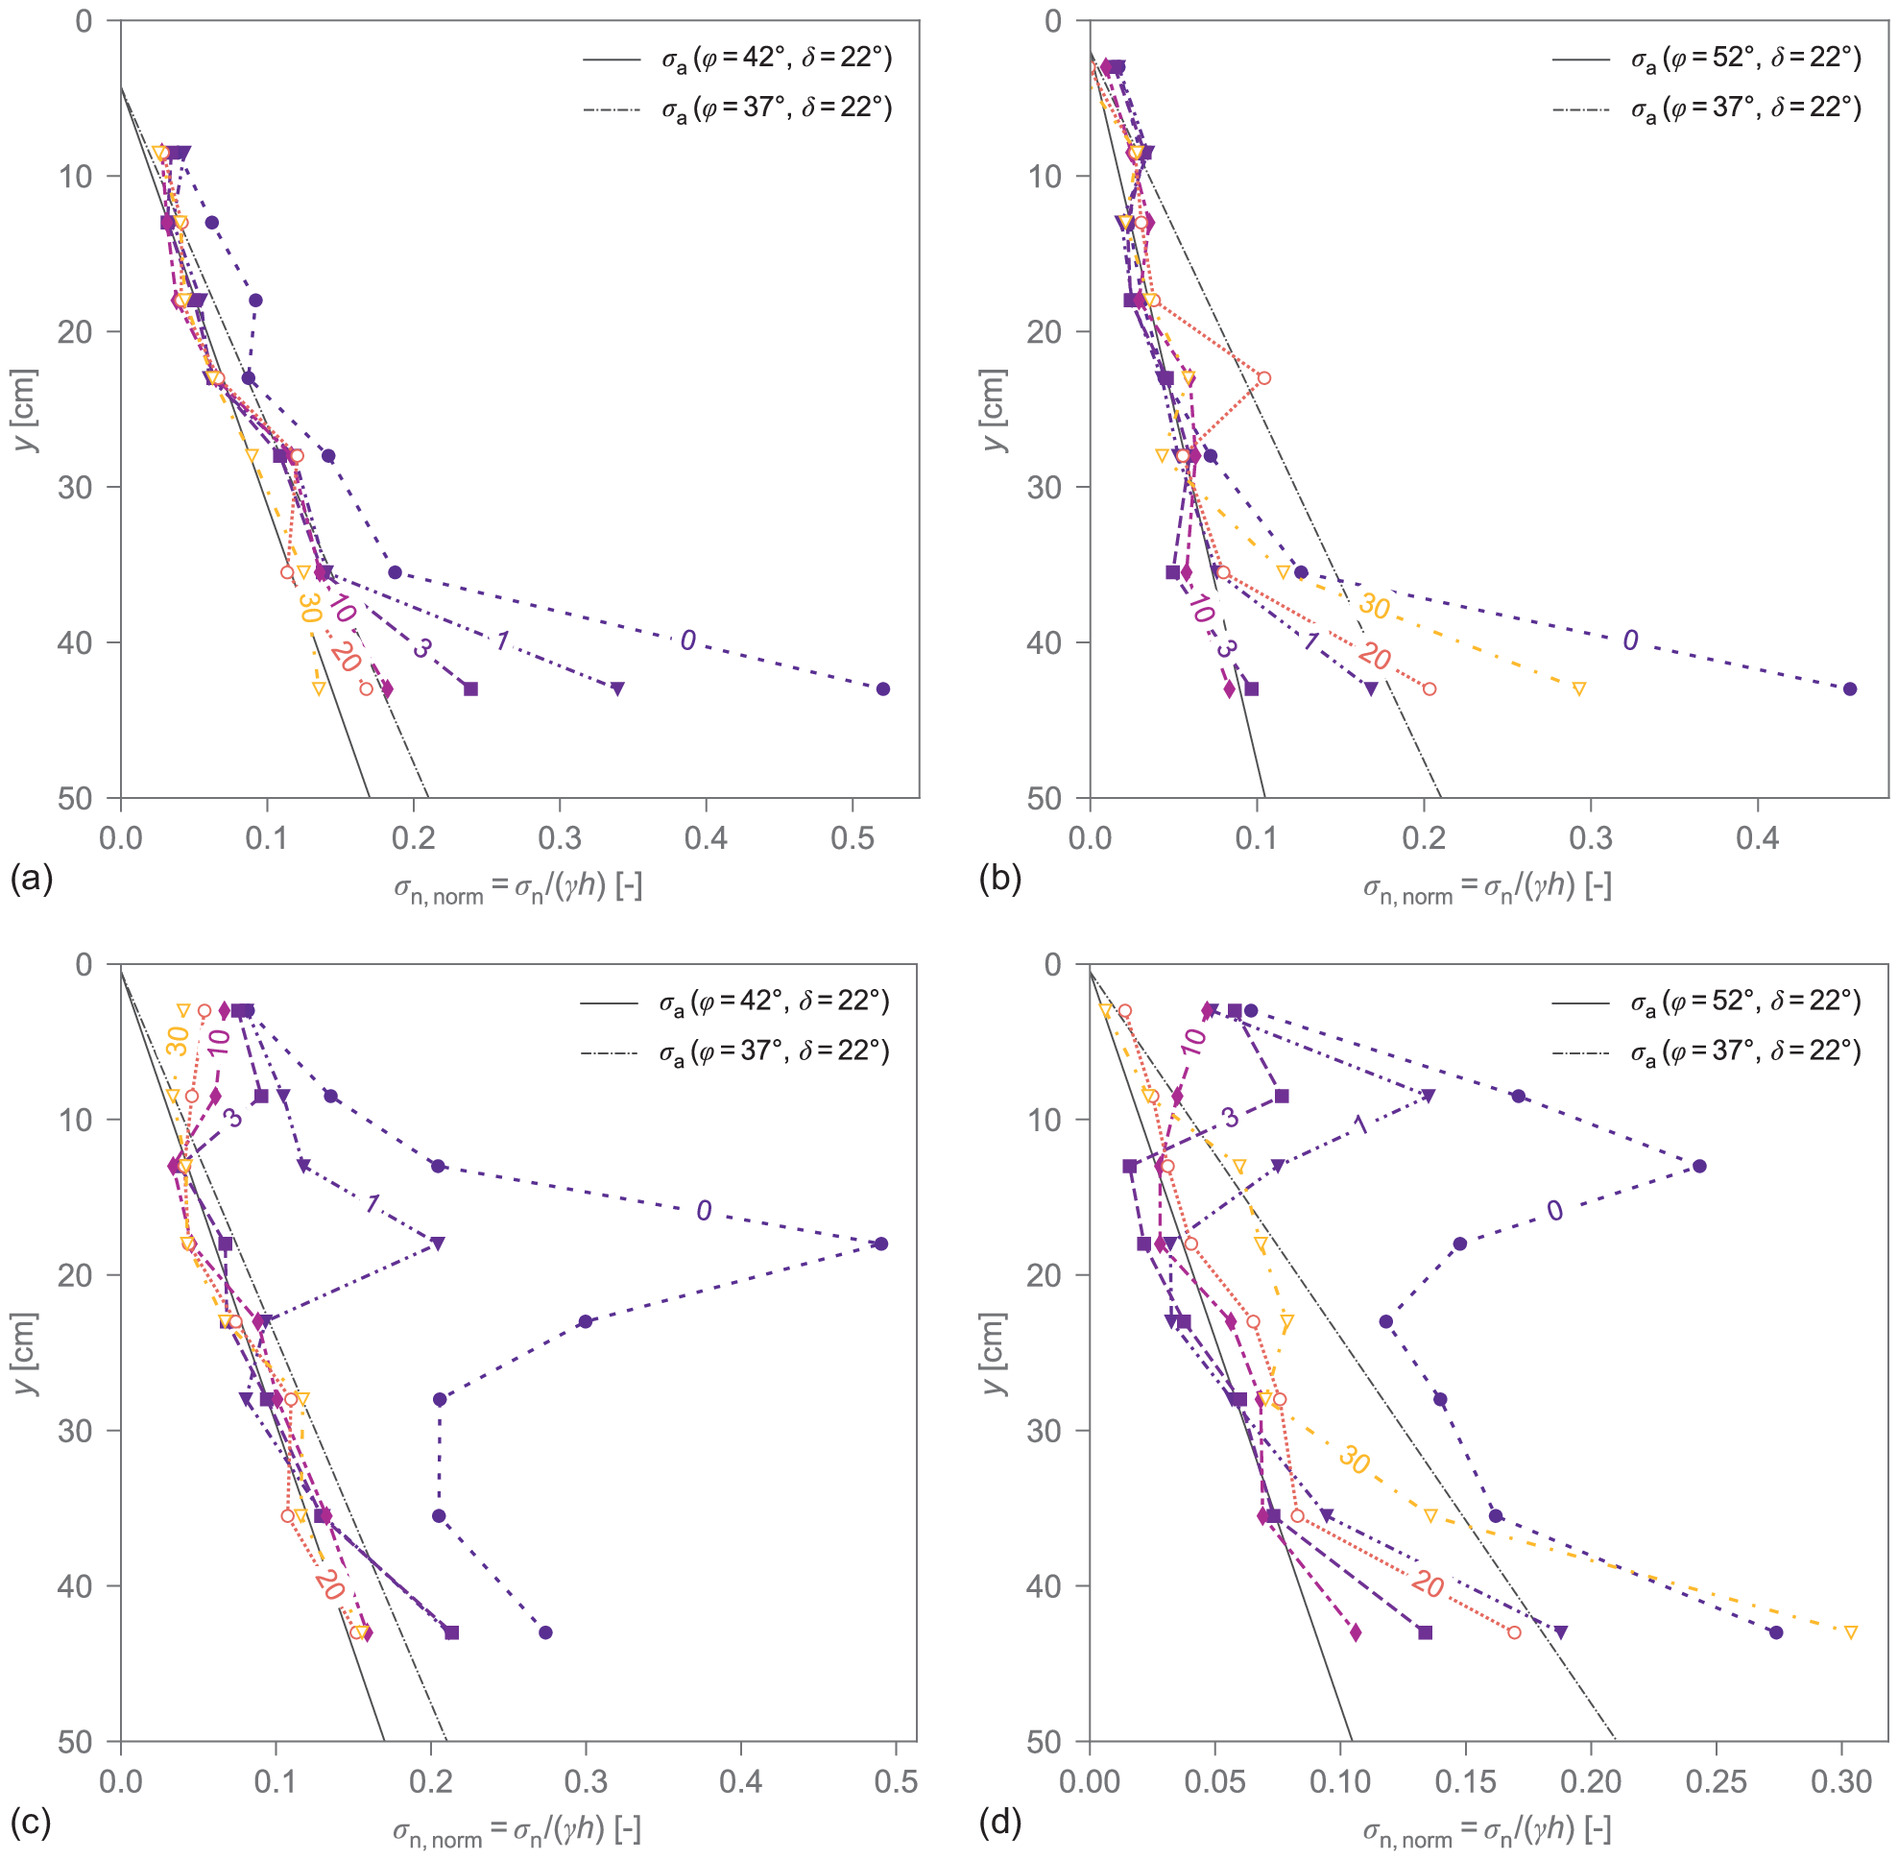
Conversely, in dense backfill, the distribution changed from nonlinear to approximately linear and then to bilinear. An approximately linear distribution was observed when yielding occurred over the entire backfill height, and the maximum shear strength was mobilized nearly over the same height. This was the case for test C4D at a rotation of about 3 mrad, when the normalized moment reached a value of 0.10. On the contrary, the same situation never occurred in test C6Dc, because when the pressure in the upper part of the wall was still decreasing, the increase in the lower part had already begun, indicating the onset of deviatoric softening after the peak strength was reached. For this reason, the acting moment reached a higher minimum value in test C6Dc than in tests C2D and C4D. For all dense specimens, the softening mainly affected the pressure in the lower part of the wall. The normalized ultimate moment for dense backfills appears to be lower than for loose backfills, with an observed value of approximately 0.15. While it may be possible to observe a further increase in moment with additional wall rotation, judging from the constant values measured in the final part of the rotation phase in Fig. 9, this seems unlikely. Instead, the difference in ultimate load between tests carried out with dense and loose backfill is much more likely to be explained by the different stress distribution caused by softening. In fact, it is well known that softening causes the soil deformation to localize in shear bands, affecting the ultimate load (Bigoni and Hueckel 1991; Clausen and Krabbenhoft 2008).
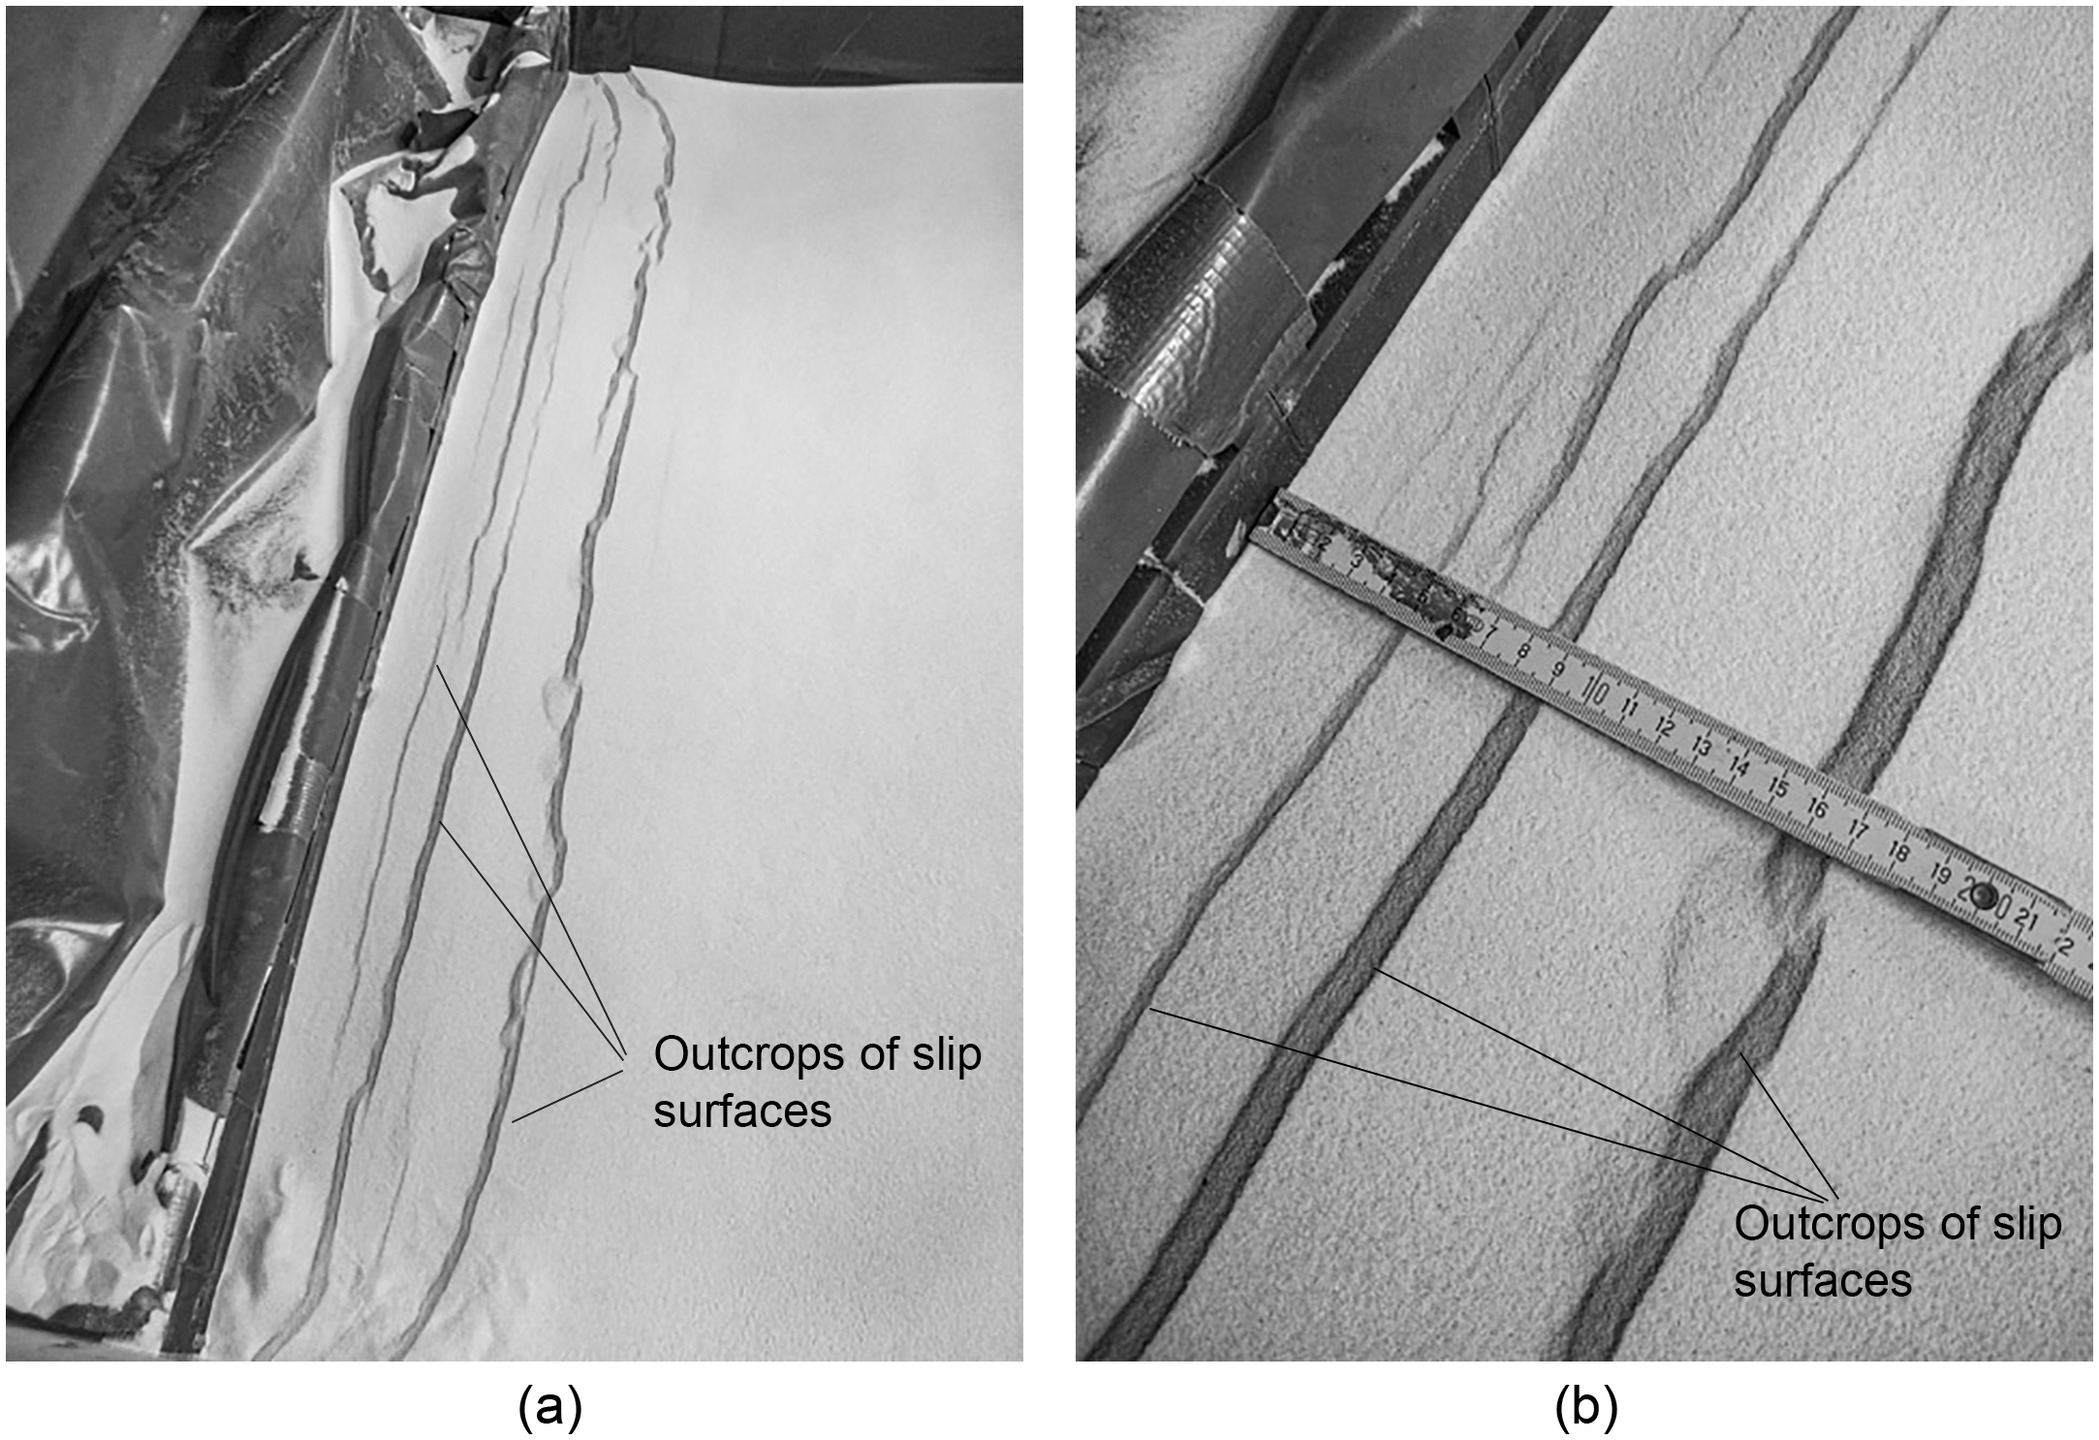
Two photographs of the backfill surface at the end of the C2D test are shown in Fig. 11. Plastic soil deformation in the densely packed soil is highly localized due to softening, resulting in pronounced slip surfaces. Fig. 11(a) shows the entire width of the model with these surfaces curving at the extremities due to boundary effects. This figure shows that the frictional boundaries (i.e., the glass walls) affect the soil deformation only within the outer 15 cm of the model and do not affect the results beyond this area. Fig. 11(b) shows a close-up view behind the center wall section, where the region that experienced the most significant plastic deformation is approximately 17–18 cm. In an active earth pressure problem, a straight line can adequately approximate the soil failure mechanism (see the Supplemental Materials). In this case, that line has an approximate inclination of (the backfill in test C2D reached a height of 48 cm). According to Coulomb’s theory, this would correspond to a soil friction angle of 51°, confirming the peak value obtained from the biaxial test. However, this conclusion should be taken with caution, as it was shown that the slope of the fracture plane is correlated with the dilatancy angle, not the friction angle (Roscoe 1970).
The analytical ultimate limit-state solution based on Perozzi and Puzrin (2023b) is additionally shown in Fig. 9(a). It is observed that this solution can be employed to obtain a safe estimate of the moment acting on the wall in the ultimate state. In general, this solution seems to overestimate the true value of the ultimate load, mainly because of the implicit assumption of limit analysis of an undeformed geometry. The overestimation is relatively high for dense backfill because the assumption of perfect plasticity leads to a constant strength throughout the backfill, which is not the case for dense soil (due to deviatoric softening). However, since softening leads to strain localization, which in turn leads to nonuniqueness of the ultimate load (Rice 1976; Bigoni and Hueckel 1991), the engineer in practice often has no choice but to determine the ultimate load assuming that the residual strength is mobilized everywhere. If the minimum value of the moment is of interest, an estimate can be obtained using the solution of Perozzi and Puzrin (2023b), assuming the maximum value of the friction angle, as in Fig. 9(a). In this case, it should be noted that it is not guaranteed that the maximum strength will be mobilized simultaneously throughout the backfill (e.g., this did not happen in test C6Dc). For the safety assessment of retaining walls, it is also important to note that while walls backfilled with dense soil require a significant rotation to reach the ultimate state, they only require a rotation of approximately 2–3 mrad to be unloaded to a moment which is lower than that in the ultimate state.
Stick-Slip Behavior
The stick-slip phenomenon is a well-documented behavior observed in a variety of solid materials, including granular materials and rock (Adjemian and Evesque 2004; Doanh et al. 2013; Ozbay and Cabalar 2016; Scholz 2019), which arises due to the dynamic transition between static and kinetic friction, resulting in an oscillatory or periodic motion at the frictional interface. The main causes often attributed to this phenomenon in granular materials include instability in the granular structure, such as force chain collapse (Roussel 2005; Doanh et al. 2013) and contact aging (Doanh et al. 2013).
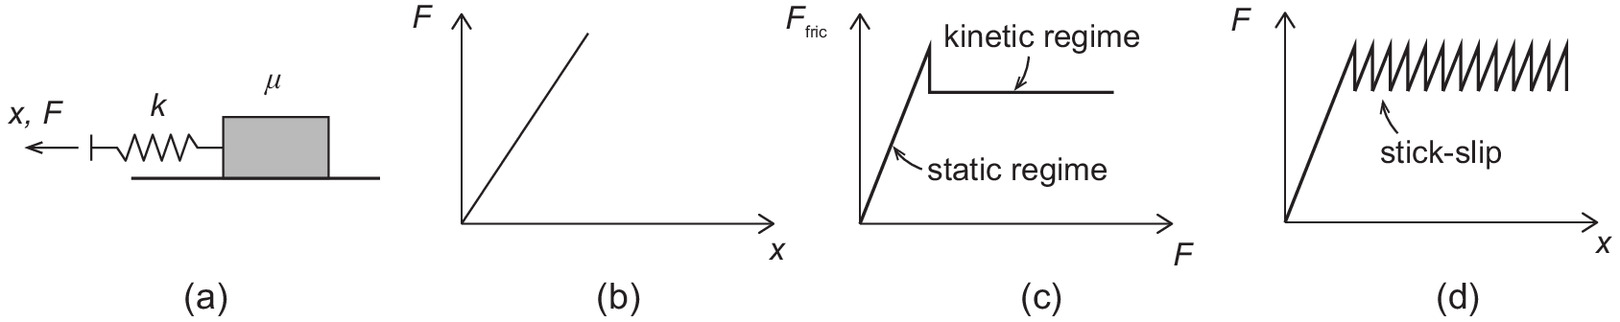
Conceptually, stick-slip behavior can be modeled as a spring-slider system [Fig. 12(a)]. The spring exhibits linear behavior [Fig. 12(b)], and the slider experiences higher static than kinetic friction. When a constant rate of displacement, , is applied to the spring, the internal force of the spring increases and is transferred to the slider. The slider remains stationary until the maximum static friction force is mobilized. At this point, the slider enters the kinetic regime, or slip phase [Fig. 12(c)], moving and subsequently reducing its friction coefficient. This motion accelerates the slider, resulting in a reduction in the spring’s elongation and internal force. When the internal force drops below the kinetic friction, the system returns to the static state, or stick phase. During the stick phase, the spring’s internal force gradually increases until it mobilizes static friction again, initiating another slip phase. This cyclic pattern continues indefinitely as displacement increases, resulting in the oscillatory system response shown in Fig. 12(d).
In this study, slip events caused a decrease in soil strength, resulting in sudden spikes in the moment acting on the wall. These spikes were more pronounced on walls backfilled with loose soil than with dense soil. During the stick phase, the strength gradually recovered. Dense soil initially showed no slip events because the collapse of the force chains was prevented by the dense granular packing. As the soil began to dilate, slip events occurred.
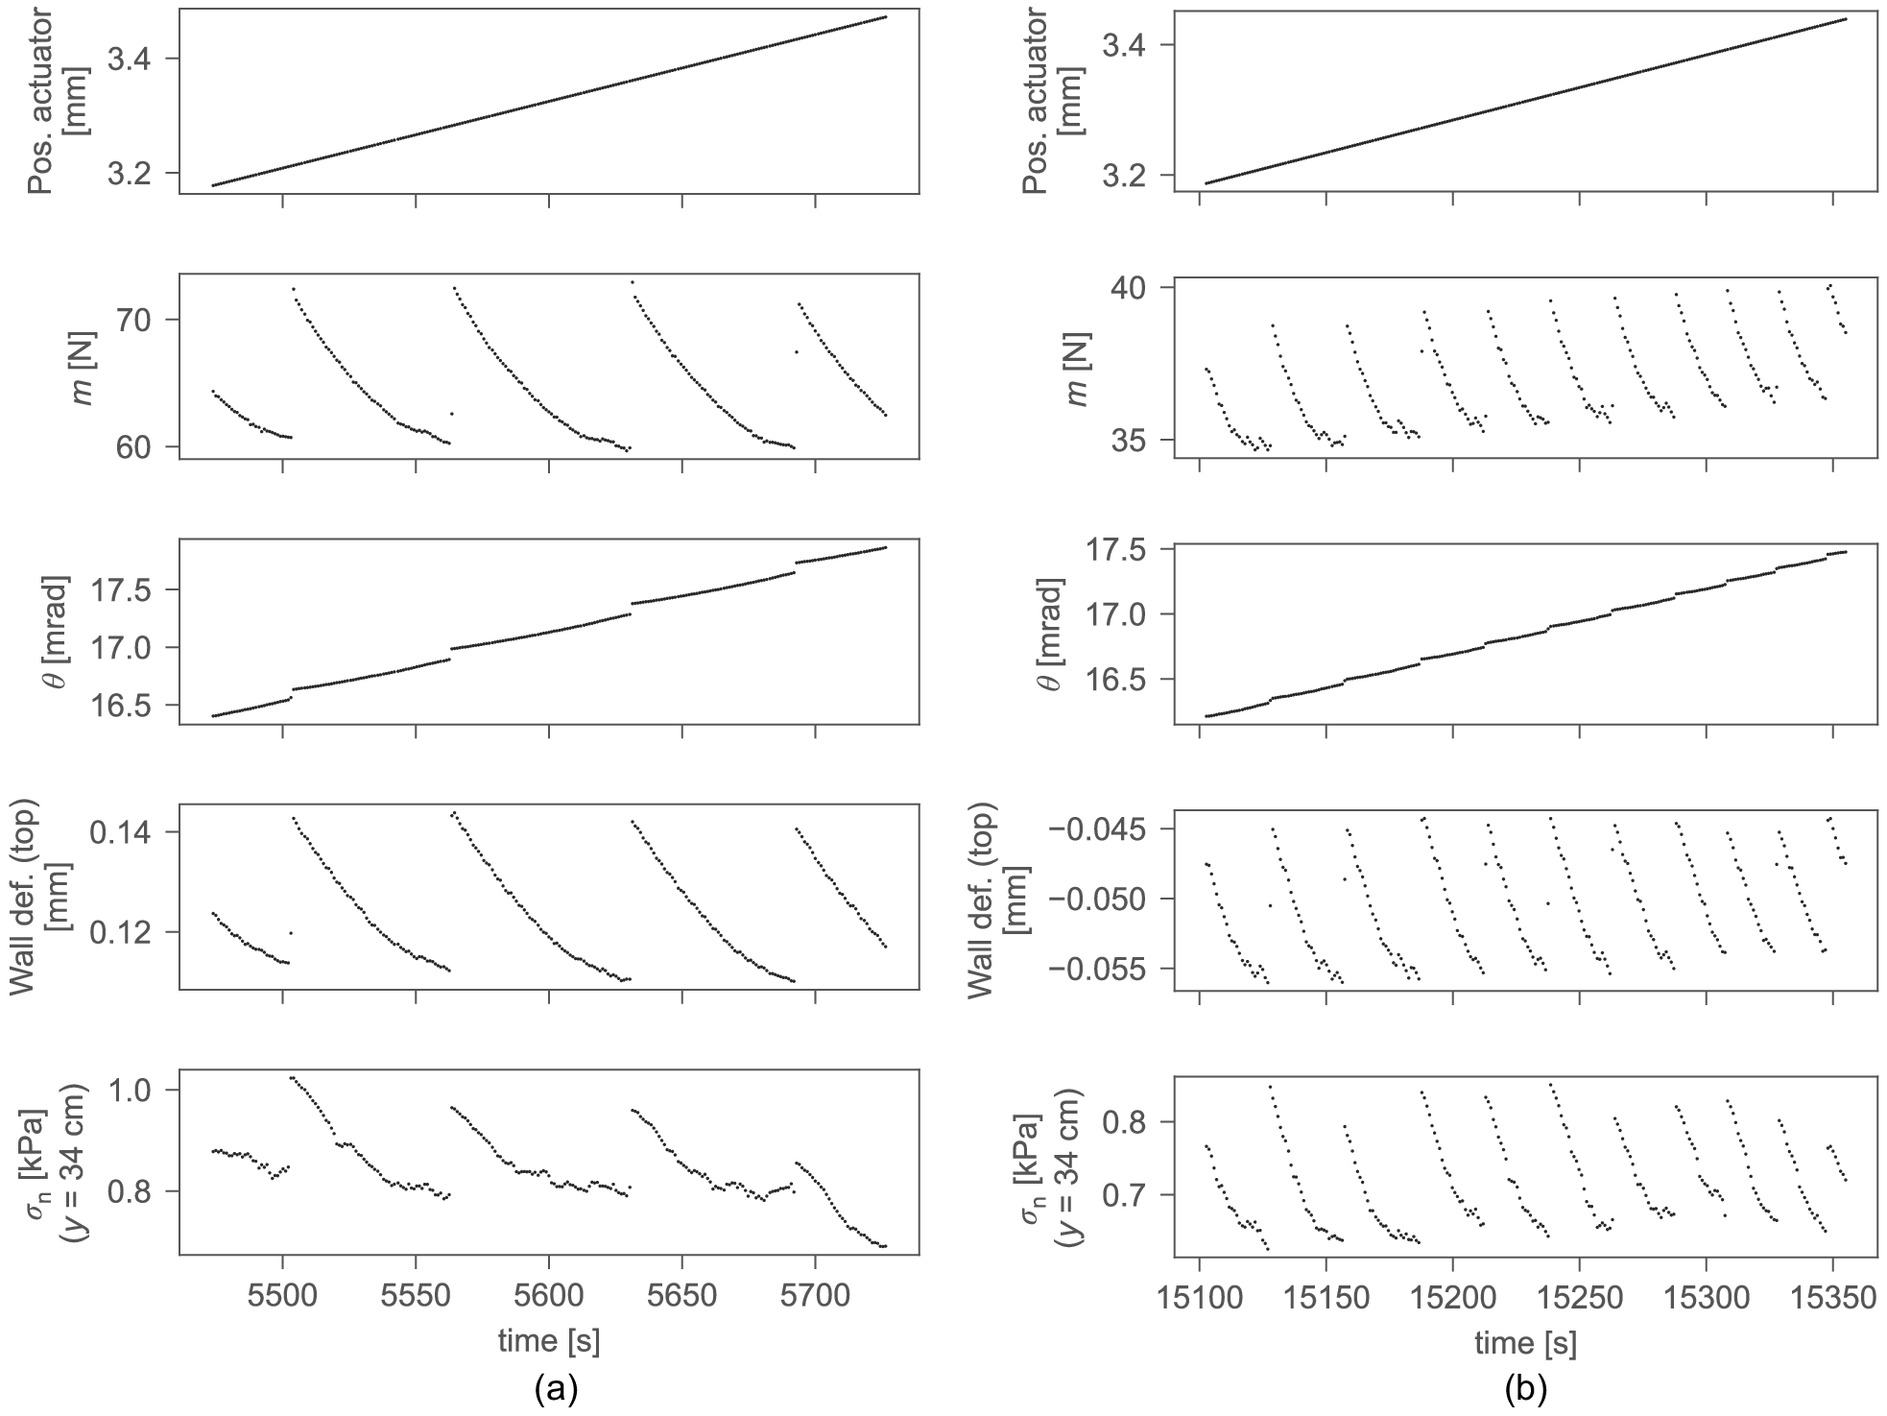
Fig. 13 shows the stick-slip events observed in the C1L and C4D tests when the wall rotation was approximately 17 mrad for both tests. The position of the linear actuator confirms that the wall rotation was applied at a constant rate, ensuring that jumps in other measurements were not due to test setup or operator error. The moment and stress measurements showed spikes at regular intervals, followed by a slower decline. Moment spikes of approximately 20% were measured for the wall backfilled with loose soil and approximately 11% for the wall backfilled with dense soil. The increase in the pressure acting on the wall is confirmed by stress measurements, wall deflection, and rotation (which is measured at the axis and therefore also depends on the earth pressure acting on the wall due to the finite stiffness of the wall construction). Jumps in wall deflection and rotation are attributed to the increased earth pressure on the flexible wall. The frequency of slip events is relatively high, with three events occurring in the loose specimen and nine in the dense specimen over a rotational increase of approximately 1 mrad. The higher frequency of slip events in the dense specimen can be explained by the denser granular structure (compared to that of the loose samples), resulting in a stiffer macroscopic response. It can be seen from Fig. 12 how a higher stiffness would lead to more frequent slip events for the same displacement, .
Due to their frequent occurrence, the resulting moment spikes can be ignored for practical safety assessment purposes since the wall can always find an equilibrium state along the lower envelope of the curve. Also, stick-slip may be less pronounced in a well-graded material. Finally, preliminary tests showed that the amplitude of the slip events decreased with an increased rotational wall velocity.
Unloading Process of a Nonhomogeneously Damaged Wall (Three-Dimensional Earth Pressure)
Tests C7D3d and C8L3d were prepared using the same backfill deposition procedure as in the plane strain tests (without compaction). Due to the tests’ reliability and repeatability, nearly identical initial earth pressure distributions were achieved. The resulting moment acting on the central section and for dense and loose sand samples are plotted in Fig. 14(a). The observed soil behavior compares well with previous test results.
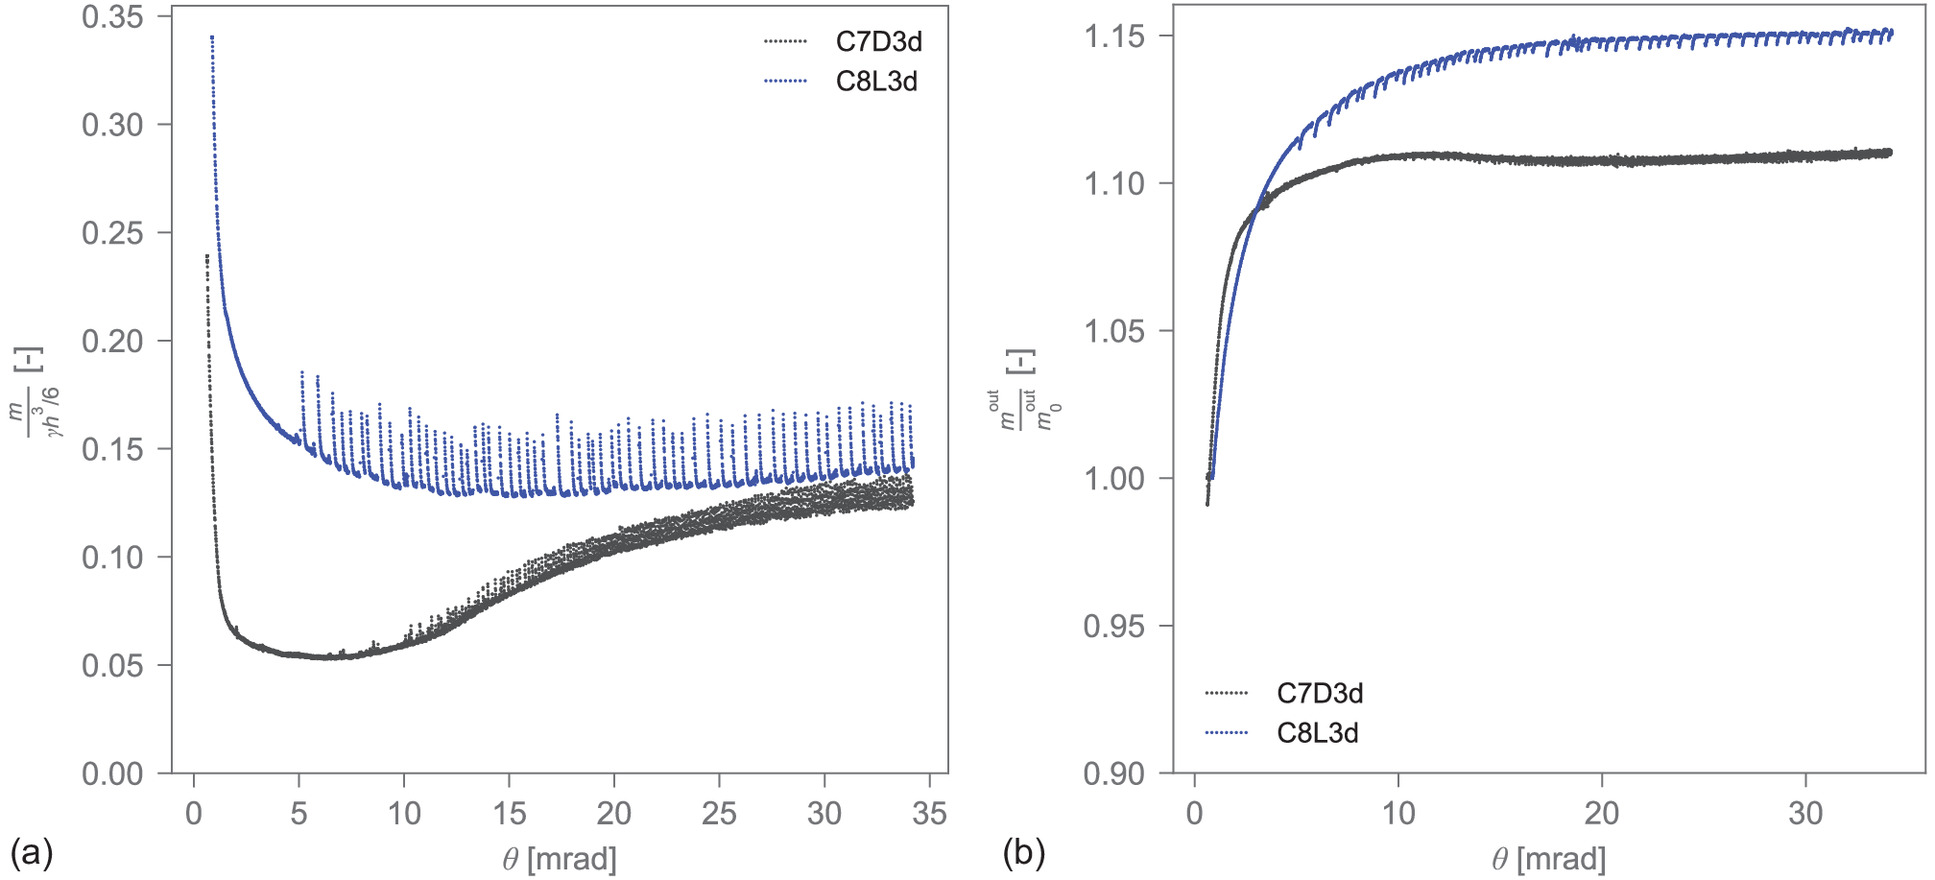
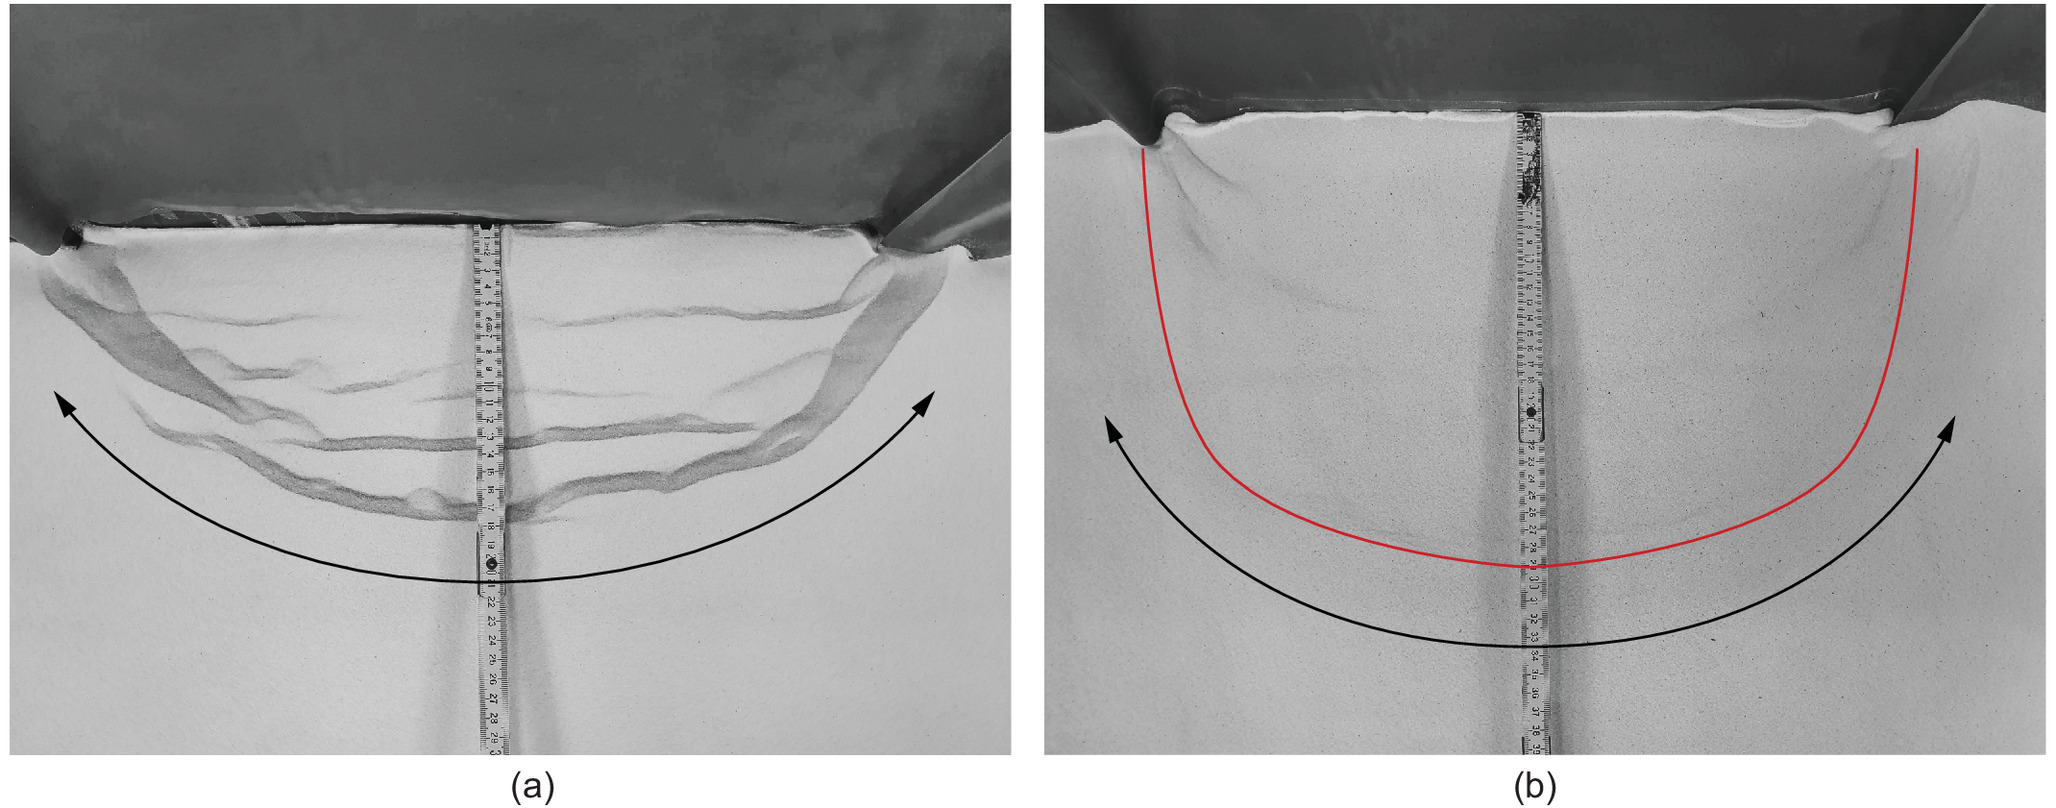
The normalized moment on the central wall section showed a minimum of approximately 0.05 in the dense sample before increasing due to softening. At the end of the rotation phase, the normalized moment on the wall backfilled with loose soil was 0.14, while on the wall backfilled with dense soil it was 0.12. These values are lower than those measured under plane strain conditions due to the development of a three-dimensional, curved failure mechanism in the horizontal plane (a direct comparison can be seen in the Supplemental Materials). A top view of the curved failure mechanism is shown in Fig. 15 for the dense and loose samples. Test C7D3d (using dense soil) exhibited highly localized deformations, similar to the C2D, C4D, and C6Dc tests. In test C8L3d, the loose backfill also showed slightly localized deformations, with a failure mechanism evident. The loose sample’s failure mechanism was larger in extent than the dense sample’s. A stress redistribution to the stiffer adjacent walls occurs in a three-dimensional failure mechanism due to arching (schematically illustrated by black arrows in Fig. 15), resulting in a lower ultimate load on the failing wall section and a higher load on the adjacent ones.
A careful comparison (see the Supplemental Materials) of the moment-rotation curves obtained from the plane strain and three-dimensional tests shows that the initial unloading was steeper in the three-dimensional case, and a smaller rotation was required for the dense backfill to begin softening. Also, a slight increase in moment was observed in the wall backfilled with loose soil. These observations are likely due to the more localized nature of the three-dimensional failure mechanism, which leads to increased strain localization.
The moment increase on the adjacent walls is shown in Fig. 14(b) as the ratio between the actual moment, , at a given wall rotation, , and the initial moment, , measured at the onset of the rotation phase (where is the rotation that occurred during backfill). The adjacent sections had to support an 11% increase in moment for dense specimens and 15% for loose specimens. Boundary effects are assumed to minimally affect these results because the outer walls were not moved (i.e., close to the model boundaries, there was no relative displacement between the soil and the glass walls), and the width of the fictitious arches responsible for stress redistribution is narrower than the outer wall sections, as was observed by tom Wörden (2010). The smaller increase observed for the wall backfilled with dense sand is due to the lower curvature of the failure mechanism, which results in a reduced stress redistribution capacity. Furthermore, it is observed that softening did not affect the moment increase on the outer sections since it is a localized phenomenon that only affects the soil inside the failure mechanism, where significant plastic strains occur. On the other hand, the results in Fig. 14(b) show that stick-slip also affects the moment that acts on the outer wall sections, although only minimally, as arching causes stress redistribution in the form of force chains that can collapse, causing slip events.
Summary and Conclusions
This study investigated the distribution of earth pressure acting on cantilever retaining walls right after their construction and the unloading process when rotation about the base occurs, a critical load-deformation mode specifically relevant to cantilever retaining walls [as shown by Haefliger and Kaufmann (2023a)]. A comprehensive experimental study, performed under controlled conditions in a scaled setup, was carried out to study the influence of controlling factors such as the soil packing density and the initial stress state to provide valuable insights for improving the safety assessment of retaining structures. The results of these tests led to the following observations and conclusions:
•
The wall unloading behavior revealed the stick-slip behavior typical of granular materials, causing sudden peaks in moment. The frequency of these events is higher in dense soil than in loose soil, while the amplitude of the moment jumps is higher in loose soil. Due to their frequent occurrence, stick-slip events can be ignored for practical safety assessment purposes, since the wall can always find an equilibrium state along the lower envelope of the curve.
•
In the case of local damage affecting only one section of a retaining wall, a reduced earth pressure acts on the damaged section in the ultimate state. This is possible because of a 3D stress redistribution in the backfill (caused by soil arching), which increases the load on the adjacent wall sections, provided they can support the increased load.
•
The initial earth pressure acting on a wall results from a perturbed stress state in the backfill due to wall deflection and wall interface friction. Its distribution is bilinear if the backfill is deposited without compaction and nonlinear (with a peak near the surface) if it is compacted. Loosely deposited soil exerts higher pressures on the walls than densely deposited soil due to the different hardening behavior.
•
The wall unloading process showed the typical behavior of loose and dense backfills. Dense backfills unload rapidly, reaching a plateau before softening, while loose backfills exhibit a slower, monotonic unloading process. At large rotations, the earth pressure distribution is almost linear in loose soil and bilinear in dense soil. The bilinear distribution is caused by the softening behavior of soil, which leads to the localization of soil deformation.
•
Loose wall backfills are more critical to the safety of corroded walls than dense backfills because of the higher initial earth pressure exerted on the walls and the significant wall displacement required to reach the residual active state. For the same reasons, walls backfilled with highly compacted soil are also more critical than those backfilled with uncompacted soil.
•
The measured earth pressures were lower than expected, indicating high strength. It is commonly believed that soil strength changes with stress levels. However, studies by Tatsuoka et al. (1986) and Perozzi (2022) have challenged this notion, showing insignificant pressure dependence of strength, but increased strength under biaxial conditions. These results were obtained on two different types of poorly graded sand and a stress range between 2 kPa and 250 kPa.
This study focused on wall unloading due to continuous rotation and did not consider the potential effects of reloading from external sources such as traffic loads or soil relaxation. While the consideration of external loads is feasible within a numerical model validated by the results of this study, additional research is needed to understand the effects of soil relaxation. The results were derived from a scaled experimental setup. Research by Perozzi (2022) indicated no scale effects on the soil-structure interaction, but the influence of scale on stick-slip phenomena has not been investigated. Other factors that require further investigation in relation to the stick-slip behavior of granular soils include rate dependence and the effects of different soil grades.
While several studies exist on this topic, the work presented here represents the first comprehensive experimental parametric investigation of the unloading behavior of walls subjected to rotation about the base. Using a controlled setup and precise measurement tools, the study quantitatively evaluated the influence of various factors on the unloading process. The results are openly available in a public repository and can serve as a valuable resource for the development and validation of improved verification procedures [e.g., in Perozzi and Puzrin (2023a)], whether based on numerical or analytical models.
Notation
The following symbols are used in this paper:
- rotational stiffness per linear meter (N/mrad);
- soil relative density (%);
- soil relative density after deposition of a layer (%);
- , ,
- grain size parameters (mm);
- ,
- minimum and maximum void ratios;
- generic force (N);
- deformation gradient;
- wall height (m);
- coefficient of earth pressure;
- linear spring stiffness ();
- moment per linear meter acting on the wall at the axle (N);
- moment per linear meter acting on the outer wall sections (N);
- moment per linear meter acting on the outer wall sections before starting the rotation of the central wall section (N);
- horizontal displacement in the soil-wall interface tests (mm);
- wall deflection (mm);
- baseline wall deflection at a specific wall coordinate recorded at the precise moment when the soil first reached this coordinate during the backfilling process (mm);
- spring elongation (m);
- vertical coordinate (cm);
- location of the resultant earth pressure measured from the wall base (cm);
- soil cover at a given material point (cm);
- soil unit weight ();
- wall friction angle (degrees);
- logarithmic strain tensor;
- logarithmic axial strain;
- logarithmic volumetric strain;
- wall rotation (measured at the axle; mrad);
- friction coefficient;
- ,
- minimum and maximum soil density ();
- active earth pressure (kPa);
- normal stress on the wall (kPa);
- vertical stress (kPa);
- shear stress (kPa);
- soil friction angle (peak and residual values; degrees); and
- dilatancy angle (degrees).
Supplemental Materials
File (supplemental materials_jggefk.gteng-12163_perozzi.pdf)
- Download
- 5.54 MB
Data Availability Statement
Some data, models, or code generated or used during the study are available in a repository online in accordance with funder data retention policies. A data set containing the test results is available at https://doi.org/10.3929/ethz-b-000623124 (Perozzi and Puzrin 2023c). Other data, models, or code that support the findings of this study are available from the corresponding author upon reasonable request, including a detailed characterization of the test soil and the wall material.
Acknowledgments
The authors would like to thank Ernst Bleiker, Dr. Balz Friedli, Andreas Kieper, and René Rohr (Institute for Geotechnical Engineering, ETH Zurich) for their valuable assistance in designing and building the test setup; Jonas Naegeli and Lukas Meier (master’s students, ETH Zurich) and Julien Gallacchi (Institute for Geotechnical Engineering, ETH Zurich) for their help in calibrating and running the experiments; Dr. Dominik Hauswirth, Roman Hettelingh, Boaz Klein, Marc Kohler (Institute for Geotechnical Engineering, ETH Zurich), and Dr. Severin Haefliger (Institute of Structural Engineering, ETH Zurich) for valuable discussions. This work was supported by the Swiss Federal Roads Office and the Swiss Federal Office of Transport (research project AGB 2015/029).
References
Adjemian, F., and P. Evesque. 2004. “Experimental study of stick-slip behavior.” Int. J. Numer. Anal. Methods Geomech. 28 (6): 501–530. https://doi.org/10.1002/nag.350.
ASTM. 2016a. Standard test methods for maximum index density and unit weight of soils using a vibratory table. ASTM D4253-16. West Conshohocken, PA: ASTM.
ASTM. 2016b. Standard test methods for minimum index density and unit weight of soils and calculation of relative density. ASTM D4254-16. West Conshohocken, PA: ASTM.
Bigoni, D., and T. Hueckel. 1991. “Uniqueness and localization—I. Associative and non-associative elastoplasticity.” Int. J. Solids Struct. 28 (2): 197–213. https://doi.org/10.1016/0020-7683(91)90205-T.
Broms, B. B. 1971. “Lateral earth pressures due to compaction of cohesionless soils.” In Proc., 4th Conf. on Soil Mechanics, 373–384. Budapest, Hungary: Akadémiai Kiadó.
Chen, T.-J., and Y.-S. Fang. 2008. “Earth pressure due to vibratory compaction.” J. Geotech. Geoenviron. Eng. 134 (4): 437–444. https://doi.org/10.1061/(ASCE)1090-0241(2008)134:4(437).
Clausen, J., and K. Krabbenhoft. 2008. “Existence and uniqueness of solutions in nonassociated Mohr-Coulomb elastoplasticity.” In Proc., 8th World Congress on Computational Mechanics (WCCM8), 5th European Congress on Computational Methods in Applied Science and Engineering (ECCOMAS 2008), edited by B. A. Schrefler and U. Perego. Washington, DC: American Psychological Association.
Cuennet, S., and P. Schär. 2016. Verletzliche Stützbauwerke. [Vulnerable retaining structures]. [In German.] 22–24. Zurich, Switzerland: Espazium.
Doanh, T., et al. 2013. “Stick-slip behaviour of model granular materials in drained triaxial compression.” Granular Matter 15 (1): 1–23. https://doi.org/10.1007/s10035-012-0384-6.
Ekwall, T. 2016. Filigrane Stützmauern sind passé. [Slender retaining walls are passé]. [In German.] 25–26. Zurich, Switzerland: Espazium.
Fang, Y., and I. Ishibashi. 1986. “Static earth pressures with various wall movements.” J. Geotech. Eng. 112 (3): 317–333. https://doi.org/10.1061/(ASCE)0733-9410(1986)112:3(317).
Groupement GUMA. 2014. Evaluation de l”état des murs de soutènement béton à semelles. Etude pilote. Rapport de synthèse des phases 1 et 2. [Assessment of the condition of concrete cantilever retaining walls. Pilot study. Summary report of phases 1 and 2.]. [In French.] Neuchâtel, Switzerland: Federal Department of the Environment, Transport, Energy and Communications.
Haefliger, S., and W. Kaufmann. 2022. “Corroded tension chord model: Load-deformation behavior of structures with locally corroded reinforcement.” Struct. Concr. 23 (1): 104–120. https://doi.org/10.1002/suco.202100165.
Haefliger, S., and W. Kaufmann. 2023a. “Load-deformation behavior of locally corroded reinforced concrete retaining wall segments: Experimental results.” Struct. Concr. 24 (1): 288–317. https://doi.org/10.1002/suco.202200405.
Haefliger, S., and W. Kaufmann. 2023b. Tragwiderstand und Verformungsvermögen von Winkelstützmauern bei lokaler Korrosion der Bewehrung. [Load-bearing resistance and deformation capacity of cantilever retaining walls affected by local corrosion of the reinforcement]. [In German.] Bern, Switzerland: Swiss Federal Roads Office.
Hanna, A. 2001. “Determination of plane-strain shear strength of sand from the results of triaxial tests.” Can. Geotech. J. 38 (6): 1231–1240. https://doi.org/10.1139/t01-064.
Harrop-Williams, K. O. 1989. “Geostatic wall pressures.” J. Geotech. Eng. 115 (9): 1321–1325. https://doi.org/10.1061/(ASCE)0733-9410(1989)115:9(1321).
Holzapfel, G. A. 2000. “Nonlinear solid mechanics.” In A continuum approach for engineering. New York: Wiley.
Ingold, T. S. 1979. “The effects of compaction on retaining walls.” Géotechnique 29 (3): 265–283. https://doi.org/10.1680/geot.1979.29.3.265.
Jáky, J. 1944. “The coefficient of earth pressure at rest” [A nyugalmi nyomas tenyezoje]. [In Hungarian] J. Soc. Hung. Archit. Eng. 78 (22): 355–358.
Kawamoto, R., et al. 2016. “Level set discrete element method for three-dimensional computations with triaxial case study.” J. Mech. Phys. Solids 91 (Jun): 1–13. https://doi.org/10.1016/j.jmps.2016.02.021.
Kawamoto, R., et al. 2018. “All you need is shape: Predicting shear banding in sand with LS-DEM.” J. Mech. Phys. Solids 111 (Feb): 375–392. https://doi.org/10.1016/j.jmps.2017.10.003.
Kuerbis, R. H., and Y. P. Vaid. 1990. “Corrections for membrane strength in the triaxial test.” Geotech. Test. J. 13 (4): 361–369. https://doi.org/10.1520/GTJ10179J.
Li, D., W. Wang, and Q. Zhang. 2014. “Lateral earth pressure behind walls rotating about base considering arching effects.” In Mathematical problems in engineering, 1–7. London: Hindawi Publishing Corporation. https://doi.org/10.1155/2014/715891.
Ozbay, A., and A. F. Cabalar. 2016. “Effects of triaxial confining pressure and strain rate on stick-slip behavior of a dry granular material.” Granular Matter 18 (3): 1–9. https://doi.org/10.1007/s10035-016-0664-7.
Patel, S., and K. Deb. 2020. “Study of active earth pressure behind a vertical retaining wall subjected to rotation about the base.” Int. J. Geomech. 20 (4): 04020028. https://doi.org/10.1061/(ASCE)GM.1943-5622.0001639.
Perozzi, D. 2022. “Quantification of the earth pressure acting on corrosion-damaged cantilever retaining walls: An analysis of the soil-structure interaction.” Doctoral thesis, Dept. of Civil, Environmental and Geomatic Engineering, ETH Zurich.
Perozzi, D., and A. M. Puzrin. 2023a. Failure behaviour of cantilever retaining walls—Soil-retaining wall interaction. Bern, Switzerland: Swiss Federal Roads Office. https://doi.org/10.3929/ethz-b-000627443.
Perozzi, D., and A. M. Puzrin. 2023b. “Limit-state solutions for the active earth pressure behind walls rotating about the base.” Géotechnique 30 (Oct): 1–12. https://doi.org/10.1680/jgeot.23.00093.
Perozzi, D., and A. M. Puzrin. 2023c. Tests on the earth pressure evolution acting on a model wall rotating about its base. Zurich, Switzerland: ETH Zurich.
Porcino, D., et al. 2003. “Interface behavior of sands from constant normal stiffness direct shear tests.” Geotech. Test. J. 26 (3): 289–301. https://doi.org/10.1520/GTJ11308J.
Rebhan, M. J. 2019. “Korrosionsschäden bei Winkelstützmauern. [Corrosion damage on Cantilever retaining walls].” [In German.] Doctoral thesis, Faculty of Civil Engineering Sciences, Graz Univ. of Technology.
Rice, J. R. 1976. “The localization of plastic deformation.” In Proc., 14th Int. Congress on Theoretical and Applied Mechanics Theoretical and Applied Mechanics, edited by W. T. Koiter, 207–220. Delft, Netherlands: North-Holland.
Roscoe, K. H. 1970. “The influence of strains in soil mechanics.” Géotechnique 20 (2): 129–170. https://doi.org/10.1680/geot.1970.20.2.129.
Roussel, L. E. 2005. “Experimental investigation of stick-slip behavior in granular materials.” LSU Master’s theses, Civil and Environmental Engineering, Louisiana State University and Agricultural and Mechanical College.
Rowe, P. W. 1969. “The relation between the shear strength of sands in triaxial compression, plane strain and direct shear.” Géotechnique 19 (1): 75–86. https://doi.org/10.1680/geot.1969.19.1.75.
Scholz, C. H. 2019. “Rock friction.” In The mechanics of earthquakes and faulting. 3rd ed. 43–96. Cambridge, UK: Cambridge University Press.
Sherif, M. A., Y. Fang, and R. I. Sherif. 1984. “KA and K0 behind rotating and non-yielding walls.” J. Geotech. Eng. 110 (1): 41–56. https://doi.org/10.1061/(ASCE)0733-9410(1984)110:1(41).
Tang, Y., J. Pei Li, and Y. Ma. 2018. “Lateral earth pressure considering the displacement of a rigid retaining wall.” Int. J. Geomech. 18 (11): 06018031. https://doi.org/10.1061/(ASCE)GM.1943-5622.0001284.
Tatsuoka, F., et al. 1986. “Strength and deformation characteristics of sand in plane strain compression at extremely low pressures.” Soils Found. 26 (1): 65–84. https://doi.org/10.3208/sandf1972.26.65.
tom Wörden, F. 2010. Untersuchungen zum räumlichen aktiven Erddruck auf starre vertikale Bauteile im nichtbindigen Boden. [Investigations of three-dimensional active earth pressure on rigid vertical structural members in noncohesive soil]. [In German.] Hannover, Germany: Leibniz Universität Hannover.
Vollenweider, A. G. 2014. Gefährdung von Winkelstützmauern durch Korrosion. Untersuchung des Bruchverhaltens–Phase 2. [Cantilever retaining walls at risk from corrosion. Investigation of Failure Behavior–Phase 2]. [In German.] Zurich, Switzerland: Swiss Federal Roads Office.
Wu, W., and D. Kolymbas. 1991. “On some issues in triaxial extension tests.” Geotech. Test. J. 14 (3): 276–287. https://doi.org/10.1520/GTJ10572J.
Information & Authors
Information
Published In

Journal of Geotechnical and Geoenvironmental Engineering
Volume 150 • Issue 7 • July 2024
Copyright
This work is made available under the terms of the Creative Commons Attribution 4.0 International license, https://creativecommons.org/licenses/by/4.0/.
History
Received: Jul 26, 2023
Accepted: Jan 22, 2024
Published online: Apr 22, 2024
Published in print: Jul 1, 2024
Discussion open until: Sep 22, 2024
ASCE Technical Topics:
- Backfills
- Construction engineering
- Construction methods
- Continuum mechanics
- Dynamics (solid mechanics)
- Engineering mechanics
- Excavation
- Geomechanics
- Geotechnical engineering
- Motion (dynamics)
- Retaining structures
- Rotation
- Soil analysis
- Soil dynamics
- Soil mechanics
- Soil pressure
- Soil properties
- Soil stress
- Solid mechanics
Authors
Metrics & Citations
Metrics
Citations
Download citation
If you have the appropriate software installed, you can download article citation data to the citation manager of your choice. Simply select your manager software from the list below and click Download.