Soil Shrinkage: Underlying Mechanisms Revealed by Intergranular Stress
Publication: Journal of Geotechnical and Geoenvironmental Engineering
Volume 150, Issue 3
Abstract
When drying from a fully saturated state, soil transits from saturation to unsaturation, activating the effects of capillarity, adsorption, and osmosis. Traditionally, these effects have been elusive in modeling soil shrinkage behavior. This paper addresses this gap of knowledge by reexamining the underlying mechanisms for the drying-induced shrinkage of soil. To this end, the concept of intergranular stress is introduced to lump all the effects of osmosis, capillarity, and adsorption into a unique effective stress tensor, and a simple constitutive model is developed based on the modified Cam-Clay (MCC) model. The proposed model inherits the simplicity of the MCC model while ensuring a smooth transition from saturation to unsaturation. It is shown that the drying-induced intergranular stress includes two components, accounting for capillary and adsorptive effects, respectively, intertwined with the osmotic effect. During a drying process, the adsorptive component of intergranular stress constantly increases and surpasses the capillary component at low water content, while the capillary component increases first and then decreases at the dry end. It is revealed that, for active soils, the effect of adsorption remains significant through the whole drying process, in contrast to nonactive soil where the effect of adsorption is significant only at low water content. As water content decreases, the deformation of soil is first elastic, then elastoplastic, and finally elastic. The elastic compression at the dry end can be attributed to the evaporation of the tightly adsorbed pore water. Comparison of simulations with experimental data shows that the proposed model captures very well the main features of the drying-induced shrinkage behavior of soil, implying that the intergranular stress tensor can be effectively used to address the hydro-chemo-mechanical behavior of soil under complex loading conditions.
Introduction
A soil shrinkage curve (SSC) represents the relationship between moisture ratio and void ratio, describing the shrinkage deformation of the soil drying from full saturation without externally applied stress (Haines 1923). Originally derived from soil and agricultural science, the SSC has received relatively less attention in the field of soil mechanics, compared to the soil water retention curve (SWRC). Similar to the SWRC, however, the SSC has now become an essential component in analyzing the hydromechanical behavior of soils. Although the SWRC and the SSC are correlated (Lu and Dong 2017), these two curves are fundamentally different. The SWRC depicts the water-retention capacity of soil, while the SSC describes the deformability of soil during a drying process, under the influences of capillary forces and the physicochemical interaction between pore water and soil matrix (i.e., soil–water interaction). For a comprehensive analysis of the hydromechanical behavior of soil under drying/wetting conditions, it is crucial to characterize properly both the soil shrinkage behavior and the soil-water retention behavior.
Traditionally, the shrinkage process of soil drying from full saturation has been divided into three distinct stages (e.g., Peng and Horn 2005; Cornelis et al. 2006), that is, (1) normal (basic or proportional) shrinkage, (2) residual (or transitional) shrinkage, and (3) zero shrinkage. Numerous analytical models have been developed to describe the SSC, and they can be broadly categorized into three groups: (1) empirical models (e.g., McGarry and Malafant 1987; Tariq and Durnford 1993; Braudeau et al. 1999; Boivin et al. 2006; Leong and Wijaya 2015; Chen and Lu 2018; Trabelsi et al. 2018), (2) suction-based models (e.g., Fleureau et al. 1993; Benchouk et al. 2013; Li et al. 2017), and (3) effective stress-based models (e.g., Coussy et al. 1998, 2004; Gawin et al. 2007). The empirical models are developed mainly based on the experimental measurements of the relationship between void ratio and water content, providing little insight into the shrinkage behavior of soil. Unlike the empirical models, the other two groups of soil shrinkage models adopt a mechanistic approach, considering the shrinkage of soil as a result of changes in the stress state of soil (Liu et al. 2016).
In the suction-based models, matric suction or soil-water potential is commonly introduced as a stress-type variable that describes the stress state of the soil. This treatment is based on the assumption that the effects of mechanical stress and suction (or soil-water potential) are similar to each other. It was experimentally observed that when the suction was smaller than the air-entry value, the drying curve (a relationship between void ratio and matric suction) of a saturated slurry was similar to an oedometric consolidation curve (e.g., Fleureau et al. 1993; Benchouk et al. 2013; Li et al. 2017). When soil becomes partially saturated, the soil-water potential is usually used as the soil suction to describe the compression response of soil upon drying. The conceptual validity of these suction-based models had been criticized by Baker and Frydman (2019), who argued that all the methods for soil suction measurement actually measured the matrix or internal potential of pore water. That is, the measured water potential represents the energy state of pore water but the stress of soil. Therefore, it is problematic to treat matric suction or water potential as an independent stress state variable.
To resolve the issue, some poromechanical approaches have been proposed to simulate the shrinkage and swelling behavior of porous materials, based on the concept of effective stress (e.g., Coussy et al. 1998, 2004; Gawin et al. 2007). These effective stress-based models consider the effect of the surface tension on the water–air interface, characterized by Kelvin’s equation (Reichenbauer and Scherer 2001), as the driving force for soil shrinkage. Although these models describe well the shrinkage behavior of soil at medium to high saturation, they are inadequate in addressing the drying-induced compression of soil at low saturation, where adsorptive forces become dominant (Prost et al. 1998; Or and Tuller 1999). It was recognized that the adsorption effect played a crucial role in soil shrinkage at low water content (Dong et al. 2020). To address the effect of adsorption, several microscopic mechanisms have been proposed, including the changes in the surface energy of soil particles due to water adsorption and the presence of disjoining pressure in adsorbed water films. Evaluation of these mechanisms involves Monte Carlo and/or molecular dynamics simulations, which are typically limited to small pores with sizes not exceeding a few molecular diameters (Schiller et al. 2008).
In general, soil can be considered a porous material composed of a solid matrix with pores saturated with a salt solution and/or air. When drying from a fully saturated state, the soil transits from full saturation to partial saturation, activating capillary and adsorptive effects intertwined with the osmotic effect. A stress state variable that is used to describe the drying-induced shrinkage behavior of soil should be able to address consistently the effects of capillarity, adsorption, and osmosis during the course of the drying process. Within the framework of a chemo-mechanical theory of unsaturated soil, Wei (2014) proposed an intergranular stress tensor that can lump the effects of osmosis, capillarity, and adsorption into a unique effective stress equation. Remarkably, this intergranular stress tensor is properly work-conjugated to the strain tensor of the soil matrix and is suitable for describing the hydromechanical behavior of soil over a wide range of the degree of water saturation.
The objective of this paper is twofold: to illustrate the capability of the intergranular stress tensor in modeling the drying-induced shrinkage behavior of soil and to reexamine the underlying mechanisms for soil shrinkage by virtue of the intergranular stress. To this end, an elastoplastic model is developed based on the modified Cam-Clay (MCC) model with the incorporation of intergranular stress. The degree of saturation is incorporated as one of the hardening parameters to account for the effect of unsaturation. This approach is capable of describing the hydro-chemo-mechanical behavior of soil with a smooth transition between saturation and unsaturation, and properly capturing the critical transition points on the compression curves across various levels of water content, including the preconsolidation stress, the air-entry value, and the shrinkage limit.
Soil Shrinkage: Possible Mechanisms
As illustrated in Fig. 1(a), the drying-induced shrinkage behavior of soil can be characterized by virtue of a shrinkage curve (denoted as SSC), which represents a relationship between the void ratio () and moisture ratio (). Here, is defined as the volume of voids () divided by the volume of solid material () and is defined as the volume of liquid water () divided by the volume of solid material (). This form of SSC depicts the correlation between the volume changes of soil and pore water during the drying process. The 1:1 correspondence between the void ratio and the moisture ratio signifies full saturation of the soil, at which the volume reduction of soil is equal to the volume of the drained water. This 1:1 line is coincident with the consolidation line of the fully saturated soil under purely mechanical loading conditions. In general, an SSC exhibits three distinct stages (as stated in the Introduction), which are separated by two transition points denoting the air-entry value and the shrinkage limit, respectively.
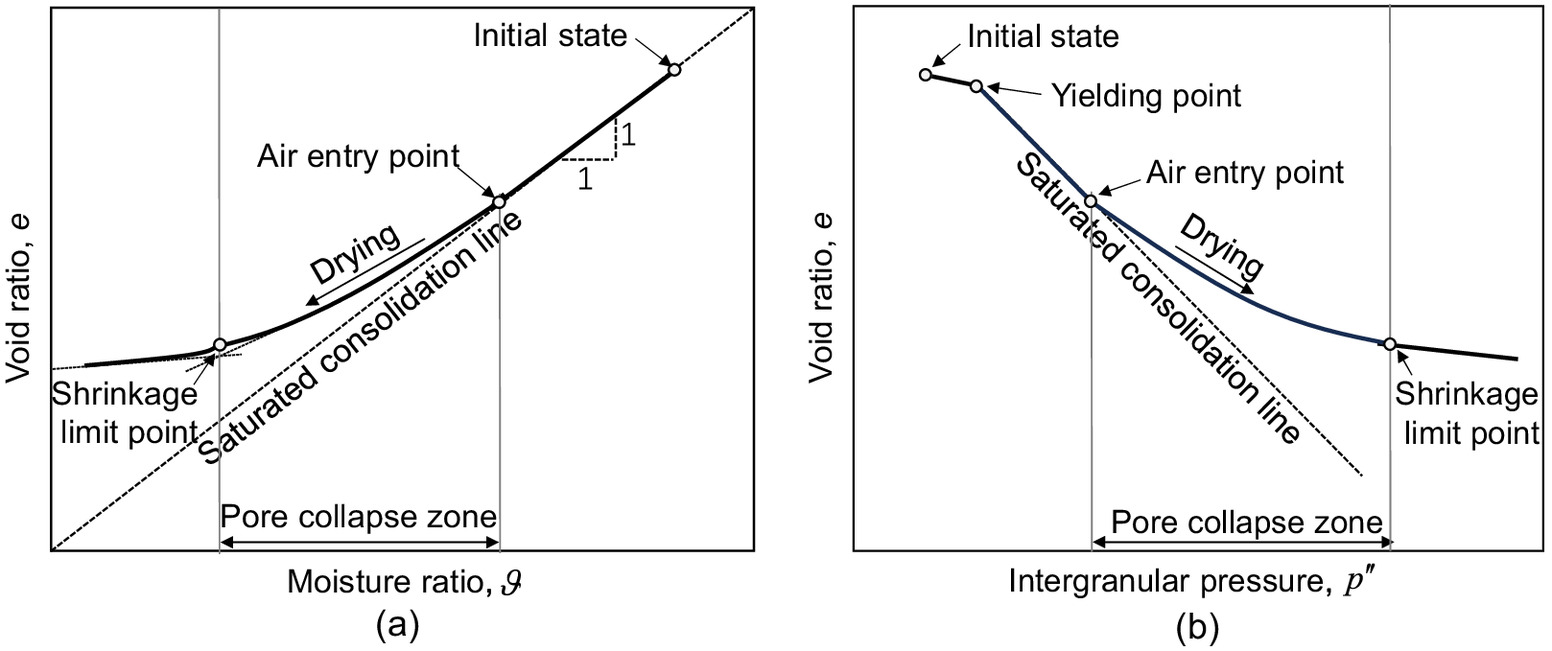
Other than the relationship, the drying-induced shrinkage of soil can also be characterized by using a drying-induced compression curve (denoted as DiCC), which represents the relationship between void ratio () and mean intergranular stress or mean effective stress (), as depicted in Fig. 1(b). Intrinsically, the volume change of soil during drying is induced by the variation of intergranular stress . Consequently, the drying-induced compression curve (DiCC)) on the plane can be viewed as a compression curve of soil. It is noted, however, that the compression of soil due to drying is different from the consolidation of soil under mechanical loading, although both can be characterized by using intergranular stress. The dry-induced compression of soil is due to the increase in the intergranular stress generated in the drying process, and the soil could become partially saturated; in contrast, the consolidation of soil is induced by the increase of the intergranular stress due to pore water pressure dissipation, during which the soil remains fully saturated. During the drying process, as water content decreases, more and more large pores become empty, and the soil becomes stiffer and stiffer. As a consequence, the drying-induced compression curve deviates gradually from the consolidation line of fully saturated soil [Fig. 1(b)].
The difference between mechanical loading and hydraulic loading in driving the deformation of soil can be better understood from a microscopic perspective. In general, active soils (especially, expansive soils) possess double structure, which is featured with interaggregate macropores and intraaggregate micropores. Generally, external mechanical loading compresses the macropores without significant impact on the micropores in clay aggregates; in contrast, hydraulic loading (say drying) compresses both micropores and macropores (Delage and Lefebvre 1984; Griffiths and Josi 1989; Al-Mukhtar et al. 1996; Simms and Yanful 2001; Cuisinier and Laloui 2004; Sivakumar et al. 2006; Lloret and Villar 2007; Monroy et al. 2010; Romero 2013). Therefore, the drying-induced shrinkage process of soil is driven by both capillary and adsorptive forces. Extensive experimental evidence demonstrates that soil shrinkage can occur even when the porous medium is fully saturated, that is, when capillary forces are absent (Dong et al. 2020). At the beginning of a soil drying process from full saturation, the removal of pore water at the soil boundary leads to an increase in negative pore pressure throughout the soil mass (Hu et al. 2013), resulting in the elevation of intergranular stress and thus the shrinkage of soil. During this stage, the soil remains fully saturated, and its compression follows the consolidation line of the fully saturated soil.
With the removal of pore water, matric suction constantly increases. Once the air-entry value is reached, air enters the pores, and the soil becomes partially saturated. In this phase, capillary forces become active, dominating the shrinkage process of the soil. As the drying process proceeds, the water in the macropores (i.e., capillary water or loosely adsorbed water) is depleted first, followed by the drainage of the water in the micropores (i.e., tightly adsorbed water). As more and more macropores become empty, some of them collapse due to the increase in intergranular stress, resulting in a stiffer solid matrix. As water content decreases, the strength of soil–water interaction increases and finally overshadows the capillary forces in governing the soil shrinkage. For instance, as the volume of pore water decreases, the concentration of the counter-cations increases, so that the effects of adsorption and osmosis become stronger and stronger, and finally become dominant in the soil shrinkage process. As drying proceeds, the number of collapsed macropores increases until no more macropores can collapse solely due to drying. The remaining macropores are compressible only by applying mechanical loading and/or by wetting the soil.
Fig. 2(a) schematically illustrates a drying-induced shrinkage test, where various saturated salt solutions are used to control the relative humidity within a sealed chamber. The shrinkage test starts with a fully saturated state. During the test, the controlled relative humidity decreases from a high value (say ), and the soil shrinks as water content decreases. As a consequence, the soil water transits sequentially from full saturation, to capillary regime, adsorbed regime, and finally to the tightly adsorbed regime, as illustrated in Fig. 2(b). To evaluate the evolution of pore water pressure and pore water concentration, we have to introduce the concept of equilibrium solution (Sposito 1981; Wei 2014). An equilibrium solution is a virtual solution hydraulically connected to the soil sample and in equilibrium with the ambient humidity environment. In practice, one may determine the pore water pressure and the pore water concentration in the soil by measuring the concentration () and pressure () of the equilibrium solution (Wei 2014). It is important to note that each point within the soil domain of interest is affiliated with a unique virtual equilibrium solution, as schematically illustrated in Fig. 2(a).
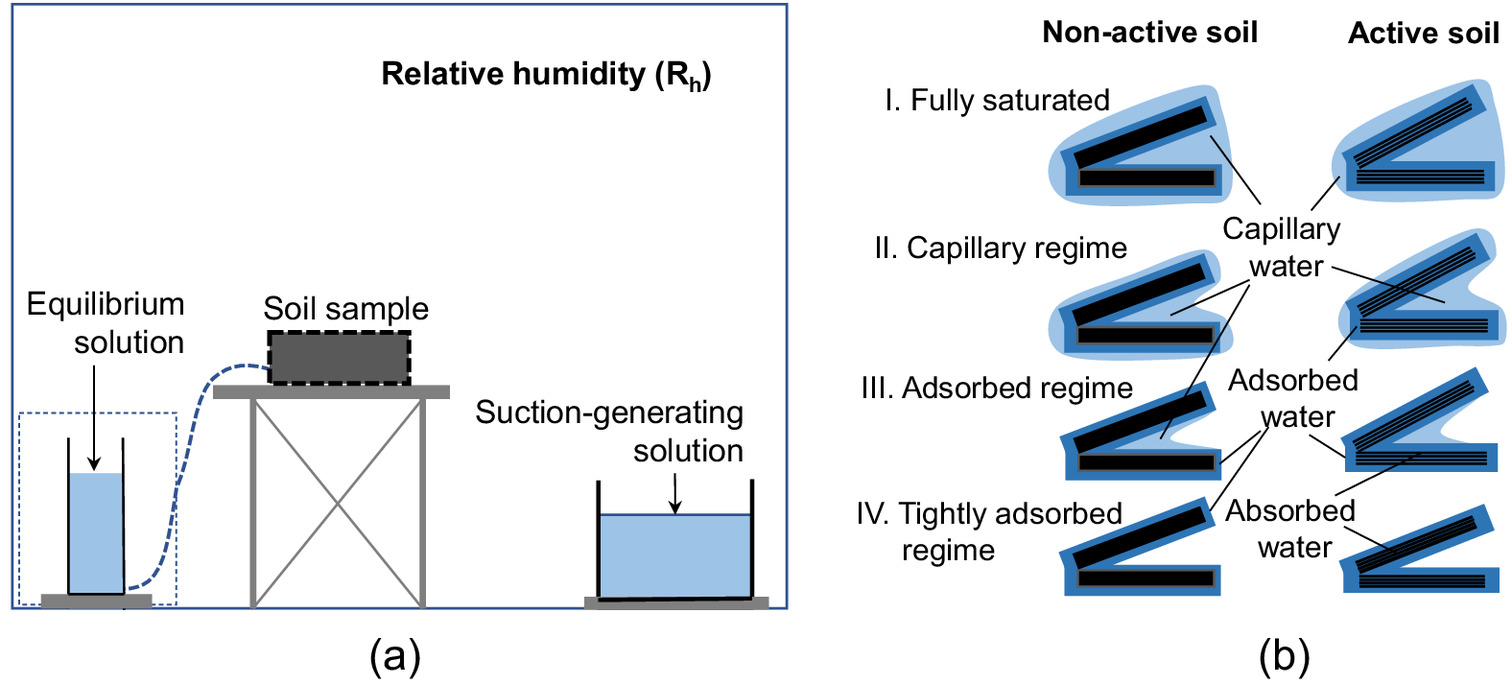
For nonactive soils, drying-induced shrinkage may cease at some low water content (the zero-shrinkage phase). For active soils, however, even after the water content decreases to a small value and the collapse of macropores ceases, the adsorbed water in the electrical diffuse double layers can still be removed. This leads to a reduction in the thickness of double layers and the extraction of some interlamellar water from clay minerals until equilibrium is reestablished between the double-layer water and the interlamellar water. During this process, the soil undergoes reversible compression, which is governed by the intergranular stress induced by the adsorptive forces. This phase represents the regime of adsorption, where no pore collapse takes place, and any skeletal deformation is elastic.
Theoretical Formulation
Intergranular Stress Tensor
In soil drying from a fully saturated state, all the effects of capillarity, adsorption, and osmosis are activated. To simulate properly the drying-induced shrinkage process of soil, it is crucial to introduce an effective stress variable that can accommodate all these physicochemical effects in a consistent way. For this purpose, the intergranular stress tensor developed by Wei (2014) is introduced here aswhere and = intergranular stress tensor and total stress tensor, respectively; = pore air pressure; () = matric suction, where = measurable pore water pressure (i.e., the pressure of equilibrium solution); = volume fraction of pore water or the volumetric water content, equal to porosity multiplied by the degree of saturation (); = second-order unit tensor (with component ); = Donnan’s osmotic pressure, arising from the negatively charged nature of clay minerals; = mass density of pore water solution; and = surface force potential accounting for the intensity of surface forces and solid-water interactions. Here, the standard sign convention of soil mechanics is adopted, that is, compression is positive.
(1)
The component of the intergranular stress, accounting for the contribution of soil–water interaction, can be expressed aswhere subscript “0” = initial state before drying, at which the soil is fully saturated. By combining Eqs. (1) and (2), it is straightforward to prove that the differential of the intergranular stress is given by
(2)
(3)
When matric suction vanishes (i.e., ), and Eq. (1) ends up with , where the bracketed term accounts for the soil–water interaction. If the soil–water interaction is negligible, , that is, the Terzaghi’s effective stress is recovered. Hence, the introduced intergranular stress can smoothly transit between saturation and unsaturation. Remarkably, the intergranular stress tensor () is properly work-conjugated to the skeletal strain tensor () of the soil (assuming that the skeletal deformation is infinitesimal). Also noticeably, Eq. (1) clearly shows that is composed of three components, that is, , and . The first one apparently stems from mechanical loading. As discussed in Appendix I, the second and third components account for the effects of capillarity and adsorption, respectively.
Shrinkage-Driving Intergranular Pressure
During drying-induced shrinkage tests, no external stress is applied to the soil and the pore air pressure equals the atmospheric pressure, that is, . In addition, for isotropic soils, the development of internal stress can be considered isotropic. Under these conditions, one may use the mean intergranular stress (or intergranular pressure), , to describe the soil shrinkage process. Apparently, in this caseand accordingly
(4)
(5)
Noticeably, the intergranular stress tensor is formally similar to the one proposed by Coussy et al. (2004). In contrast to the latter, however, or includes as an additional term, which explicitly accounts for the effect of soil–water interactions due to the existence of electrical charges on mineral surfaces. For nonactive soils, the number of fixed charges is zero, so that vanishes (as will become clear in the following).
In general, Donnan’s osmotic pressure () equals the difference between the osmotic pressure of pore water () and the osmotic pressure of the equilibrium solution (), that is, . can be evaluated based on the so-called Donnan equilibrium (Wei 2014). For dilute monovalent salt solutions (say NaCl solutions), and are explicitly given by (see Appendix II)where = universal gas constant, equal to ; = Kelvin temperature; () = fixed negative charge density, defined as the total number of electrical charges fixed on a unit volume of soil, which is related to the cation exchange capacity (CEC) () via , where is the specific gravity of soil and is a reduction factor; = salt concentration of equilibrium solution. In the drying experiments, is approximately equal to the salt concentration of the water solution used to prepare the soil samples. Apparently, or is a general function of porosity and concentration , provided that the CEC value is given. For nonactive soils, , so that and .
(6)
(7)
In the soil shrinkage tests, the drying process of soil is driven by the reduction of the relative humidity () in the sample chamber [Fig. 2(a)]. It is more convenient to use total suction (), instead of matric suction (), in calculating the intergranular pressure, since can be related to the RH via , where is the molar volume of water. Because and , Eq. (5) can be recast into
(8)
To evaluate the variation of intergranular pressure by virtue of Eqs. (5) or (8), one needs to set up the initial conditions for the drying process. At the initial state, the soil is fully saturated, the initial volume fraction of pore water () equals the initial porosity (), and the initial matric suction () is zero, so that the initial total suction () equals the initial osmotic pressure () of the equilibrium solution, that is, , where is the initial salt concentration of the equilibrium solution. Under these conditions, one obtains the initial intergranular pressure as . With the exception of some special soils (say pure sand), is generally positive, and it is positive that prevents the soil sample from falling apart.
It is assumed herein that the salt is nonvolatile and only the solvent (water) is lost during the drying process. As a consequence, one obtains or , where and are the current salt concentration and moisture ratio, respectively. In addition, one can write and , where and are the current concentrations of anions and cations in the pore water, respectively; is the current volume of pore water; subscript “0” represents the initial state (i.e., at full saturation). Eqs. (6) and (7) can be recast intowhere = initial value of the fixed charge density and
(9)
(10)
(11)
Accordingly, one obtains the Donnan osmotic pressure as
(12)
Because and as well as are constant and depend only upon the initial conditions, the evaluation of intergranular pressure can be dramatically simplified by using Eqs. (9)–(12). To calculate the intergranular pressure at any moisture ratio during a drying process, one must first determine the relationship between (or ) and , that is, the soil–water retention curve (SWRC). For this purpose, an analytical model of SWRC, such as the one proposed by Lu (2016) (see Appendix III), can be introduced.
An Elastoplastic Model for Soil Shrinkage
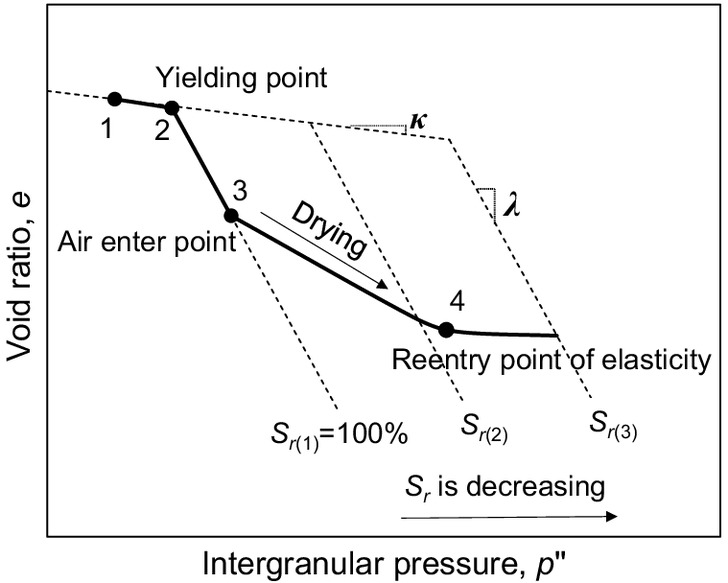
To evaluate the drying-induced shrinkage of soil, one needs to address the relationship between skeletal strain and intergranular stress. To this end, the MCC model is introduced here with the incorporation of intergranular stress. Because no deviatoric stress is applied or generated in the drying test, the isotropic part of the MCC model is adopted, involving the mean intergranular stress (or intergranular pressure) only, as given by Eqs. (5) or (8). To begin with, we consider the initial state (Point 1 in Fig. 3), where the soil is fully saturated with a dilute monovalent salt solution, such as NaCl. This initial state is characterized by a set of variables, including , , , , and (preconsolidation pressure). Under the isothermal condition, the soil starts drying as the ambient humidity gradually decreases. As water content decreases, the intergranular pressure increases by .
In the following, unless otherwise specified, simply represents , that is, the intergranular pressure increment induced by drying, and is dropped here for clarity. Hence, can be explicitly written as
(13)
The first bracketed term on the right hand side (r.h.s.) represents the intergranular stress component accounting for the capillary effect (denoted by ), while the second integral term represents the intergranular component accounting for the effect of adsorption (denoted by ).
Based on the MCC model, when , the soil deforms elastically, its compression follows a straight line on the plane. Namely, , where is the void ratio at ; is the rebound index. The incremental elastic volumetric strain is given by
(14)
As drying proceeds, increases so that (Point 2), and plastic deformation occurs. In this phase of shrinkage, the soil compression follows a curve described by , where is the compression index (Fig. 3) and is the void ratio at the intergranular pressure . The change of plastic volumetric strain is described by
(15)
As plastic volumetric strain develops, the soil undergoes hardening, characterized by the evolution equation of yielding stress (), that is
(16)
When is larger than the air-entry value, the soil becomes partially saturated at Point 3 (Fig. 3). As the drying process proceeds, some empty large pores collapse due to the instability of local particle arrangements, inducing additional strain hardening. To incorporate this effect, an extra term is included in Eq. (16), so thatwhere is the collapsed void ratio, defined as the difference in void ratios between the unsaturated state and saturated state under the same intergranular stress. It is proposed here that the value of depends upon the extent of collapsible pores in the soil, which can be characterized by the degree of air saturation, (). That is, is a function of . Based on the analysis of the experimental data for various types of soils, it has been shown that can be very well described by Song et al. (2022)where and = two positive empirical parameters.
(17)
(18)
In plastic deformation, is constantly equal to yielding pressure , whose initial value is , that is, and . With this condition, it follows from Eq. (17), after some rearrangements, that
(19)
Although both intergranular pressure and yielding stress increase with drying, increases faster than because of the volumetric strain hardening effect. Eventually, there comes a point where the increase in the yielding stress surpasses the development of intergranular pressure, so that the sample reenters the regime of elasticity at the end of drying (as indicated by Point 4). In this regime, no more collapsible macropores are created, and the decrease in water content stems mainly from the extraction of tightly adsorbed water in nonactive soils or from the inner region of the diffuse double layers in active soils, where the effect of adsorption becomes dominant.
Because , summing up Eqs. (14) and (19) and using Eq. (18), one obtainsin the plastic regime (), while in the elastic regime (), . The soil shrinkage curve (SSC) and the DiCC) can be determined by numerically solving Eq. (20) for , or (14) for , with the incorporation of (5) or Eq. (8). In calculation, one may make use of and . Noticeably, Eqs. (5) and (8) are equivalent, and the choice of them depends on whether or is used in the SWRC. In addition, when the soil becomes fully saturated (), Eq. (20) ends up with its saturated counterparts.
(20)
Remarkably, the intergranular stress introduced above is considered as effective stress. Here, it is implicitly assumed that the intergranular stress can be used to describe the constitutive behavior of soil (matrix), whether the soil is partially or fully saturated. Hence, all the material parameters (, and ) in the above proposed model are constant. In particular, and are independent of soil suction or water content. This feature can dramatically simplify the constitutive modeling of soil, which may transit between full saturation and partial saturation.
Model Performance
To illustrate the performance of the proposed model and to examine the applicability of the intergranular stress concept, we apply the proposed model to simulate the drying-induced shrinkage behaviors of various soils from nonactive sandy soil to highly active bentonite. The shrinkage tests of these soils were performed on remolded or compacted samples (Dong et al. 2020; Dong and Lu 2020; Ma et al. 2024). In these experiments, the volumetric strain was monitored by using advanced digital image technology, which offers nondestructive measurements with greater accuracy compared to conventional methods such as the wax-sealing method and balloon method. The SWRC data of these soils were measured independently for these soils. At low suction (smaller than 7.5 MPa), the SWRCs were measured by using the transient water release method (based on the axis-translation technique). At high suction (larger than 7 MPa), the SWRCs were assessed by using the vapor sorption isotherm technique (Dong et al. 2020). The transient water release method measures matric suction, while the vapor sorption isotherm technique measures total suction. Consequently, for nonactive soils which have a relatively low suction, the obtained SWRCs are presented as the relationship between matric suction and moisture ratio; for active soils which have a high suction, the SWRCs are composed of two sections: versus at low suction, whereas versus at high suction. The use of a two-section SWRC is because the total suction in the active soils at near saturation is generally difficult to determine and control.
Nonactive Soils
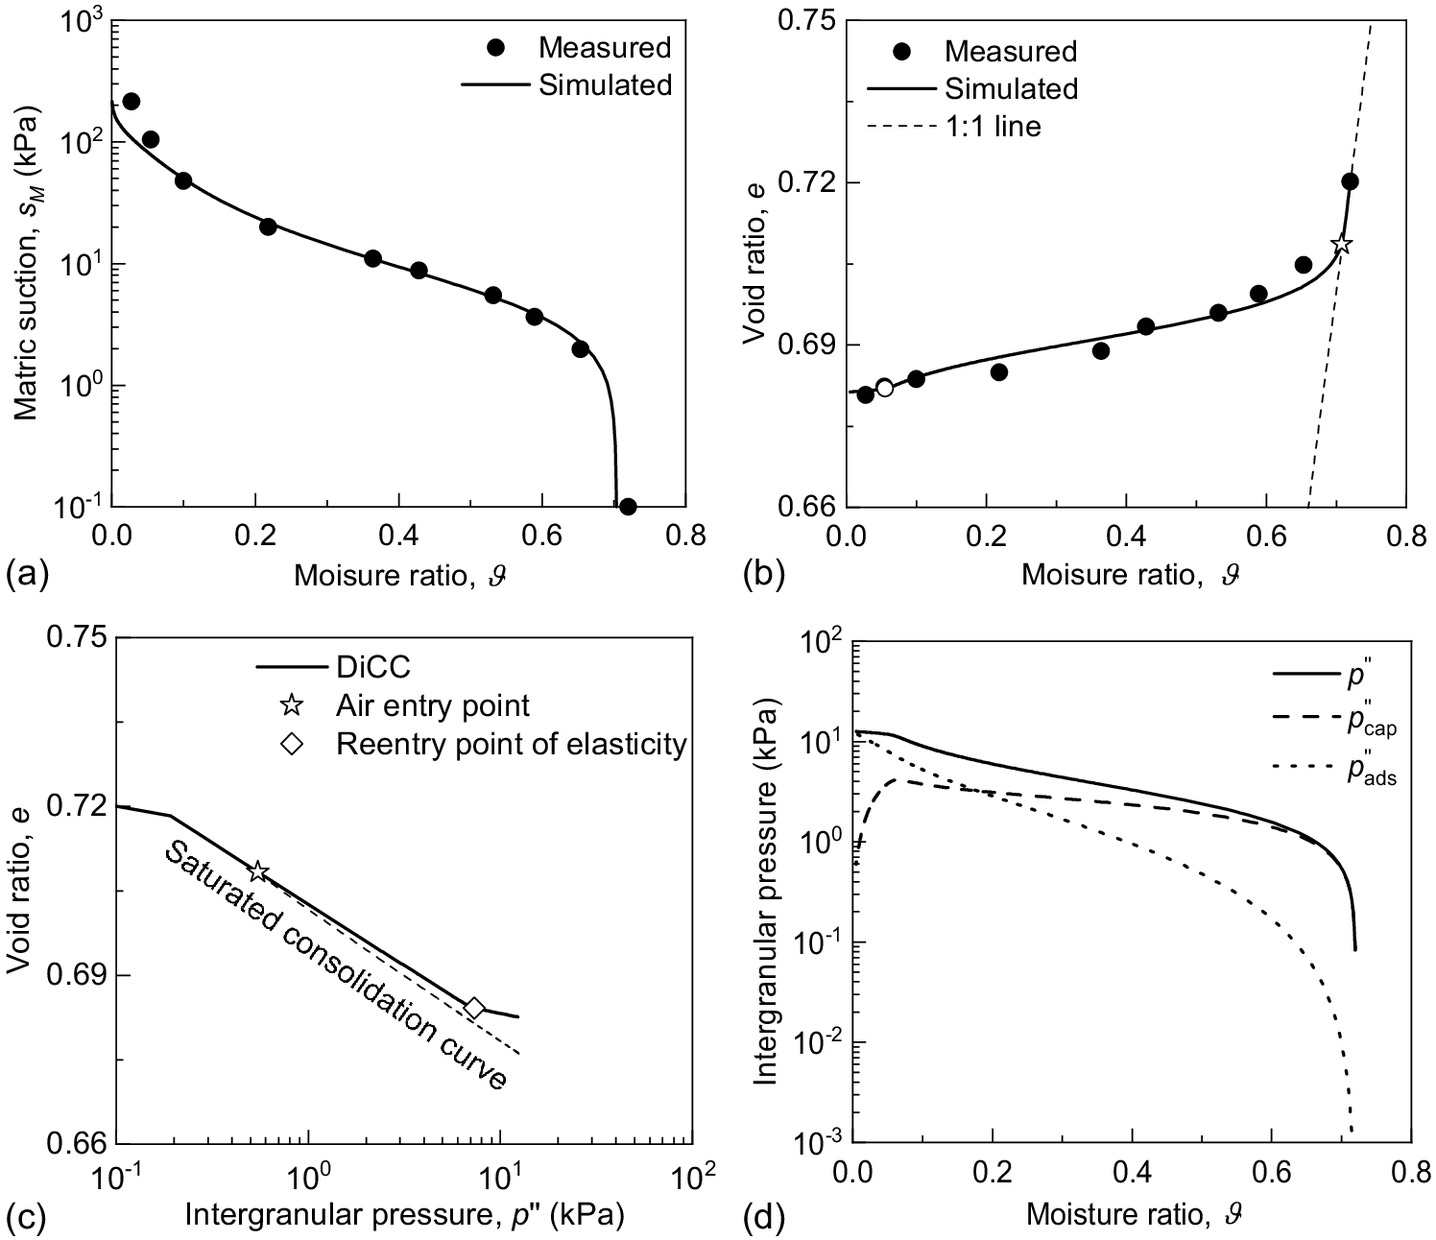
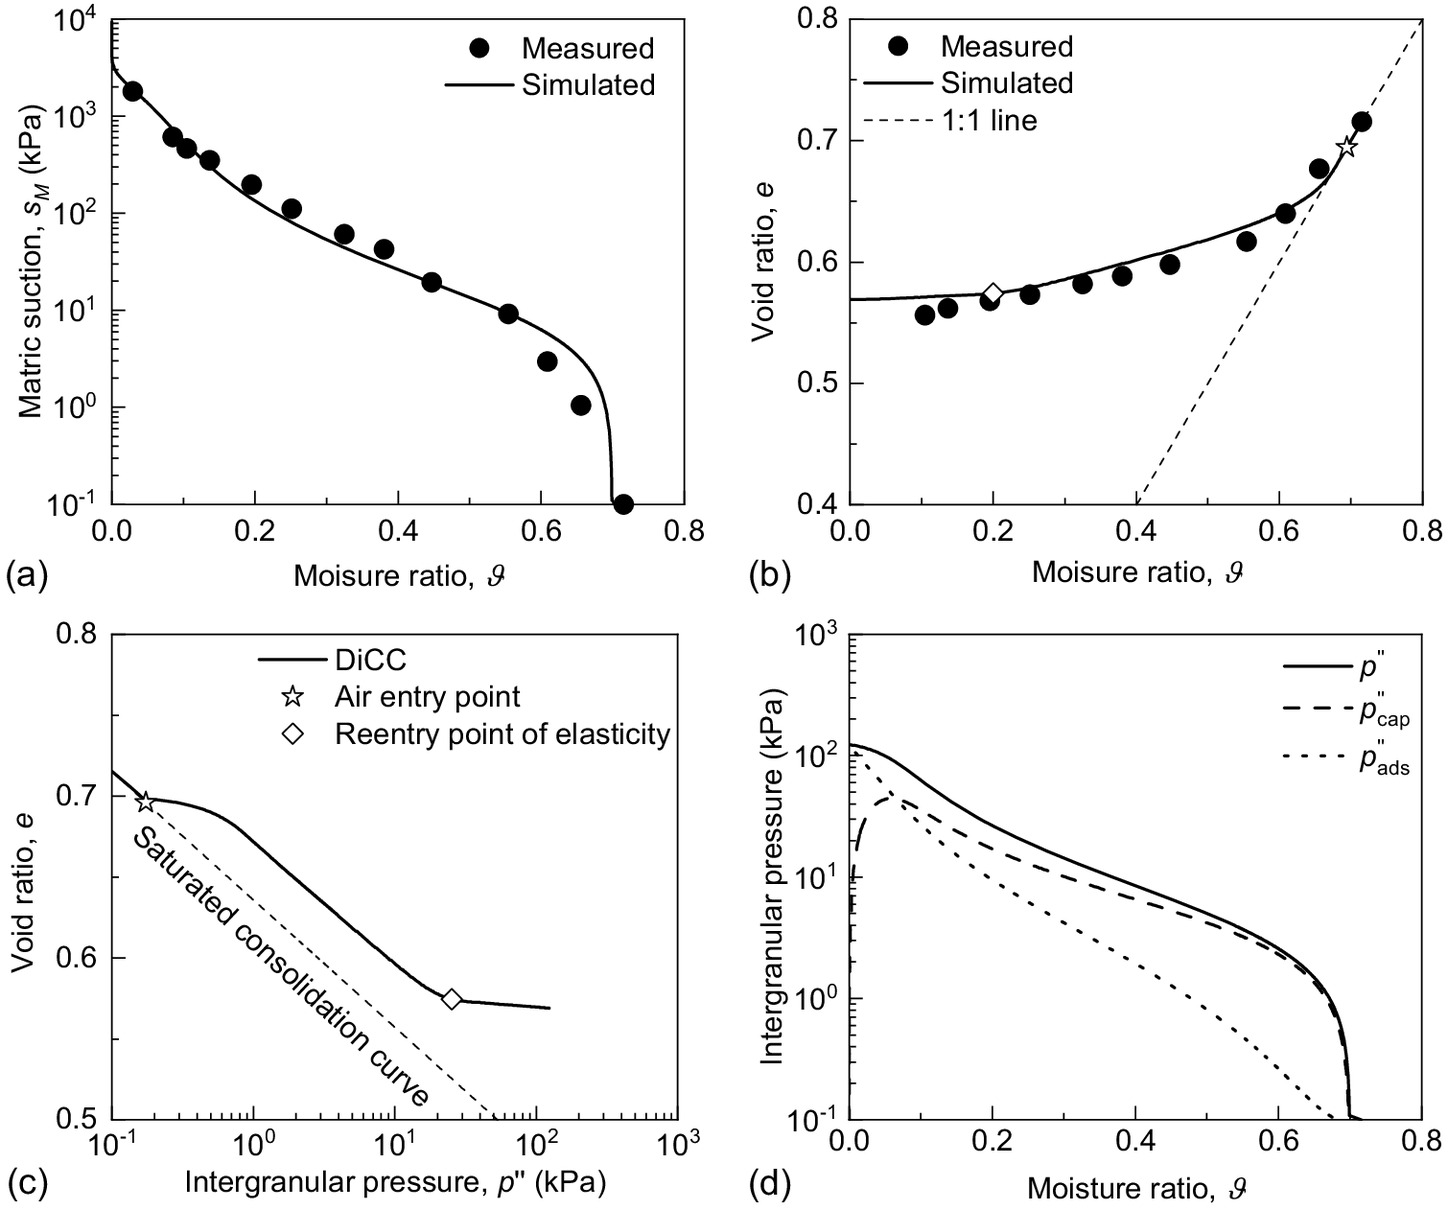
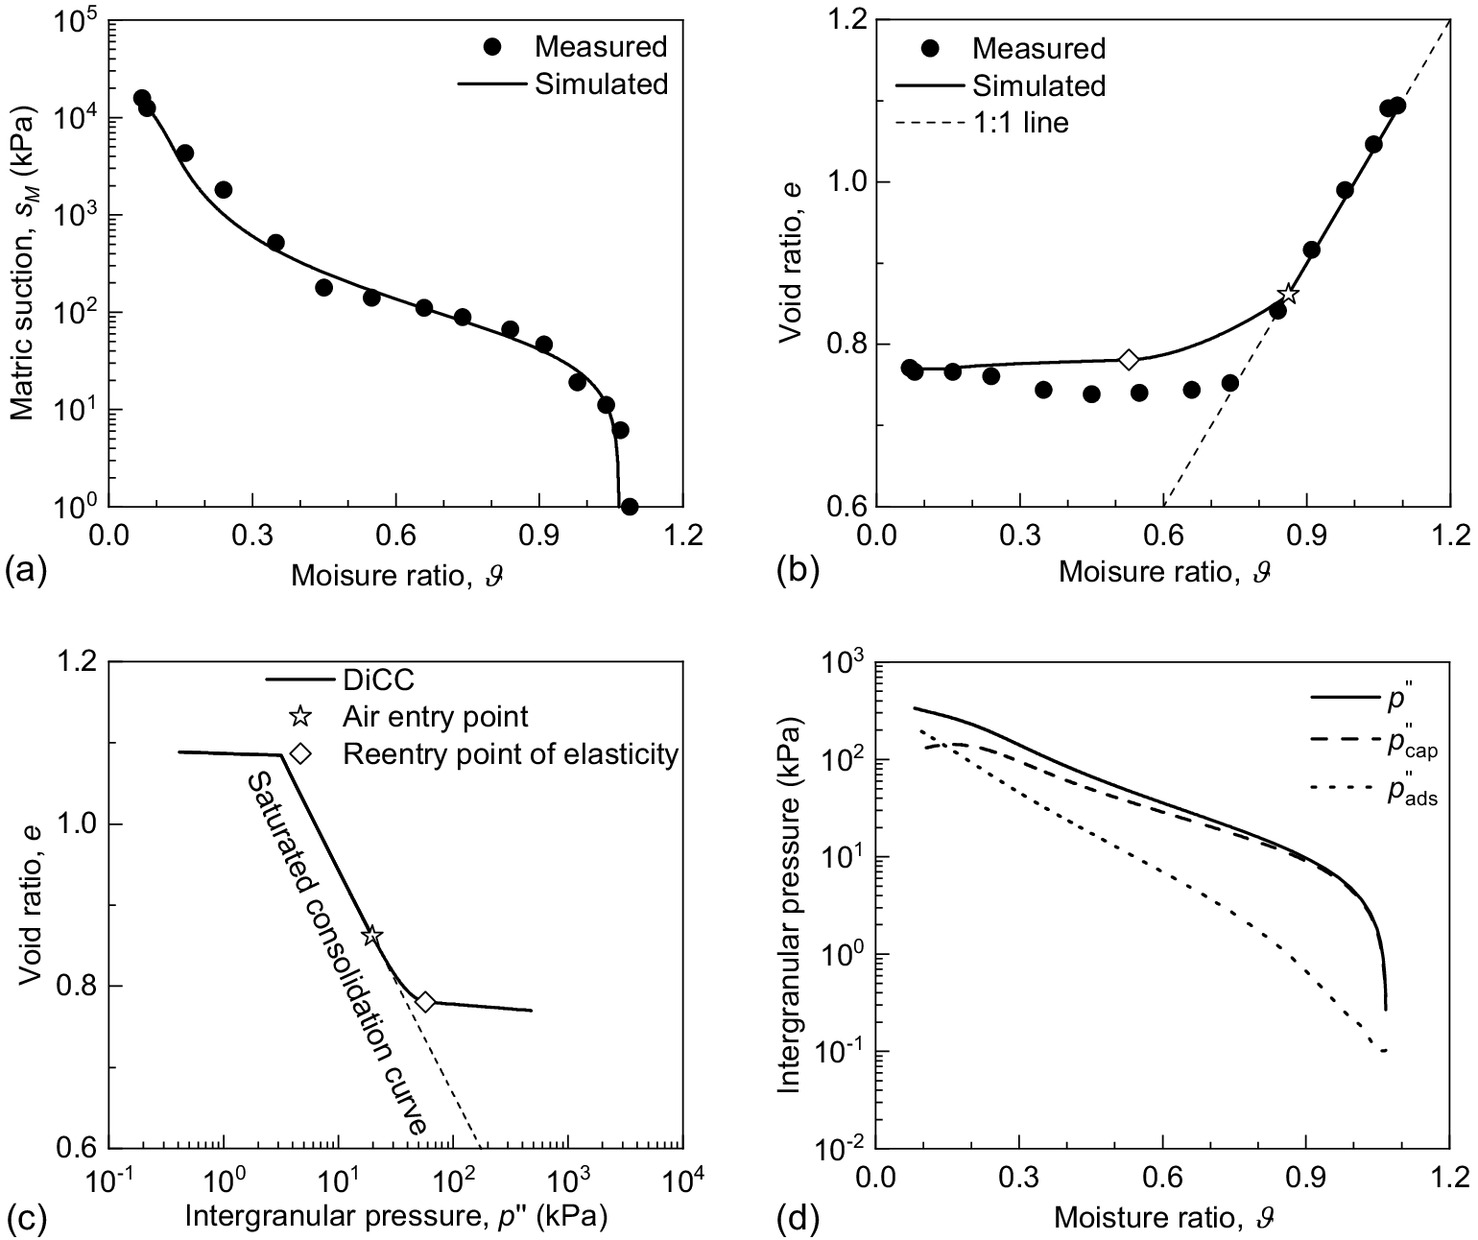
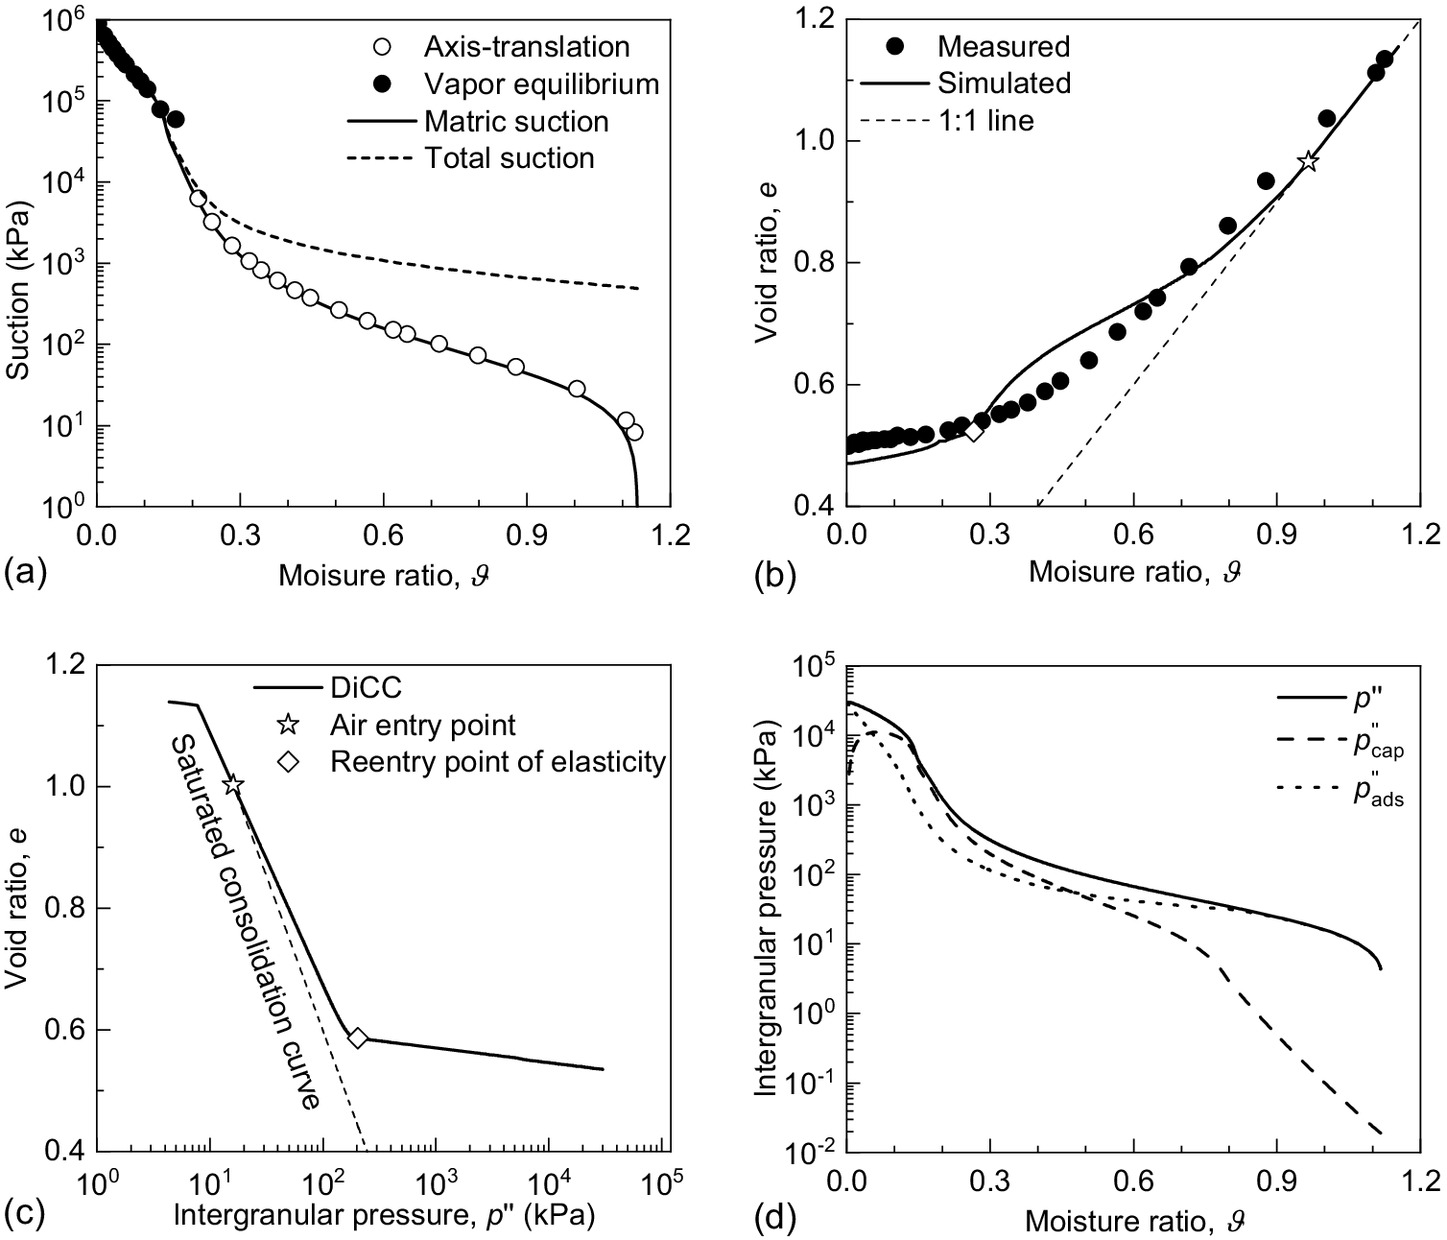
The drying-induced shrinkage processes of three nonactive soils, that is, Esperance sand, Bonny silt, and Georgia kaolinite, are simulated here. These soils are chemically inactive due to their low fixed charge densities. The results of simulations are presented in Figs. 4–6 for the three soils, respectively. In each figure, (a) depicts the measured data and the best-fit of the SWRC, (b) compares the simulated SCC with experimental data, (c) depicts the simulated DiCC, and (d) compares the capillary and adsorptive components of intergranular pressure. The measured SWRCs (i.e., data points) were fitted by using Lu (2016)’s model, and the SWRC model parameters for the best fits are given in Table 1. The best-fit SWRCs were then used as the input into the proposed model to yield the SSCs, DiCCs, and the variations of intergranular pressure with moisture ratio. The SSCs were determined by adjusting shrinkage model parameters and to obtain the best-fitted SSCs, and the obtained parameters are also summarized in Table 1. In simulations, because nonactive soils have negligible fixed charges [ in Eq. (7)], , and (Chen et al. 2023).
| Soils | SWRC model parameters | Shrinkage model parameters | |||||||
|---|---|---|---|---|---|---|---|---|---|
| N | M | κ | a | b | |||||
| Esperance sand | 0.17 | 1.84 | 0.5 | 0.00 | 0.01 | 0.003 | 0.2 | 30 | 0.2 |
| Bonny silt | 0.116 | 1.45 | 0.5 | 0.00 | 0.034 | 0.003 | 0.3 | 10 | 0.1 |
| Georgia kaolinite | 0.018 | 1.62 | 0.023 | 0.08 | 0.12 | 0.002 | 0.2 | 9.0 | 0.2 |
For Esperance sand (Fig. 4), the simulated SCC agrees well with the experimental data. The soil is initially fully saturated, as indicated by the coincidence of the simulated SSC with the 1:1 line, and then becomes partially saturated at the point denoted by the empty star. As drying proceeds, a small amount of elastic compression occurs first, followed by elastoplastic compression, and finally the soil reenters the elastic regime at some low water content (denoted by the empty diamond). For sand, , the capillary component () of intergranular stress equals , while the adsorptive component () is . These two pressure components are compared in Fig. 4(d), showing that the effect of capillarity is dominant at medium to high saturation and the adsorptive effect becomes pronounced at low moisture ratio. When , increases up to 20% of , which is no longer negligible, and when , surpasses and becomes dominant toward the dry end. Clearly, increases at a decreasing rate and approaches some stable value as decreases.
For Bonny silt (Fig. 5), the proposed model can also describe well the SSC. Similarly, the soil is initially fully saturated in the early stage of shrinkage, although the initial elastic deformation does not occur and instead the deformation enters directly the elastoplastic regime. At some small (denoted by the empty diamond), the soil deformation becomes elastic again, as predicted by the proposed model. In drying, as decreases, the adsorptive component of intergranular stress becomes more and more pronounced, and when (), increases up to 25% of , and surpasses the latter at . In addition, increases at a decreasing rate and approaches some stable value as the moisture ratio decreases toward the dry end. These features are similar to those of Esperance sand.
Although Georgia kaolinite has a small CEC (), it is assumed in simulation that this soil is chemically inactive so that and . In Fig. 6(b), Georgia kaolinite exhibits significant shrinkage deformation during the drying process, even when the soil is fully saturated (as implied by the coincidence of SSC with the 1:1 line). This phenomenon can be probably attributed to structural collapse, which cannot be properly captured by this simple model. Structural collapse may occur if fissures or cracks are created in the soil due to particle aggregation so that the drainage of pore water is accelerated. This is evidenced by the swelling deformation as decreases from 0.45 to 0.06, during which the soil could become more and more aggregated due to water loss and microscopic fissures could appear, counteracting the soil shrinkage. The occurrence of fissures between aggregates due to drying had been observed by Sun and Cui (2018). Nonetheless, the proposed model correctly predicts that the soil is fully saturated in the early stage of shrinkage, where both elastic and elastoplastic deformations occur. In addition, in Fig. 6(c), the soil deformation is initially elastic, then elastoplastic, and finally elastic again at the dry end. Similarly, to the cases of Esperance sand and Bonny silt, the proposed model predicts that the effect of adsorptive becomes increasingly important as decreases. When (), the adsorptive component increases up to 30% of the capillary component and surpasses the latter at .
Active Soils
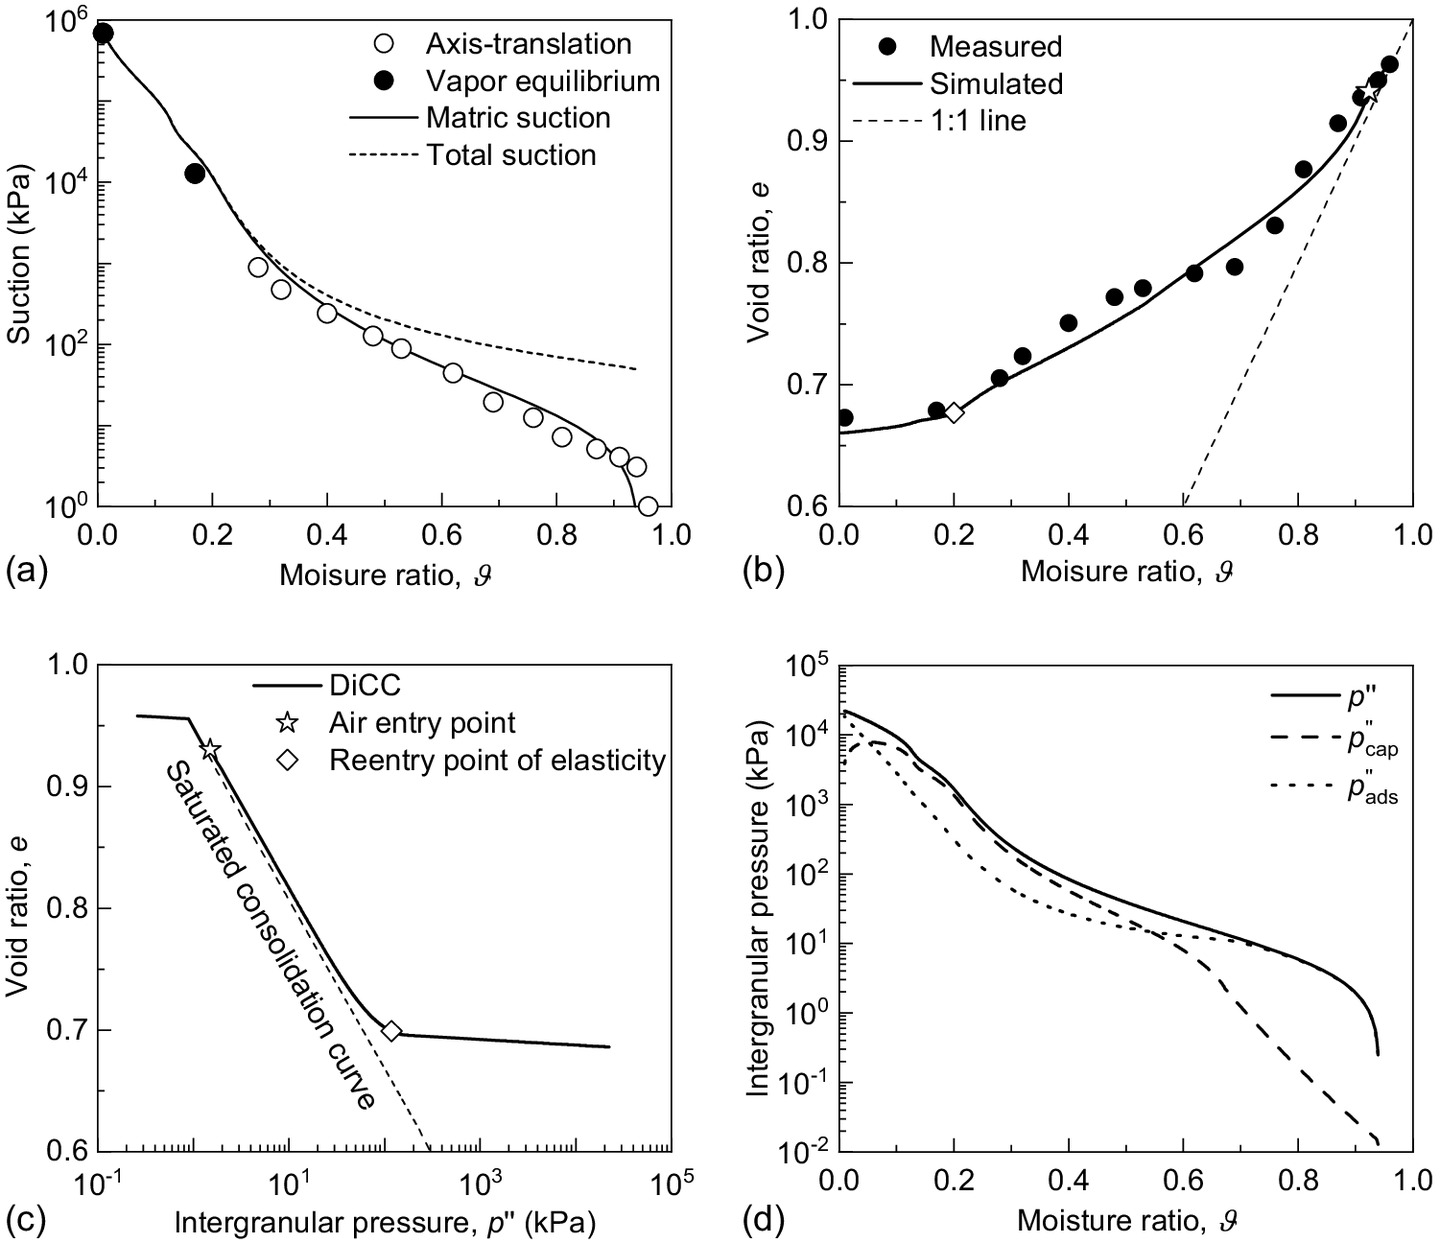
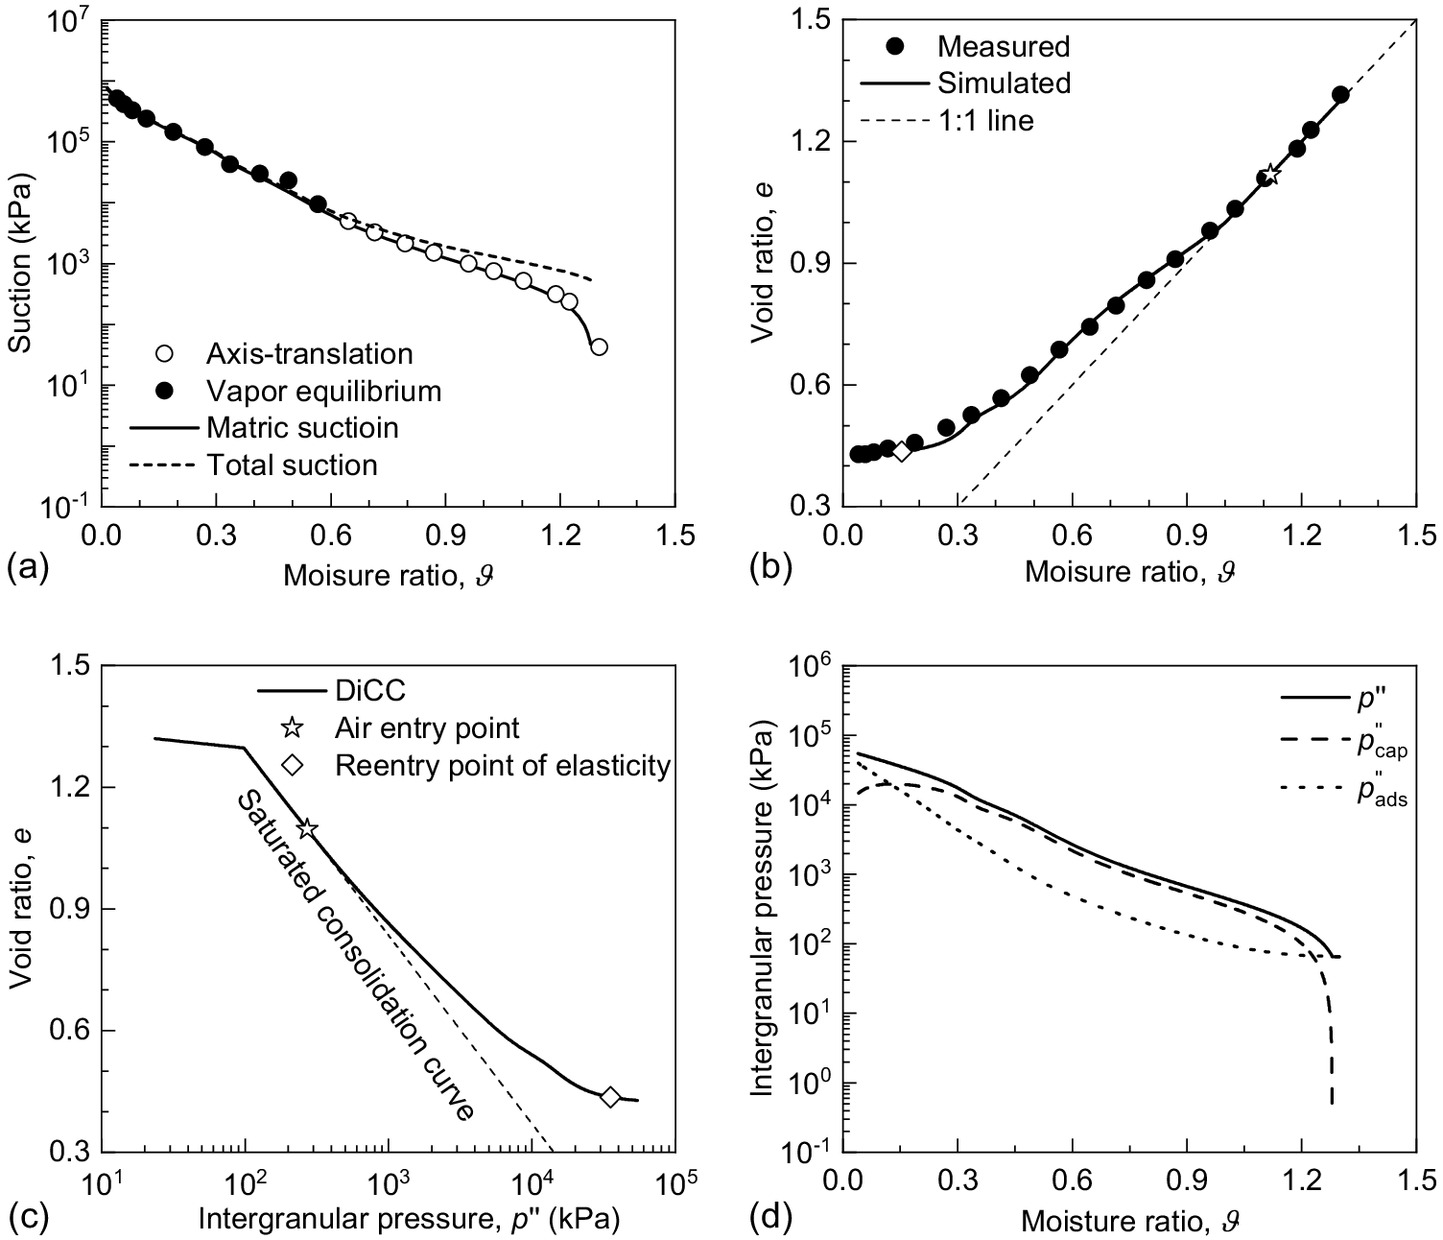
Four chemically active soils, including Missouri clay, Ningming Clay, Denver claystone, and Denver bentonite, are analyzed here. In contrast to the above nonactive soils, these active soils possess a significant amount of fixed charges on the surfaces of soil particles, with nonnegligible CEC. The simulated results for these soils are presented in Figs. 7–10, respectively, in a fashion similar to those for nonactive soils (Figs. 4–6). In simulations, the soil–water retention behavior is represented by a two-section SWRC curve, where total suction is used for high suction (represented by solid dots) and matric suction (empty dots) for low suction. Because the initial salt concentration () of the solution for the tested soils is unknown, it is assumed here, as a first approximation, that . This value of is adjustable so that the best-fitted results are obtained. In simulations, the intergranular stress is calculated by using Eq. (5) for the low-suction regime and Eq. (8) for the high-suction regime. In evaluating and , it is necessary to first determine the fixed charge density (), which can be calculated from the CEC. In general, some exchangeable cations can enter the diffuse double layers, becoming the ionic constituents of the pore solution, and others remain fixed within the stern layer (Mitchell and Soga 2005; Tripathy et al. 2014). As a first approximation, we assume a reduction factor . All the material parameters used in simulations are summarized in Table 2.
| Soils | CEC () | Parameters | ||||||||
|---|---|---|---|---|---|---|---|---|---|---|
| SWRC | Shrinkage model | |||||||||
| () | N | m | κ | a | b | (kPa) | ||||
| Denver claystone | 35 | 0.021 | 1.63 | 0.124 | 0.2 | 0.22 | 0.02 | 0.3 | 2.0 | 1.0 |
| Missouri clay | 20 | 0.08 3 | 1.35 | 0.164 | 0.136 | 0.06 | 0.006 | 0.4 | 5.0 | 1.0 |
| Denver bentonite | 80 | 0.567 | 1.27 | 0.187 | 0.303 | 0.284 | 0.05 | 0.8 | 1.8 | 0.1 |
| Ningming clay | 52 | 0.002 | 1.51 | 0.127 | 0.358 | 0.2 | 0.016 | 0.15 | 2.0 | 1.0 |
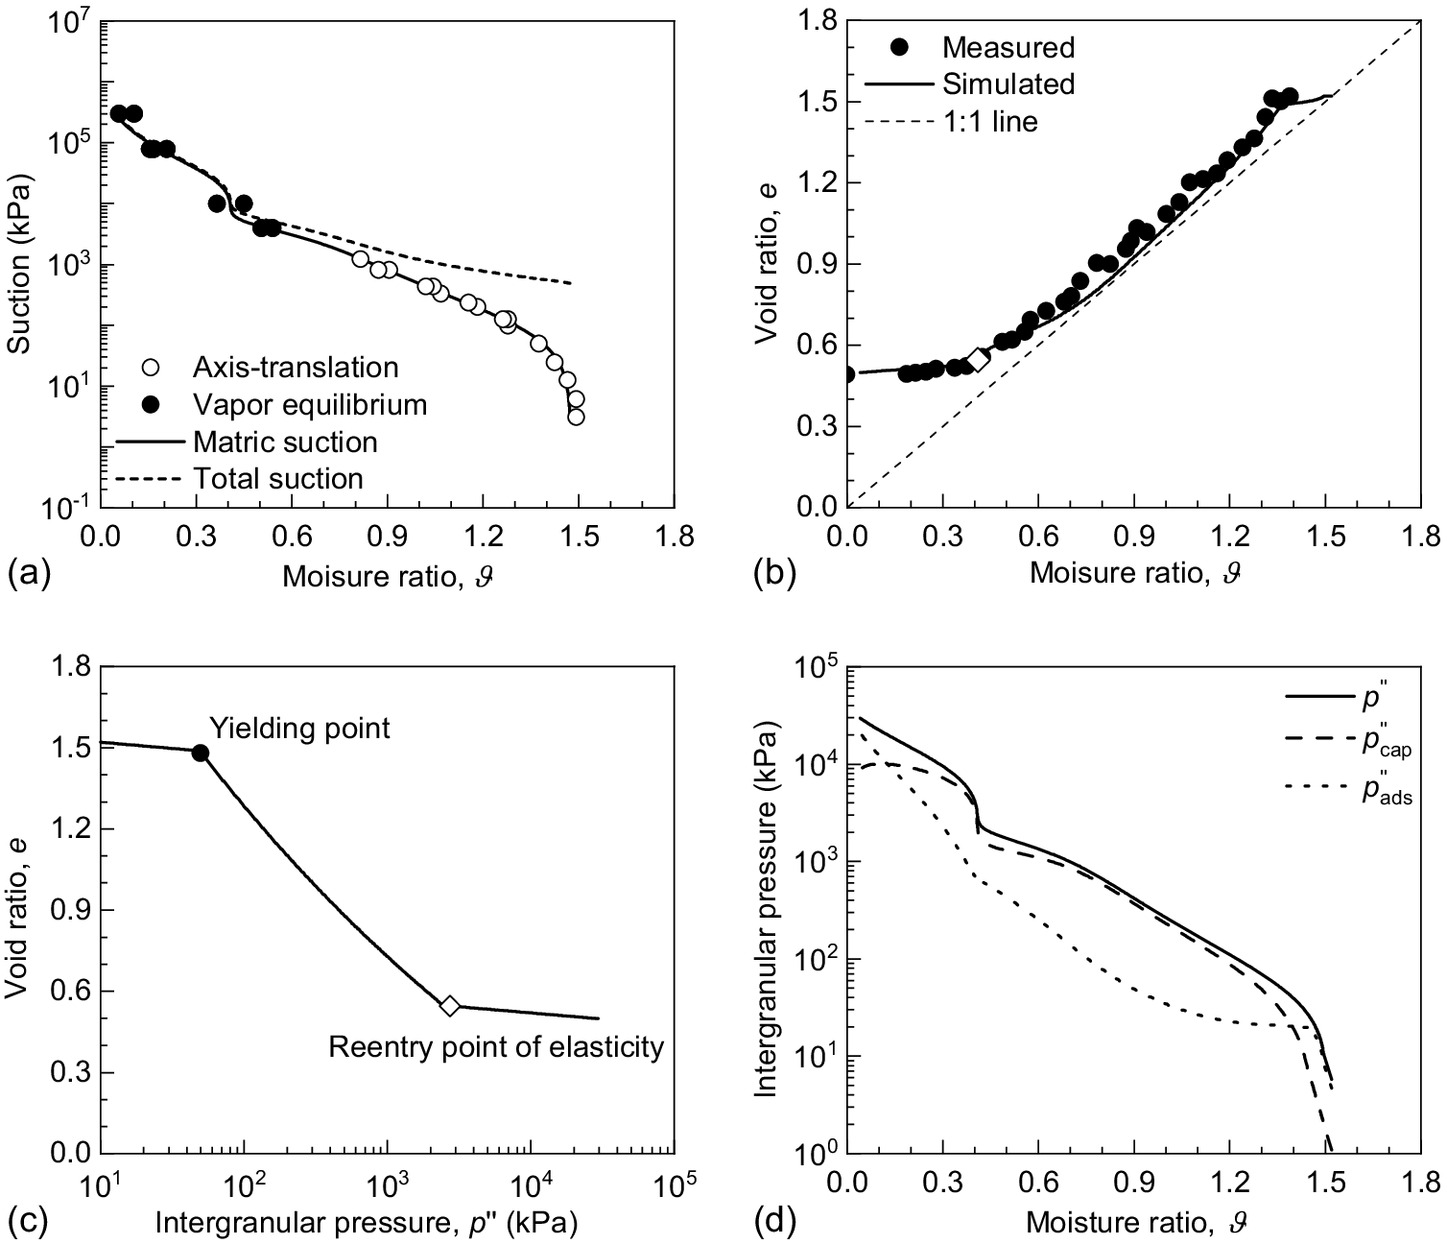
In Fig. 7, the proposed model describes reasonably well the drying-induced shrinkage behavior of Missouri clay, with respect to the SSC. In particular, the model predicts that during the drying process, skeletal deformation is first elastic, then elastoplastic, and finally elastic again. The shrinkage limit, defined roughly as the moisture ratio at the dry end of the elastoplastic regime [denoted by the empty diamond in Fig. 7(c)], can be identified as . In addition, as well described by the model, the soil is fully saturated in the early stage of shrinkage and transits to the partially saturated state. Strikingly, the adsorptive component () of intergranular stress in Missouri soil is larger than the capillary component () at the very beginning of drying, and remains significant through the whole drying process.
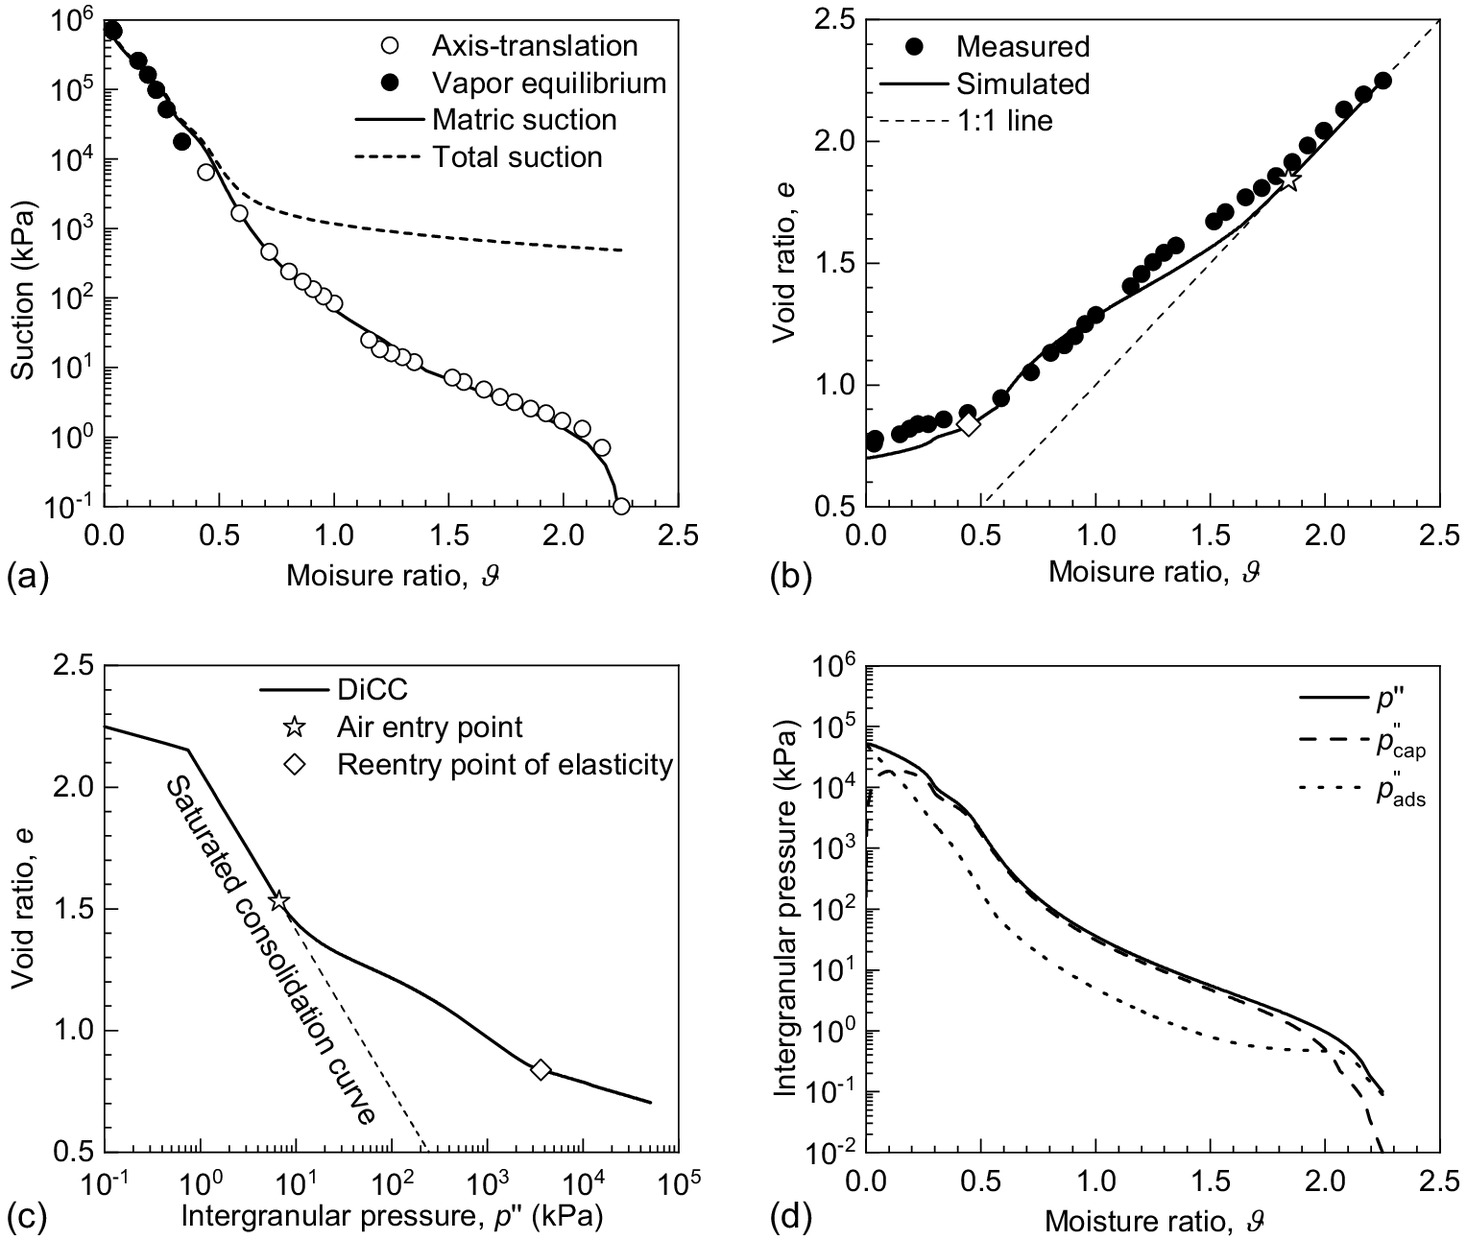
For Ningming clay (Fig. 8), the simulated SSC agrees very well with the experimental data. The proposed model correctly predicts that the soil is fully saturated in the early stage of drying, where the soil transits from the elastic regime into the plastic regime. In addition, the smooth transition between saturation and unsaturation (denoted by the empty star) is also well captured by the proposed model. In this soil, the effect of collapsed void ratio on the strain hardening is more pronounced than that in Missouri clay, as indicated in Fig. 8(c) that the DiCC deviates significantly from the saturated consolidation curve over a wide range of intergranular pressure. Again, the proposed model predicts that [Fig. 8(d)], is larger than in the early stage of drying and remains nonnegligible (accounting for at least 10% of the total intergranular stress) through the whole drying process. At low moisture ratio (), becomes larger than as water content further decreases.
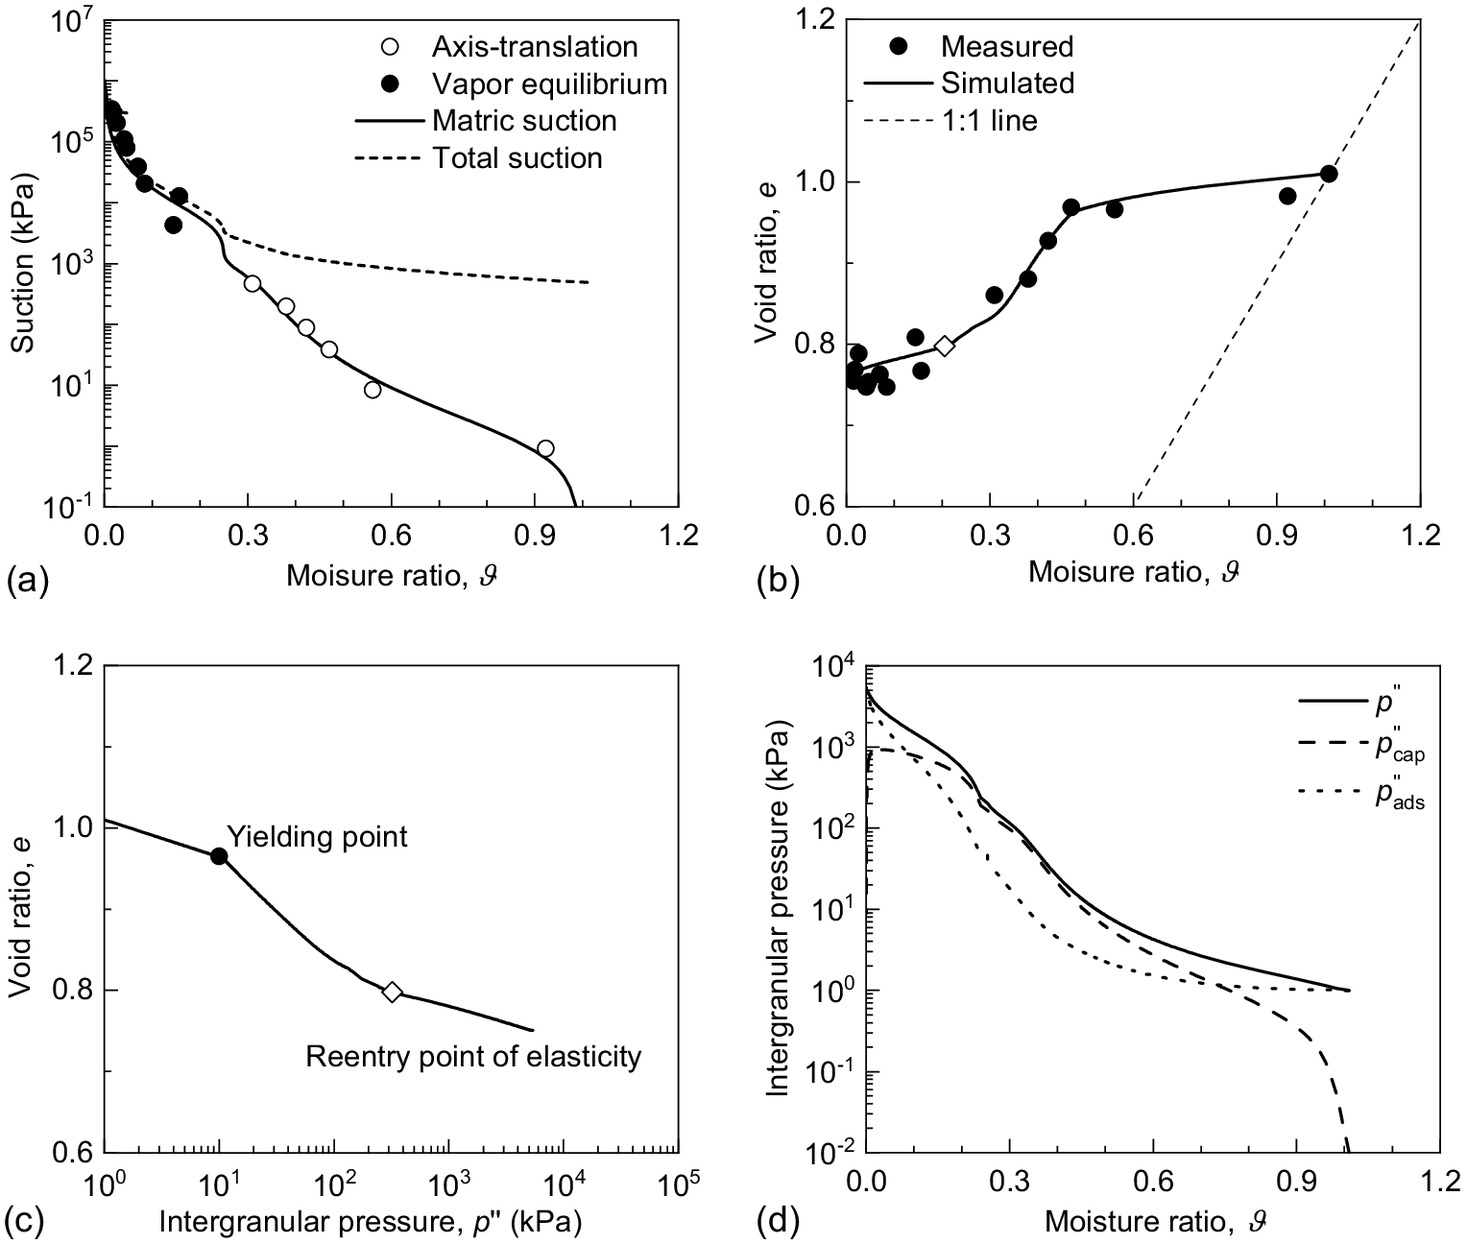
The simulated results for Denver claystone and Denver bentonite are presented in Figs. 8 and 9, respectively. Overall, the proposed model describes reasonably well the shrinkage behaviors of these two soils. Especially, the shrinkage limit is properly identified. It can be seen that the effect of collapsed void ratio on the strain-hardening behavior is also pronounced for these two soils. During the drying process, the soils experience first elastic shrinkage, then elastoplastic compression, and finally elastic shrinkage again toward the dry end. In addition, for these two active soils, the calculated adsorptive component of intergranular stress is larger than the capillary component in the initial stage of drying and remains significant during the whole drying process, in sharp contrast to the cases of nonactive soils where the adsorptive effect is pronounced only at low water content.
From the above simulated results, several salient features of the drying-induced shrinkage behavior of soils can be observed. First of all, for both active and nonactive soils, as water content decreases, the adsorptive component () of intergranular stress constantly increases, while the capillary component () increases first and then decreases at low water content. Second, for active soils, the effect of adsorption remains significant through the whole drying process and, in particular, is larger than at near saturation, while for nonactive soils, becomes significant only at low water content and is negligible at medium to high saturation. In addition, for both active and nonactive soils, the deformation is first elastic, then elastoplastic, and finally elastic. The occurrence of the elastic regime at low water content can be attributed to the evaporation of the tightly adsorbed water in the pore edges in nonactive soils or in the inner part of diffuse double layers in active soils. In this regime, the adsorption and desorption of water are reversible without changing the fabric of the soil, and thus the soil deformation is also reversible.
Structural Soils
Naturally deposited soils always possess some fabrics. Such structural soils exhibit a distinct behavior during drying, known as structural shrinkage, which endows the shrinkage curve with an additional feature. In this section, the capability of the proposed model in describing the shrinkage behavior of structural soils is assessed, by comparing the simulated results with experimental data. The shrinkage behaviors of two structural soils, that is, Regina clay (Fredlund 2018) and clayey silt sand (Salager et al. 2010), are examined in the following. The experimental results had been obtained by performing shrinkage tests on the undisturbed soil samples. The material parameters used in simulations are listed in Table 3. The simulated results are presented in Figs. 11 and 12, where the measured SSCs are also given for comparison.
| Soils | CEC () | Parameters | ||||||||
|---|---|---|---|---|---|---|---|---|---|---|
| SWRC | Shrinkage model | |||||||||
| () | N | m | κ | a | b | (kPa) | ||||
| Regina clay | 30 | 0.01 | 1.35 | 0.05 | 0.41 | 0.3 | 0.02 | 0.3 | 7.0 | 50 |
| Clayey silty sand | 10 | 0.9 | 1.35 | 0.009 | 0.25 | 0.08 | 0.02 | 0.5 | 7.0 | 10 |
Initially, because the soil samples are undisturbed, the preconsolidation pressure (i.e., the yielding stress) is significantly higher than the drying-induced intergranular stress, and thus only elastic deformation occurs in this stage. Once the intergranular stress surpasses the yielding stress, plastic deformation occurs, leading to a fast decrease of void ratio with the decrease of moisture ratio. As the water content decreases to very low values, the shrinkage deformation becomes elastic once again. Overall, the shrinkage curve of structural soil is featured with an “S” shape. The features of the shrinkage behavior of structural soils are very well captured by the proposed model, as indicated in Figs. 11(b) and 12(b). Similar to the cases of active soils, as water content decreases, the adsorptive component, , of intergranular stress increases and finally surpasses the capillary component, , at some low water content, while increases first and then decreases at low water content, where the capillary effect diminishes. Noticeably, an abrupt change occurs in and at some low moisture ratios [Figs. 11(d) and 12(d)]. This can be attributed to the nonsmooth transition between the high suction regime and the low-suction regime in the SWRC [Figs. 11(a) and 12(a)], which is fitted by using a two-section SWRC model.
Compared to the above-analyzed active soils, these two structural soils have relatively small CEC, and thus they show a less significant adsorptive effect. This is visualized by the magnitude of the total suction at low water content [; Figs. 11(a) and 12(a)], which is much less than those of active soils. In addition, at low water content, the intergranular stresses in these two soils [Figs. 11(d) and 12(d)] are also smaller than those in active soils [Figs. 7(d)–10(d)], and much higher than those in nonactive soils [Figs. 4(d)–6(d)]. Although less significant compared to those in active soils, , in these two structural soils is not negligible over all the range of moisture ratio.
The shrinkage limit represents the moisture ratio (or specific water content) at the dry end of the elastoplastic regime during the drying process. At a water content below the shrinkage limit, all the macropores in the soil are empty of water while the majority of micropores remain fully saturated (Liu et al. 2016). Indeed, for various types of soils, the water depletion in macropores is completed at such a low water content (Wang et al. 2020). It was observed that, below the shrinkage limit, soil can still deform slightly with the evaporation of pore water (Dong and Lu 2020). In this stage of shrinkage, the adsorption and desorption of water occur only in fully saturated micropores, so that the skeletal deformation is reversible without changing the fabric of soil. Remarkably, all these features of soil shrinkage are very well captured by the proposed model with the incorporation of the intergranular stress concept.
Conclusions
In this paper, the drying-induced shrinkage behavior of soil is addressed and the underlying mechanisms for the soil shrinkage are explored by developing a simple constitutive model with incorporation of the intergranular stress concept. To this end, an intergranular stress tensor, which lumps all the effects of osmosis, capillarity, and adsorption into a unique effective stress, is first introduced. Then the intergranular stress tensor is cast into a form that is suited for describing the shrinkage behavior of soil. Within the framework of the MCC model, a simple constitutive relationship is developed by virtue of the introduced intergranular pressure. To address the hardening effect of collapsed pores, the degree of gas saturation is introduced as an additional hardening variable. The proposed model is used to simulate the drying-induced shrinkage tests for different types of soils.
It is shown that the proposed model can well describe the drying-induced shrinkage behaviors of reconstituted or undisturbed structural soils, over a wide range of saturation, from nonactive sandy soil to highly active bentonite. In particular, the proposed model can smoothly transit between full saturation and partial saturation. It is also shown that the drying-induced intergranular stress includes two distinct components, which account for the effects of capillarity and adsorption, respectively. The proposed model predicts that, during a drying process, the adsorptive component of intergranular stress constantly increases and surpasses the capillary component at some low water content, while the capillary component increases first and then decreases at low water content.
Remarkably, unlike some common conceptions, it is theoretically revealed that the effects of capillarity and adsorption can be activated, either sequentially or simultaneously, during a drying process, depending upon the soil type. For active soils, the effect of adsorption remains significant through the whole drying process, in contrast to nonactive soils, where the adsorptive effect becomes significant only at low water content and is negligible at medium to high saturation. In general, as water content decreases, the deformation of soil is first elastic, then elastoplastic, and finally elastic. The occurrence of the elastic regime where water content is below the shrinkage limit can be attributed to the evaporation of the tightly adsorbed water in the pore edges in nonactive soils or in the inner part of diffuse double layers in active soils. In this regime, the adsorption and desorption of water are reversible without changing the fabric of the soil, and thus the soil deformation is elastic.
During a drying-induced shrinkage process, the soil experiences both fully and partially saturated states, involving all the effects of capillarity, adsorption, and osmosis. Given all these complexities, the proposed model captures very well the main features of the shrinkage behavior of soil, showing that the intergranular stress tensor can be effectively used to address the hydro-chemo-mechanical behavior of soils under complex loading conditions.
Appendix I. Capillary and Adsorptive Components of Intergranular Stress
To clarify the physical meanings of the other two components of the intergranular stress, one first notes that the differential form of Eq. (2) can be expressed aswhere subscript “” = set of fixed state variables including temperature , mass density , skeletal strain , porosity , and saturation as well as species concentrations (but not ).
(21)
It has been shown that the specific free energy [ ()] of pore water solution can be decomposed as (Wei 2014)where = specific free energy of the bulk solution, with the same and as the pore solution and at the same . Apparently, quantity () denotes the free energy per unit volume of soil, that is, the specific free energy of soil water, while quantity represents the change in the specific free energy of the soil water solely due to the soil–water interaction. Therefore, is the potential of soil–water interaction, whose derivative with respect to equals . Apparently, quantity represents a suction accounting for the soil–water interaction, denoted as . To distinguish from , is called apparent matric suction, which equals , only if (i.e., for nonactive soils).
(22)
In Eq. (21), both and are functions of and other variables. If is replaced by water pressure , by Legendre’s transformation (i.e., ), one may prove that (Wei 2014)where and = Gibbs free energies of pore water and bulk water, respectively. Therefore, can be considered as the excess Gibbs free energy (with respect to that of the bulk water, ) per unit mass of pore water, which can be apparently attributed to the adsorption of pore water onto the particle surfaces of the soil. Hence, can be properly termed as the adsorptive potential of pore water.
(23)
It is clear that the component of intergranular stress is associated with matric suction, which accounts for the capillary effect, while the component represents the contribution of water adsorption (termed as adsorptive pressure). Noticeably, both of these two intergranular pressure components include the effect of Donnan’s osmosis. The inclusion of (or the difference between apparent matric suction and matrix suction ) can be understood by inspecting Eq. (22), which is deduced from a thought experiment (Wei 2014). In this experiment, the pore water in the soil is imaginarily transported from soil pores into a large container at the same elevation under constant-T, constant- and constant- conditions. Apparently, the magnitude of surface potential equals the work required to transport the pore water, thus accounting for the strength of soil–water interaction. In reality, because of the electrically charged nature of the soil, it is impossible to transport pore water under constant- conditions as in the thought experiment. As a consequence, appears.
Appendix II. Derivation of Eqs. (6) and (7)
Without loss of generality, the equilibrium solution is assumed to be an aqueous solution of monovalent salt CA (say NaCl), where cation and anion have a valence number of and , respectively. In the following, subscript “P” indicates the pore water solution in soil, while subscript “E” represents the equilibrium solution. To ensure electrical neutrality in both the pore solution and the equilibrium solution, the concentration of cations must be equal to that of anions. Hence, if the salt concentration of the equilibrium solution is , one obtains and in equilibrium solution, and in pore solutionwhere and = cation and anion concentrations, respectively.
(24)
In equilibrium, the chemical potentials of each species in both the equilibrium solution and the pore solution are equal. It follows that (Wei 2014)where it is assumed that both solutions are ideal and all the activity coefficients equal 1.0. Simultaneously solving Eqs. (24) and (25), one obtains
(25)
(26)
(27)
Hence, for dilute solutions, it follows from van’t Hoff’s equation that
(28)
(29)
Appendix III. An Analytical Model of SWRC
An analytical SWRC model, proposed by Lu (2016), is employed in our calculation. In this model, the moisture ratio () is divided into two components: One is the adsorptive moisture ratio and the other is the capillary moisture ratio , that is
(30)
The adsorptive moisture ratio is determined by using a modified adsorption model, that iswhere = maximum adsorptive moisture ratio; = adsorption strength depending on the types of soil and cation, and = upper bound of matric suction. The capillary moisture ratio is determined by a modified van Genuchten model of SWRC, considering the effect of cavitation and replacing the residual moisture ratio with the adsorptive moisture ratio, that iswhere and = inverse of air-entry suction and the pore size distribution, respectively; and = mean cavitation suction at which capillary water diminishes.
(31)
(32)
Data Availability Statement
All data is available from the corresponding author upon reasonable request.
Acknowledgments
This research was supported by the National Natural Science Foundation of China (NSFC) under Grants 41972290 and 51939011, and all this support is sincerely acknowledged.
References
Al-Mukhtar, M., N. Belanteur, D. Tessier, and S. K. Vanapalli. 1996. “The fabric of clay soil under controlled mechanical and hydraulic stress states.” Appl. Clay Sci. 11 (2–4): 99–115. https://doi.org/10.1016/S0169-1317(96)00023-3.
Baker, R., and S. Frydman. 2019. “Unsaturated soil mechanics: Critical review of physical foundations.” Eng. Geol. 106 (1–2): 26–39. https://doi.org/10.1016/j.enggeo.2009.02.010.
Benchouk, A., F. M. Derfouf, N. Abou-bekr, and S. Taibi. 2013. “Behavior of some clays on drying and wetting paths.” Arab. J. Geosci. 6 (12): 4565–4573. https://doi.org/10.1007/s12517-012-0777-1.
Boivin, P., P. Garnier, and M. Vauclin. 2006. “Modeling the soil shrinkage and water retention curves with the same equations.” Soil Sci. Soc. Am. J. 70 (4): 1082–1093. https://doi.org/10.2136/sssaj2005.0218.
Braudeau, E., J. M. Costantini, G. Bellier, and H. Colleuille. 1999. “New device and method for soil shrinkage curve measurement and characterization.” Soil Sci. Soc. Am. J. 63 (3): 525–535. https://doi.org/10.2136/sssaj1999.03615995006300030015x.
Chen, P., S. Jia, X. Wei, P. Sun, P. Yi, and C. Wei. 2023. “Dependence of shear strength of compacted loess on hydraulic paths.” J. Rock Mech. Geotech. Eng. 15 (7): 1872–1882. https://doi.org/10.1016/j.jrmge.2022.12.006.
Chen, P., and N. Lu. 2018. “Generalized equation for soil shrinkage curve.” J. Geotech. Geoenviron. Eng. 144 (8): 04018046. https://doi.org/10.1061/(ASCE)GT.1943-5606.0001889.
Cornelis, W. M., J. Corluy, H. Medina, J. Diaz, R. Hartmann, M. van Meirvenne, and M. E. Ruiz. 2006. “Measuring and modelling the soil shrinkage characteristic curve.” Geoderma 137 (1–2): 179–191. https://doi.org/10.1016/j.geoderma.2006.08.022.
Coussy, O., P. Dangla, T. Lassabatere, and V. Baroghel-Bouny. 2004. “The equivalent pore pressure and the swelling and shrinkage of cement-based materials.” Mater. Struct. 37 (Jan): 15–20. https://doi.org/10.1007/BF02481623.
Coussy, O., R. Eymard, and T. Lassabatere. 1998. “Constitutive modeling of unsaturated drying deformable materials.” J. Eng. Mech. 124 (6): 658–667. https://doi.org/10.1061/(ASCE)0733-9399(1998)124:6(658).
Cuisinier, O., and L. Laloui. 2004. “Fabric evolution during hydromechanical loading of a compacted silt.” Int. J. Numer. Anal. Methods Geomech. 28 (6): 483–499. https://doi.org/10.1002/nag.348.
Delage, P., and G. Lefebvre. 1984. “Study of the structure of a sensitive Champlain clay and of its evolution during consolidation.” Can. Geotech. J. 21 (1): 21–35. https://doi.org/10.1139/t84-003.
Dong, Y., and N. Lu. 2020. “Measurement of suction stress and soil deformation at high suction range.” Geotech. Test. J. 44 (2): 308–322. https://doi.org/10.1520/GTJ20190357.
Dong, Y., N. Lu, and P. J. Fox. 2020. “Drying-induced consolidation in soil.” J. Geotech. Geoenviron. Eng. 146 (9): 04020092. https://doi.org/10.1061/(ASCE)GT.1943-5606.0002327.
Fleureau, J. M., S. Kheirbek-Saoud, R. Soemitro, and S. Taibi. 1993. “Behavior of clayey soils on drying-wetting paths.” Can. Geotech. J. 30 (2): 287–296. https://doi.org/10.1139/t93-024.
Fredlund, D. G. 2018. “State of practice for use of the soil-water characteristic curve (SWCC) in geotechnical engineering.” Can. Geotech. J. 56 (8): 1059–1069. https://doi.org/10.1139/cgj-2018-0434.
Gawin, D., F. Pesavento, and B. A. Schreffer. 2007. “Modelling creep shrinkage of concrete by means of effective stress.” Mater. Struct. 40 (1): 579–591. https://doi.org/10.1617/s11527-006-9165-1.
Griffiths, F. J., and R. C. Josi. 1989. “Change in the pore size distribution due to consolidation of clays.” Géotechnique 39 (1): 159–167. https://doi.org/10.1680/geot.1989.39.1.159.
Haines, W. B. 1923. “The volume-changes associated with variations of water content in soil.” J. Agric. Sci. 13 (3): 296–310. https://doi.org/10.1017/S0021859600003580.
Hu, L. B., H. Péron, T. Hueckel, and L. Laloui. 2013. “Mechanisms and critical properties in drying shrinkage of soils: Experimental and numerical parametric studies.” Can. Geotech. J. 50 (5): 536–549. https://doi.org/10.1139/cgj-2012-0065.
Leong, E. C., and M. Wijaya. 2015. “Universal soil shrinkage curve equation.” Geoderma 237–238 (5): 78–87. https://doi.org/10.1016/j.geoderma.2014.08.012.
Li, Z. S., F. E. M. Derfouf, A. Benchouk, N. Abou-Bekr, S. Taibi, and J. M. Fleureau. 2017. “Volume change behavior of two compacted clayey soils under hydraulic and mechanical loadings.” J. Geotech. Geoenviron. Eng. 144 (4): 1–14. https://doi.org/10.1061/(ASCE)GT.1943-5606.0001851.
Liu, X., O. Buzzi, S. Yuan, J. Mendes, and S. Fityus. 2016. “Multi-scale characterization of retention and shrinkage behavior of four Australian clayey soils.” Can. Geotech. J. 53 (5): 854–870. https://doi.org/10.1139/cgj-2015-0145.
Lloret, A., and M. V. Villar. 2007. “Advances on the knowledge of the thermo-hydro-mechanical behavior of heavily compacted “FEBEX” bentonite.” Phys. Chem. Earth Parts A/B/C 32 (Apr): 701–715. https://doi.org/10.1016/j.pce.2006.03.002.
Lu, N. 2016. “Generalized soil water retention equation for adsorption and capillarity.” J. Geotech. Geoenviron. Eng. 142 (10): 04016051. https://doi.org/10.1061/(ASCE)GT.1943-5606.0001524.
Lu, N., and Y. Dong. 2017. “Correlation between soil-shrinkage curve and water-retention characteristics.” J. Geotech. Geoenviron. Eng. 143 (9): 04017054. https://doi.org/10.1061/(ASCE)GT.1943-5606.0001741.
Ma, T. T., H. W. Yu, C. F. Wei, P. P. Yi, and C. Q. Yao. 2024. “Physico-chemical effect on the shrinkage of expansive soil.” Rock Soil Mech.
McGarry, D., and K. W. J. Malafant. 1987. “The analysis of volume change in unconfined units of soil.” Soil Sci. Soc. Am. J. 51 (2): 290–297. https://doi.org/10.2136/sssaj1987.03615995005100020005x.
Mitchell, J. K., and K. Soga. 2005. Fundamentals of soil behavior. New York: Wiley.
Monroy, R., L. Zdravkovic, and A. Ridley. 2010. “Evolution of microstructure in compacted London clay during wetting and loading.” Géotechnique 60 (2): 105–119. https://doi.org/10.1680/geot.8.P.125.
Or, D., and M. Tuller. 1999. “Liquid retention and interfacial area in variably saturated porous media: Upscaling from single-pore to sample-scale model.” Water Resour. Res. 35 (12): 3591–3605. https://doi.org/10.1029/1999WR900262.
Peng, X., and R. Horn. 2005. “Modeling soil shrinkage curve across a wide range of soil types.” Soil Sci. Soc. Am. J. 69 (3): 584–592. https://doi.org/10.2136/sssaj2004.0146.
Prost, R., T. Koutit, A. Benchara, and E. Huard. 1998. “State and location of water adsorbed on clay minerals: Consequences of the hydration and swelling shrinkage phenomena.” Clays Clay Miner. 46 (2): 117–131. https://doi.org/10.1346/CCMN.1998.0460201.
Reichenbauer, G., and G. W. Scherer. 2001. “Nitrogen sorption in aerogels.” J. Non-Cryst. Solids 285 (Jun): 167–174. https://doi.org/10.1016/S0022-3093(01)00449-5.
Romero, E. 2013. “A microstructural insight into compacted clayey soils and their hydraulic properties.” Eng. Geol. 165 (Jun): 3–19. https://doi.org/10.1016/j.enggeo.2013.05.024.
Salager S., M. S. EI Youssoufi, and C. Saix. 2010. “Definition and experimental determination of a soil-water retention surface.” Can. Geotech. J. 47 (Apr): 609–622. https://doi.org/10.1139/T09-123.
Schiller, P., T. Bier, M. Wahab, and H.-J. Mögel. 2008. “Mesoscopic model of volume changes due to moisture variations in porous materials.” Colloids Surf., A 327 (1–3): 34–43. https://doi.org/10.1016/j.colsurfa.2008.05.046.
Simms, P. H., and E. K. Yanful. 2001. “Measurement and estimation of pore shrinkage and pore distribution in a clayey till during soil-water characteristic curve tests.” Can. Geotech. J. 38 (4): 741–754. https://doi.org/10.1139/t01-014.
Sivakumar, V., W. C. Tan, E. J. Murray, and J. D. McKinley. 2006. “Wetting, drying and compression characteristics of compacted clay.” Géotechnique 56 (1): 57–62. https://doi.org/10.1680/geot.2006.56.1.57.
Song, Z., T. Ma, G. Cai, Y. Liu, and C. Wei. 2022. “An effective stress-based approach to modeling the hydro-mechanical behavior of unsaturated soils.” Can. Geotech. J. 17 (Nov): 33. https://doi.org/10.1139/cgj-2022-0233.
Sposito, G. 1981. The thermodynamics of soil solutions. Oxford, UK: Oxford University Press.
Sun, W., and Y. Cui. 2018. “Investigating the microstructure changes for silty soil during drying.” Géotechnique 68 (4): 370–373. https://doi.org/10.1680/jgeot.16.P.165.
Tariq, A. U. R., and D. S. Durnford. 1993. “Analytical volume change model for swelling clay soils.” Soil Sci. Soc. Am. J. 57 (5): 1183–1187. https://doi.org/10.2136/sssaj1993.03615995005700050003x.
Trabelsi, H., B. Hadrich, and H. Guiras. 2018. “Evaporation, shrinkage and intrinsic permeability of unsaturated clayey soil: Analytical modelling versus experimental data.” Arabian J. Geosci. 11 (184): 1–14. https://doi.org/10.1007/s12517-018-3507-5.
Tripathy, S., R. Bag, and H. R. Thomas. 2014. “Effect of stern-layer on the compressibility behaviour of bentonites.” Acta Geotech. 9 (Aug): 1097–1109. https://doi.org/10.1007/s11440-013-0222-y.
Wang, Y., Y. J. Cui, A. M. Tang, N. Benahmed, M. Duc, and W. J. Sun. 2020. “Shrinkage behaviour of a compacted lime-treated clay.” Géotech. Lett. 10 (2): 174–178. https://doi.org/10.1680/jgele.19.00006.
Wei, C. F. 2014. “A theoretical framework for modeling the chemomechanical behavior of unsaturated soils.” Vadose Zone J. 13 (9): 1–21. https://doi.org/10.2136/vzj2013.07.0132.
Information & Authors
Information
Published In

Journal of Geotechnical and Geoenvironmental Engineering
Volume 150 • Issue 3 • March 2024
Copyright
This work is made available under the terms of the Creative Commons Attribution 4.0 International license, https://creativecommons.org/licenses/by/4.0/.
History
Received: Jan 3, 2023
Accepted: Oct 31, 2023
Published online: Jan 11, 2024
Published in print: Mar 1, 2024
Discussion open until: Jun 11, 2024
ASCE Technical Topics:
- Adsorption
- Chemical processes
- Chemistry
- Elastic analysis
- Environmental engineering
- Geomechanics
- Geotechnical engineering
- Hydrologic engineering
- Hydrologic properties
- Hydrology
- Material mechanics
- Material properties
- Materials engineering
- Saturated soils
- Shrinkage (material)
- Soft soils
- Soil mechanics
- Soil properties
- Soil stress
- Soil water
- Soils (by type)
- Sorption
- Structural analysis
- Structural engineering
- Water and water resources
- Water content
Authors
Metrics & Citations
Metrics
Citations
Download citation
If you have the appropriate software installed, you can download article citation data to the citation manager of your choice. Simply select your manager software from the list below and click Download.