Long-Term Response of Sand Subjected to Repetitive Simple Shear Loading: Shakedown, Ratcheting, and Terminal Void Ratio
Publication: Journal of Geotechnical and Geoenvironmental Engineering
Volume 149, Issue 6
Abstract
Low-amplitude repetitive drained loading may hinder the long-term performance of engineered and natural systems. This study examines the volumetric and shear response of a uniform quarzitic sand subjected to repetitive drained simple shear loading under constant vertical stress while tracking the evolution of the secant stiffness and the small-strain shear modulus. We explore the effects of initial density, initial shear stress and cyclic shear stress amplitude to identify criteria that can be used to anticipate asymptotic volumetric and shear states. We analyze experimental results in reference to the sand response under monotonic simple shear loading. All specimens evolved toward some asymptotic terminal void ratio when subjected to simple shear cycles. Contractive specimens exhibited unceasing shear strain accumulation and ratcheting when the normalized shear stress exceeded ; on the other hand, dense-dilative specimens exhibited ratcheting only when the normalized shear stress exceeded . The small-strain and the secant shear moduli increased during repetitive shear cycles to reflect early fabric changes followed by abrasion/fretting among enduring contacts. Results obtained in this study allow us to propose simple guidelines to predict the asymptotic shear and volumetric response of uniform sands subjected to repetitive simple shear loading for first-order engineering analyses.
Introduction
Low-amplitude repetitive drained loading may hinder the long-term performance of engineered and natural systems (Lekarp and Dawson 1998; Suiker et al. 2005; Okamoto et al. 2018; Maqsood et al. 2020; Wang et al. 2020; Zhao et al. 2020; Postill et al. 2021). The study of soil responses to repetitive mechanical loads has taken place in the context of highway design (Pell 1973; Sharp and Booker 1984; Brown 1996; Miller et al. 2000; Nowamooz et al. 2013), machine foundations (Anderson 2009), oil platforms (Bjerrum 1966), grain silos (Rahal and Vuez 1998), and wind turbine foundations (White and Lehane 2004; LeBlanc et al. 2010; Cuéllar et al. 2012; Randolph 2012; He et al. 2021).
Strain accumulation during repetitive mechanical loading depends on the cyclic stress amplitude, the initial confinement and shear stress, initial density, and drainage conditions (Wichtmann et al. 2005; Guo et al. 2016; Chang et al. 2017; Cao et al. 2018; Park and Santamarina 2019; Jadid et al. 2020; Pang et al. 2020). In particular, published results revealed that all soils attain a terminal density when subjected to repetitive loads; however, the shear response can either approach stable shakedown or continue accumulating shear deformation in ratcheting mode. Therefore, careful attention is required to identify which conditions can lead to either asymptotic shear response.
This study examines the volumetric and shear response of soils subjected to repetitive drained simple shear loading under constant vertical stress while tracking the evolution of the secant stiffness and the small-strain shear modulus. We place emphasis on asymptotic states to extract robust criteria for engineering analyses. This study starts with a comprehensive review of prior work.
Previous Studies on Repetitive Mechanical Loads
This section defines key concepts and identifies the most important factors that affect the soil response to repetitive mechanical loading. We place emphasis on volumetric and shear strain trends under simple shear boundary conditions.
Volumetric Response
The soil volumetric response evolves toward the terminal void ratio for an infinite number of cycles ( and quadrants in Fig. 1) (Narsilio and Santamarina 2008). This figure shows the critical state line (CSL) for monotonic failure conditions () and asymptotic conditions in repetitive shear loading: shear shakedown or ratcheting () and volumetric strain (terminal void ratio ). This schematic representation assumes that the mean stress remains constant during drained repetitive shear loading.
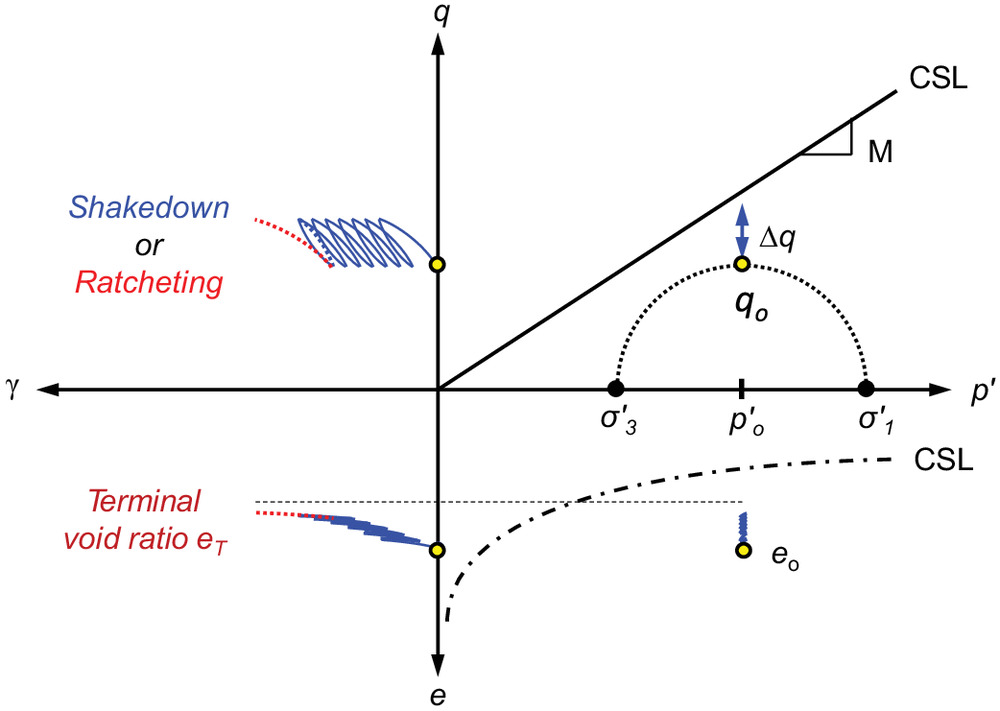
There is a terminal void ratio for each process; in particular, the void ratio at the critical state is the terminal void ratio for monotonic shear loading. The terminal void ratio for soils subjected to repetitive loads may be denser or looser than the critical state (López-Querol and Coop 2012; Park and Santamarina 2020). Under zero-lateral-strain boundary conditions, denser soils experience smaller volumetric strain accumulation (Thom and Brown 1988; Nikitas et al. 2017) and smaller peak-to-peak deformation per cycle; hence, they exhibit a higher resilient modulus (Trollope et al. 1962).
Shear Response
The shear response can either arrest, i.e., shakedown, or continue accumulating indefinitely, i.e., ratcheting deformation ( quadrant in Fig. 1) (García-Rojo and Herrmann 2005; Wichtmann et al. 2005; Pasten et al. 2014). In general, ratcheting prevails at high-stress obliquity (Lekarp and Dawson 1998; Werkmeister et al. 2001).
Initial Stress and Cyclic Stress Amplitude Loading History
The initial normal stress and deviatoric stress (Chang and Whitman 1988; Lekarp and Dawson 1998; Liu et al. 2018; Gu et al. 2020), as well as the cyclic stress amplitudes and , control the accumulation of volumetric and shear strains (Silver and Seed 1971; Drnevich and Richart 1970; Youd 1972; Cai et al. 2015; Klar et al. 2019). Various stress ratios defined in terms of normal effective stress or , shear stress or , or stress obliquity have been used to analyze experimental results including ( quadrant in Fig. 1): [oedometric boundaries (Park and Santamarina 2019)], [undrained triaxial compression (Tatsuoka et al. 1981; Hyde and Ward 1985; Miller et al. 2000)], [undrained cyclic simple shear (Soriano et al. 2011; Wijewickreme et al. 2017)], [undrained cyclic simple shear (Ansal and Erken 1989)], ( [undrained cyclic simple shear (Andersen 2009)], and [drained triaxial compression (Lackenby et al. 2007) and undrained triaxial compression (Licata et al. 2018)]. The various ratios are mathematically related but not equivalent, and they highlight either the stress change in a given cycle or the proximity to failure.
The effect of the loading sequence diminishes when the first loading cycles exhibit the largest amplitude or highest stress obliquity (Stewart 1986; Wichtmann et al. 2009). Miner’s rule is the simplest accumulation model and assumes that the cumulative deformation is independent from the loading history (Miner 1945; Stewart 1986; Kaggwa et al. 1991). Miner’s accumulation is a convenient first-order approximation for various boundary value problems [e.g., axially and horizontally loaded cyclic monopile tests (Cuéllar et al. 2009)].
Soil Characteristics
Particle shape and grain-size distribution affect granular packing; in general, more angular and more uniform soils exhibit higher , , and (Youd 1973; Cho et al. 2006). Therefore, more angular and uniform soils tend to experience higher strain accumulation due to their tendency to form looser initial packings. In addition, angular grains experience higher stress concentrations at particle contacts and contact damage (Shin and Santamarina 2013): cyclic triaxial test data obtained using ballast showed that angular grains become rounder with an increasing number of loading cycles (Sevi and Ge 2012; Indraratna et al. 2016).
Experimental Study
We conducted stress-controlled cyclic simple shear tests with dry sand specimens to identify criteria that can be used to anticipate asymptotic states, i.e., the terminal void ratio and either ratcheting or shakedown. In the absence of stress corrosion, results are equally relevant to saturated sands under drained loading (Oldecop and Alonso 2012; experimental evidence in Moussa 1975; Roshankhah et al. 2021).
Selected Soil and Specimen Preparation
This study used an eolian KAUST 20/30 sand readily found in western Saudi Arabia (with a similar formation and shape as Nevada sand in the US). The X-ray diffraction (XRD) pattern confirmed that KAUST 20/30 sand is a pure silica sand. Furthermore, there was no sign of dissolution in the form of bubbles or mass loss when rained into a HCl solution. Its specific gravity is [ASTM D854 (ASTM 2006b)].
This is a uniform sand with median grain size , coefficient of uniformity [ASTM D6913 (ASTM 2017)], and equivalent particle diameter from image analyses using optical microscopy. The measured average roundness was . Roundness is defined here as the average radius of curvature over the maximum radius of the inscribed sphere. We used a public domain MATLAB code to measure roundness provided by Zheng and Hryciw (2015) and confirmed these values by a visual comparison with shape charts from Krumbein and Sloss (1963). The maximum and minimum void ratios were [ASTM D4253 (ASTM 2006a)] and [ASTM D4254 (ASTM 2016)]. These values are compatible with uniformity and roundness (e.g., the database and trends of Cho et al. 2006).
We prepared dry sand specimens in the simple shear cell and used a precalibrated tamping energy per layer to achieve specimens with the targeted relative densities between and 90%. Specimen dimensions were as follows: diameter and height .
Quasi-Static Stress-Controlled Cyclic Simple Shear
We used a ring-type simple shear cell (Geocomp Sheartrac, Boston) (Fig. 2). The feedback system imposed a predefined shear stress–controlled loading history, and two LVDTs tracked the vertical and horizontal deformations (Fig. 2). The load period was 20 s, with a sampling frequency of for all transducers.
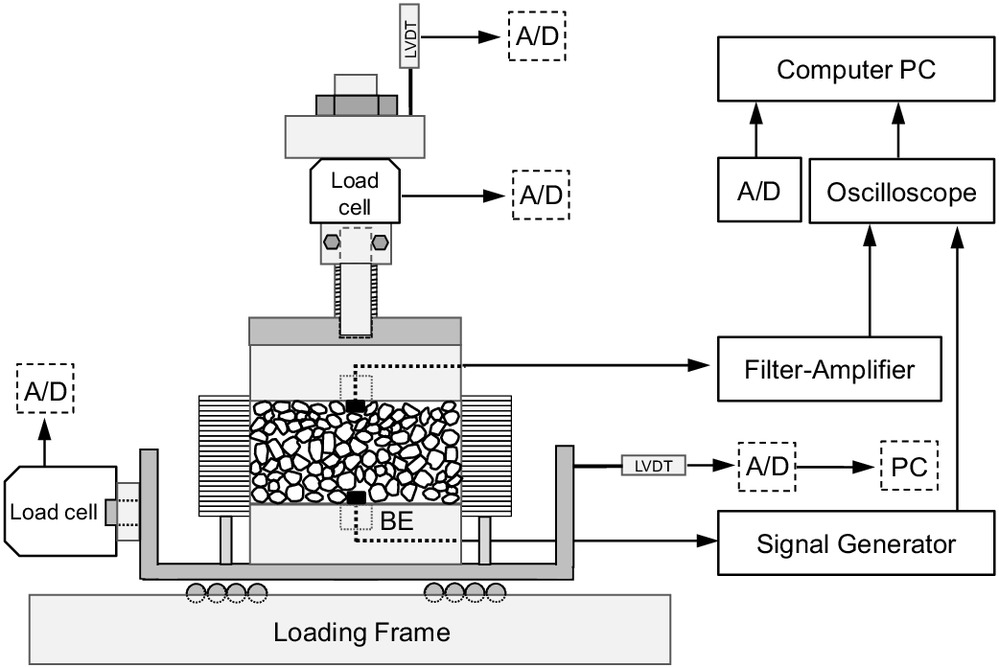
The top and bottom caps incorporated bender elements aligned parallel to the direction of shear (anchor ; cantilever ). We used parallel-type grounded bender elements to prevent crosstalk (Lee and Santamarina 2005). The function generator sent a 10 V step input signal (Keysight 33210A, Santa Rosa, California). The received signal traveled through a filter-amplifier (Krohn-Hite 3364, Boston) (500 Hz high-pass and 200 kHz low-pass) before it reached the digital storage oscilloscope (Keysight DSOX 2014A) (100 MHz). We stacked 1,024 signals to increase the signal-to-noise ratio (Santamarina and Fratta 2005).
This study placed emphasis on repetitive quasi-static drained shear loading with negligible inertial effects. Previous experimental studies with sands revealed that inertia affects strain accumulation if the loading frequency is or the strain rate is (Field et al. 2004; Wichtmann et al. 2005; Karg and Haegeman 2009; Sun et al. 2014). At the particle scale, the inertial number captures the ratio between the particle relaxation time and the macroscopic shear time , where is the shear strain rate, is the grain diameter, is the effective stress, and is the grain density. Numerical results showed that inertia can be neglected when (MiDi 2004; Azéma and Radjai 2014; Hurley and Andrade 2015). All parameters confirmed quasi-static conditions in this study: the frequency was , the strain rate , and the inertial number remained below .
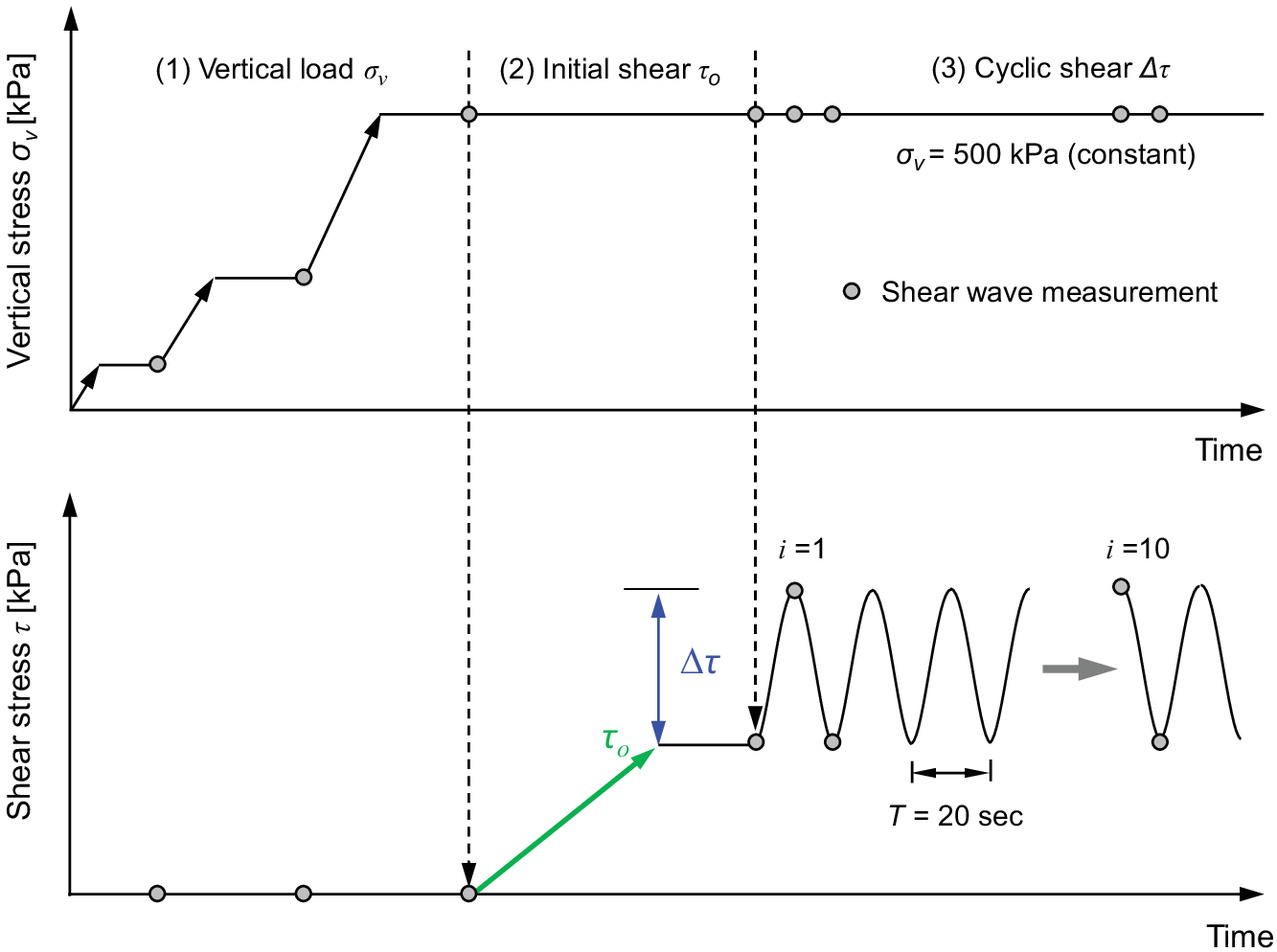
Test Procedure
Low-stress regimes have been explored in the context of traffic loads on granular bases (pavements and railroads) and seismic loads. In this study, we placed emphasis on higher stress regimes such as those created beneath tall buildings and adjacent to monopole foundations for wind turbines (Qi and Gao 2019; Ahmed and Hawlader 2016). All specimens experienced the same loading history (Fig. 3): (1) vertical effective stress to , (2) initial monotonic shear to a preselected (loading ), (3) repetitive simple shear loading cycles with shear stress amplitude for a total of cycles, and (4) final unloading. In the figure, shear-wave velocity was measured during initial vertical loading and at predefined cycle numbers (gray circles). The loading period to avoid dynamic effects. We imposed the vertical load in steps and measured the shear-wave velocity at each load increment (, 3, 5, 10, 20, 40, 80, 150, 300, and 500 kPa) and at preselected cycles (at cycle numbers , 10,30,100, 300, and 1,000) both at peak shear () and at the base shear level ().
Experimental Results
Typical Trends
We conducted 20 tests as part of this study to explore the effects of initial density, initial shear stress, and cyclic shear stress amplitude (Table 1). We labeled specimens as either contractive or dilative by comparing their initial void ratios just before cyclic shear with the void ratio at the asymptotic condition in the monotonic simple shear loading, which is considered herein as the reference state ( at the preselected vertical effective stress used in all tests) (Fig. S1 ).
| Specimen characteristics | Shear stress conditions | Simple shear cycles () | ||||||||||||||
|---|---|---|---|---|---|---|---|---|---|---|---|---|---|---|---|---|
| Void ratio, | Shear strain, | |||||||||||||||
| Static shear before shear cycles relative to ultimate state | Test No. | (%) | Initial shear stress, (kPa) | Shear stress amplitude, (kPa) | (kPa) | |||||||||||
| Contractive | 1 | 37 | 0 | 50 | 50 | 0.657 | 0.656 | 0.649 | 0.8 | 80 | 0.000 | 0.003 | 0.004 | 0.78 | 100 | — |
| Contractive | 2 | 49 | 50 | 50 | 100 | 0.628 | 0.626 | 0.624 | 0.45 | 60 | 0.016 | 0.027 | 0.030 | 0.78 | 100 | 0 |
| Contractive | 3 | 26 | 100 | 50 | 150 | 0.664 | 0.660 | 0.655 | 0.9 | 100 | 0.026 | 0.086 | 0.102 | 0.78 | 40 | — |
| Contractive | 4 | 25 | 150 | 50 | 200 | 0.671 | 0.671 | 0.666 | 0.9 | 200 | 0.068 | 0.145 | 0.164 | 0.78 | 50 | |
| Contractive | 5 | 38 | 170 | 50 | 220 | 0.630 | 0.636 | 0.635 | 0.55 | 60 | 0.101 | 0.219 | 0.305 | 0.68 | 300 | |
| Dilative | 6 | 90 | 170 | 50 | 220 | 0.541 | 0.544 | 0.542 | 0.9 | 100 | 0.041 | 0.067 | 0.071 | 0.78 | 30 | — |
| Dilative | 7 | 86 | 200 | 50 | 250 | 0.564 | 0.554 | 0.553 | 0.78 | 400 | 0.067 | 0.115 | 0.123 | 0.78 | 40 | 0 |
| Dilative | 8 | 84 | 240 | 50 | 290 | 0.573 | 0.583 | 0.586 | 0.78 | 100 | 0.092 | 0.135 | 0.161 | 0.78 | 150 | 0 |
| Contractive | 9 | 28 | 0 | 75 | 75 | 0.673 | 0.671 | 0.657 | 0.78 | 85 | 0.000 | 0.016 | 0.021 | 0.78 | 100 | 0 |
| Contractive | 10 | 28 | 50 | 75 | 125 | 0.694 | 0.689 | 0.676 | 0.78 | 95 | 0.016 | 0.037 | 0.050 | 0.78 | 80 | 0 |
| Contractive | 11 | 28 | 100 | 75 | 175 | 0.685 | 0.682 | 0.671 | 0.6 | 70 | 0.029 | 0.072 | 0.087 | 0.70 | 80 | 0 |
| Contractive | 12 | 30 | 145 | 75 | 220 | 0.679 | 0.679 | 0.676 | 0.78 | 50 | 0.053 | 0.098 | 0.173 | 0.78 | 100 | |
| Dilative | 13 | 90 | 170 | 75 | 245 | 0.557 | 0.559 | 0.558 | 0.78 | 300 | 0.033 | 0.055 | 0.065 | 0.60 | 200 | 0 |
| Dilative | 14 | 90 | 215 | 75 | 290 | 0.566 | 0.575 | 0.578 | 0.55 | 120 | 0.056 | 0.101 | 0.126 | 0.60 | 150 | 0 |
| Contractive | 15 | 29 | 0 | 100 | 100 | 0.666 | 0.660 | 0.639 | 0.78 | 100 | 0.000 | 0.033 | 0.049 | 0.70 | 100 | 0 |
| Contractive | 16 | 29 | 50 | 100 | 150 | 0.664 | 0.658 | 0.637 | 0.73 | 60 | 0.017 | 0.056 | 0.083 | 0.66 | 120 | 0 |
| Contractive | 17 | 29 | 100 | 100 | 200 | 0.668 | 0.670 | 0.658 | 0.9 | 35 | 0.016 | 0.102 | 0.159 | 0.70 | 40 | 0 |
| Contractive | 18 | 29 | 120 | 100 | 220 | 0.685 | 0.684 | 0.684 | 0.78 | 10 | 0.029 | 0.022 | 0.065 | 1.00 | 10 | |
| Dilative | 19 | 90 | 170 | 100 | 270 | 0.540 | 0.552 | 0.550 | 0.78 | 100 | 0.033 | 0.118 | 0.187 | 0.70 | 50 | 0 |
| Dilative | 20 | 90 | 190 | 100 | 290 | 0.564 | 0.590 | 0.597 | 0.78 | 60 | 0.042 | 0.142 | 0.223 | 0.78 | 80 | |
Note: at ; and .
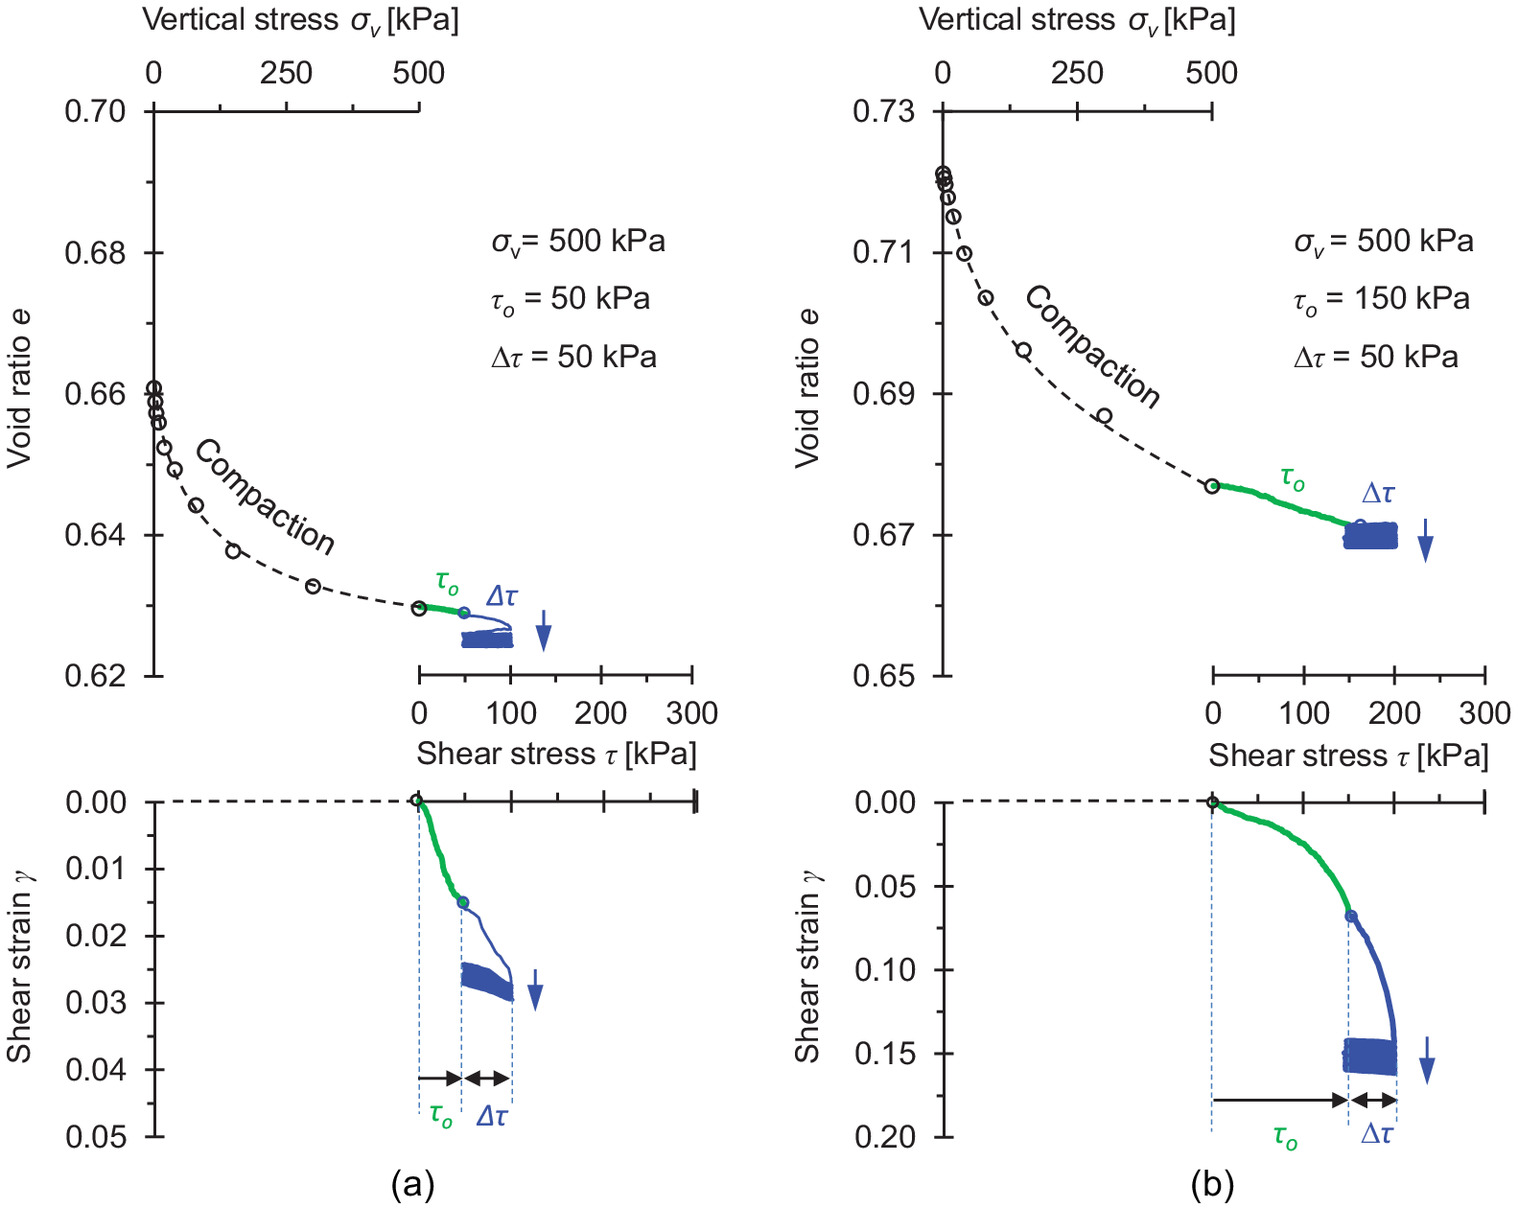
Let us first review the experimental results for two tests in detail to identify salient trends. Fig. 4 shows the change in void ratio and shear strain for medium-density () and loose () sand specimens throughout the loading history. Both specimens are contractive in monotonic shear (Table 1).
The following observations can be made:
•
Vertical loading (): the void ratio decreased and the constrained modulus increased in both specimens during zero-lateral-strain vertical loading. Volume contraction was higher in the looser specimen.
•
Monotonic initial shear : the medium-density sand exhibited an additional reduction in the void ratio (), and the shear strain reached during the application of the initial shear stress to . On the other hand, the initial shear stress imposed on the loose sand caused pronounced volumetric contraction and shear strain .
•
Cyclic shear (): both sands showed the highest shear strain increment during the first load cycle from to . Shear and volumetric strains continued during subsequent shear loading and unloading cycles.
Fig. 5 shows the evolution of the void ratio and shear strain with the number of cycles for the same two specimens introduced in Fig. 4. In Fig. 5, the dotted line indicates the fitted upper and lower accumulation trends. The accumulation model in this figure captures the asymptotic terminal void ratio and shear strain . The superscript for model parameters corresponds to for the lower and for the upper accumulation trends. The subscript indicates 1 for first and for terminal void ratio ratios. Therefore, is the void ratio after first load cycle at loading, is the terminal void ratio at loading, is the void ratio after the first load cycle at unloading, and is the terminal void ratio at unloading.
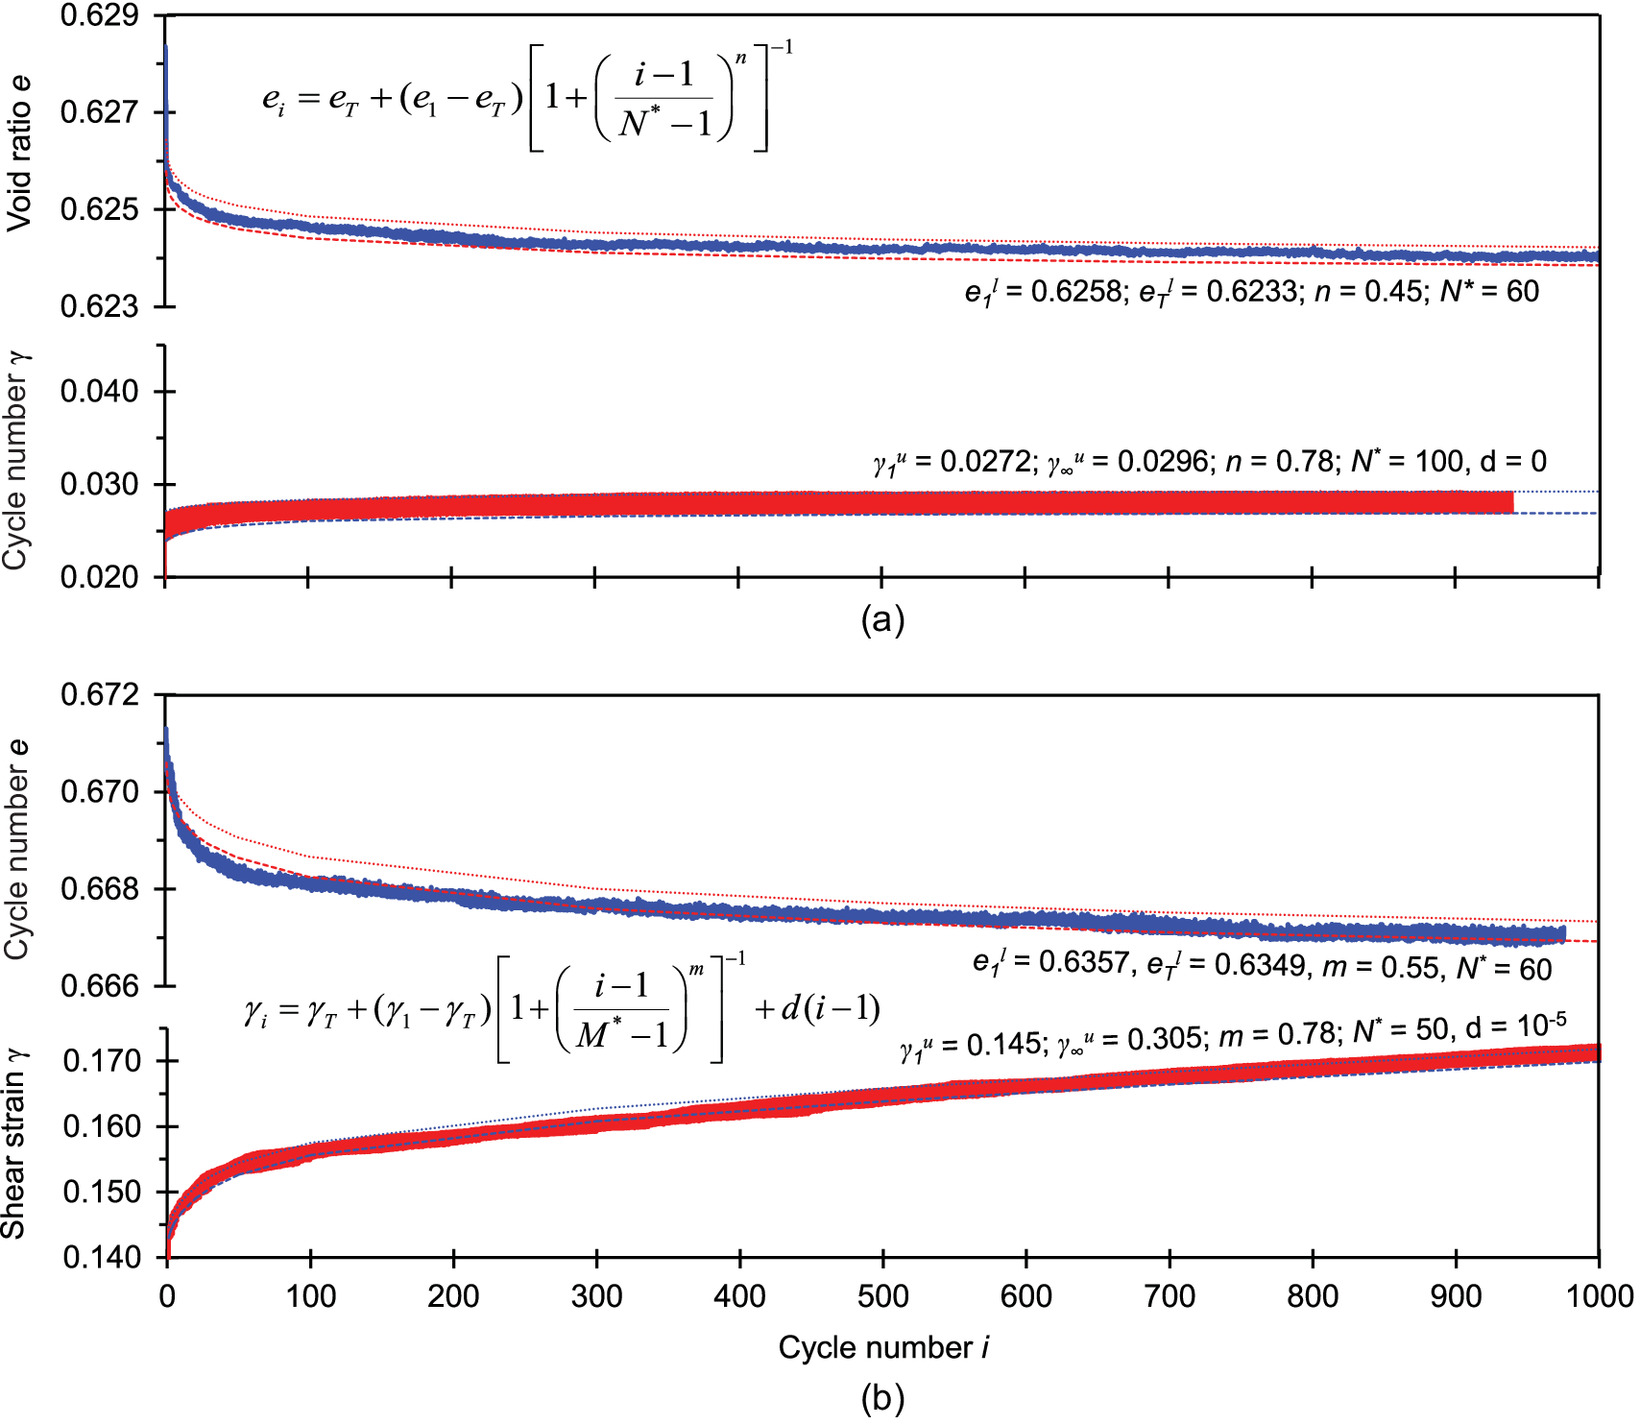
Most changes in the void ratio and shear strain occurred during the earlier loading cycles in both cases. Strains in the medium-density sand tended to stabilize as the number of cycles increases, i.e., shakedown [Fig. 5(a)]. On the other hand, although volume contraction tended to a terminal void ratio in the loose sand specimen, there was ceaseless accumulation of shear strain, i.e., ratcheting [Fig. 5(b)]. Fig. S2 shows shakedown and ratcheting trends in a logarithmic scale to capture both early rapid changes and long-term asymptotes.
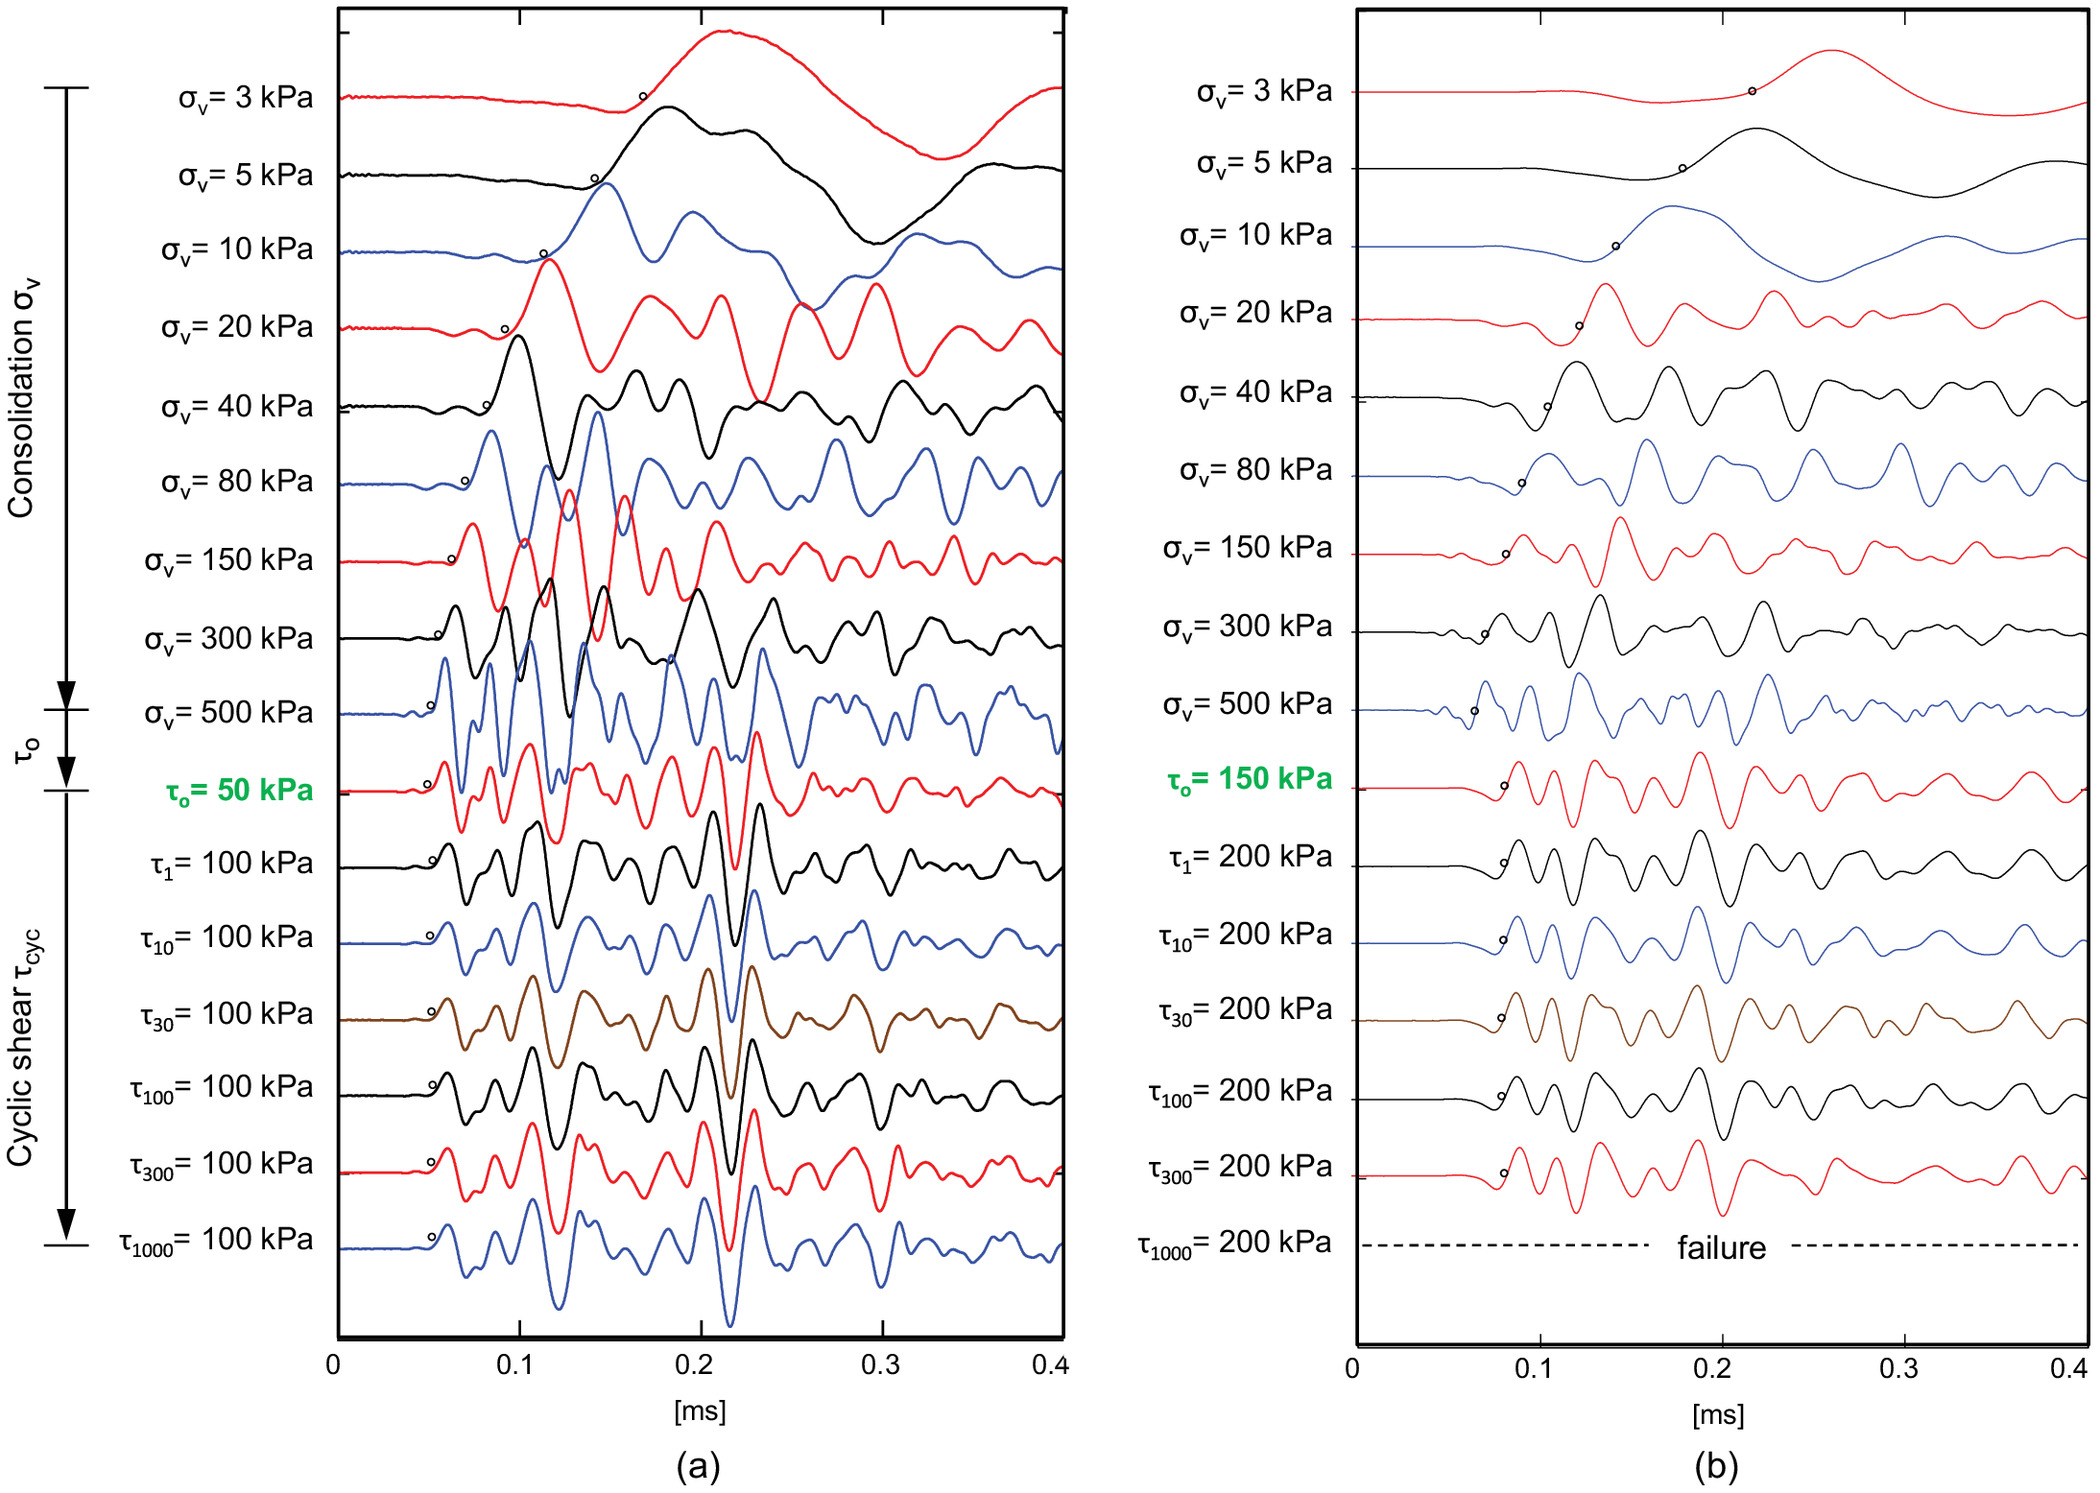
Fig. 6 presents the shear-wave signal cascades for the two specimens discussed previously throughout the three-stage loading sequence (Fig. 3). The first arrival time gradually decreased during vertical loading, reflected the application of the initial shear stress , and experienced a minor decrease in travel time during shear cycles in response to fabric changes.
Complete Data Set
This section presents a comprehensive analysis of the complete data set with an emphasis on volume change and shear deformation accumulation during simple shear cycles (Fig. 1). All test conditions are listed in Table 1.
Effect of Initial Density and Shear Stress
Fig. 7(a) plots the shear strain accumulation and the evolution of the void ratio against cycle number for loose and dense sand specimens subjected to different initial shear stress levels but the same stress amplitude . For clarity, we plot the change in shear strain and in void ratio after the first cycle.
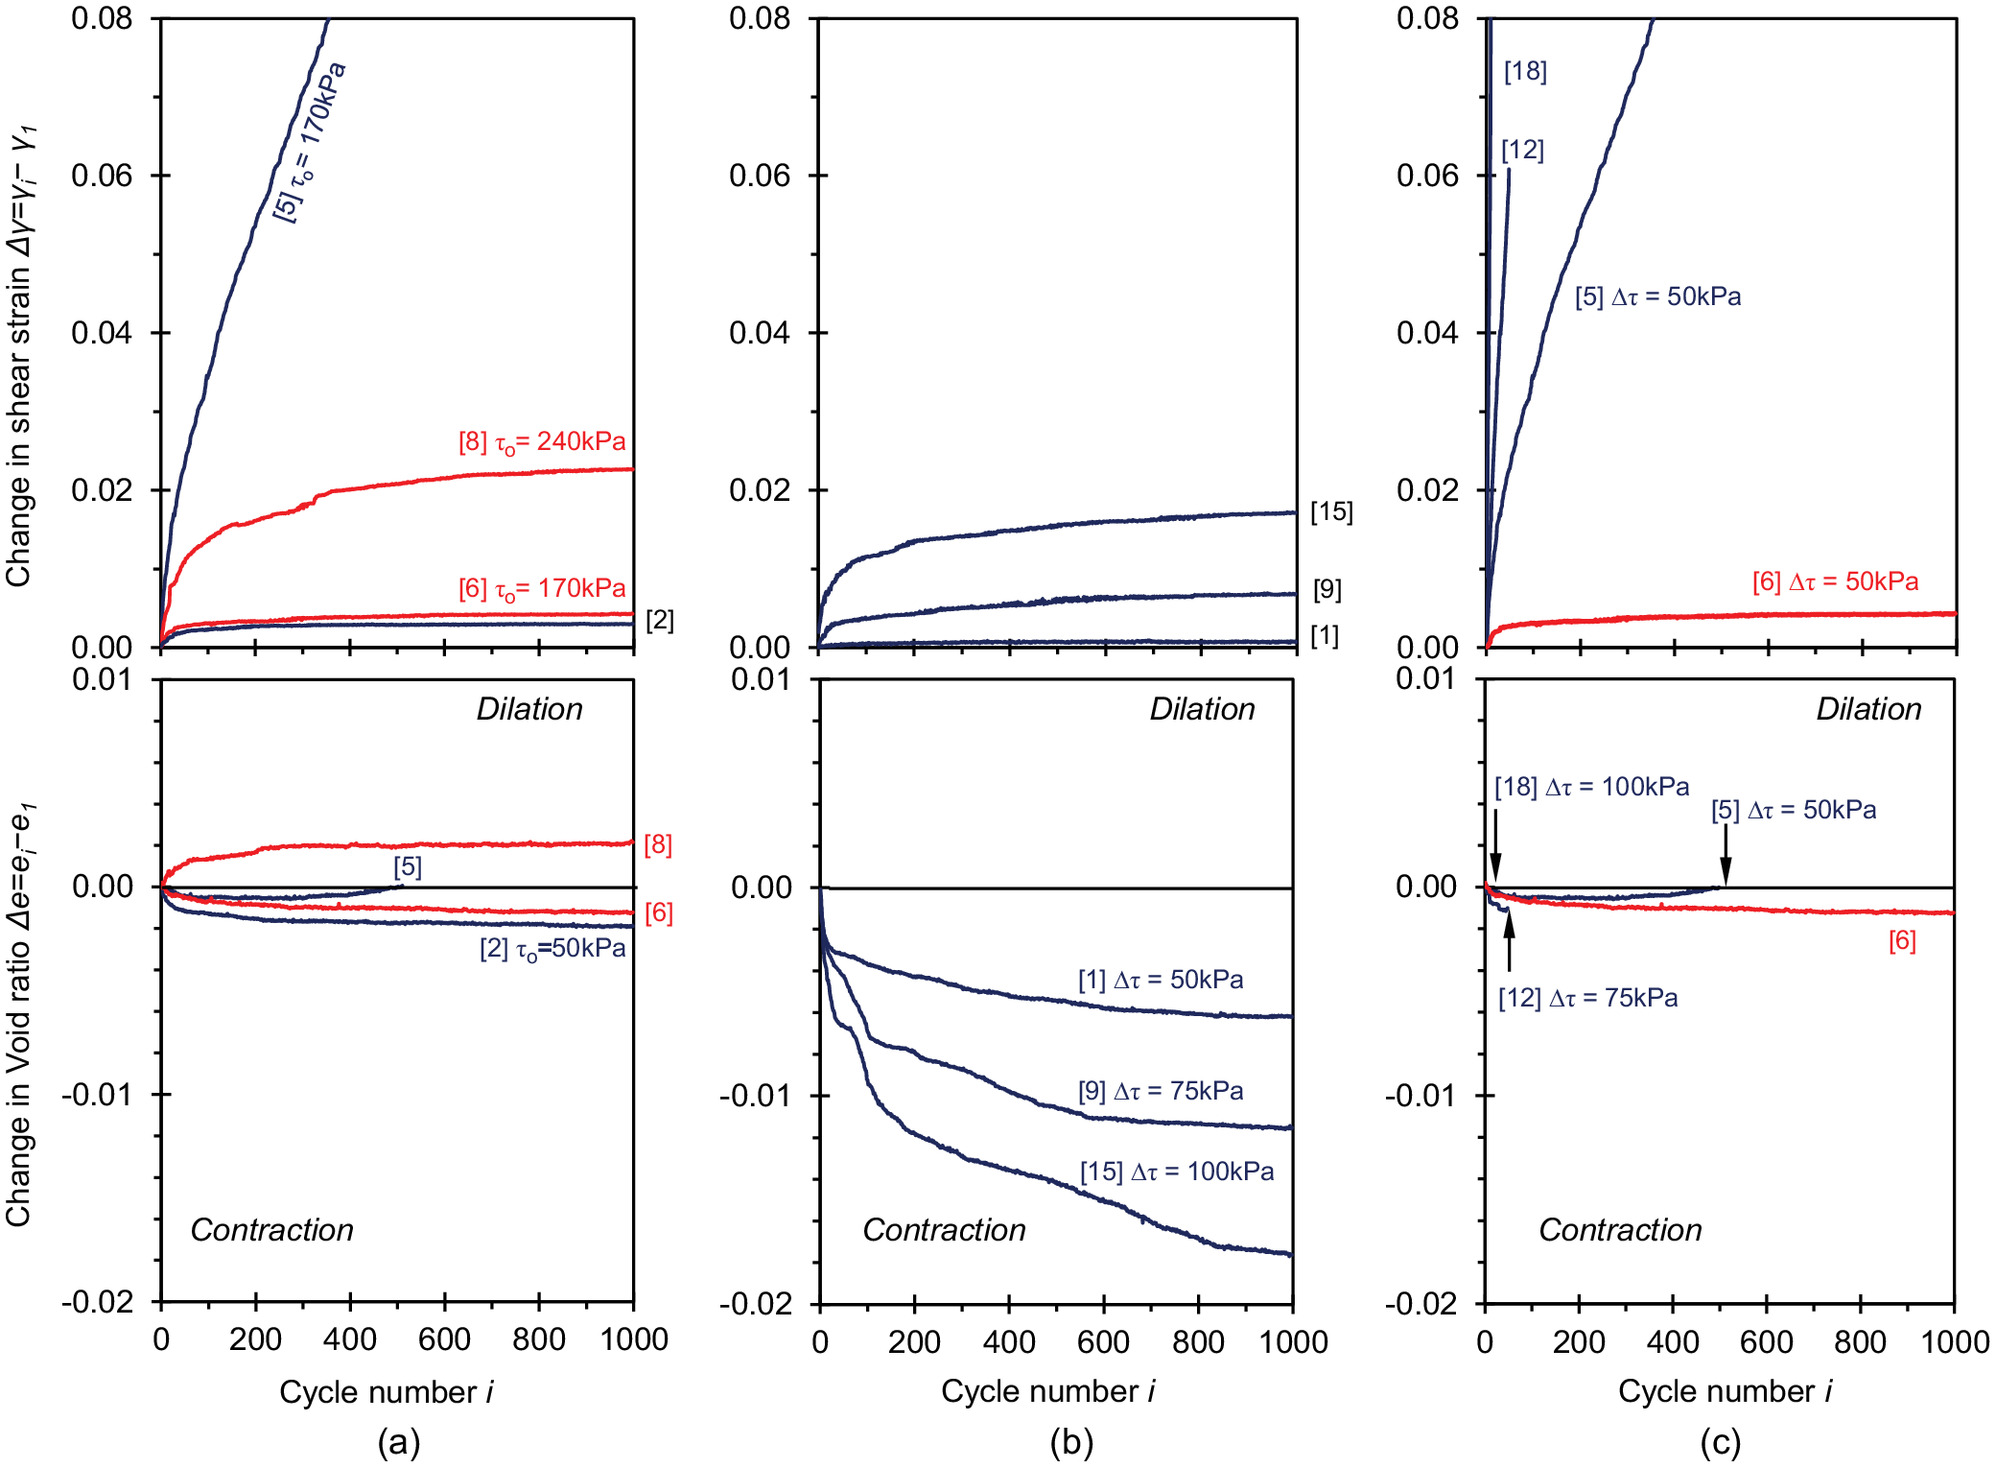
All specimens evolved toward some asymptotic terminal void ratio when subjected to simple shear cycles. Loose contractive specimens, readily contracted during the 1,000 simple shear cycles (Tests 2 and 5). Dilative specimens, i.e., denser than the ultimate state , experienced either contraction if the initial shear stress was low or dilation when the initial shear stress level exceeded the phase transition (Tests 6 and 8) Similar observations were made by Luong (1980) and Narsilio and Santamarina (2008).
Results showed that a higher initial shear stress resulted in more pronounced plastic shear strain accumulation for all specimens during cyclic simple shear loading. Loose specimens at a relatively low initial shear stress level experienced shakedown (e.g., , Test 2); yet a high initial stress level promoted ratcheting (Test 5). By contrast, the dense Specimens 6 and 8 reached asymptotic shear strain even when subjected to high initial shear stress ( and 240 kPa, Tests 6 and 8).
Effect of Shear Stress Amplitude (Same but Different )
Fig. 7(b) compares shear strain and void ratio trends for three loose specimens with similar initial relative density (Tests 1, 9, and 15 with to 37%) and subjected to different cyclic simple shear from zero initial shear stress to reach different maximum obliquities . Although these three specimens reached asymptotic shear strain and terminal void ratios (i.e., shakedown), higher shear stress amplitudes induced larger shear deformation and volume contraction. Similar observations from DEM results have been found by Nguyen et al. (2014).
Effect of Shear Stress Amplitude for Specimens Subjected to High Obliquity
Fig. 7(c) shows the shear strain accumulation and void ratio trends for three loose specimens (Tests 5, 12, and 18) and one dilative specimen (Test 14) subjected to different initial shear stress and cyclic shear stress amplitudes such that all specimens reached the same maximum shear stress (where is the ultimate shear strength obtained in monotonic drained simple shear under ) (Fig. S1 ). All specimens contracted toward distinct asymptotic terminal void ratios [Fig. 7(c)]. Loose specimens ratcheted to failure, and faster shear strain accumulation took place with higher shear stress amplitudes; however, the dense specimen evolved toward shakedown.
Analyses and Discussion
Simple Shear Boundary Condition
The horizontal shear stress remains unknown in conventional simple shear devices, furthermore, we anticipated changes in the horizontal stresses during repetitive shear loading. This situation prevents the computation of stress invariants. Previous efforts to overcome this limitation have considered instrumented shear rings using fiber optics to measure lateral stress and the radial strain field (Uchida et al. 2015; Klar et al. 2019), complementary triaxial and simple shear tests to estimate model parameters (Wood et al. 1979), or assumptions such as coaxiality between principal stresses and strain increments at the maximum shear stress (Li et al. 2018), although this approach may underestimate noncoaxiality and is less accurate when the stress state is lower than the failure state (Li et al. 2021).
We analyzed our monotonic drained simple shear test results using the Li et al. (2018) approach and estimated the stress obliquity at critical state to be , which is similar to the stress obliquity measured for the same sand using triaxial tests (data from Park and Santamarina 2020).
Accumulation Models
We selected an asymptotically correct accumulation model for the void ratio at a given number of cycles in terms of the terminal void ratio at (Pasten et al. 2014; Park and Santamarina 2019) as follows:where = void ratio after the first shear cycle. The -exponent controls convexity, and the reference cycle corresponds to half of the asymptotic compaction . Besides potential strain irregularities in the first experimental cycle (Niemunis et al. 2005), we adopted the void ratio and shear strain end of the first cycle because conventional constitutive models enabled us to anticipate the first load cycle, i.e., the first virgin monotonic loading and unloading. However, standard models cannot capture plastic strain accumulation during consecutive loading cycles when the state of stress remains within the yield surface. Therefore, our analysis focused on the soil response after the first cycle in terms of asymptotically correct strain accumulation models (Figs. 5 and S2 ).
(1)
Similarly, the shear strain accumulation model relates the shear strain after the th cycle to the shear strain after the first cycle (fitting examples are given in Fig. 5) as follows:
(2)
The -exponent captures the strain sensitivity to the number of cycles . The accumulation rate is greater than zero () when the specimen undergoes ratcheting as , and when the specimen experiences shakedown. Under shakedown conditions, is the asymptotic shear strain, and the reference cycle corresponds to a strain accumulation equal to half the ultimate shear strain . Accurate estimates of cyclic strains can be obtained from the fitted accumulation models. Peak-to-peak strain in the th cycle isand plastic strain in the th cycle is
(3)
(4)
Data Requirements: Invertibility
Data sets with a large number of cycles augment the prediction of asymptotic conditions but require long and costly tests. Let us consider Eq. (2) and explore the prediction of the asymptotic shear strain , the -exponent, and the reference cycle as a function of the number of available loading cycles. The data set selected for this analysis corresponds to shakedown, thus . The predicted asymptotic shear strain reached a stable value after cycles [Fig. 8(a)], whereas the inverted -exponent oscillated between 0.5 and 0.7 [Fig. 8(b)] and the reference cycle between 80 and 120 [Fig. 8(c)].
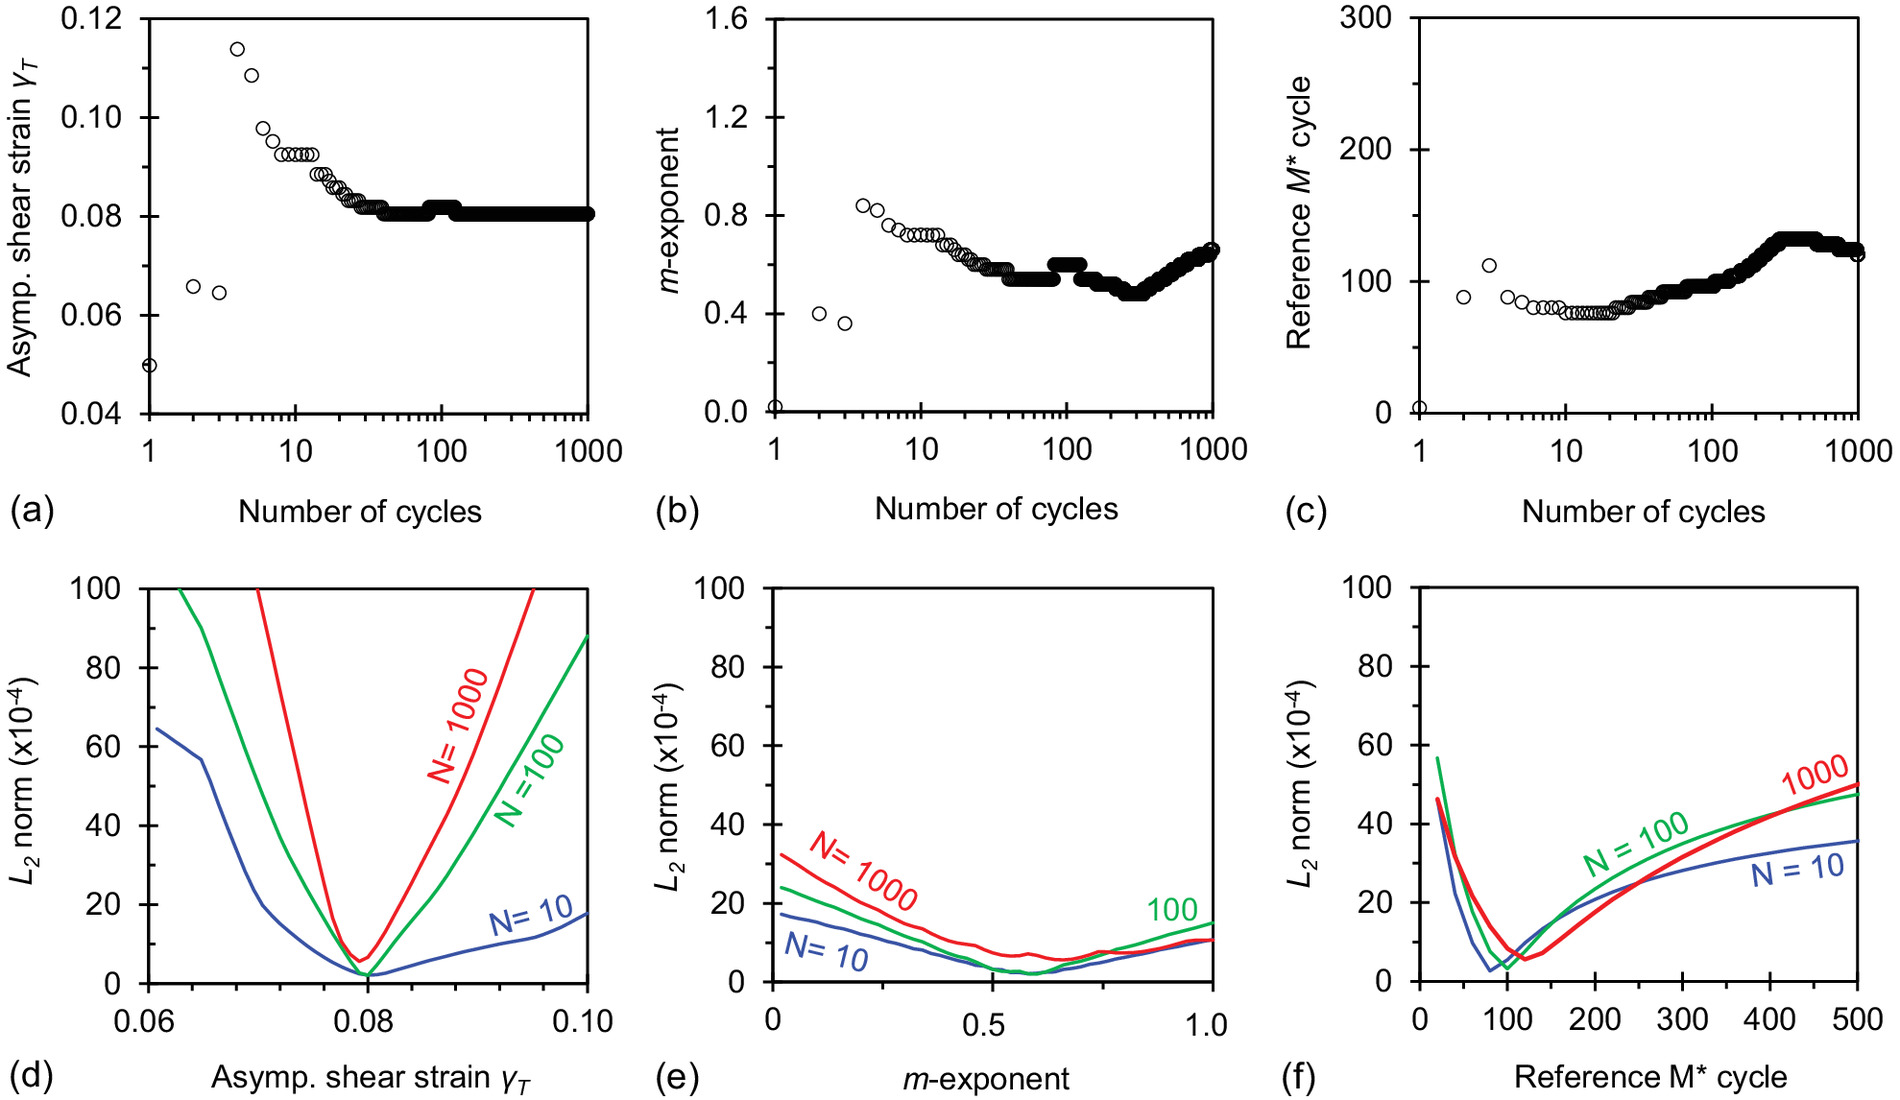
Convergence to the optimum parameter set can be observed by taking slices of the four-dimensional L2 norm across the optimal value for each parameter. Convergence was strongest for the asymptotic shear strain and continued to improve with the number of cycles [Fig. 8(d)]; on the other hand, the total square error L2 was less sensitive to the -exponent and the reference cycle [Figs. 8(e and f)]. We repeated this analysis with all data sets gathered in this study and observed similar trends. In general, we can conclude that the asymptotic strain can be reliably determined with cycles. Table 1 summarizes inverted model parameters using 1,000 loading cycles.
Asymptotic Responses: Shakedown, Ratcheting, and the Terminal Void Ratio
Shakedown/Ratcheting Criteria
Previous studies considered the critical-state framework to identify the shakedown-dominant zone in the space (Lekarp and Dawson 1998; Werkmeister et al. 2001). We use an analogous approach but within the context of simple shear testing, where the ultimate strength measured in monotonic shear becomes the reference value. Then, we can explore the effect of initial obliquity , peak obliquity , and initial density on the sand response to repetitive shear cycles.
Fig. 9(a) plots the potential shear strain change as the number of cycles versus the peak shear stress normalized by the shear stress at the ultimate state for the 20 tests conducted with contractive and dilative specimens. In Fig. 9, blue colors show contractive specimens and red colors show dilative specimens. Initial shear stress and shear stress amplitude are absolute values. Filled symbols indicate data measured in this study. Open symbols indicate triaxial data from the literature. This figure reveals that the contractive specimens exhibited unceasing shear strain accumulation and ratcheting when the normalized shear stress exceeded . On the other hand, dense-dilative specimens exhibited a ratcheting response only when the normalized shear stress exceeded .
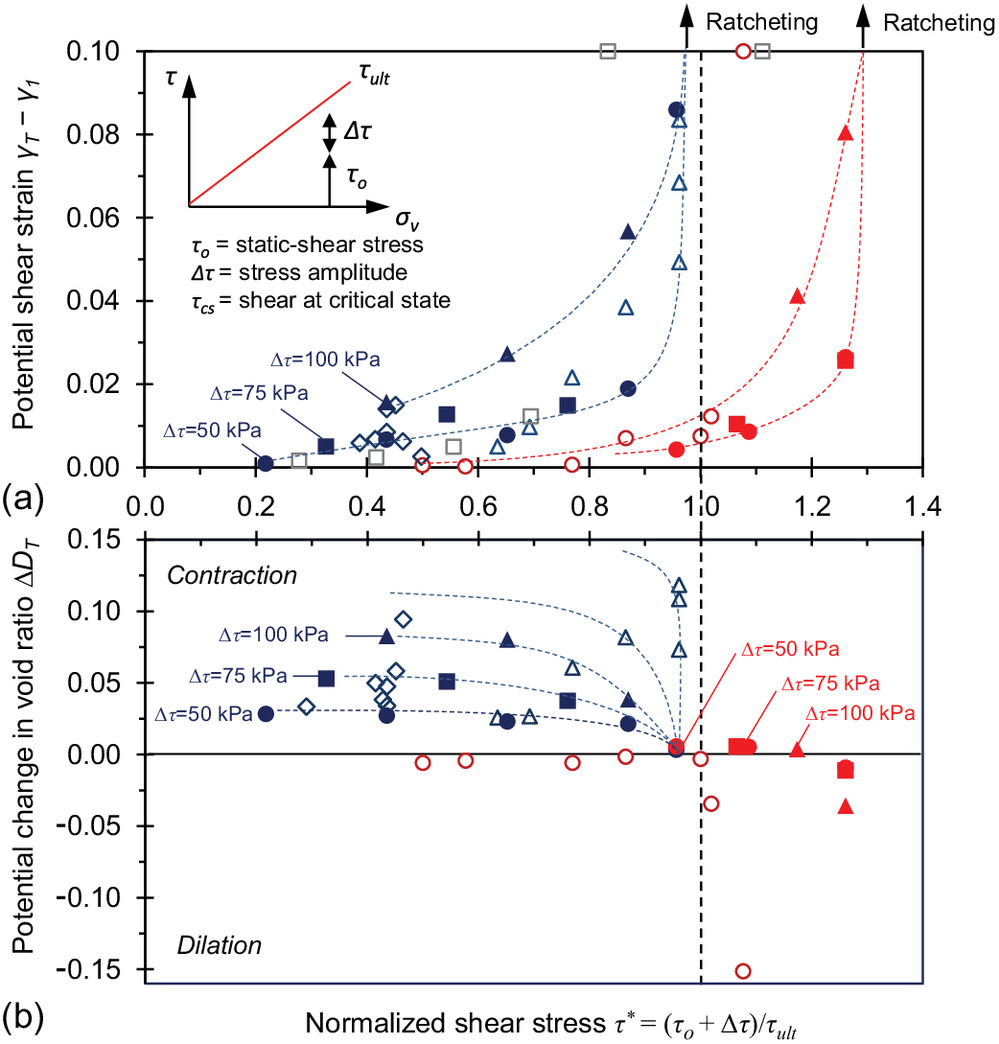
Fig. 9 includes cyclic triaxial test data from published studies. The data set comprised uniform to well-graded silica and carbonate sands of different particle shapes. Rounder and more spherical sands tend to experience larger shear strain accumulation (Whichtmann et al. 2019). Overall, the various data sets showed a similar transition from shakedown to ratcheting response when trends were normalized using the ultimate monotonic stress and extreme void ratios () as reference parameters. These results—albeit limited—confirmed the advantages of normalization when the selected reference parameters are correspondingly affected by particle-scale characteristics.
Potential Volume Change
Fig. 9(b) plots the potential maximum change in void ratios due to cyclic shear from the void ratio at the end of the first cycle to the terminal void ratio as ; The void ratio change () is normalized by the difference in the extreme void ratio () to capture inherent soil properties such as grain-size distribution and particle shape; then, the normalized potential change in void ratio is . In general, contraction was dominant in all loose specimens (blue symbols). The potential volume contraction was highest for high cyclic shear amplitudes , and low-static shear , and decreased as the peak shear stress approached failure [Fig. 7(a)].
Contraction during cyclic shear was also dominant for dense dilative specimens until the normalized shear stress exceeded . Contraction occurred in the dilative specimen when the shear stress was less than the phase-transformation stress level (e.g., Test 6 in this study (Luong 1980; Narsilio and Santamarina 2008). In all cases, the terminal void ratio remained on the same side of the ultimate state for these tests with a relatively low shear strain amplitude. Crossing the ultimate state line is possible; an example has been given by López-Querol and Coop (2012).
Asymptotic Shear Strain and Terminal Void Ratio
Fig. 10(a) shows the asymptotic shear strain against the shear strain after the first cycle , Fig. 10(b) shows the terminal void ratio versus the void ratio after the first cycle . Fig. 10(c) shows the change in the shear strain with respect to the stress amplitude ratio , and Fig. 10(d) shows the change in the void ratio as a function of the stress amplitude ratio . The asymptotic shear strain and terminal void ratio are strongly determined by measurements at the end of the first cycle and . Trends in Figs. 10(a and b) show that factors and are functions of the cyclic stress amplitude as follows:
(5)
(6)
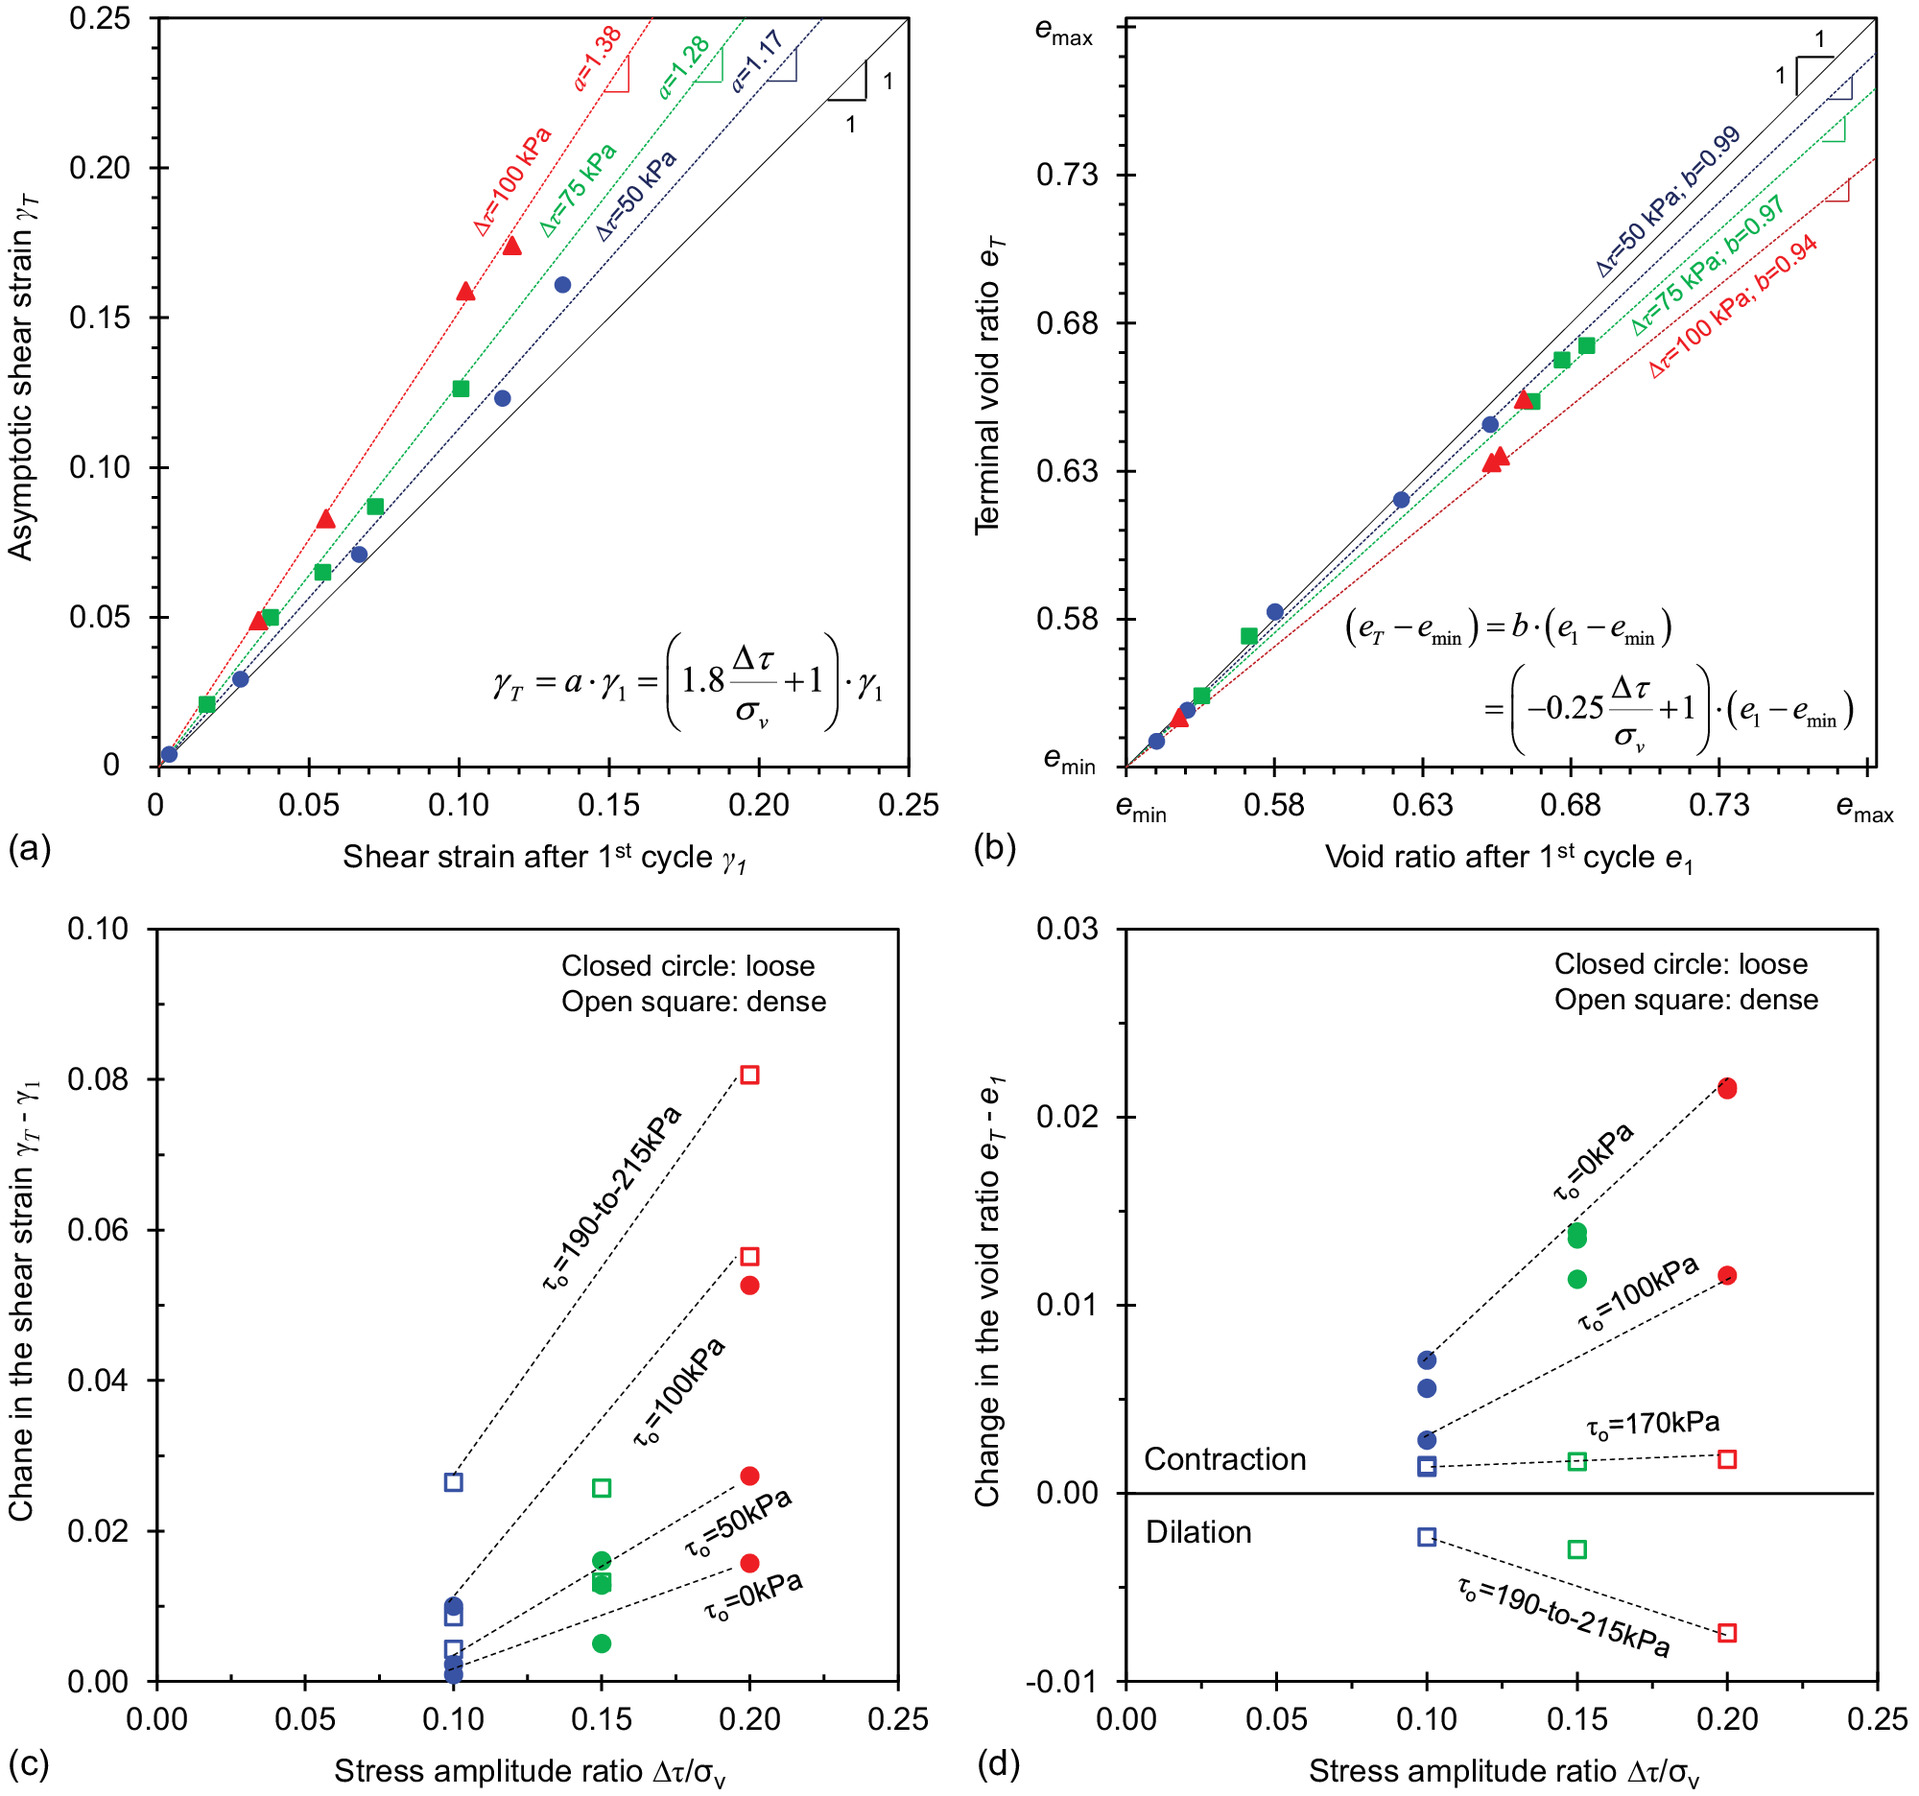
The marked proportionality between and highlights that repetitive shear loading is not sufficient to completely change the original soil fabric, and memory of the initial conditions recorded in and remains even after a large number of shear cycles [a similar observation for oedometric loading was made by Park and Santamarina (2019)]. The cumulative shear and volumetric deformations are proportional to the stress amplitude ratio for a given initial shear stress and relative density .
Changes in Soil Grading
Shear and volumetric deformations reflect underlying particle rearrangement, contact slip, grain rotation, and even particle breakage. The yield stress is an adequate macroscale reference value for particle breakage; however its ad hoc determination hinders comparisons among soils. To overcome this difficulty, we fitted an asymptotically correct hyperbolic compaction model and selected the yield stress at the point of maximum curvature (second derivative).
The yield stress for KAUST 20/30 sand determined under conditions was (Park 2018). Tests conducted at part of this study imposed stress levels much lower than ; hence, particle breakage was not expected; indeed, sieve analyses before and after cyclic simple shear at showed no fines passing sieve No. 30 in all cases.
For comparison, we extended the study of yield stress to a diverse set of sands using published loading data. Results highlighted the prevalent role of mineralogy on the yield stress and showed that the yield stress was lower in angular grains. For example, an angular silica sand made of polycrystalline grains experienced marked particle breakage in triaxial testing at a relatively low mean effective stress [data and microphotographs given by Yu (2017)].
Stiffness Evolution
Concurrent shear-wave velocity and specimen deformation measurements allow for the comparison between the small-strain shear modulus and the secant stiffness . Details are given in the following subsections.
Small-Strain Shear Modulus
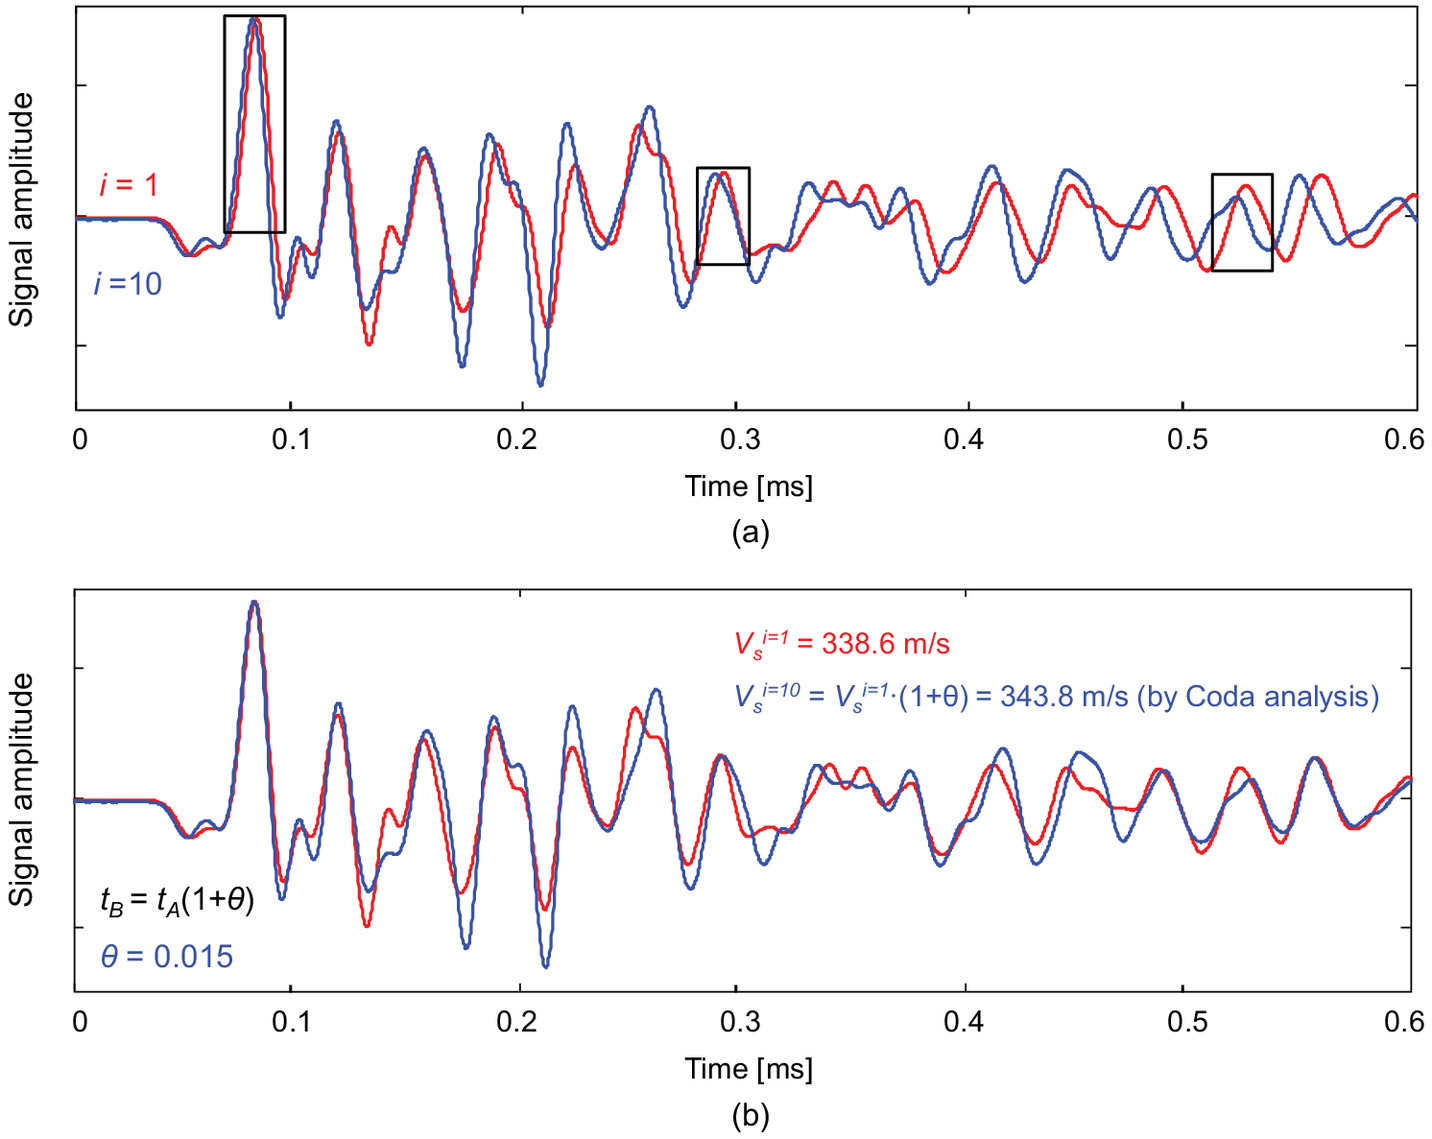
The computation of shear-wave velocity considers the change in travel length during shear loading. Finally, the shear-wave velocity and the soil density determine the small-strain shear modulus as follows:where = mineral specific gravity; = water density; and = void ratio at a given number of cycles . Whereas the void ratio tracks the volume change during the cyclic loads, we also simultaneously measured the shear waves using bender elements installed in the cyclic simple shear caps at preselected cycles. We used Coda wave analysis to detect small changes in travel time for shear-wave signatures recorded during repetitive shear loading [method details have been given by Dai et al. (2013)]. The example in Fig. 11 shows that time-stretching can result in an excellent match between consecutive signatures: the stretching factor that produces the best match was proportional to the change in travel time between the two signals. The time difference between the interpretation using the first arrival time and the Coda wave analysis ranged from 1% to 5% for all tests. Fig. 11 shows S-wave signals gathered during cyclic shear loading after one cycle (red line) and after 10 cycles (blue line). Vertical stress , initial shear stress , and shear stress amplitude .
(7)
Peak-to-Peak Secant Stiffness
Comparison
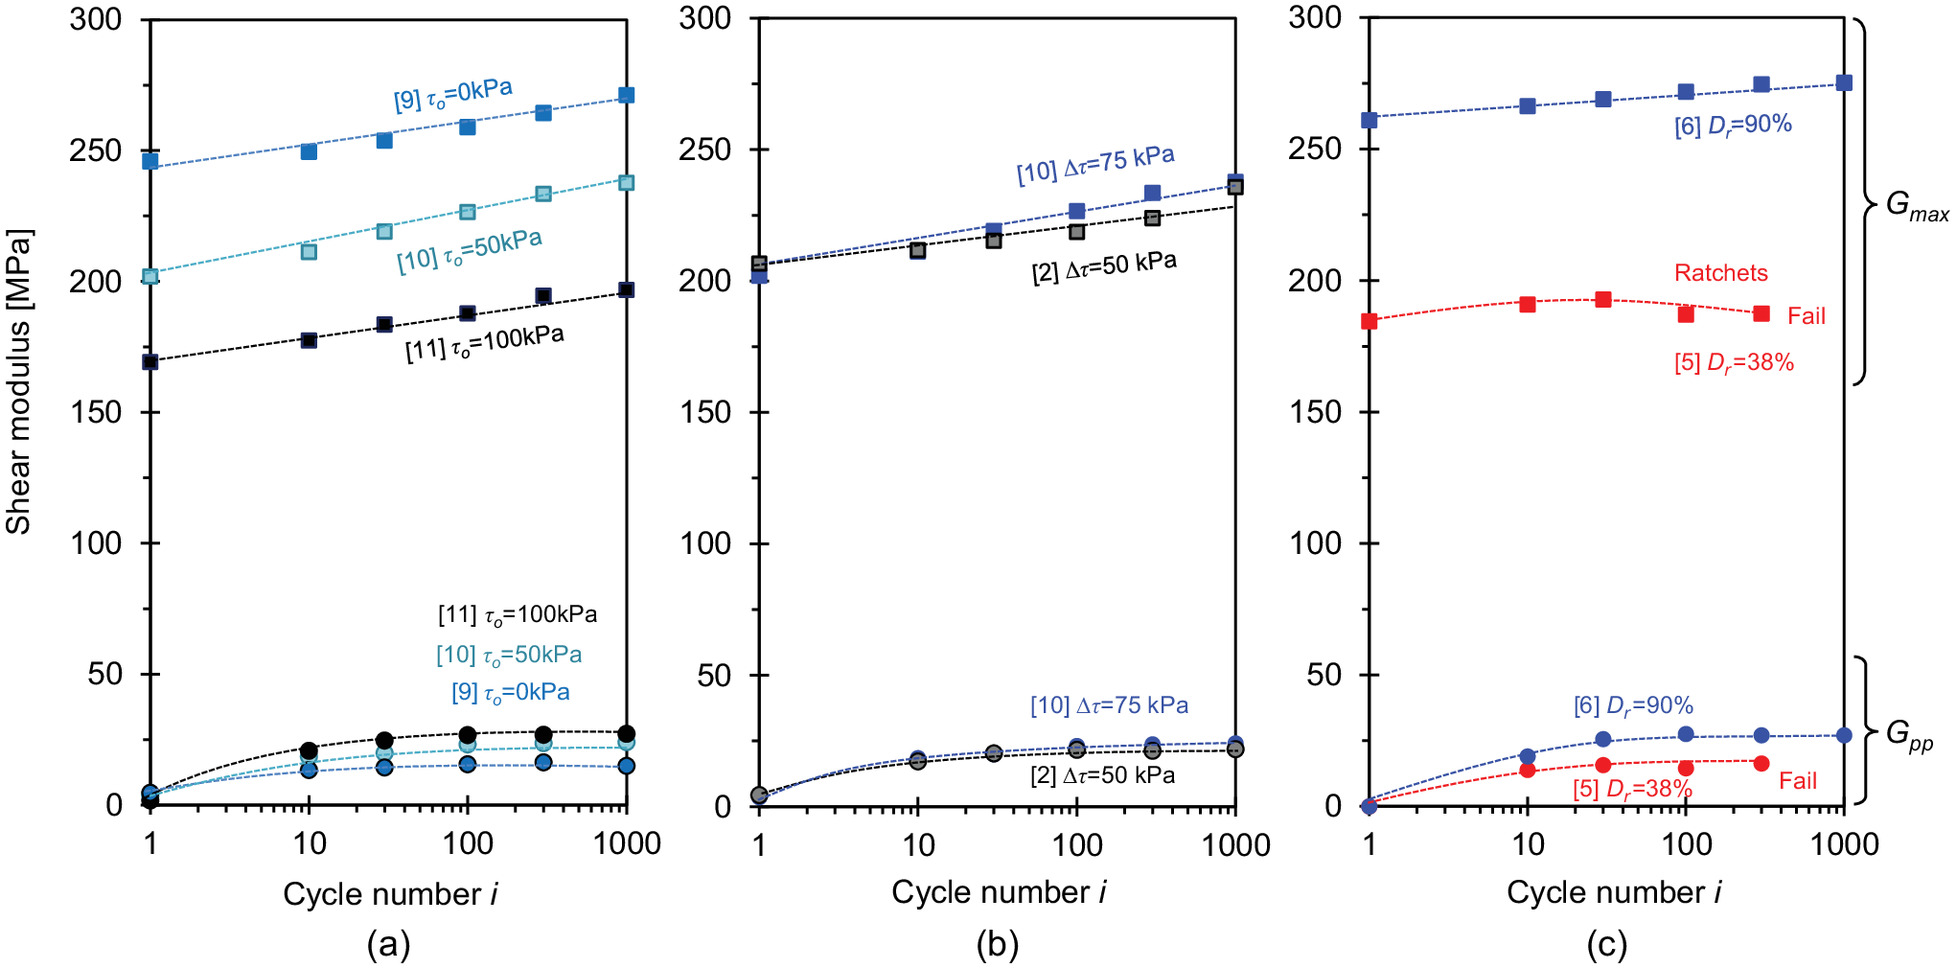
Results in Fig. 12 show that the maximum and secant shear moduli increased during repetitive shear cycles. In particular, the following points can be made:
•
The secant peak-to-peak modulus increased rapidly during the early loading cycles when fabric changes and densification were more pronounced and stabilized thereafter. In fact, the evolution of and the void ratio during cyclic loading defines an inverse relationship between the shear resistance and void ratio (Fig. S3 ).
•
On the other hand, increased linearly with the log of the number of cycles in all specimens that experience shakedown, where per log cycle. decreased as Specimen 5 ratcheted [Fig. 12(c)]. Apparently, the trend reflects both the early fabric evolution followed by contact fretting between enduring contacts at a large number of cycles (Hardin and Richart 1963; Hardin and Drnevich 1972; Alarcon-Guzman et al. 1989).
•
Overall, the maximum shear stiffness was almost 10 times higher than the secant stiffness, (e.g., Schuettpelz et al. 2010; Papadopoulos et al. 2016). This stiffness ratio reflects the stiffness degradation with strain (the peak-to-peak shear strains during repetitive shear varied between and , whereas shear-wave measurements imposed very small strains ), as well as potential differences between short-wavelength dynamic measurements and quasi-static shear.
•
The initial static shear stress had opposite effects on and . The initial density increased with and and detected higher resistance to deformation at lower void ratios. On the other hand, the principal stresses and the fabric tensor rotated with , and wave propagation in the vertical direction detected a softer fabric orientation off the principal direction, i.e., stiffness anisotropy. The mismatch between the polarization plane and the principal stress axes increased as the shear strain increases. However, does not depend on the direction of the measurements. Therefore, the and respond differently to the initial static shear stress .
These observations highlight fundamental differences between the small- and large-strain moduli: is an assessment of state whereas reflects the soil resistance to change in state.
Particle-Scale Analysis: Displacement
Macroscale analyses in terms of strains, stress, and void ratios conceal evolving particle-scale processes such as changes in coordination number, principal fabric direction, particle morphology, and grain-size distribution. Yet, there is a direct link between the strain level during repetitive shear loading and the underlying internal changes. At relatively small strains—within the volumetric threshold strain—most effects take place at contacts in the form of local yielding and fretting (Johnson 1961, 1985; Kadin et al. 2006; Yao et al. 2022). On the other hand, grain-scale morphological changes of sphericity, angularity, regularity will gain relevance when the sediment response is in the ratcheting regime and at high confining stress; fines production will be more noticeable in this regime.
Fig. 13 shows hypothetical fabric changes during repetitive shear loading consistent with the aforementioned observations. The process from Figs. 13(a and b) shows shakedown, where residual plastic deformation in a given cycle ceases after a large number of cycles, the fabric remains constant, and contacts become flatter due to fretting. The process from Figs. 13(a–c) shows ratcheting: there is unceasing plastic shear deformation yet at constant terminal void ratio ; particles evolved toward rounder geometry with limited contact fretting. The subfigures were built with the same particles, but displaced to new locations to reflect the evolving specimen deformation reported previously, starting with a granular packing subjected to zero-lateral-strain loading [Fig. 13(a)]. The initial monotonic shear produces a rotation of the polar histograms of normal and tangential contact forces (Bathurst and Rothenburg 1988), and grains slip and roll into pore spaces. The required interparticle displacement corresponds to a macroscale shear strain higher than the threshold strain at contact loss (Dobry et al. 1982; Santamarina et al. 2001). Volumetric contraction is accompanied by an increase in the interparticle coordination number, as reflected in the evolution of (Fig. 12).
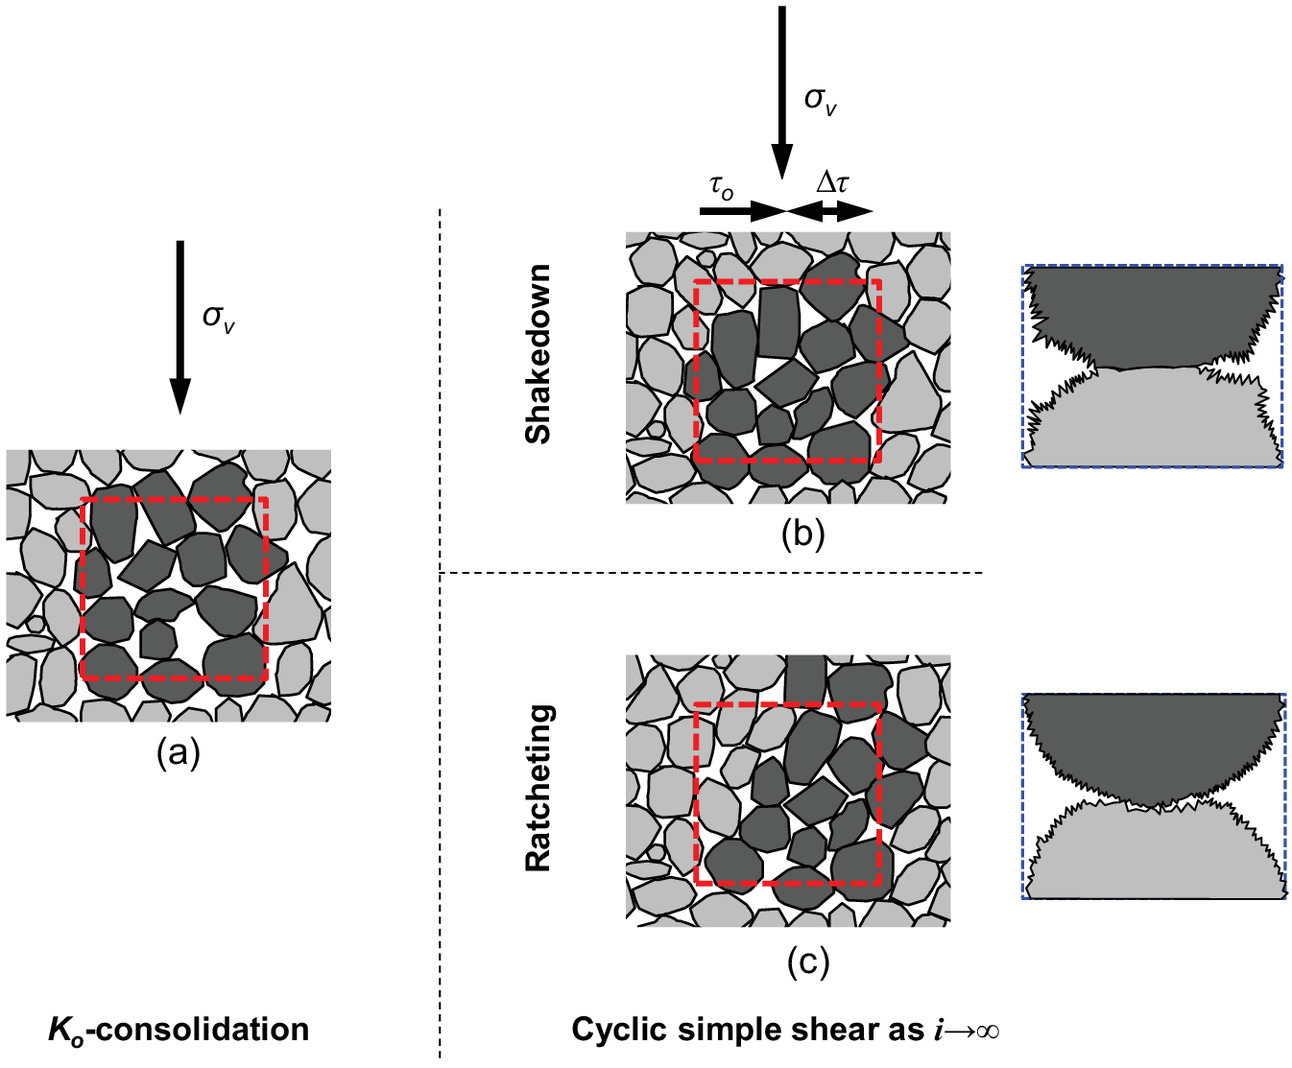
When cyclic shear leads to shakedown, grains gradually take their final positions and abrasion/fretting flattens enduring contacts [Fig. 13(b)]. On the other hand, ratcheting develops when permanent interparticle displacements take place in every cycle [Fig. 13(c)]; although unceasing shear deformation continues with ongoing cycles, the statistical volume change is null, and the void ratio remains at the terminal void ratio while the shear strain continues accumulating.
Engineering Implications: Guidelines
The numerical modeling of geosystems subjected to repetitive loading faces unique difficulties related to limitations in available constitutive models, calibration challenges, computational demands, and numerical error accumulation in implicit time-stepping algorithms (Pasten et al. 2014; Masin 2021). Results from this study allow us to propose simple guidelines to predict the asymptotic shear and volumetric response of sands subjected to repetitive simple shear drained loading to obtain first order estimates of volumetric strain and shear strain for first-order analyses and design.
The following guidelines resemble analyses in the octahedral space where the critical state is the reference monotonic state (Fig. 1). However, incomplete information about the state of stress in simple shear tests prevents the analysis in terms of and . Instead, we propose a simplified approach based on simple shear testing as follows:
•
Conduct drained monotonic simple shear tests under various vertical stresses to determine the locus of asymptotic shear states and in monotonic simple shear loading (Fig. S1 ).
•
For a given initial void ratio and vertical stress , determine whether the soil is monotonically contractive () or dilative (). For reference, the critical state line in rests between and ; for example, the critical state void ratio at is or (Verdugo and Ishihara 1996; Torres-Cruz and Santamarina 2020).
•
Shear response: shakedown or ratcheting? Expect shakedown when the normalized shear stress is for contractive specimens or for dilative specimens. Conversely, expect ratcheting otherwise.
•
Volumetric response: Measure the sand extreme void ratios and . Run a one-cycle drained cyclic simple shear test and determine the void ratio after the first cycle . Estimate the terminal void ratio as a function and [Eq. (6)]. Confirm the potential maximum change in void ratio as a function of and () using trends in Fig. 9(b).
Conclusions
Sands subjected to repetitive simple shear loading evolve toward an asymptotic volumetric (i.e., terminal void ratio) and shear state (i.e., shakedown or ratcheting). The maximum obliquity during repetitive shear loading ( and the initial soil fabric determine the asymptotic state. Salient conclusions from this study are as follows:
•
The soil retains a memory of its initial fabric even after a large number of shear cycles. Therefore, the shear strain and void ratio at the end of the first cycle combine with the shear amplitude to anticipate the asymptotic shear and volumetric responses.
•
The normalized shear stress , defined by the maximum shear and the ultimate state shear strength, is the best predictor of either the shakedown or ratcheting response.
•
The shear deformation evolves toward stable shakedown when for contractive soils and for dilative soils. During shakedown, grains gradually take their final positions, and enduring contacts experience abrasion/fretting.
•
On the other hand, shear strain accumulation continues in ratcheting mode when the normalized shear stress exceeds for contractive soils or for dilative soils. This unceasing shear deformation implies continued fabric changes, albeit at a statistically constant terminal void ratio.
•
Shear-wave velocity measurements capture the evolution of the small-strain shear stiffness during simple shear cycles. The small-strain shear modulus increases linearly with the log of the number of cycles when specimens experience shakedown; this reflects fabric changes toward more stable configurations (early cycles) and fretting among enduring contacts (later cycles).
•
The secant peak-to-peak shear modulus in a given cycle shows a rapid initial increase within the first cycles as a result of early fabric changes. Differences in and trends with the number of cycles reflect fundamental differences in deformation mechanisms: contact deformation defines the small-strain stiffness in shear-wave propagation; in contrast, contact creation-and-loss determines the peak-to-peak stiffness during repetitive shear at intermediate strain levels.
•
Repetitive mechanical loading tests are time-demanding. Error analysis can be used to identify the minimum number of cycles required to determine reliable model parameters in order to design a cost-effective experimental program.
•
Time-stepping numerical simulations are complex when geosystems are subjected to repetitive shear loading and are affected by numerical error accumulation. Results from this study can help identify asymptotic conditions to obtain first-order estimates of volumetric strain and shear strain for analyses and design.
Notation
The following symbols are used in this paper:
- model parameter for asymptotic shear strain;
- model parameter for terminal void ratio;
- coefficient of uniformity;
- diameter of specimen;
- relative density;
- median grain size;
- ratcheting parameter in the strain accumulation model;
- grain diameter;
- void ratio;
- void ratio at the number of cycle ;
- void ratio on the lower accumulation model trend;
- maximum void ratio;
- minimum void ratio;
- initial void ratio at the number of cycle ;
- terminal void ratio;
- void ratio on the upper accumulation model trend;
- ultimate state void ratio;
- void ratio at the end of first loading;
- loading frequency;
- sampling frequency;
- maximum shear stiffness;
- secant peak-to-peak shear modulus;
- specific gravity;
- initial height of specimen;
- cycle numbers;
- coefficient of earth pressure at rest;
- characteristic cycle number in the modified strain accumulation model for shear strain;
- fitting parameter in the modified shear strain accumulation model;
- total number of cycles;
- characteristic cycle number in the modified strain accumulation model for void ratio;
- fitting parameter in the modified strain accumulation model for void ratio;
- mean effective stress;
- initial mean effective stress;
- deviatoric stress;
- roundness;
- mineral specific gravity;
- undrained shear strength;
- particle relaxtion time;
- macroscopic shear time;
- shear-wave velocity;
- normalized potential change in void ratio;
- change in void ratio;
- deviatoric stress amplitude;
- change in plastic shear strain accumulation;
- change in vertical effective stress;
- cyclic stress amplitude;
- shear stress amplitude;
- shear strain;
- shear strain rate;
- shear strain at cycle;
- shear strain on the lower accumulation model trend;
- plastic shear strain computed from two consecutive cycles;
- peak-to-peak shear strain;
- asymptotic shear strain;
- shear strain on the upper accumulation model trend;
- shear strain at the unloading;
- shear strain at the loading;
- shear strain at the end of end of first loading;
- peak-to-peak strain rate;
- stress obliquity;
- critical state stress obliquity;
- maximum stress obliquity;
- stretching factor;
- inertial number;
- soil density;
- grain density;
- water density;
- effective stress;
- lateral effective stress;
- initial vertical effective stress;
- vertical effective stress;
- yield stress;
- maximum principal stress;
- minimum principal stress;
- shear stress;
- normalized shear stress ratio;
- shear stress at failure;
- maximum shear stress;
- initial shear stress;
- ultimate state shear strength; and
- friction angle.
Supplemental Materials
File (supplemental_materials_jggefk.gteng-10814_cha.pdf)
- Download
- 851.53 KB
Data Availability Statement
All data, models, and code generated or used during the study appear in the published article.
Acknowledgments
Support for this research was provided by the KAUST Endowment at King Abdullah University of Science and Technology. Gabrielle E. Abelskamp edited the manuscript.
References
Ahmed, S. S., and B. Hawlader. 2016. “Numerical analysis of large-diameter monopiles in dense sand supporting offshore wind turbines.” Int. J. Geomech. 16 (5): 04016018. https://doi.org/10.1061/(ASCE)GM.1943-5622.0000633.
Alarcon-Guzman, A., J. L. Chameau, G. A. Leonards, and J. D. Frost. 1989. “Shear modulus and cyclic undrained behavior of sands.” Soils Found. 29 (4): 105–119. https://doi.org/10.3208/sandf1972.29.4_105.
Andersen, K. H. 2009. “Bearing capacity under cyclic loading—Offshore, along the coast, and on land.” Can. Geotech. J. 46 (5): 513–535. https://doi.org/10.1139/T09-003.
Ansal, A. M., and A. Erken. 1989. “Undrained behavior of clay under cyclic shear stresses.” J. Geotech. Eng. 115 (7): 968–983. https://doi.org/10.1061/(ASCE)0733-9410(1989)115:7(968).
ASTM. 2006a. Standard test methods for maximum index density and unit weight of soils using a vibratory table. ASTM D4253. West Conshohocken, PA: ASTM.
ASTM. 2006b. Standard test methods for specific gravity of soil solids by water pycnometer. ASTM D854. West Conshohocken, PA: ASTM.
ASTM. 2016. Standard test method for minimum index density and unit weight of soils and calculation of relative density. ASTM D4254. West Conshohocken, PA: ASTM.
ASTM. 2017. Standard test methods for particle-size distribution (Gradation) of soils using sieve analysis. ASTM D6913. West Conshohocken, PA: ASTM.
Azéma, E., and F. Radjai. 2014. “Internal structure of inertial granular flows.” Phys. Rev. Lett. 112 (7): 078001. https://doi.org/10.1103/PhysRevLett.112.078001.
Bathurst, R. J., and L. Rothenburg. 1988. “Micromechanical aspects of isotropic granular assemblies with linear contact interactions.” ASME J. Appl. Mech. 55 (1): 17–23. https://doi.org/10.1115/1.3173626.
Bjerrum, L. 1966. “Secondary settlements of structures subjected to large variations in live load.” In Rheology and soil mechanics, 460–471. Berlin: Springer.
Brown, S. F. 1996. “Soil mechanics in pavement engineering.” Géotechnique 46 (3): 383–426. https://doi.org/10.1680/geot.1996.46.3.383.
Cai, Y., Q. Sun, L. Guo, C. H. Juang, and J. Wang. 2015. “Permanent deformation characteristics of saturated sand under cyclic loading.” Can. Geotech. J. 52 (6): 795–807. https://doi.org/10.1139/cgj-2014-0341.
Cai, Y., T. Wu, L. Guo, and J. Wang. 2018. “Stiffness degradation and plastic strain accumulation of clay under cyclic load with principal stress rotation and deviatoric stress variation.” J. Geotech. Geoenviron. Eng. 144 (5): 04018021. https://doi.org/10.1061/(ASCE)GT.1943-5606.0001854.
Cao, Z., J. Chen, Y. Cai, L. Zhao, C. Gu, and J. Wang. 2018. “Long-term behavior of clay-fouled unbound granular materials subjected to cyclic loadings with different frequencies.” Eng. Geol. 243 (Sep): 118–127. https://doi.org/10.1016/j.enggeo.2018.06.019.
Chang, C. S., and R. V. Whitman. 1988. “Drained permanent deformation of sand due to cyclic loading.” Int. J. Geotech. Eng. 114 (10): 1164–1180. https://doi.org/10.1061/(ASCE)0733-9410(1988)114:10(1164).
Chang, W. J., S. H. Chou, and A. B. Huang. 2017. “Physical simulation of aquifer compression due to groundwater fluctuation.” Eng. Geol. 231 (Dec): 157–164. https://doi.org/10.1016/j.enggeo.2017.10.012.
Cho, G. C., J. Dodds, and J. C. Santamarina. 2006. “Particle shape effects on packing density, stiffness, and strength: Natural and crushed sands.” J. Geotech. Geoenviron. Eng. 132 (5): 591–602. https://doi.org/10.1061/(ASCE)1090-0241(2006)132:5(591).
Cuéllar, P., M. Baeßler, and W. Rücker. 2009. “Ratcheting convective cells of sand grains around offshore piles under cyclic lateral loads.” Granular Matter 11 (6): 379–390. https://doi.org/10.1007/s10035-009-0153-3.
Cuéllar, P., S. Georgi, M. Baeßler, and W. Rücker. 2012. “On the quasi-static granular convective flow and sand densification around pile foundations under cyclic lateral loading.” Granular Matter 14 (1): 11–25. https://doi.org/10.1007/s10035-011-0305-0.
Dai, S., F. Wuttke, and J. C. Santamarina. 2013. “Coda wave analysis to monitor processes in soils.” J. Geotech. Geoenviron. Eng. 139 (9): 1504–1511. https://doi.org/10.1061/(ASCE)GT.1943-5606.0000872.
Dobry, R., R. S. Ladd, F. Y. Yokel, R. M. Chung, and D. Powell. 1982. Prediction of pore water pressure buildup and liquefaction of sands during earthquakes by the cyclic strain method: Building science series 138. Washington, DC: US Department of Commerce.
Drnevich, V. P., and F. E. Richart. 1970. “Dynamic prestraining of dry sand.” J. Soil Mech. Found. Div. 96 (2): 453–469. https://doi.org/10.1061/JSFEAQ.0001398.
Field, J. E., S. M. Walley, W. G. Proud, H. T. Goldrein, and C. R. Siviour. 2004. “Review of experimental techniques for high rate deformation and shock studies.” Int. J. Impact Eng. 30 (7): 725–775. https://doi.org/10.1016/j.ijimpeng.2004.03.005.
García-Rojo, R., and H. J. Herrmann. 2005. “Shakedown of unbound granular material.” Granular Matter 7 (2–3): 109–118. https://doi.org/10.1007/s10035-004-0186-6.
Gu, C., X. Ye, Z. Cao, Y. Cai, J. Wang, and T. Zhang. 2020. “Resilient behavior of coarse granular materials in three dimensional anisotropic stress state.” Eng. Geol. 279 (Dec): 105848. https://doi.org/10.1016/j.enggeo.2020.105848.
Guo, L., J. Chen, J. Wang, Y. Cai, and P. Deng. 2016. “Influences of stress magnitude and loading frequency on cyclic behavior of Ko-consolidated marine clay involving principal stress rotation.” Soil Dyn. Earthquake Eng. 84 (Sep): 94–107. https://doi.org/10.1016/j.soildyn.2016.01.024.
Hardin, B. O., and V. P. Drnevich. 1972. “Shear modulus and damping in soils: Design equations and curves.” J. Soil Mech. Found. Div. 98 (7): 667–692. https://doi.org/10.1061/JSFEAQ.0001760.
Hardin, B. O., and F. E. Richart Jr. 1963. “Elastic wave velocities in granular soils.” J. Soil Mech. Found. Div. 89 (1): 33–65. https://doi.org/10.1061/JSFEAQ.0000493.
He, B., S. Yang, and K. H. Andersen. 2021. “Soil parameters for offshore wind farm foundation design: A case study of Zhuanghe wind farm.” Eng. Geol. 285 (May): 106055. https://doi.org/10.1016/j.enggeo.2021.106055.
Hurley, R. C., and J. E. Andrade. 2015. “Friction in inertial granular flows: Competition between dilation and grain-scale dissipation rates.” Granular Matter 17 (3): 287–295. https://doi.org/10.1007/s10035-015-0564-2.
Hyde, A. F. L., and S. J. Ward. 1985. “A pore pressure and stability model for a silty clay under repeated loading.” Géotechnique 35 (2): 113–125. https://doi.org/10.1680/geot.1985.35.2.113.
Indraratna, B., Y. Sun, and S. Nimbalkar. 2016. “Laboratory assessment of the role of particle size distribution on the deformation and degradation of ballast under cyclic loading.” J. Geotech. Geoenviron. Eng. 142 (7): 04016016. https://doi.org/10.1061/(ASCE)GT.1943-5606.0001463.
Jadid, R., B. M. Montoya, V. Bennett, and M. A. Gabr. 2020. “Effect of repeated rise and fall of water level on seepage-induced deformation and related stability analysis of Princeville levee.” Eng. Geol. 266 (Mar): 105458. https://doi.org/10.1016/j.enggeo.2019.105458.
Johnson, K. L. 1961. “Energy dissipation at spherical surfaces in contact transmitting oscillating forces.” J. Mech. Eng. Sci. 3 (4): 362. https://doi.org/10.1243/JMES_JOUR_1961_003_048_02.
Johnson, K. L. 1985. Contact mechanics. Cambridge, UK: Cambridge University Press.
Kadin, Y., Y. Kligerman, and I. Etsion. 2006. “Unloading an elastic–plastic contact of rough surfaces.” J. Mech. Phys. Solids 54 (12): 2652–2674. https://doi.org/10.1016/j.jmps.2006.04.013.
Kaggwa, W. S., J. R. Booker, and J. P. Carter. 1991. “Residual strains in calcareous sand due to irregular cyclic loading.” Int. J. Geotech. Eng. 117 (2): 201–218. https://doi.org/10.1061/(ASCE)0733-9410(1991)117:2(201).
Karg, C., and W. Haegeman. 2009. “Elasto-plastic long-term behavior of granular soils: Experimental investigation.” Soil Dyn. Earthquake Eng. 29 (1): 155–172. https://doi.org/10.1016/j.soildyn.2008.01.001.
Klar, A., M. Roed, I. Rocchi, and I. Paegle. 2019. “Evaluation of horizontal stresses in soil during direct simple shear by high-resolution distributed fiber optic sensing.” Sensors 19 (17): 3684. https://doi.org/10.3390/s19173684.
Krumbein, W. C., and L. L. Sloss. 1963. Stratigraphy and sedimentation. San Francisco: W.H. Freeman and Company.
Lackenby, J., B. Indraratna, G. McDowell, and D. Christie. 2007. “Effect of confining pressure on ballast degradation and deformation under cyclic triaxial loading.” Géotechnique 57 (6): 527–536. https://doi.org/10.1680/geot.2007.57.6.527.
LeBlanc, C., G. T. Houlsby, and B. W. Byrne. 2010. “Response of stiff piles in sand to long-term cyclic lateral loading.” Géotechnique 60 (2): 79–90. https://doi.org/10.1680/geot.7.00196.
Lee, J. S., and J. C. Santamarina. 2005. “Bender elements: Performance and signal interpretation.” J. Geotech. Geoenviron. Eng. 131 (9): 1063–1070. https://doi.org/10.1061/(ASCE)1090-0241(2005)131:9(1063).
Lekarp, F., and A. Dawson. 1998. “Modelling permanent deformation behaviour of unbound granular materials.” Constr. Build. Mater. 12 (1): 9–18. https://doi.org/10.1016/S0950-0618(97)00078-0.
Li, Y., Y. Wu, and Z. Wang. 2021. “Stress state and noncoaxiality of leighton buzzard sand in NGI-type bi-directional simple shear tests.” Mar. Georesour. Geotechnol. 39 (10): 1255–1260. https://doi.org/10.1080/1064119X.2020.1811814.
Li, Y., Y. Yang, H. S. Yu, and G. Roberts. 2018. “Principal stress rotation under bidirectional simple shear loadings.” KSCE J. Civ. Eng. 22 (5): 1651–1660. https://doi.org/10.1007/s12205-017-0822-4.
Licata, V., A. D’Onofrio, and F. Silvestri. 2018. “Microstructural factors affecting the static and the cyclic resistance of a pyroclastic silty sand.” Géotechnique 68 (5): 434–441. https://doi.org/10.1680/jgeot.16.P.319.
Liu, F., P. Luo, X. Hu, and Y. Zhang. 2018. “Effect of angle between initial and cyclic shear stress on behaviors of marine clay.” Mar. Georesour. Geotechnol. 36 (5): 617–624. https://doi.org/10.1080/1064119X.2017.1361489.
López-Querol, S., and M. R. Coop. 2012. “Drained cyclic behaviour of loose Dogs Bay sand.” Géotechnique 62 (4): 281–289. https://doi.org/10.1680/geot.8.P.105.
Luong, M. P. 1980. “Stress–strain aspects of cohesionless soils under cyclic and transient loading.” In Proc., Int. Symp. on Soils under Cyclic and Transient Loading, edited by G. N. Pande and O. C. Zienkiewicz, 315–324. Rotterdam, Netherlands: Balkema.
Maqsood, Z., J. Koseki, Y. Miyashita, J. Xie, and H. Kyokawa. 2020. “Experimental study on the mechanical behaviour of bounded geomaterials under creep and cyclic loading considering effects of instantaneous strain rates.” Eng. Geol. 276 (Oct): 105774. https://doi.org/10.1016/j.enggeo.2020.105774.
Masin, D. 2021. “Modelling non-linearity, small-strain stiffness and cyclic loading.” In ALERT doctoral school, edited by C. Tamagnini and D. Masin, 89–119. Grenoble, France: ALERT.
MiDi, G. D. R. 2004. “On dense granular flows.” Eur. Phys. J. Eng. 14 (4): 341–365. https://doi.org/10.1140/epje/i2003-10153-0.
Miller, G. A., S. Y. Teh, D. Li, and M. M. Zaman. 2000. “Cyclic shear strength of soft railroad subgrade.” J. Geotech. Geoenviron. Eng. 126 (2): 139–147. https://doi.org/10.1061/(ASCE)1090-0241(2000)126:2(139).
Miner, M. A. 1945. “Cumulative fatigue damage.” J. Appl. Mech. 12 (3): A159–A164. https://doi.org/10.1115/1.4009458.
Moussa, A. A. 1975. “Equivalent drained–undrained shearing resistance of sand to cyclic simple shear loading.” Géotechnique 25 (3): 485–494. https://doi.org/10.1680/geot.1975.25.3.485.
Narsilio, A., and J. C. Santamarina. 2008. “Terminal densities.” Géotechnique 58 (8): 669–674. https://doi.org/10.1680/geot.2008.58.8.669.
Nguyen, N. S., S. François, and G. Degrande. 2014. “Discrete modeling of strain accumulation in granular soils under low amplitude cyclic loading.” Comput. Geotech. 62 (Oct): 232–243. https://doi.org/10.1016/j.compgeo.2014.07.015.
Niemunis, A., T. Wichtmann, and T. Triantafyllidis. 2005. “A high-cycle accumulation model for sand.” Comput. Geotech. 32 (4): 245–263. https://doi.org/10.1016/j.compgeo.2005.03.002.
Nikitas, G., L. Arany, S. Aingaran, J. Vimalan, and S. Bhattacharya. 2017. “Predicting long term performance of offshore wind turbines using cyclic simple shear apparatus.” Soil Dyn. Earthquake Eng. 92 (Aug): 678–683. https://doi.org/10.1016/j.soildyn.2016.09.010.
Nowamooz, H., X. N. Ho, C. Chazallon, and P. Hornych. 2013. “The effective stress concept in the cyclic mechanical behavior of a natural compacted sand.” Eng. Geol. 152 (1): 67–76. https://doi.org/10.1016/j.enggeo.2012.09.014.
Okamoto, T., S. Matsuura, J. O. Larsen, S. Asano, and K. Abe. 2018. “The response of pore water pressure to snow accumulation on a low-permeability clay landslide.” Eng. Geol. 242 (Feb): 130–141. https://doi.org/10.1016/j.enggeo.2018.06.002.
Oldecop, L., and E. Alonso. 2012. “Modelling the degradation and swelling of clayey rocks bearing calcium-sulphate.” Int. J. Rock Mech. Min. 54 (Jun): 90–102. https://doi.org/10.1016/j.ijrmms.2012.05.027.
Pang, Y., C. Gu, J. Wang, and Y. Cai. 2020. “Strain evolution of saturated clays under cyclic loadings in three-dimensional stress condition.” Eng. Geol. 278 (Dec): 105824. https://doi.org/10.1016/j.enggeo.2020.105824.
Papadopoulos, E., D. D. Cortes, and J. Carlos Santamarina. 2016. “In-situ assessment of the stress-dependent stiffness of unbound aggregate bases: Application in inverted base pavements.” Int. J. Pavement Eng. 17 (10): 870–877. https://doi.org/10.1080/10298436.2015.1022779.
Park, J. 2018. “Long-term response of soils subjected to repetitive mechanical loads: Engineering implications.” Ph.D. thesis, School of Civil and Environmental Engineering, Georgia Institute of Technology.
Park, J., and J. C. Santamarina. 2019. “Sand response to a large number of loading cycles under zero-lateral strain conditions: Evolution of void ratio and small strain stiffness.” Géotechnique 69 (6): 501–513. https://doi.org/10.1680/jgeot.17.P.124.
Park, J., and J. C. Santamarina. 2020. “Soil response to repetitive changes in pore water pressure under deviatoric loading.” J. Geotech. Geoenviron. Eng. 146 (5): 04020023. https://doi.org/10.1061/(ASCE)GT.1943-5606.0002229.
Pasten, C., H. Shin, and J. C. Santamarina. 2014. “Long-term foundation response to repetitive loading.” J. Geotech. Geoenviron. Eng. 140 (4): 04013036. https://doi.org/10.1061/(ASCE)GT.1943-5606.0001052.
Pell, P. S. 1973. Characterization of fatigue behavior. Washington, DC: Highway Research Board.
Postill, H., P. R. Helm, N. Dixon, S. Glendinning, J. A. Smethurst, M. Rouainia, K. M. Briggs, A. El-Hamalawi, and A. P. Blake. 2021. “Forecasting the long-term deterioration of a cut slope in high-plasticity clay using a numerical model.” Eng. Geol. 280 (Jan): 105912. https://doi.org/10.1016/j.enggeo.2020.105912.
Qi, W. G., and F. P. Gao. 2019. “Local scour around a monopile foundation for offshore wind turbines and scour effects on structural responses.” In Geotechnical engineering-advances in soil mechanics and foundation engineering. London: IntechOpen.
Rahal, M. A., and A. R. Vuez. 1998. “Analysis of settlement and pore pressure induced by cyclic loading of silo.” J. Geotech. Geoenviron. Eng. 124 (12): 1208–1210. https://doi.org/10.1061/(ASCE)1090-0241(1998)124:12(1208).
Randolph, M. F. 2012. “Offshore design approaches and model tests for sub-failure cyclic loading of foundations.” In Mechanical behaviour of soils under environmentally induced cyclic loads, 441–480. Vienna, Austria: Springer.
Roshankhah, S., A. V. Garcia, and J. C. Santamarina. 2021. “Thermal conductivity of sand–silt mixtures.” J. Geotech. Geoenviron. Eng. 147 (2): 06020031. https://doi.org/10.1061/(ASCE)GT.1943-5606.0002425.
Santamarina, J. C., and D. Fratta. 2005. Discrete signals and inverse problems. An introduction for engineers and scientists. New York: Wiley.
Santamarina, J. C., K. A. Klein, and M. A. Fam. 2001. Vol. 316 of Soils and waves. New York: Wiley.
Schuettpelz, C. C., D. Fratta, and T. B. Edil. 2010. “Mechanistic corrections for determining the resilient modulus of base course materials based on elastic wave measurements.” J. Geotech. Geoenviron. Eng. 136 (8): 1086–1094. https://doi.org/10.1061/(ASCE)GT.1943-5606.0000329.
Sevi, A., and L. Ge. 2012. “Cyclic behaviors of railroad ballast within the parallel gradation scaling framework.” J. Mater. Civ. Eng. 24 (7): 797–804. https://doi.org/10.1061/(ASCE)MT.1943-5533.0000460.
Sharp, R. W., and J. R. Booker. 1984. “Shakedown of pavements under moving surface loads.” J. Transp. Eng. 110 (1): 1–14. https://doi.org/10.1061/(ASCE)0733-947X(1984)110:1(1).
Shin, H., and J. C. Santamarina. 2013. “Role of particle angularity on the mechanical behavior of granular mixtures.” J. Geotech. Geoenviron. Eng. 139 (2): 353–355. https://doi.org/10.1061/(ASCE)GT.1943-5606.0000768.
Silver, M. L., and H. B. Seed. 1971. “Volume changes in sands during cyclic loading.” J. Soil Mech. Found. Div. 97 (9): 1171–1182. https://doi.org/10.1061/JSFEAQ.0001658.
Soriano, A., H. Patiño, J. González, and M. Valderrama. 2011. “Cyclic behaviour of saturated sands subject to previous horizontal shear stresses.” In Proc., 15th ECSMGE, 12–15. Amsterdam, Netherlands: IOS Press.
Stewart, H. E. 1986. “Permanent strains from cyclic variable-amplitude loadings.” Int. J. Geotech. Eng. 112 (6): 646–660. https://doi.org/10.1061/(ASCE)0733-9410(1986)112:6(646).
Suiker, A. S., E. T. Selig, and R. Frenkel. 2005. “Static and cyclic triaxial testing of ballast and subballast.” J. Geotech. Geoenviron. Eng. 131 (6): 771–782. https://doi.org/10.1061/(ASCE)1090-0241(2005)131:6(771).
Sun, Q. D., B. Indraratna, and S. Nimbalkar. 2014. “Effect of cyclic loading frequency on the permanent deformation and degradation of railway ballast.” Géotechnique 64 (9): 746–751. https://doi.org/10.1680/geot.14.T.015.
Tatsuoka, F., T. Iwasaki, K. I. Tokida, and M. Kon-no. 1981. “Cyclic undrained triaxial strength of sampled sand affected by confining pressure.” Soils Found. 21 (2): 115–120. https://doi.org/10.3208/sandf1972.21.2_115.
Thom, N. H., and S. F. Brown. 1988. “The effect of grading and density on the mechanical properties of a crushed dolomitic limestone.” In Proc., 14th Australian Road Research Board (ARRB) Conf. Melbourne, Australia: Australian Road Research Board.
Torres-Cruz, L. A., and J. C. Santamarina. 2020. “The critical state line of nonplastic tailings.” Can. Geotech. J. 57 (10): 1508–1517. https://doi.org/10.1139/cgj-2019-0019.
Trollope, D. H., I. K. Lee, and J. Morris. 1962. “Stresses and deformation in two layer pavement structures under slow repeated loading.” In Proc., 1st Australian Road Research Board (ARRB) Conf. Melbourne, Australia: Australian Road Research Board.
Uchida, S., E. Levenberg, and A. Klar. 2015. “On-specimen strain measurement with fiber optic distributed sensing.” Measurement 60 (Jun): 104–113. https://doi.org/10.1016/j.measurement.2014.09.054.
Verdugo, R., and K. Ishihara. 1996. “The steady state of sandy soils.” Soils Found. 36 (2): 81–91. https://doi.org/10.3208/sandf.36.2_81.
Wang, H., P. Sun, E. Liu, and R. Li. 2020. “Dynamic properties of Tianshui saturated remolded loess: A laboratory study.” Eng. Geol. 272 (Jul): 105570. https://doi.org/10.1016/j.enggeo.2020.105570.
Werkmeister, S., A. R. Dawson, and F. Wellner. 2001. “Permanent deformation behavior of granular materials and the shakedown concept.” Transp. Res. Rec. 1757 (1): 75–81. https://doi.org/10.3141/1757-09.
White, D. J., and B. M. Lehane. 2004. “Friction fatigue on displacement piles in sand.” Géotechnique 54 (10): 645–658. https://doi.org/10.1680/geot.2004.54.10.645.
Wichtmann, T., A. Niemunis, and T. Triantafyllidis. 2005. “Strain accumulation in sand due to cyclic loading: Drained triaxial tests.” Soil Dyn. Earthquake Eng. 25 (12): 967–979. https://doi.org/10.1016/j.soildyn.2005.02.022.
Wichtmann, T., T. Triantafyllidis, and L. Späth. 2019. “On the influence of grain shape on the cumulative deformations in sand under drained high-cyclic loading.” Soils Found. 59 (1): 208–227. https://doi.org/10.1016/j.sandf.2018.11.001.
Wijewickreme, D., A. Soysa, and P. Verma. 2017. “Response of natural fine-grained soils for seismic design practice: A collection of research findings from British Columbia, Canada.” Soil Dyn. Earthquake Eng. 124 (Sep): 280–296. https://doi.org/10.1016/j.soildyn.2018.04.053.
Wood, D. M., A. Drescher, and M. Budhu. 1979. “On the determination of stress state in the simple shear apparatus.” Geotech. Test. J. 2 (4): 211–222. https://doi.org/10.1520/GTJ10460J.
Yao, T., B. A. Baudet, and S. D. Lourenço. 2022. “Evolution of surface roughness of single sand grains with normal loading.” Géotechnique 72 (6): 543–555. https://doi.org/10.1680/jgeot.20.P.310.
Youd, T. L. 1972. “Compaction of sands by repeated shear straining.” J. Soil Mech. Found. Div. 98 (7): 709–725. https://doi.org/10.1061/JSFEAQ.0001762.
Youd, T. L. 1973. “Factors controlling maximum and minimum densities of sands.” ASTM Spec. Tech. Publ. 523 (Jan): 98–112. https://doi.org/10.1520/STP37866S.
Yu, F. W. 2017. “Particle breakage and the critical state of sands.” Géotechnique 67 (8): 713–719. https://doi.org/10.1680/jgeot.15.P.250.
Zhao, K., Q. Wang, W. Chen, H. Zhuang, and G. Chen. 2020. “Uplift of immersed tunnel in liquefiable seabed under wave and current propagation.” Eng. Geol. 278 (Dec): 105828. https://doi.org/10.1016/j.enggeo.2020.105828.
Zheng, J., and R. D. Hryciw. 2015. “Traditional soil particle sphericity, roundness and surface roughness by computational geometry.” Géotechnique 65 (6): 494–506. https://doi.org/10.1680/geot.14.P.192.
Information & Authors
Information
Published In

Journal of Geotechnical and Geoenvironmental Engineering
Volume 149 • Issue 6 • June 2023
Copyright
This work is made available under the terms of the Creative Commons Attribution 4.0 International license, https://creativecommons.org/licenses/by/4.0/.
History
Received: Feb 16, 2022
Accepted: Nov 7, 2022
Published online: Mar 16, 2023
Published in print: Jun 1, 2023
Discussion open until: Aug 16, 2023
Authors
Metrics & Citations
Metrics
Citations
Download citation
If you have the appropriate software installed, you can download article citation data to the citation manager of your choice. Simply select your manager software from the list below and click Download.