Novel Earned Value Management System Maturity Framework and Its Relation to Project Performance
Publication: Journal of Construction Engineering and Management
Volume 149, Issue 6
Abstract
Earned value management systems (EVMS) are used by industry practitioners to successfully manage projects and programs; however, there has been no past study to characterize and evaluate the impact of EVMS maturity on project performance. This paper introduces a novel framework, developed to measure the EVMS maturity, composed of 56 attributes arrayed across ten subprocesses, which together make up an integrated project/program management system. This paper describes how the framework was conceived and developed, based on literature review and data collected from industry workshops. Then, it examines the relationship between EVMS maturity and ten project performance metrics through statistical analyses. The study analyzed project data from 35 projects and programs worth over $21.8 billion in total cost. For this sample, results showed statistically significant differences between projects with high and low EVMS maturity; on average, projects exhibiting high EVMS maturity have 54% less cost overruns and 19% less change orders versus their performance measurement baseline. Higher maturity projects and programs also achieve better customer satisfaction, meet business objectives more often, and are more often in compliance with EVMS standards and guidelines. This paper contributes to the body of knowledge by providing a practical and novel framework for assessing the maturity of earned value management systems. Practitioners can use the framework to improve their integrated project and program management.
Practical Applications
A novel framework was developed using inputs from literature sources, a broad survey, and industry practitioners that facilitates the measurement of maturity of earned value management systems (EVMS), and tested on 35 completed projects and programs. The framework consists of 56 EVMS maturity attributes that make up ten EVMS subprocesses (e.g., organizing, planning and scheduling, risk management, etc.) with each allowing measurement in terms of five maturity levels. These attributes are core characteristics or qualities of subprocesses that are essential to fielding an effective EVMS. Organizations can use the framework presented here to assess and/or “tailor” the EVMS applied to their projects and programs to support the needs for an integrated project and program management. Out of 35 projects and programs studied, those with higher EVMS maturity showed 54% less cost overruns and 19% less change orders versus baseline on average, than those with lower EVMS maturity. Projects with higher EVMS maturity were found to achieve better customer satisfaction, business objectives and were significantly more compliant with EVMS standards and guidelines. Owners and contractors can use the framework on large and complex projects to screen EVMS application and highlight specific gaps to achieve best-in-class EVMS leading to better performance.
Introduction
Organizations use earned value management systems (EVMS) to manage projects successfully in different industries (e.g., Liu et al. 2022; Alzraiee 2018; Hanna 2012). Although EVMS can be categorized around different process areas, this study considers the following EVMS subprocesses from the literature: organizing, planning and scheduling, budgeting and work authorization, accounting considerations, indirect cost management, analysis and management reporting, change control, material management, subcontract management, and risk management (Aramali et al. 2022b, 2021; NDIA 2020). According to Aramali et al. (2022b), the application of EVMS is complex because it necessitates the integration of these technical subprocesses; for example, (1) EVMS needs to be integrated with risk management, (2) schedule forecasting needs to be integrated with risk management, and (3) concurrently the prime contractor’s EVMS flow-down requirements to subcontractors need to be fully integrated with risk management, and so forth. Collectively, the ten subprocesses generate the earned value management (EVM) information that project managers can use to make important decisions. Past literature indicates that the EVMS is a sociotechnical system requiring mature processes; where a sociotechnical system combines both the technical (i.e., maturity of EVMS subprocesses) and the human (i.e., the social part of the system) inputs (Aramali et al. 2022d, 2021; Bembers et al. 2017). Therefore, this paper focuses on EVMS process maturity in an integrated project/program management setting, where integrated project and program management is an integral part of planning, scheduling, estimating, budgeting, monitoring, controlling, and managing projects and programs.
The definition of EVMS maturity is “the degree to which an implemented system, associated subprocesses, and deliverables serve as the basis for an effective and compliant EVMS” (Aramali et al. 2022b). Assessment of maturity requires that one evaluate a system of attributes that the authors define as core characteristics or qualities of subprocesses that are essential to fielding an effective EVMS. EVMS subprocesses are applied within the scope of a given project, regardless of its characteristics. Taken together, these subprocesses allow the contractor to self-govern the project or program.
Contractors and clients often use EVM systems that are compliant with various standards and guidelines (DOE 2020; PMI 2019; McNamee et al. 2017; Kwak and Anbari 2012), which indirectly corresponds to mature EVMS (Bembers et al. 2017; Liggett et al. 2017; Stratton 2006). Of the recognized organizations that have formed the standards and guidelines are the International Organization for Standardization (ISO), the National Defense Industrial Association (NDIA) Integrated Program Management Division (IPMD), and the Project Management Institute/American National Standards Institute (PMI/ANSI) (PMI 2019; ISO 2018; NDIA 2018a). For example, the U.S. government’s expectation from the contractors’ EVMS is compliance with ANSI/EIA-748 for various types of project acquisitions (DOE 2020; Lindsay et al. 2013; Frahm 2012). Specifically, EVMS is compliant when it satisfies the intent of the standards and guidelines leading thereby to EVM data that is timely, reliable, and actionable (PMI 2019; NDIA 2018b). However, guidelines and standards are subject to different interpretations and understanding across customers and contractors (Cho et al. 2020; NDIA 2016; Melamed and Plumery 2015; Finefield 2013a, b).
A recent state-of-the-art review of EVMS, where more than 600 references have been checked, identified two gaps in the body of knowledge related to EVMS maturity (Aramali et al. 2022d). First, a consistent assessment method that could measure the maturity level of EVMS subprocesses has not been developed. Second, except for anecdotal evidence, the impact of EVMS maturity on project performance outcomes has not been studied in detail.
Accordingly, the U.S. Department of Energy (DOE) initiated a research project, as outlined in this paper, to address these gaps. Its purpose was to establish a singular, objective, and performance-driven EVMS maturity assessment framework developed with input from multiple sources, with the expectation that it would address the inconsistency of EVMS application. Based on past literature (Aramali et al. 2022b, d; Cho et al. 2020), organizations were found to apply EVMS by following differing guiding sources, as well as checking compliance in a variety of ways. It also had as an objective to evaluate the impact of maturity in terms of typical project and program performance measures. As such, the objectives of this paper are to develop and test the discussed framework and study the impact of maturity on project performance. Consequently, three research questions are explored: (1) How can the technical components of the EVMS be objectively assessed? (2) How can the technical components of the EVMS’ level of maturity be measured? (3) Is there a relationship between EVMS maturity and project performance?
A research team was formed to oversee this effort (called “RT”, for brevity). The RT was composed of 36 industry experts from 18 public and private organizations that operate internationally and representing owners, contractors, and consultants. Its role was to steer and provide input to the research efforts and provide feedback based on its collective expertise.
This paper contributes to the body of knowledge by providing a practical (hands-on) and novel framework for assessing the maturity of earned value management systems. Practitioners can use the framework to improve their integrated project and program management approach. It encourages the project management community to apply the maturity concept and advance the current and traditional EVMS applications using a systematic approach. The assessment process also allows different stakeholders to collectively address gaps preventing an effective integrated project and program management. Furthermore, this study shows the importance of using this framework by providing data showing how poor EVMS maturity impacts project performance specifically in terms of expected cost overruns and change orders versus the project baseline for the collected sample. As such, this justification encourages practitioners to proactively manage their EVMS subprocesses before issues arise throughout the project lifecycle.
The outline of this paper is as follows. First, the literature review section briefs the literature done on the maturity concept in EVMS. Next, the details of the research method are presented through four subsections corresponding to each of the research steps. The following section discusses the results of the framework development and testing. Finally, conclusions with guidance to practitioners are provided.
Literature Review
Maturity in Project Management
Since the inception of the maturity concept in the late 1980s in the software engineering industry (Humphrey 1989), a number of researchers have adapted it in various disciplines including project management. Aramali et al. (2022d) gathered a list of 11 maturity models applied in project management from the last two decades. These models assess various well-defined components in various project management applications. Andersen and Jessen (2003) aim to assess the maturity of knowledge defined as the ability to perform different tasks, and actions defined as performing the tasks in reality. Yussef et al. (2019) aim to assess well-defined technical project definition elements in five maturity levels. Kerzner (2009) provided definitions for 16 points leading to project maturity. Yet, assessing technical components of EVMS through their maturity has not been similarly looked at in the literature raising questions such as whether they can be first defined and so measured. Also, a key difference in the maturity models from the literature is the visual representation of the maturity stages. For example, Gareis and Huemann (2000) used a spider-web presentation to illustrate the maturity levels of project management competencies. Crawford (2001) described a five-level scalable model for project maturity. Andersen and Jessen (2003) used the notion of a three-level ladder for maturity and represented it in a triangular format.
Despite the debates among the researchers on the best format, the common goal was to improve the organizational processes and competencies by moving toward higher maturity levels. The maturity concept applied to technology was similarly proven to be effective when developing complex product systems (Patanakul et al. 2016; Magnaye et al. 2014), in construction lessons-learned programs (Caldas et al. 2009), and in military programs (Garrett and Rendon 2006). Even though maturity models are prevalent in project and construction management, there is one explicit model to assess and improve specifically the application of EVMS in the literature. It was developed by Stratton (2000) in early 2000 and where compliance of EVMS with ANSI/EIA 748 guidelines gives EVMS a higher level of maturity. This model was once applied to oil and gas production by Zhan et al. (2019) to improve the effectiveness of EVM. Other references exist from the industry sources, such as the EVMS scalability guide (NDIA 2020), however, they are conceptual, subject to differing interpretations, and do not explicitly discuss EVMS maturity. First, these gaps create an opportunity to update the knowledge of EVMS maturity with a recent and practical model. Second, developing the model by building upon multiple guidelines could lead to a consistent EVMS application. Also, EVMS maturity attributes have not been identified in the academic sources and definitions for each level of maturity per attribute do not exist.
Maturity and Project Performance
Initially, the project management maturity models became popular through an assumption that higher maturity will lead to better outcomes, then the probability of project success will also improve. To this end, assessing actual project performance data against project management maturity and finding meaningful results were challenging to almost disappointing in research (Brookes et al. 2014; Mullaly 2014; Jugdev and Müller 2005; Caldas et al. 2009). The reasons why there are different maturity frameworks in the project management field are identified in the literature review by Aramali et al. (2022d), most specifically that there are differences in the way organizations apply project management (Joseph and Lukas 2008). These inconsistencies could lead to misleading findings in relation to the improvement of project performance. However, the potential in finding evidence on the relation of EVMS maturity to project performance through a consistent maturity model is promising for two reasons. First, the application of EVMS is more or less standardized by the support of documented guidelines that practitioners use (Cho et al. 2020). Second, the industry claims that EVMS is reliable when it follows guidelines (Orgut et al. 2020; Christensen 1998). Therefore, the literature supports an opportunity to create a novel maturity model applicable on EVMS within the scope of a project, based upon guidelines. Research interest in EVM has increased since the 2000s, yet there is a lack of evidence in the literature on EVMS maturity (Kwak and Anbari 2009).
Research Method
Industry survey results and past literature on the topic of EVMS were the foundations of this research (Aramali et al. 2021, 2022d). The survey analyzed responses from 294 individuals, representing organizations operating in up to 29 countries across North America, Europe, South Africa, and the Middle East. From the survey, the subject matter experts identified an existing industry need for a more consistent maturity assessment framework across organizations. The analysis of 160 publications from the past decade exposed the lack of an EVMS maturity model. After identifying these gaps from the literature, the authors proceeded with developing the framework.
Step 1: Framework Development
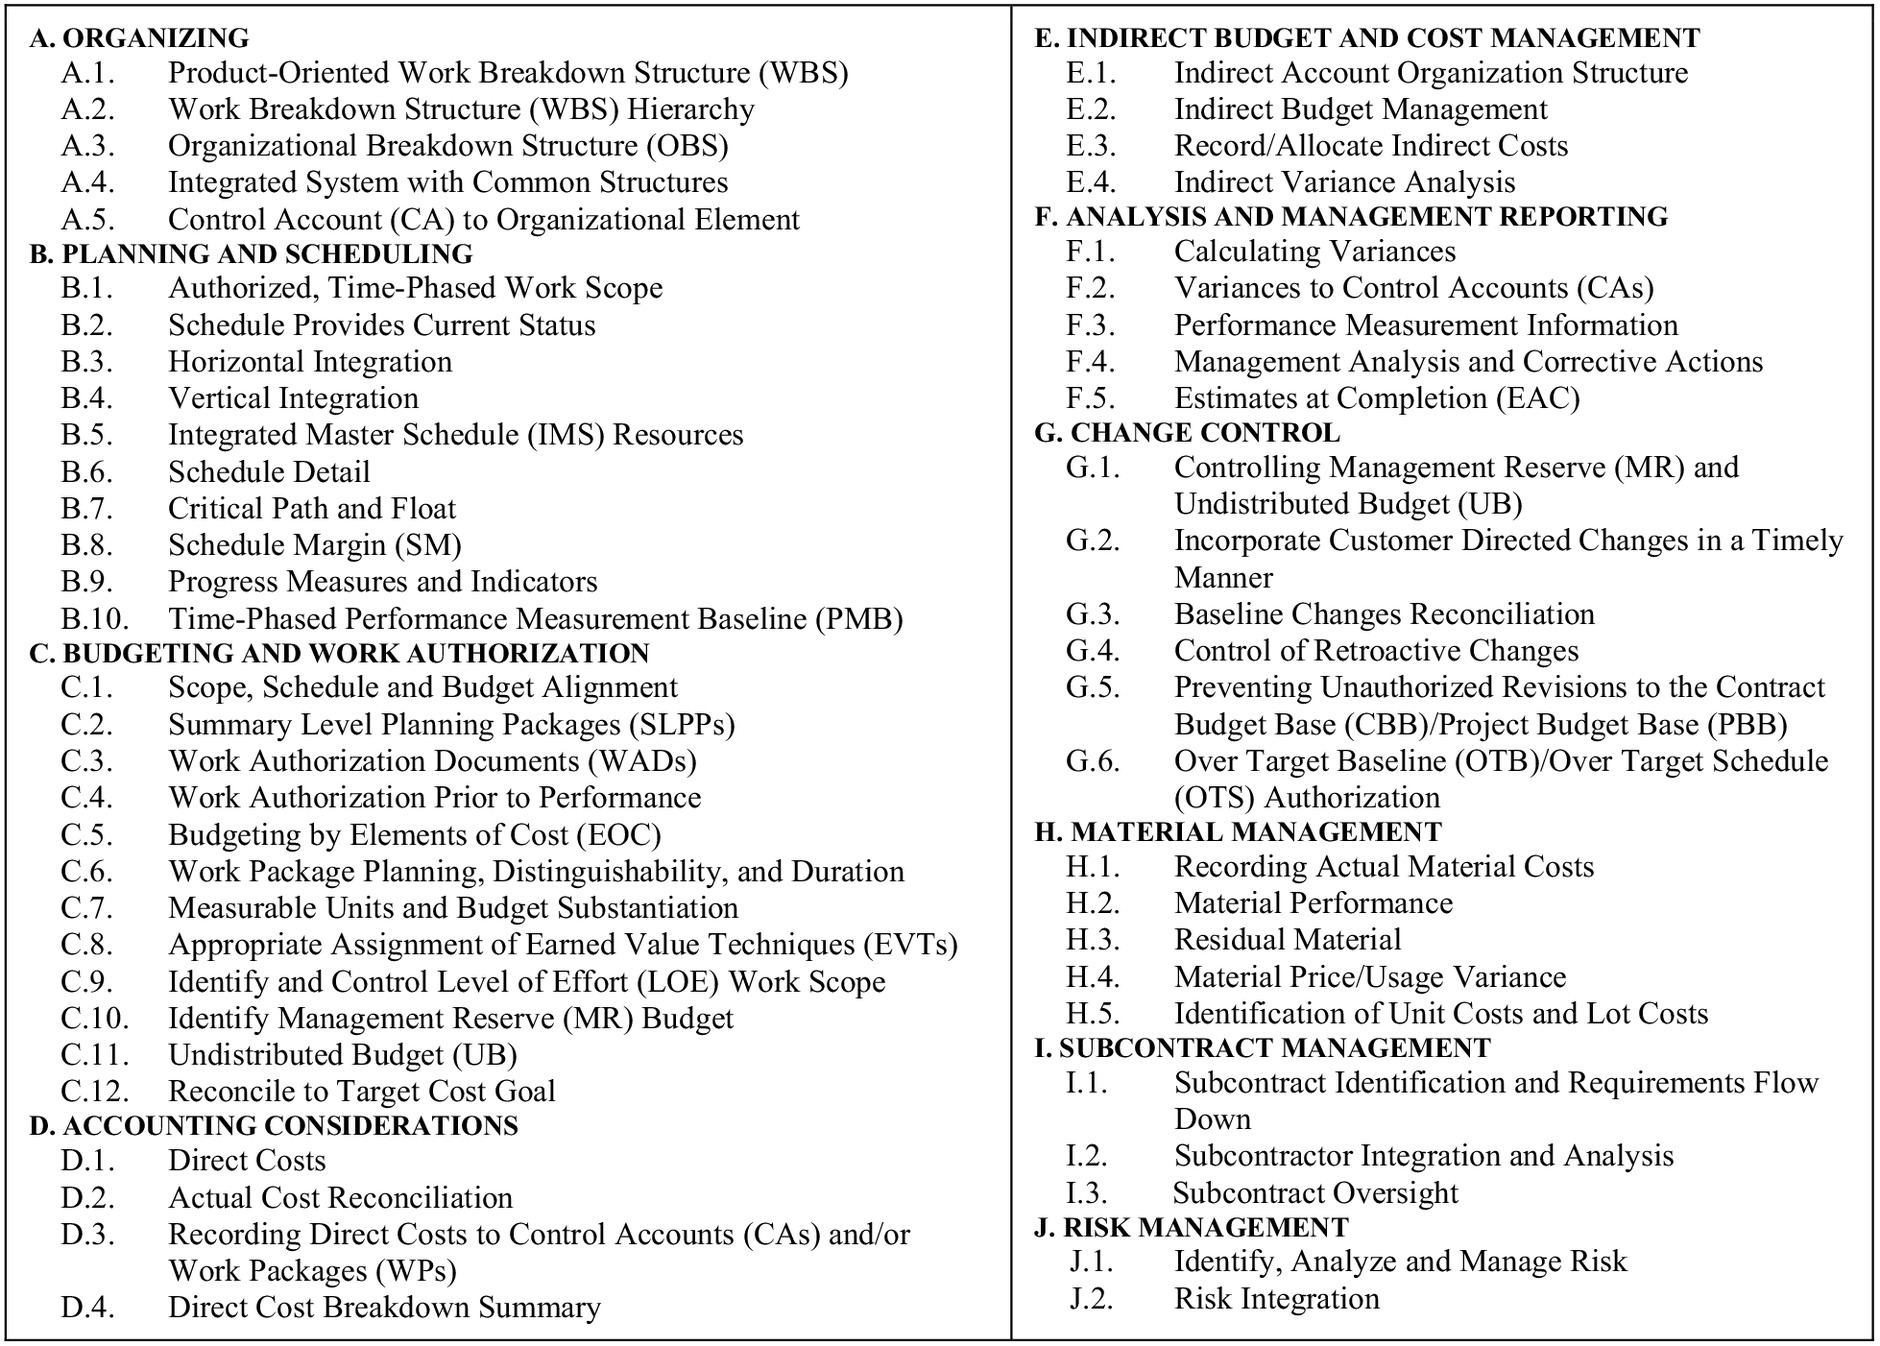
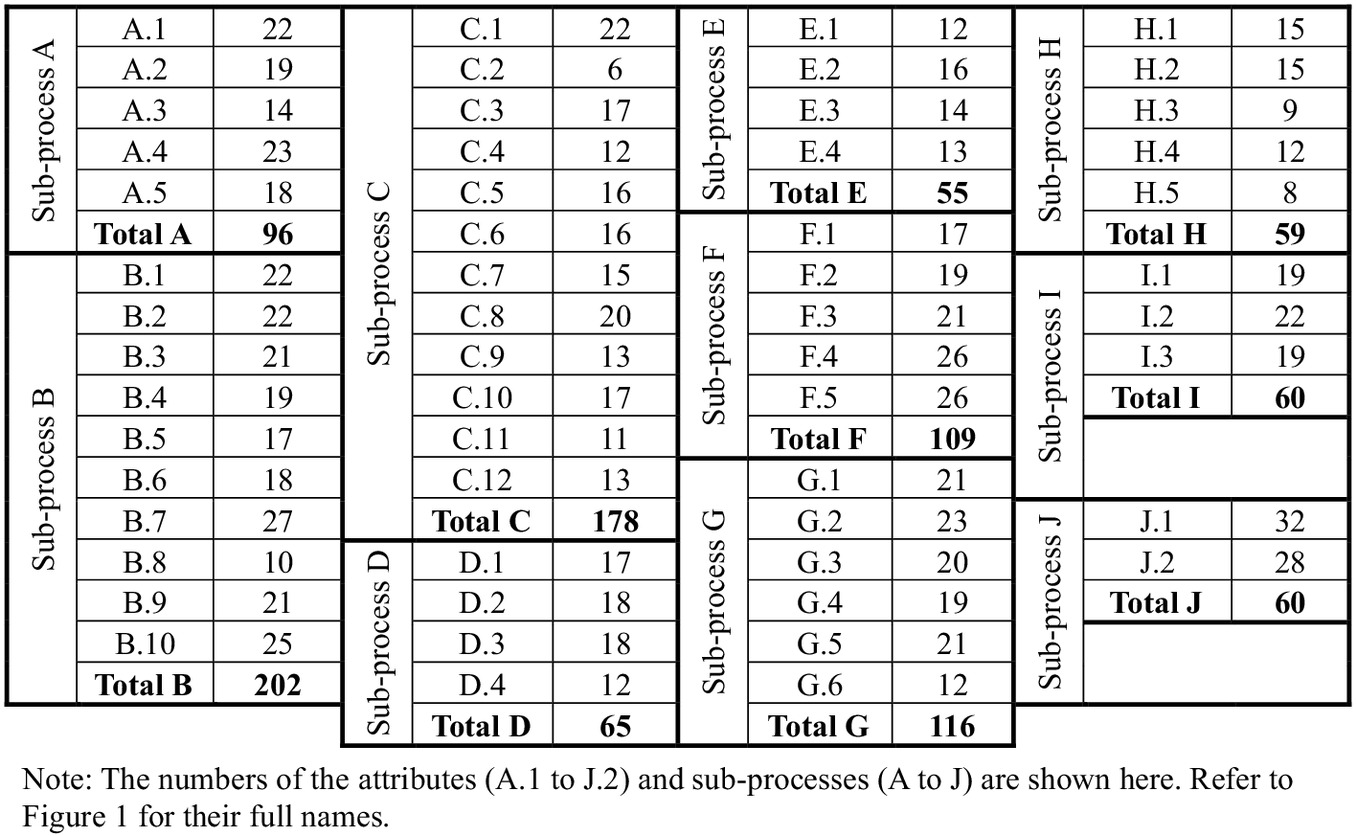
As a starting point for building the framework and with the support of the RT, the authors collected a list of major and international EVMS standards and guidelines (e.g., GAO 2019; McGregor 2019; DOE 2018; ISO 2018; NASA 2018; NDIA 2018a; PMI 2019). The authors started with an initial list of 82 maturity attributes that the DOE uses in EVMS compliance reviews that are linked to the -748 guidelines (DOE 2018; NDIA 2018a). To ensure comprehensiveness and applicability across geographic boundaries, the RT also added to the attributes from international guidelines such as the ISO and PMI in conjunction with ANSI (PMI 2019; ISO 2018). Then the RT combined any existing duplicates and related concepts in the list. For instance, two attributes were found to address the same concept of organizational elements; the first attribute checks if all authorized tasks are assigned to the organizational elements of the project or the program, while the second attribute checks if all major subcontractor work efforts are identified and integrated into the project or program’s organizational breakdown structure (OBS). The RT merged these two into one maturity attribute called organizational breakdown structure, and ensured that both key ideas are covered within. A similar method was used looking at all attributes. By comparing all the 82 maturity attributes versus one another, and merging the related concepts, gathering input over a period of eight months, the list was condensed into a final list of 56 attributes. The attributes are organized around the ten EVMS subprocesses mentioned earlier. The list of the 56 maturity attributes is shown in Fig. 1 and starts with A.1 and ends with J.2, where A denotes the organizing EVMS subprocess A, 1 denotes the first attribute of subprocess A, and so forth.
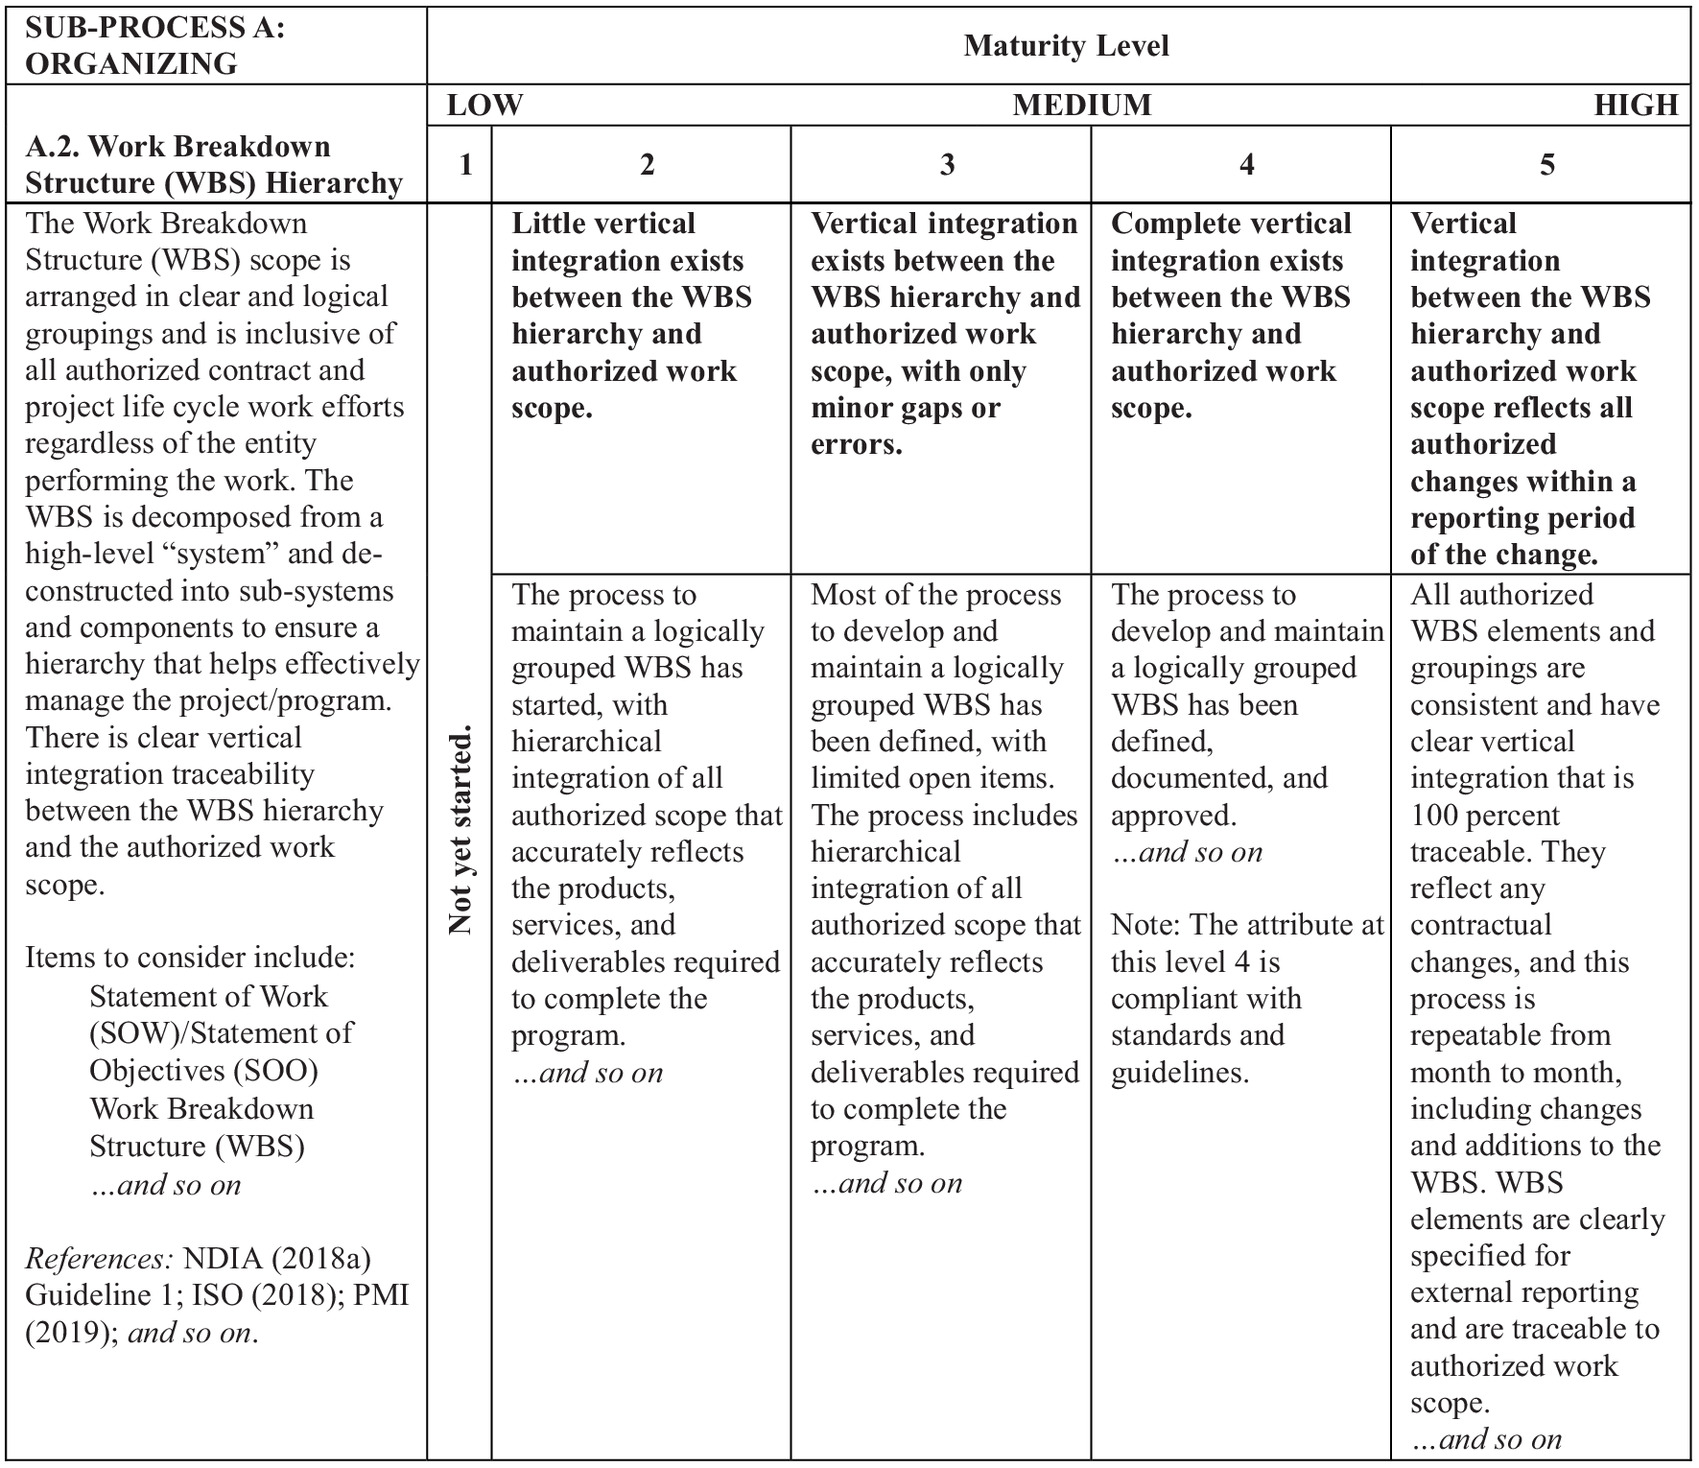
The authors adopted a maturity rating scale for each attribute, ranging from 1, meaning the work on the attribute has not yet started, to 4, meaning compliant to guidelines, and 5, which is the highest maturity level beyond compliance. Each attribute is described in the same tabulated layout where each column corresponds to a maturity level (56 tables in total). For clarity, attribute description and maturity level explanation in each column were drafted by the RT with reference to EVMS guidelines (Aramali et al. 2022b). Fig. 2 represents an example of the maturity table for attribute A.2. The table layout for all 56 attributes is similar. In addition, the authors arranged these attributes into scoresheet format by attribute name and their rating levels, with scores to be assigned to each maturity level as explained next.
Step 2: Framework Development Workshops
The authors hosted four workshops, where 56 EVMS practitioners (coincidentally) provided comments on each of the 56 maturity attribute tables (the maturity assessment framework). Furthermore, they assessed the attributes under each subprocess, then the ten subprocesses in order of importance by providing relative weights. These weights were needed to calculate the normalized weights of the 56 attributes and complete the scoresheets by developing scores to each maturity level per attribute. To engage the industry knowledge into the research, the workshops adopted the format of “research charrettes” from the literature, however, they were held virtually due to the challenges of the COVID-19 pandemic (Gibson et al. 2022; Gibson and Whittington 2010). A research charrette is a novel and efficient data collection approach proven effective in construction engineering and management research. It allows knowledge-sharing through real-time interactions between subject matter experts and academic researchers in a focus group setting. Key benefits include focused discussions, valuable data input and insights from industry participants, accelerated time in data collection, and so forth.
Based on the weights collected from the workshop participants, the maturity attribute level 5 scores were generated giving a maximum score of 1,000. The process for collecting and calculating the maturity level 5 scores based on the collected weights required several steps. First, the participants were asked to provide information about a project from their experience, and use this project as a reference (or anchor) when thinking about prioritizing the attributes and subprocesses. Then, they were asked to allocate 100 points among the x attributes making up each subprocess based upon their perception of the attribute’s relative impact on the subprocess maturity. For example, when weighing the attributes under subprocess A, if attribute A.1 is more important than A.2 to A.5, then they allocated more points to A.1. As an example, they could give A.1 a weight of 40, A.2 a weight of 20, A.3 a weight of 20, A.4 a weight of 10, and A.5 a weight of 10, with all adding to 100. They proceeded to do this for attributes within all the remaining nine subprocesses, always using their anchor project as a basis for their weighting decisions.
The participants were also asked to repeat the same exercise but instead weigh the subprocesses by allocating 100 points among the ten based upon their perception of each’s relative impact to the overall EVMS maturity, again using their anchor project as a personal reference. For example, if in the opinion of the respondent, subprocess A is more important than subprocesses B through J, then the respondent could allocate more points to A. As an example, they could allocate 25 points to subprocess A and distribute the remaining 75 points in a lesser amount to the other nine subprocesses, with all summing to 100.
Using this collective data from the 56 respondents, the authors calculated the attribute average weights and the subprocess average weights. As an example, A.1 (product-oriented work breakdown structure), one of the five attributes making up subprocess A, received an average weight of 22.8 out of 100 points within subprocess A (organizing); subprocess A (organizing), one of the ten subprocesses, received an average weight of 10.9 out of 100.
After calculating the average weights, the authors performed an outlier analysis in order to check the veracity of respondent input (Aramali et al. 2022a; Kwak and Kim 2017; DeSimone et al. 2015). The authors identified extreme/outlier responses in the collected weights, which are data points lying far from the majority (Kwak and Kim 2017; DeSimone et al. 2015), at the subprocess level and at the attribute level. As a result, responses from five participants were identified as outliers. The remaining 51 data sets were used to calculate the level 5 maturity scores as briefly described in the next paragraph (Aramali et al. 2022a).
After the outlier analysis was completed, several score calculation schemes were tried to develop the final level 5 relative weights for all attributes. The first two schemes were Scheme A and Scheme B. Scheme A was purely based on the weighting responses from the workshops, which had issues such as overinflating some of the individual attribute scores in the smaller subprocesses [Eq. (1)]. Scheme B attempted to address this issue by adding a new multiplier entitled attribute distribution factor (%) that took into account the number of attributes that make up each subprocess [Eq. (2)]. This factor was calculated by dividing the number of attributes per subprocess by 56, multiplied by 100. However, a potential issue in Scheme B was that four subprocesses’ attribute scores were changed significantly compared to the workshop inputs, with differences greater than 50% compared to Scheme A scores. Therefore, the authors completed 101 different iterations moving between Schemes A and B by incrementally changing scores from Scheme A by 1%. The 52nd scenario was the best fit, with 52% Scheme A score and 48% Scheme B score [Eq. (3)]. Ultimately, this iteration was the best fit, where subprocess weights matched participant results in the workshops, while at the same time the attribute score inflation was minimized. More details of this methodology can be found in Aramali et al. (2022a). The corresponding equations are as follows.
(1)
(2)
(3)
As an example, based on the workshop inputs with outliers removed, attribute A.1 had an average weight of 22.6% within subprocess A. Subprocess A had an average weight of 10.5% across all ten subprocesses. Therefore, attribute A.1’s normalized weighted score is 23.73, rounded to 24, out of 1,000 [result of Eq. (1): ]. Then, since subprocess A has five attributes, therefore the attribute distribution factor is 8.93% (result of ). In the same example of attribute A.1 mentioned earlier, the numerator of the Eq. (2) is ; whereas the denominator is the sum of repeating this step of A.1 across all 56 attributes, producing 0.11048 (step to normalize the scores across all the 56 attributes). Therefore, the normalized weighted score in Scheme B for attribute A.1 is: , rounded to 19. The final attribute level 5 score represents 52% Scheme A score and 48% Scheme B score [Eq. (3)]. In this case, the example of attribute A.1 continues with a final level 5 maturity score that is 21.55, rounded to 22, out of 1,000 (calculated as ). These steps were applied to all the attributes and the resulting scores are shown in the results section (specifically in Fig. 3).
Linear interpolation was applied to generate the scores of the maturity levels 2, 3, and 4 for each attribute. The authors used an interpolation between the score of 0 for level 1 and the scores calculated earlier for level 5 (Aramali et al. 2022a). Accordingly, the scores were finally filled in the scoresheets, which are used to assess each attribute when applied to a project or program. Also, since the application of EVMS is tailorable and dependent on project characteristics, the scoresheet allowed the option to specify attributes that are not applicable to the project being evaluated (Van Der Steege 2019; Bergerud 2017).
As previously mentioned, 56 individual practitioners participated in the framework development workshops. These are the individuals that did not yet test the framework but contributed to the development of the framework. They collectively represented 32 unique organizations and had an average of 19 years of industry experience. Other than having significant EVM and integrated project management experience for over 10 years and working for clients and contractors, there were no other specific criteria or selection process for individuals to participate in the workshops. The workshops were open to industry practitioners involved in project management and specifically EVMS implementation; the invitations were sent to leading organizations on the topic, through the help of the research team; and participation was voluntary. The majority represented government contractor organizations (41%), followed by government organizations (34%) and consultants (16%), and the remaining represented software developers and manufacturers (9%). Hence, a variety of perspectives were considered when establishing the framework. In terms of employment role, roughly 36% were in project controls management role, 21% in project management, 16% in compliance management, 14% in consulting, and the remaining 13% were mostly executives. Overall, the framework development input came from a diverse pool of individuals with a variety of expertise. In total, the workshop participants provided 859 comments which were resolved by the RT to produce the final version of the maturity assessment framework.
Step 3: Framework Testing and Data Collection
The individuals who participated in past workshops, as well as additional experts suggested by the RT were invited to four additional workshops to test the framework voluntarily on their completed projects. During these workshops, each participant was asked to select a completed reference project that they had been involved with in some capacity, collecting this data via a live Qualtrics survey as the workshop progressed. Then, the respondents were asked to provide background and completion data indicating project performance. Next, participants were asked to review the attribute tables with maturity level descriptions and rate the maturity level of the 56 attributes as applied on their projects at 20 percent project completion. This project lifecycle point in time was selected based on RT input and the literature, since EVMS is established or relatively matured at this point in a project lifecycle as described by Aramali et al. (2022b). The selection of any maturity level allowed the authors to calculate its corresponding score. The score sum of the assessment of all attributes represents the overall EVMS maturity score for a given project (with a higher score meaning higher maturity). At the end of the workshop, the Qualtrics survey automatically generated a total EVMS maturity score for their projects (a raw score between 1 and 1,000 points). Overall, data from 35 completed projects provided by 31 workshop participants were collected and analyzed.
Based on the research procedures of Step 2 and Step 3, a total of eight workshops contributed to the development and testing of the novel EVMS maturity framework (four framework-development workshops plus four framework-testing workshops). The adopted workshop setting united subject matter experts with the researchers and the research sponsor and fostered interactive dialogue between them. This dialogue was helpful for various reasons. First, the researchers guided the participants and trained them specifically in using the framework step-by-step to provide the necessary numerical data or comments aligned with the research needs. For example, participants were familiarized with the framework before applying it to their anchor projects and programs. Second, the authors were available to clarify questions as the data collection proceeded. Third, with directly provided guidance from the researchers to the participants and real-time clarifications, bias in data inputs was minimized and consistency maintained across the workshops. Finally, and based on the statistical data that will be presented next, the authors and RT view the collected sample as sufficient to make statistically valid claims; however, as always and as in any sample of data, caution should be used in the generalization of the results to every single project outside of the sample.
Step 4: Performance Data Analysis
After the framework testing data collection, general descriptive statistics and statistical analyses were calculated using Microsoft Excel and the IBM SPSS software. In total, 10 project performance metrics were considered in the scope of study. These 10 project performance measures were taken into account based on the feedback from the RT to be relevant and associated with EVMS based on experiential industry evidence and criticality for project success (other performance measures can be looked at by applying the same methodology). They are divided into continuous and discrete variables for the purpose of applying appropriate statistical tests. The discrete variables included: (1) meeting business objectives, (2) customer satisfaction, and (3) proactive management using EVMS (these three were evaluated on a 1-5 scale, ranging from 1 “very unsuccessful” to 5, “very successful” looking backward to the period post project completion), and (4) compliance to EVMS guidelines (e.g., NDIA 2018a): a simple yes or no answer tied to 20 percent project completion. In addition to the EVMS maturity score, the continuous variables evaluated included: (1) final cost performance index (CPI), (2) cost growth, (3) cost growth excluding change orders, (4) schedule growth, (5) change absolute value (all applied to the completed project), and (6) contingency applied to the project at 20 percent completion. The last five were calculated in the following equations, where PMB is performance measurement baseline as it existed at 20 percent completion for the project.
(4)
(5)
(6)
(7)
(8)
To identify the impact of EVMS maturity on project performance, a multi-series analyses was performed. First, a step-wise analysis (Yussef et al. 2019; El Asmar et al. 2018) split the projects into two subgroups: projects with high EVMS maturity (HM) and projects with low EVMS maturity (LM) (for brevity, authors use the term HM projects to refer to the projects with EVMS subprocesses that are mature and LM projects to those with subprocesses that have low maturity). The purpose of classifying projects in these two subsets was to study the differences between them in terms of project performance metrics. Second, the authors checked for normality of the data distribution in each subgroup, and accordingly, a valid statistical test was chosen to check for significant differences. In the case where normality test failed, the nonparametric Mann-Whitney U-test was conducted (Corder and Foreman 2014). When the normality test passed, an independent t-test was used to compare the two subgroups (Corder and Foreman 2014; McCrum-Gardner 2008). In both cases, the null hypothesis is that no difference exists between HM and LM projects for each variable. Regarding the discrete variables, Mann-Whitney U-tests were done between GE and HM projects. Third, the authors checked for correlation; the null hypotheses were that a relationship does not exist between the maturity score and each of the continuous variables. All of the results of the data analyses are given in the following sections.
Results and Discussion
This section presents the results with relevant discussions. First, the EVMS maturity framework is discussed. Second, the testing of the framework and impact of EVMS maturity on ten key performance metrics are discussed.
EVMS Maturity Framework and Analysis: Risk Discussion
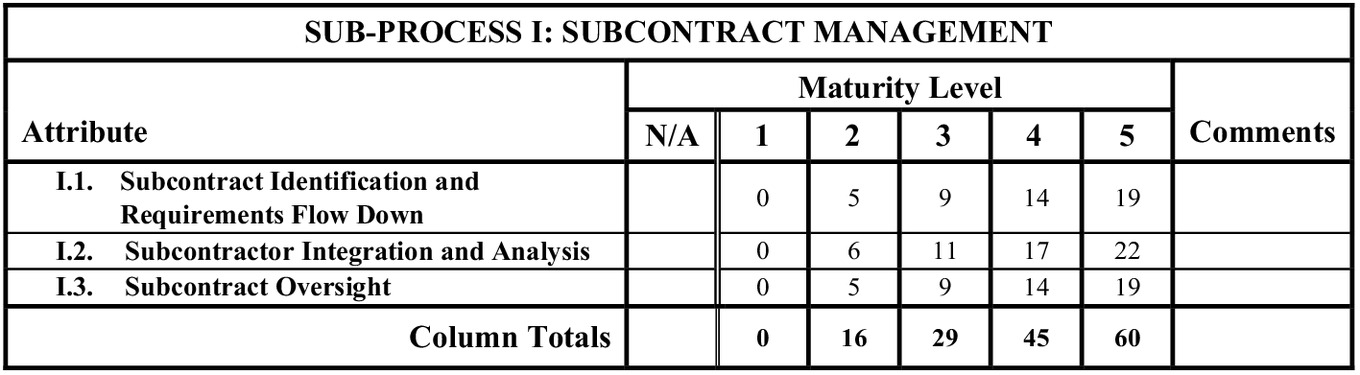
The resulting level 5 scores for all 56 attributes in the maturity assessment framework are presented in Fig. 3. Some of these attributes constitute higher risks to the overall EVMS maturity, as discussed in the next paragraphs. An excerpt of the resulting scoresheets is presented in Fig. 4, corresponding to subprocess I (Subcontract Management), that has a total of three attributes. The figure shows how the scores for all levels are interpolated between the maximum Level 5 scores and the minimum Level 1 score of zero.
The analysis of the maturity assessment framework shows that the top ten attributes, when ranked from highest to lowest score, are: J.1, J.2, B.7, F.4, F.5, B.10, A.4, G.2, A.1, and B.1. These 10 attributes represent approximately 20% of the attributes in the framework and when each is assessed as level 5, are collectively responsible for 254 points (out of 1000), or approximately 25% of the overall EVMS maturity; thus, they represent higher risks to the EVMS when poorly applied. The top two of these ten attributes are related directly to risk management: J.1.Identify, Analyze and Manage Risk (score = 32) and J.2.Risk Integration (score = 28).
Conversely, H.3. Residual Material (score = 9), H.5. Identification of Unit Costs and Lot Costs (score = 8), and C.2. Summary Level Planning Packages (SLPPs) (score = 6) represent the maturity attributes with least level of importance, constituting only 2% risk to the EVMS maturity (total of 23 score out of 1,000). This difference may be because not all projects deal with acquiring materials and the use of SLPPs. While testing the framework on 35 completed projects, these attributes were reported among the top N/A attributes.
Of the EVMS subprocesses, the top three based upon the highest relative scores are B. Planning and Scheduling (score = 202), C. Budgeting and Work Authorization (score = 178), and G. Change Control (score = 116). These three subprocesses, together, are responsible for 50% of the overall EVMS maturity, representing higher risk to maturity than others.
Subprocesses H. Material Management (score = 59), and E. Indirect Budget and Cost Management (score = 55) have the lowest overall weighting among the 10 subprocesses. Cross-checking these results with industry survey results ranking highest impact EVMS subprocesses, shows that these two (material management and indirect budgets and cost management) match exactly with previous independent results (Aramali et al. 2021). However, each of these subprocesses is still important in the integration of an EVMS.
Planning and scheduling is the top subprocess identified in both framework development and survey results, budgeting and work authorization is top 5 in survey results, and change control is top 2. Since there is a good match in results from the two sources, a high reliability is demonstrated from a triangulation perspective using a multimethod approach (Green et al. 2002).
Performance Results
As discussed earlier, four additional framework testing workshops were conducted and captured data from 35 completed projects. Participants in these workshops could be considered a convenience sample as they needed to provide detailed information on completed projects and programs while having the requisite knowledge about EVMS and integrated project and program management. The individuals who participated in these testing workshops (Step 3 of the research method) were focused solely on testing the framework as developed through the first set of workshops. These workshops included 31 participants, with an average industry experience of 19 years. The majority of participants represented government contractor organizations (61%), followed by government organizations (23%) and consultants (16%). In terms of employment role, roughly 23% had roles in project management, 19% in project controls management, 19% in compliance management, 19% in consulting role and the remaining (20%) were mostly executives. Overall, the framework testing input came from a diverse pool of individuals with a variety of expertise and perspectives.
After the data were collected in the workshops, the raw maturity scores in the sample were adjusted. This was done because when a respondent selected an attribute as N/A, no score is gained and thereby the total maximum possible EVMS maturity score would be less than 1,000. In order to provide a consistent comparison data analysis among projects relative to one another, each respondent’s evaluations were normalized to 1,000 points. The following formula was used to adjust the raw EVMS maturity score.
(9)
The denominator is the maximum score that the project could achieve if maturity level of all the applicable attributes were rated as the highest. It is calculated as 1,000 points minus the level 5 scores of the N/A attributes. For example, a project received a raw maturity score of 575 and had attributes: C.2, C.11, G.6, H.4 and H.5. Their level 5 scores are 6, 11, 12, 12, and 8, respectively. The maximum possible score is 951 (1000–sum of level 5 scores of these 5 ). Therefore, the adjusted maturity score, in this case, is which equals 604.6, rounded to 605. These adjusted maturity scores were used in the framework testing data analysis.
Performance Data Characteristics
A data sample included 35 projects all located in the United States, worth $21.848 billion USD in final costs, and having an average of 56 months-duration. They belonged to various sectors, with the majority in construction: construction (34%), defense (26%), environmental (17%), software (9%), aerospace (9%), and science (5%). Sample descriptive statistics are given in Table 1. Screening the data sets showed that some project information had missing values that the participants were not allowed to share, but all the available provided data were analyzed. Hence, some of the sample sizes are different in the data set.
| Data | N | Avg. | Median | Std. Dev. | Min | Max |
|---|---|---|---|---|---|---|
| Collected | ||||||
| Initial Performance Measurement Baseline (PMB) budget (in $M) | 33 | 473.4 | 112.0 | 976.9 | 3.1 | 3,981.0 |
| Final project or program cost (in $M) | 33 | 662.1 | 150.0 | 1,491.2 | 4.8 | 7,500.0 |
| Final CPI (dimensionless) | 35 | 0.94 | 0.98 | 0.12 | 0.6 | 1.1 |
| Budgeted owner contingency above PMB, including Management Reserve (MR) (in $M) | 28 | 159.1 | 13.6 | 601.0 | 0.0 | 3,200.0 |
| Absolute value of change orders (in $M) | 28 | 37.5 | 11.0 | 61.6 | 0.0 | 266.0 |
| Initial baseline project/program duration (in months) | 32 | 50.3 | 48.0 | 20.7 | 8.0 | 96.0 |
| Final project/program duration (in months) | 32 | 56.0 | 48.5 | 25.8 | 20.0 | 132.0 |
| Meeting business objectives (1-5 scale) | 35 | 4.1 | 4.0 | 1.1 | 1.0 | 5.0 |
| Customer satisfaction (1-5 scale) | 35 | 4.1 | 4.0 | 1.1 | 1.0 | 5.0 |
| EVMS helped proactively manage the project (1-5 scale) | 35 | 3.5 | 4.0 | 0.9 | 1.0 | 5.0 |
| Calculated | ||||||
| Raw maturity score (collected by participants) | 35 | 616 | 629 | 176 | 57 | 887 |
| EVMS maturity score (out of 1,000, adjusted by author) | 35 | 657 | 703 | 182 | 78 | 898 |
| Cost growth (in %) | 34 | 121.4 | ||||
| Cost growth, excluding change orders (in %) | 29 | 36.7 | ||||
| Schedule growth (in %) | 34 | 46.6 | ||||
| Change absolute value (in %) | 30 | 53.3 | 13.8 | 122.2 | 0.0 | 537.9 |
| Contingency (% of PMB) | 30 | 103.8 | ||||
As shown in Table 1, the EVMS maturity scores had an average of 657 (of a possible 1,000) ranging from 78 to 898, and a median of 703. This indicates that the framework was able to measure the EVMS maturity of projects over a wide range. This also implies that the developed framework achieved its research intent in having well-defined technical components that can be reasonably assessed in terms of maturity, with a wide maturity score range as evidenced by the input, and confirmed by participants’ feedback.
Maturity Score Threshold
The authors tried several methods to determine an appropriate threshold score that splits the sample into two: HM projects and LM projects. One option was to consider the median (703) as a potential score threshold. The authors also conducted a step-wise sensitivity analysis to find an alternative threshold score by following the method of Yussef et al. (2019) and El Asmar et al. (2018) who set maturity score threshold in the topic of front-end engineering design. For this, the maturity scores were arranged in an ascending order with their cost growth data. Then the cost growth between the two subsets were compared statistically, starting with the lowest score and stepping up to the next project’s score. By repeating this process, each subset comparison generated a corresponding p-value. The p-values were plotted against EVMS maturity score in Fig. 5.
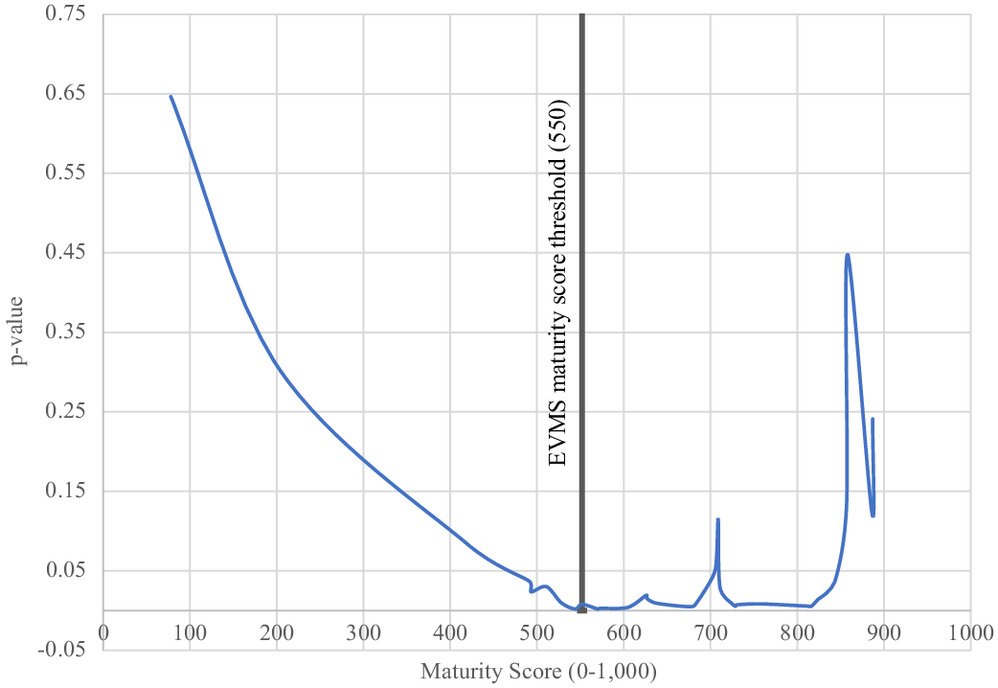
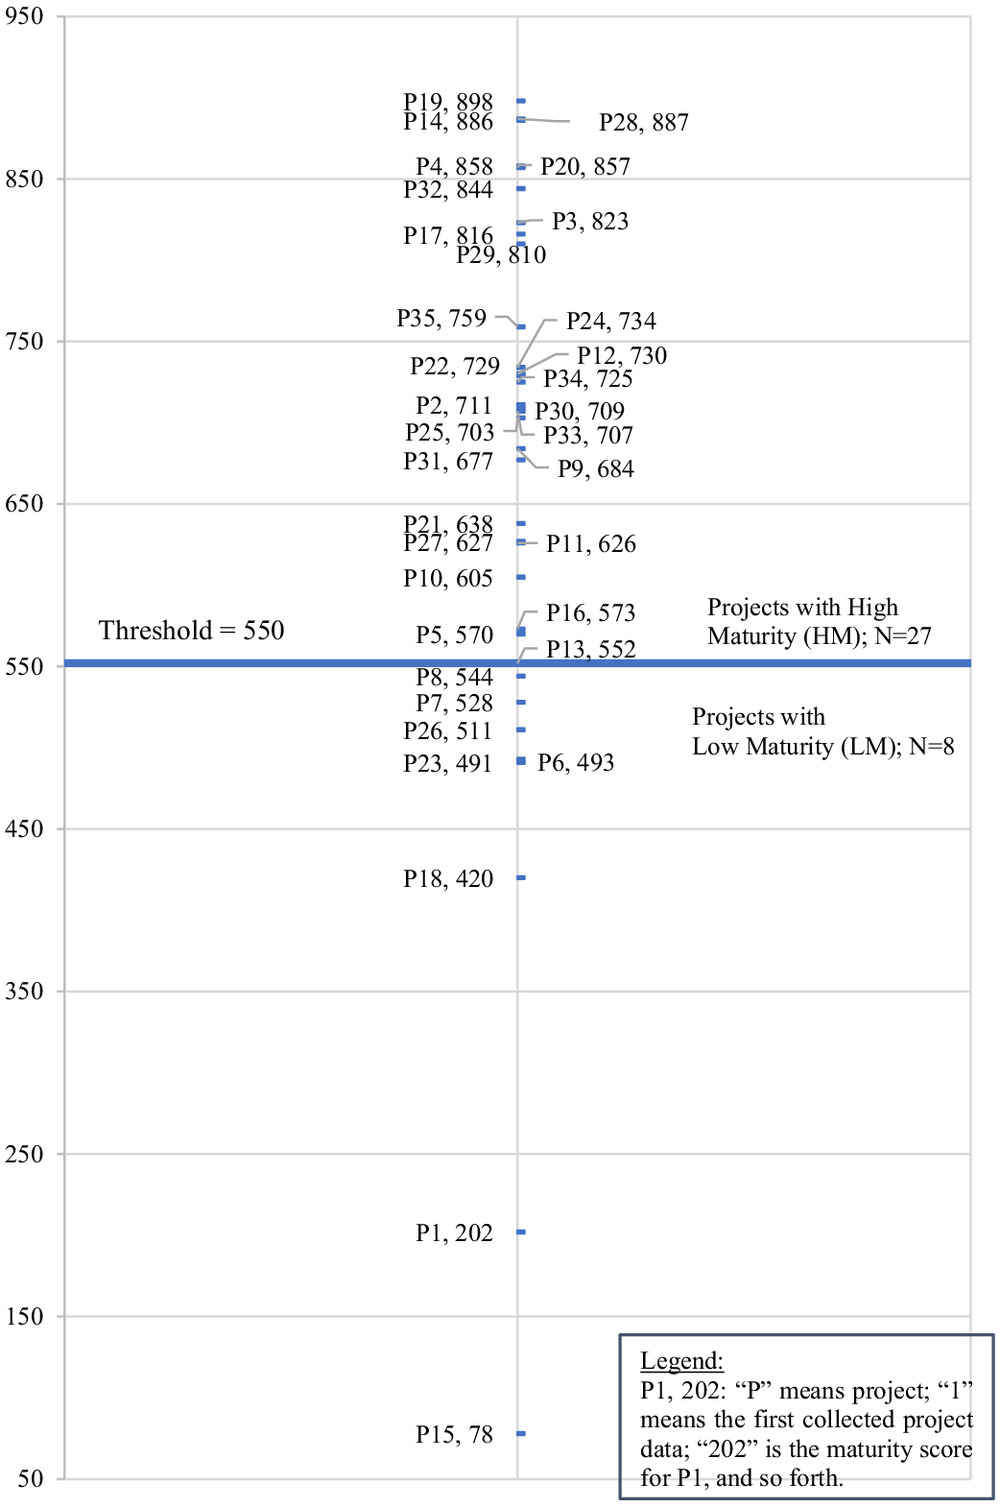
The lowest p-value of 0.0020 corresponded to the maturity score of 544. This means that a score between 544 and the following 552 is expected to divide the projects into two at the most statistically significant point. The authors discussed the project performance differences with the RT considering the median, the results of the step-wise analysis, and various score threshold around the median. After data analysis and feedback from the RT, the authors decided to set the EVMS maturity score threshold at 550 in the sample in line with the proven method from the literature and agreed-upon with the RT for practicality in the field. Therefore, the projects with scores greater than 550 were considered as HM projects, versus those with less than 550. Furthermore, the project names were numbered from P1, to P35 where P stands for project to ensure confidentiality of the data. Fig. 6 shows the maturity scores of P1 to P35 and, where the horizontal line splits them into two at the threshold. This may imply that future or current projects and programs could potentially be benchmarked against this threshold value, and as an option, striving to achieve a better score, hence an enhanced application of EVMS.
Performance Data Analysis and Discussion
First, the authors investigate the impact of high and low EVMS maturity on the continuous performance metrics: cost growth with and without change orders, schedule growth, change absolute value, contingency, and final CPI. The authors performed Shapiro-Wilk normality tests for the data in each subgroup (HM and LM projects) to test their differences statistically with an appropriate statistical test. Since the spread of the continuous performance metric data deviated significantly from a normal distribution in at least one subgroup, Mann-Whitney-Wilcoxon (MWW) tests were conducted that compare the medians between the two subgroups (Corder and Foreman 2014; McCrum-Gardner 2008). Therefore, the medians are calculated per subset, as well as the absolute value of difference between median for the two subsets (delta). The results of all these steps are in Table 2.
| Performance Metric | Subgroup | N | Sig.a | Median | Delta-median | Sig.b |
|---|---|---|---|---|---|---|
| Cost growth | HM | 26 | 0.000 | 54.5% | 0.002 | |
| LM | 8 | 0.006 | ||||
| Cost growth, excluding change orders | HM | 22 | 0.001 | 14.1% | 0.087 | |
| LM | 7 | 0.565 | ||||
| Schedule growth | HM | 26 | 0.000 | 20% | 0.289 | |
| LM | 8 | 0.958 | ||||
| Change absolute value | HM | 23 | 0.000 | 19.4% | 0.047 | |
| LM | 7 | 0.006 | ||||
| Contingency | HM | 23 | 0.000 | 2.6% | 0.750 | |
| LM | 7 | 0.000 | ||||
| Final CPI | HM | 27 | 0.006 | 0.99 | 0.07 | 0.125 |
| LM | 8 | 0.692 | 0.92 |
Note: HM = high maturity; and LM = low maturity.
a
“Sig.” is the p-value resulting from the Shapiro-Wilk normality test.
b
“Sig.” is the p-value resulting from the statistical test when comparing the two subgroups.
Second, the authors investigated the impact of EVMS maturity on the discrete performance metrics. Data were collected on a Likert scale of 1 to 5 in terms of three discrete metrics, “the project met its objectives and business drivers,” “customers were satisfied with the results of the project/program,” and “the EVMS helped to proactively manage the project/program.” Ranking them as 5 meant that the project met the criteria very successfully; whereas 1 meant the project did not meet the criteria (very unsuccessfully). The scale in between ranged from successfully (4) to somewhat successfully (3), and unsuccessfully (2). Compliance is the final discrete metric; the participants assessed their projects if they were compliant with the guidelines (NDIA 2018a) at the point in time at 20 percent project completion or not (EVMS compliance is typically certified by the owner). Regarding the discrete metrics, given their variable type, the Mann-Whitney U-tests were used to indicate whether the differences between the subgroups were statistically significant or not. The descriptive statistics of the discrete variables and the results of the tests are in Tables 3 and 4.
| Performance metric | Subgroup | N | Mean | Delta-mean | Median | Delta-median | Sig.a |
|---|---|---|---|---|---|---|---|
| Meeting business objectives | HM | 27 | 4.4 | 1.3 | 5.0 | 1.5 | 0.006 |
| LM | 8 | 3.1 | 3.5 | ||||
| Customer satisfaction | HM | 27 | 4.4 | 1.3 | 5.0 | 1.0 | 0.012 |
| LM | 8 | 3.1 | 4.0 | ||||
| EVMS helped proactively manage | HM | 27 | 3.7 | 1.0 | 4.0 | 1.0 | 0.067 |
| LM | 8 | 2.7 | 3.0 |
Note: HM = high maturity; LM = low maturity; Delta-mean = absolute difference in means between HM and LM subgroups; Delta-median = absolute difference in medians between HM and LM subgroups.
a
“Sig.” is the p-value resulting from the statistical test when comparing the two subgroups.
| Performance metric | Subgroup | N | % of compliant projects | % of noncompliant projects | Sig.a |
|---|---|---|---|---|---|
| Compliance | HM | 25 | 88.0% | 12.0% | 0.002 |
| LM | 7 | 28.6% | 71.4% |
Note: HM = high maturity; and LM = low maturity.
a
“Sig.” is the p-value resulting from the statistical test when comparing the two subgroups.
The results showed a statistically significant difference between HM and LM projects in seven out of ten performance metrics for this sample. These included three continuous variables and all four discrete variables. As such, the relationship between higher EVMS maturity and project performance, as raised by research question #3, was found for seven out of the ten performance metrics. No statistically significant differences were found in terms of schedule growth, contingency, and final CPI.
In terms of continuous variables, the differences in cost growth between HM and LM projects are statistically significant at 0.05 level: on average, the HM projects outperformed LM projects by approximately 54% in cost growth in the sample. This may imply that stakeholders, by putting an emphasis on the maturity of all ten EVMS subprocesses, could potentially improve project performance dramatically based on this sample. Although the academic literature lacks evidence on impact of EVMS maturity on project performance, the authors found these results to be aligned with industry sources reporting that one of the high program cost growth reasons are immature processes (GAO 2021), and immature organizational capabilities (PMI 2018). While this study’s sample contains a wide range of project types, these results were found to be complementary to the exploratory study on the environment around EVMS and cost performance focusing only on construction projects from the sample (Aramali et al. 2022c). In general, EVMS implementation processes were also found to significantly impact project success (Kim et al. 2003) and maturity of the project management is an essential ingredient in organizations to achieve cost savings (Yazici 2009). Second, the differences were statistically significant at a 0.1 level in terms of cost growth, excluding change orders. This means that change orders had a large impact on cost growth, and isolating the impact of change orders, the HM projects have better cost performance by 14%, on average, in the sample. Errors or omission in contracts and scope related issues lead to higher change orders (Alnuaimi et al. 2010; Günhan et al. 2007; Dumont et al. 1997), and the EVMS guidelines support improved scope definition with quality work breakdown structure (WBS). Therefore, greater change orders were anticipated in LM projects. Another serious problem with the LM projects could be that changes were handled inadequately and so the EV calculations were not relevant (Joseph and Lukas 2008). Third, the differences in change absolute value were statistically significant at 0.05 level: on average, the LM projects experienced 19% greater change orders versus PMB than HM projects. This may imply that stakeholders putting an emphasis on the maturity of the 10 EVMS subprocess could also have higher chances of completing the project with fewer change orders.
The differences in terms of all four discrete variables were also significant. The HM projects were better in meeting business objectives, satisfying the customer, using EVMS for a proactive project management, and compliance. Although applied in an organizational setting, these results matched with the findings of Yazici (2009) who revealed that organizations having higher level of project management process maturity apply best practices and can achieve cost savings, compete better and succeed in business. Similarly, organizations that had mature processes experienced higher customer satisfaction and business returns (Goldenson and Gibson 2003).
Correlation Between EVMS Maturity and Project Performance
The authors tested for correlation between the EVMS maturity score and each of the cost growth with and without change orders, schedule growth, change absolute value, contingency, and final CPI. The correlation coefficient, with an value between and , informs on the strength of the linear relationship between two variables (Sheskin 2003). The results are shown in Table 5.
| Metric | Sample size | Correlation coefficient (r) | Sig. |
|---|---|---|---|
| Cost Growth (in %) | 34 | 0.257 | |
| Cost Growth, excluding change orders (in %) | 29 | ** | 0.062 |
| Schedule Growth (in %) | 34 | 0.027 | 0.880 |
| Change Absolute Value (in %) | 30 | 0.636 | |
| Contingency (% of PMB) | 30 | 0.631 | |
| Final CPI | 35 | 0.397* | 0.018 |
Note: *Correlation is significant at 0.05 level; and **Correlation is significant at 0.1 level.
The results show two significant and weak relationships. The first is between the EVMS maturity and cost growth excluding the value of change orders (; ). The second is between EVMS maturity and final CPI (; ). The higher the EVMS maturity, the less cost growth for this sample, isolating the impact of change orders. And the project cost efficiency (CPI) improves with higher levels of EVMS maturity. These results improve the understanding of the impact of EVMS maturity to the project performance in support to the third research question.
Conclusion and Future Work
As part of this investigation, the authors developed a novel and effective EVMS maturity assessment framework with the help of a large research team consisting of 36 EVMS industry experts and based on an extensive literature review, an industry survey, four framework development workshops, and four performance testing workshops, including collected feedback from an additional 56 EVMS practitioners.
Using this framework, the maturity of each of the 56 attributes and its corresponding description is evaluated on a rating scale ranging from 1 to 5 resulting in an overall project EVMS maturity score (1,000 points is the maximum; with higher meaning better maturity). Each scale has well-defined criteria and a score associated with it. Based on the practitioners’ feedback, Planning and scheduling subprocess was found to have the highest impact on EVMS maturity, followed by Budgeting and Work Authorization, and Change Control. Conversely, Material Management, and Indirect Budget and Cost Management have the lowest impact. Out of the 56 attributes: (1) Identify, Analyze and Manage Risk; (2) Risk Integration; and (3) Critical Path and Float were identified as the top maturity attributes in level of importance.
The authors tested this framework on 35 completed projects, totaling $21.8 billion, that were collected from 31 subject matter experts through four framework testing workshops. Their average maturity score is 657 and their median is 703 out of 1,000. The score threshold between projects with high (HM) and low (LM) EVMS maturity based on the step-wise sensitivity analysis of the sample is 550. Significant differences were determined between the two subgroups in terms of most of the performance metrics: cost growth, cost growth excluding change orders, change absolute value, meeting business objectives, customer satisfaction, EVMS helped proactively manage projects, and compliance. HM projects outperformed LM projects in these metrics.
For this sample, the authors found quantitative evidence of the relationship between EVMS maturity and project performance. On average, projects that demonstrate a high level of EVMS maturity showed a 54% difference in terms of cost growth versus a PMB at 20% project completion and, 19% difference in change orders versus the PMB at this same point. These results are based on a project sample with a wide variety of project types.
Overall, based on the favorable feedback of the industry experts who participated in all the workshops, the authors concluded that the EVMS maturity attributes and subprocesses can be defined, agreed-upon, and measured. Participants also agreed on the practicality of the framework in the field.
Key guidance to practitioners is using the framework several times during a project lifecycle. Since the framework was shown to be effective and practical, project leaders from both the customer or/and the contractor side (i.e., project business managers, project control analysts, control account managers, and so forth) would be able to use it to positively influence the project outcomes before the project ends. Evaluating each of the 56 attributes as applied to the project, helps identify the poorly rated attributes. These attributes can then be taken to project team meetings, where decision makers can address them as the project progresses, similar to the gap analysis step to achieve EVMS compliance certifications (Lindsay et al. 2013). Furthermore, the correlation coefficients found between project performance measures and EVMS maturity suggest that they are able to specifically improve the project cost performance by employing mature EVMS attributes and subprocesses throughout the project lifecycle.
Overall, the contributions of this study to the body of knowledge are twofold. First, a novel EVMS maturity assessment framework, named IP2M METRR, which stands for integrated project/program management maturity and environment total risk rating, was created considering 56 maturity attributes derived from multiple sources and extensive input from industry. The framework provides the capability for project owners and contractors to objectively and consistently assess their EVMS throughout a given project. Therefore, it sheds light on the issues related to project controls and on any underdeveloped characteristics needed for a high-performing EVMS. Owners and contractors can use the framework on large and complex projects in construction, aerospace, energy, defense, and other sectors. Second, the framework was tested on 35 completed projects and programs giving data-driven evidence on the relation between the EVMS maturity and project performance, for the first time. Such a research and development investigation has not been conducted in the past and is a major contribution of this paper.
Some limitations may exist in this study. The tested projects were all located in the United States; however, the framework was developed considering international standards and guidelines that are applicable across geographic boundaries. Future work could include international projects and comparing the results to those published in this paper. Moreover, although the sample used in this study is considered large and reached statistical significance, the findings from this sample may not represent the broader population of all projects. Future work also includes continuing to test the framework on in-progress projects, as well as evaluating the impact of social aspects on project performance together with EVMS maturity. The authors expect that these efforts will help stakeholders exercise more effective EVMS application and control over their projects, and benchmark against other projects for competitive advantage.
Data Availability Statement
Some or all data, models, or code that support the findings of this study are available from the corresponding author upon reasonable request.
Acknowledgments
This research received funding from the U.S. Department of Energy through a project entitled “Improving the Reliability of EVMS Compliance Reviews and EVMS Maturity Level Assessments.”, with contract number DOEPM.400211.TS-003.ASU. The authors are grateful for their support and thank all the professionals participating on the research team for their valuable input throughout the research process.
References
Alnuaimi, A. S., R. A. Taha, M. Al Mohsin, and A. S. Al-Harthi. 2010. “Causes, effects, benefits, and remedies of change orders on public construction projects in Oman.” J. Constr. Eng. Manage. 136 (5): 615–622. https://doi.org/10.1061/(ASCE)CO.1943-7862.0000154.
Alzraiee, H. 2018. “Integrating BIM and earned value management system to measure construction progress.” In Proc., Construction Research Congress 2018, 684–693. Reston, VA: ASCE.
Andersen, E. S., and S. A. Jessen. 2003. “Project maturity in organisations.” Int. J. Project Manage. 21 (6): 457–461. https://doi.org/10.1016/S0263-7863(02)00088-1.
Aramali, V., G. E. Gibson Jr., M. El Asmar, and N. Cho. 2021. “Earned value management system state of practice: Identifying critical subprocesses, challenges, and environment factors of a high-performing EVMS.” J. Manage. Eng. 37 (4): 04021031. https://doi.org/10.1061/(ASCE)ME.1943-5479.0000925.
Aramali, V., G. E. Gibson Jr., M. El Asmar, N. Cho, and H. Sanboskani. 2022a. “EVMS maturity assessment tool development process, Report No. 4, Annex A.” In School of sustainable engineering and the built environment. Tempe, AZ: Arizona State Univ.
Aramali, V., H. Sanboskani, G. E. Gibson Jr., and M. El Asmar. 2022b. “EVMS maturity and its impact on project cost and schedule performance of large and complex projects: A preliminary analysis.” In Proc., Construction Research Congress 2022. Reston, VA: ASCE. https://doi.org/10.1061/9780784483978.112.
Aramali, V., H. Sanboskani, G. E. Gibson Jr., and M. El Asmar. 2022c. “An exploratory study of EVMS environment factors and their impact on cost performance for construction and environmental projects.” In Proc., 9th Int. Conf. on Construction Engineering and Project Management 2022, 170–178. Seoul: International Consortium of Construction Engineering and Project Management.
Aramali, V., H. Sanboskani, G. E. Gibson Jr., M. El Asmar, and N. Cho. 2022d. “Forward-looking state-of-the-art review on earned value management systems: The disconnect between academia and industry.” J. Manage. Eng. 38 (3): 03122001. https://doi.org/10.1061/(ASCE)ME.1943-5479.0001019.
Bembers, I., M. Jones, E. Knox, and J. Traczyk. 2017. Better earned value management system implementation research study. Arlington, VA: Joint Space Cost Council.
Bergerud, C. 2017. “Adopting a flexible EVM strategy to optimize project performance.” In Proc., AACE Int. Transactions, EVM-2590. Morgantown, WV: AACE International.
Brookes, N., M. Butler, P. Dey, and R. Clark. 2014. “The use of maturity models in improving project management performance: An empirical investigation.” Int. J. Managing Projects Bus. 7 (2): 231–246. https://doi.org/10.1108/IJMPB-03-2013-0007.
Caldas, C., G. E. Gibson Jr., R. Weerasooriya, and A. Yohe. 2009. “Identification of effective management practices and technologies for lessons learned programs in the construction industry.” ASCE J. Constr. Eng. Manage. 135 (6): 531–539. https://doi.org/10.1061/(ASCE)CO.1943-7862.0000011.
Cho, N., M. El Asmar, G. E. Gibson Jr., and V. Aramali. 2020. “Earned value management system (EVMS) reliability: A review of existing EVMS literature.” In Proc., Construction Research Congress 2020. Reston, VA: ASCE. https://doi.org/10.1061/9780784482889.066.
Christensen, D. S. 1998. “The costs and benefits of the earned value management process” J. Param. 18 (2): 1–16. https://doi.org/10.1080/10157891.1998.10462568.
Corder, G. W., and D. I. Foreman. 2014. Nonparametric statistics: A step-by-step approach. New York: Wiley.
Crawford, J. K. 2001. Project management maturity model: Providing a proven path to project management excellence. Boca Raton, FL: CRC Press.
DeSimone, J. A., P. D. Harms, and A. J. DeSimone. 2015. “Best practice recommendations for data screening.” J. Organ. Behav. 36 (2): 171–181. https://doi.org/10.1002/job.1962.
DOE. 2018. Office of project management EVMS compliance review standard operating procedure (ECRSOP)–APPENDIX A: Compliance assessment guidance (CAG). Washington, DC: DOE.
DOE. 2020. Integrated project management - Earned value management system (EVMS). DOE G 413.3-10B. Washington, DC: DOE.
Dumont, P. R., and G. E. Gibson Jr., and J. R. Fish. 1997. “Scope management using project definition rating index.” J. Manage. Eng. 13 (5): 54–60. https://doi.org/10.1061/(ASCE)0742-597X(1997)13:5(54).
El Asmar, M., G. E. Gibson Jr., D. Ramsey, A. Yussef, and Z. U. Din. 2018. The maturity and accuracy of front end engineering design (FEED) and its impact on project performance. Austin, TX: Construction Industry Institute.
Finefield, T. 2013a. “Earned value management guidelines: Accounting considerations, analysis and management reports, revisions and data maintenance.” Coll. Perform. Manage. 2: 7–18.
Finefield, T. 2013b. “Earned value management guidelines: Organization and planning, scheduling and budgeting.” Coll. Perform. Manage. 1: 5–13.
Frahm, V. L. 2012. “Designing a tailored earned value management system (EVMS).” In Proc., 2012 AACE Int. Transactions, EVM.1059. Morgantown, WV: AACE.
GAO (Government Accountability Office). 2019. Cost and schedule performance of large facilities construction projects and opportunities to improve project management. Washington, DC: GAO.
GAO (Government Accountability Office). 2021. Increased focus on knowledge needed to achieve intended performance and innovation outcomes. Washington, DC: GAO.
Gareis, R., and M. Huemann. 2000. “Project management competences in the project-oriented organization.” In Vol. 3 of Gower handbook of project management, 31–43. Aldershot, UK: Gower Publishing.
Garrett, G. A., and R. G. Rendon. 2006. US military program management: Lessons learned and best practices. Oakland, CA: Berrett-Koehler Publishers.
Gibson, G. E., Jr., H. Sanboskani, M. El Asmar, and V. Aramali. 2022. “Employing technology to enable remote research charrettes as a method for engaging industry and uncovering best practices: A novel approach for a post-COVID-19 World.” J. Manage. Eng. ASCE 148 (11): 04022122. https://doi.org/10.1061/%28ASCE%29CO.1943-7862.0002375.
Gibson, G. E., Jr., and D. A. Whittington. 2010. “Charrettes as a method for engaging industry in best practices research.” J. Constr. Eng. Manage. 136 (1): 66–75. https://doi.org/10.1061/(ASCE)CO.1943-7862.0000079.
Goldenson, D., and D. L. Gibson. 2003. Demonstrating the impact and benefits of CMMI: An update and preliminary results. Pittsburgh: Carnegie Mellon/Software Engineering Institute.
Green, G., P. Kennedy, and A. McGown. 2002. “Management of multi-method engineering design research: A case study.” J. Eng. Tech. Manage. 19 (2): 131–140. https://doi.org/10.1016/S0923-4748(02)00006-1.
Günhan, S., D. Arditi, and J. Doyle. 2007. “Avoiding change orders in public school construction.” J. Prof. Issues Eng. Educ. Pract. 133 (1): 67–73. https://doi.org/10.1061/(ASCE)1052-3928(2007)133:1(67).
Hanna, A. S. 2012. “Using the earned value management system to improve electrical project control.” J. Constr. Eng. Manage. 138 (3): 449–457. https://doi.org/10.1061/(ASCE)CO.1943-7862.0000426.
Humphrey, W. S. 1989. Managing the software process. Boston: Addison-Wesley Longman.
ISO (International Standard Organization). 2018. Earned value management in project and programme management. Geneva: ISO.
Joseph, A., and P. E. Lukas. 2008. “Earned value analysis—Why it doesn’t work.” In Proc., AACE Int. Transactions, EVM.01. Morgantown, WV: AACE.
Jugdev, K., and R. Müller. 2005. “A retrospective look at our evolving understanding of project success.” Project Manage. J. 36 (4): 19–31. https://doi.org/10.1177/875697280503600403.
Kerzner, H. 2009. Project management: A systems approach to planning, scheduling, and controlling. New York: Wiley.
Kim, E., and W. G. Wells Jr., and M. R. Duffey. 2003. “A model for effective implementation of earned value management methodology.” Int. J. Project Manage. 21 (5): 375–382. https://doi.org/10.1016/S0263-7863(02)00049-2.
Kwak, S. K., and J. H. Kim. 2017. “Statistical data preparation: Management of missing values and outliers.” Korean J Anesthesiol. 70 (4): 407. https://doi.org/10.4097/kjae.2017.70.4.407.
Kwak, Y. H., and F. T. Anbari. 2009. “Analyzing project management research: Perspectives from top management journals.” Int. J. Project Manage. 27 (5): 435–446. https://doi.org/10.1016/j.ijproman.2008.08.004.
Kwak, Y. H., and F. T. Anbari. 2012. “History, practices, and future of earned value management in government: Perspectives from NASA.” Project Manage. J. 43 (1): 77–90. https://doi.org/10.1002/pmj.20272.
Liggett, W., H. Hunter, and M. Jones. 2017. “Navigating an earned value management validation led by NASA: A contractor’s perspective and helpful hints.” In Proc., IEEE Aerospace Conf., 1–28. New York: IEEE.
Lindsay, S. E., M. A. M. Lindsay, and J. M. G. Morton. 2013. “Lessons learned in earned value management system certification.” In Proc., AACE Int. Transactions, EVM.1354. Morgantown, WV: AACE International.
Liu, G., R. Huang, K. Li, A. Shrestha, and X. Fu. 2022. “Greenhouse gas emissions management in prefabrication and modular construction based on earned value management.” J. Constr. Eng. Manage. 148 (6): 04022034. https://doi.org/10.1061/%28ASCE%29CO.1943-7862.0002268.
Magnaye, R., B. Sauser, P. Patanakul, D. Nowicki, and W. Randall. 2014. “Earned readiness management for scheduling, monitoring and evaluating the development of complex product systems.” Int. J. Project Manage. 32 (7): 1246–1259. https://doi.org/10.1016/j.ijproman.2014.01.009.
McCrum-Gardner, E. 2008. “Which is the correct statistical test to use?” Br. J. Oral Maxillofacial Surgery 46 (1): 38–41. https://doi.org/10.1016/j.bjoms.2007.09.002.
McGregor, J. S. 2019. Department of defense earned value management implementation guide (EVMIG). Arlington, VA: Dept. of Defense.
McNamee, E. M., C. E. Hanner, and C. W. Immonen. 2017. “Improving EVMS compliance through data integration.” In Proc., AACE Int. Transactions, EVM-2581. Morgantown, WV: AACE.
Melamed, D., and R. C. Plumery. 2015. “A critical analysis of the ANSI/EIA standard for EVMS and the TCM framework.” In Proc., AACE Int. Transactions, EVM.2041. Morgantown, WV: AACE.
Mullaly, M. 2014. “If maturity is the answer, then exactly what was the question?” Int. J. Managing Projects Bus. 7 (2): 169–185. https://doi.org/10.1108/IJMPB-09-2013-0047.
NASA (National Aeronautics and Space Administration). 2018. Earned value management (EVM) implementation handbook. Washington, DC: NASA.
NDIA (National Defense Industrial Association). 2016. Earned value management system acceptance guide. ANSI/EIA 748. Arlington, VA: Integrated Program Management Division.
NDIA (National Defense Industrial Association). 2018a. Earned value management systems EIA-748-D intent guide. Arlington, VA: Integrated Program Management Division.
NDIA (National Defense Industrial Association). 2018b. Earned value management systems application guide. Arlington, VA: Integrated Program Management Division.
NDIA (National Defense Industrial Association). 2020. Earned value management system guideline scalability guide. Arlington, VA: Integrated Program Management Division.
Orgut, R. E., M. Batouli, J. Zhu, A. Mostafavi, and E. J. Jaselskis. 2020. “Critical factors for improving reliability of project control metrics throughout project life cycle.” J. Manage. Eng. 36 (1): 04019033. https://doi.org/10.1061/(ASCE)ME.1943-5479.0000710.
Patanakul, P., Y. H. Kwak, O. Zwikael, and M. Liu. 2016. “What impacts the performance of large-scale government projects?” Int. J. Project Manage. 34 (3): 452–466. https://doi.org/10.1016/j.ijproman.2015.12.001.
PMI (Project Management Institute). 2018. Success in disruptive times, Pulse of the Profession. Newtown Square, PA: PMI.
PMI (Project Management Institute). 2019. The standard for earned value management. Newtown Square, PA: PMI.
Sheskin, D. J. 2003. Handbook of parametric and nonparametric statistical procedures. London: Chapman and Hall.
Stratton, R. W. 2000. The EVM maturity model—EVM3™. Newtown Square, PA: Project Management Institute.
Stratton, R. W. 2006. The earned value management maturity model. San Francisco: Berrett-Koehler Publishers.
Van Der Steege, W. A. 2019. “Unpacking earned value management for oil and gas projects.” In Proc., AACE Int. Transactions, EVM.3165. Morgantown, WV: AACE.
Yazici, H. J. 2009. “The role of project management maturity and organizational culture in perceived performance.” Project Manage. J. 40 (3): 14–33. https://doi.org/10.1002/pmj.20121.
Yussef, A., G. E. Gibson Jr., M. El Asmar, and D. Ramsey. 2019. “Quantifying FEED maturity and its impact on project performance in large industrial projects.” J. Manage. Eng. 35 (5): 04019021. https://doi.org/10.1061/(ASCE)ME.1943-5479.0000702.
Zhan, Z., C. Wang, J. B. H. Yap, S. Samsudin, and H. Abdul-Rahman. 2019. “Earned value analysis, implementation barriers, and maturity level in oil & gas production.” S. Afr. J. Ind. Eng. 30 (4): 44–59. https://doi.org/10.7166/30-4-2030.
Information & Authors
Information
Published In

Journal of Construction Engineering and Management
Volume 149 • Issue 6 • June 2023
Copyright
This work is made available under the terms of the Creative Commons Attribution 4.0 International license, https://creativecommons.org/licenses/by/4.0/.
History
Received: Aug 2, 2022
Accepted: Jan 10, 2023
Published online: Mar 28, 2023
Published in print: Jun 1, 2023
Discussion open until: Aug 28, 2023
ASCE Technical Topics:
- Bibliographies
- Business management
- Construction costs
- Construction engineering
- Construction industry
- Construction management
- Engineering fundamentals
- Industries
- Information management
- Integrated systems
- Mathematics
- Organizations
- Practice and Profession
- Project management
- Statistics
- Systems engineering
- Systems management
- Value engineering
Authors
Metrics & Citations
Metrics
Citations
Download citation
If you have the appropriate software installed, you can download article citation data to the citation manager of your choice. Simply select your manager software from the list below and click Download.