Modifying School Courtyard Design to Optimize Thermal Conditions and Energy Consumption in a Hot Arid Climate
Publication: Journal of Architectural Engineering
Volume 30, Issue 4
Abstract
This research focuses on schools due to their significant energy consumption. It explores the use of well-designed unshaded courtyards as a passive design strategy in hot climate regions, an area that has received limited attention. The research methodology combines a qualitative approach, case study, and computer simulations through ENVI-met and Integrated Environmental Solutions Virtual Environment (IESve) software. The case study involves an existing school building in the hot arid climate of the United Arab Emirates (UAE). The ENVI-met software evaluates changes in the school’s microclimate and building temperature resulting from modifications to the courtyard’s design, encompassing five phases. Moreover, the research employs the predicted mean vote (PMV) metric to assess outdoor thermal comfort within school courtyards, correlating with the five design phases. The IESve software assesses the reduction in cooling sensible load achieved through improved courtyard design in the case study. The simulation results demonstrate that the optimal courtyard design lowers the school building’s temperature by 1.9°C and 1.7°C on September 21 and March 21, respectively, compared with the base case. Furthermore, it enhances PMV within the courtyard, providing students with a more comfortable outdoor environment during breaks, with maximum PMV reductions of 1.2 and 1.1 on September 21 and March 21. In addition, the optimal courtyard design achieves a significant reduction in cooling sensible load, showing a 19% decrease on September 21 and a 27% decrease on March 21, compared with the basic case. These findings underscore the potential of well-designed courtyards to enhance thermal comfort and energy efficiency in schools within hot arid climates, contributing to sustainable architectural practices.
Introduction
The global interest in designing energy-efficient schools is increasing as they are a unique type of structure of sizable portion in the built environment (Elmasry and Haggag 2011; Zhang et al. 2017; Heracleous et al. 2021), and schools, as educational buildings, consume a lot of energy to provide suitable thermal conditions for learning (Al-Khatatbeh and Ma’bdeh 2017). In hot areas, such as the United Arab Emirates (UAE), most of this energy is consumed for cooling. Al-Sallal (2010) stated that schools in the UAE are designed in a way that increases the solar gain for the internal spaces. Since then there has been no clear rules for sustainable schools related to courtyard design or orientation. This issue encouraged serious intervention in research for sustainable green schools.
Literature Insight
Schools and Energy Consumption in UAE
Zomorodian and Nasrollahi (2013) underscored the critical influence of school building orientation on cooling and lighting energy consumption, a sentiment echoed by Al-Khatatbeh and Ma’bdeh (2017), who linked high classroom occupancy to increased energy needs for maintaining optimal indoor conditions. This aligns with Elmasry and Haggag’s (2011) assertion that schools, characterized by unique occupancy patterns, are high energy consumers.
In the UAE, schools consume approximately 100 kW·h/m2/year, a substantial figure compared with Greek schools’ 57 kW·h/m2/year, influenced by the Mediterranean climate. Notably, the majority of energy in UAE schools is allocated to cooling, despite their limited daily occupancy of around eight hours (Hernandez et al. 2008; Dias Pereira et al. 2014). Al-Sallal (2010) accentuated that UAE school designs exacerbate solar gain, necessitating significant energy for cooling. The financial burden of energy expenses in schools is substantial, prompting a call for efficiency measures. According to the US Department of Energy, schools can potentially save up to 25% of total energy expenses by implementing efficient techniques (Zhang et al. 2017).
Recent Emirates Green Building Council data highlights the high energy consumption in UAE schools, with figures such as 233 kW·h/m2/year and 4,364 kW·h/student/year, emphasizing the need for sustainable practices amidst the UAE’s educational expansion. With 639 public and 580 private schools serving over a million students, the emphasis on energy-efficient design is crucial. Classrooms, particularly heat-intensive areas, and student behavior are significant factors in energy use. Studies by Demanuele, Tweddell, Davies, Salameh, Touqan, and Suliman advocate for integrating energy considerations early in school design to manage heat gain and reduce consumption (Emirates GBC 2023; Jesse 2023; Brebbia and Beriatos 2011; Elmasry and Haggag 2011; Salameh et al. 2023b).
Elkhapery et al. (2023) and Salameh et al. (2024) emphasize cost-effective green modifications, while Albattah and Bande (2023) focus on increasing environmental sustainability awareness among students. Rahmani et al. (2023) show that window-shading techniques, such as pocketed designs, can significantly lower energy consumption by creating a cooler microclimate. Al-Naemi’s (2024) investigation introduces a comprehensive life-cycle assessment for a school, targeting carbon emission reduction via solar panel installation to achieve neutrality with nearly half the school’s roof covered. Despite initial economic concerns, further evaluations are encouraged. This aligns with global sustainable goals and Qatar’s vision for environmentally friendly infrastructure. Concurrently, research by Elmasry and Haggag (2011) and Al Dakheel et al. (2018) underlines the critical role of sustainable and efficient designs in UAE schools, adhering to Estidama standards and leveraging renewable technologies, reflecting a global push for ecoconscious educational facilities amid unique regional challenges. These studies advocate for energy-efficient, health-aligned educational spaces considering the UAE’s unique climate and culture. Recognizing the urgency of reducing energy consumption from fossil fuels.
Moreover, the UAE has recently focused on agendas for renewable energy production besides energy efficiency in buildings. These initiatives signify a proactive approach to addressing the escalating energy demands of the growing education sector and contribute to the global commitment to sustainable and ecofriendly practices. While extensive research exists, there is still minimal focus on adopting passive design features such as courtyards in educational buildings for enhanced thermal comfort and energy efficiency. The necessity for incorporating courtyards as passive design elements in educational buildings is becoming increasingly apparent. These spaces not only contribute to energy conservation by enhancing thermal comfort within school environments but also align with sustainable design principles, highlighting an area that requires further exploration and implementation in the architectural planning of schools.
Courtyards as a Passive Design Solution
Many studies have recommended the courtyard as a passive design solution for sustainable buildings in hot areas, consequently for the mitigation of the climate change (Diz-Mellado et al. 2020; Muhaisen and Gadi 2006). Courtyards can enhance indoor thermal conditions with less electricity intake (Abuhussain et al. 2022; Sun et al. 2023; Soltanzadeh 2011; Diz-Mellado et al. 2021; Kujundzic et al. 2023), as they act as a channel for warm air to be cleared and replaced by cooler air. This mechanism decreases the entire building’s temperature throughout the nighttime until it reaches its lowest point at sunrise (Al-Hafith et al. 2017). Air circulation in the courtyard is usually created because of the stack effect where the courtyard serves as a conduit, channeling indoor air upward toward the sky, driven by the variance in air density between the indoor and outdoor environments. This process is known as stack-driven ventilation (Abbaas et al. 2018), which improves the ventilation, especially in hot arid areas, as it takes away the heat and moisture to accomplish thermal comfort (Tablada et al. 2005; Rajapaksha et al. 2003; Zakaria and Kubota 2014; Jamaludin et al. 2014; Abdulkareem 2016; Reynolds 2002; Ok et al. 2008; Kolozali and Kolozali 2016; Yousef Mousa et al. 2017; Tablada 2013).
Soflaei et al. (2016b) detailed the benefits of courtyards in passive design, highlighting shading, vegetation’s cooling effects, and wind control as key factors in improving a building’s microclimate. Koch-Nielsen (2002) and Al-Hafith et al. (2017) further elaborated on the role of courtyards in reducing thermal gain and enhancing natural ventilation, noting the significance of their design and dimensions on the microclimate. The design of the courtyard depends on different parameters that define its efficiency in improving the thermal performance for the whole building (Reynolds 2002; TERI 2004; Berkovic et al. 2012; AlMhafdy et al. 2013; Tabesh and Sertyesilisik 2016; Markus 2016). Among those parameters are the courtyard’s shape, orientation, proportion to the built-up area, height to width ratio and sky view factor, heights of the masses around the courtyard, and vegetation.
•
The courtyard’s orientation: The orientation of courtyards significantly impacts their thermal performance, affecting air temperatures by 0.5°C to 5°C lower than outdoor temperatures based on directionality (Forouzandeh 2018; AlMhafdy et al. 2013). Studies suggest minimizing exposure of courtyards to west and east to reduce the solar radiation impact (Abdullah et al. 2013). The amount of sunlight and shade, influenced by the courtyard’s orientation and sky view factor, plays a crucial role in thermal comfort (Martinelli and Matzarakis 2017). For optimal cooling in hot climates, positioning the long axis of rectangular courtyards from west to east enhances shading and lowers building temperatures (Al-Hafith et al. 2017).
•
Courtyard ratios: As the courtyard ratios affect its thermal performance (Chadalavada 2017; Rojas-Fernandez et al. 2017; Markus et al. 2017; Manioğlu and Oral 2015), from the most common ratios of the courtyard:
○
Courtyard shape factor width-to-length ratios (W/L): El-Deeb et al. (2014) found that a courtyard’s width/length proportions have different effects on the microclimate conditions of the building. They mentioned that the thicker masses of the buildings around the courtyard might have better performance than the thinner ones. Manioğlu and Oral (2015) insisted on the importance of the courtyard W/L ratio on its thermal performance, they defined it as the shape factor for the courtyard.
○
Courtyard area to built-up area ratio (CA/BA): Soflaei et al. (2016a) stated that traditional courtyards with good thermal performance have CA/BA ranges between 18% and 44% according to many studies.
•
Courtyard outline shape: Courtyard designs have evolved from traditional square, rectangular, and circular shapes to incorporate more contemporary forms such as “T,” “Y,” and polygons to meet modern needs and design concepts (Saeed 2007; Muhaisen and Gadi 2005). Sthapak and Bandyopadhyay (2014) noted that a courtyard’s shape is influenced by factors such as site constraints and orientation. Yaşa and Ok (2014) highlighted that square courtyards maximize shade, thus cooling surrounding spaces more effectively, with minimal negative impacts during colder periods.
•
Courtyard walls height: The height of the courtyard walls according to the surrounding masses defines the shading inside it, which decreases the direct solar radiation and significantly affects the thermal performance of the courtyard and the building. Alzanfer (2014) and Jamaludin et al. (2014) pointed that courtyard walls’ heights are one of the main factors that affect the thermal behavior of the courtyard and the surrounding masses as it controls the amount of shade inside it, and thus the heat loss and gain. Antonio and Carvalho (2015) stated that the higher the walls around the courtyard, the cooler the temperature inside the courtyard and thus the surrounding spaces.
•
Courtyard greenery and landscape: Kolozali and Kolozali (2016), along with Soflaei et al. (2016a), emphasize the critical role of greenery in courtyards for enhancing thermal performance and aesthetic value. They note its benefits in creating cooler microclimates, reducing air temperatures, and providing relaxation spaces. Taleghani et al. (2014a, b), Ghaffarianhoseini et al. (2015), and Diz-Mellado et al. (2020) all supported the idea that vegetation significantly contributes to the thermal efficiency of buildings, particularly schools, by modulating courtyard temperatures.
A conspicuous gap exists in the academic discourse regarding the thermal implications of schools featuring courtyards, which is a critical oversight seldom addressed in the literature, as underscored by Zhang et al. (2017) and Salameh and Touqan (2023a).
Extensive examination of Table 1 reveals a prevailing trend in previous studies, predominantly favoring strategies other than courtyards for green school initiatives or discussing other effects of school courtyards rather than energy as in research by Salameh et al. (2023b), which sought to improve both student satisfaction and academic performance by conducting a quantitative analysis of school courtyard design. Furthermore, investigations into courtyards were historically confined to houses as passive design solutions, focusing on improving thermal dynamics and ventilation. It is imperative to acknowledge the nuanced distinctions between houses and school buildings, encompassing factors such as occupancy rates, duration of occupancy, equipment types, and architectural design, considerations that have been consistently overlooked from the early study of Al-Hemiddi and Megren Al-Saud (2001) to the recent comprehensive research conducted by Díaz-López et al. (2022).
| Proposed sustainable strategy for schools | Investigation location | Climate | Reference |
|---|---|---|---|
| The study adopted changing the building materials for school buildings to improve the lighting and thermal performance | UAE | Hot climate | Al-Khatatbeh and Ma’bdeh (2017) |
| The study adopted window shading and roof shading, landscape, night ventilation, controlling infiltration, and reducing the occupants’ pattern in the classrooms, as strategies to reduce heat gain | KSA | Hot climate | Abanomi and Jones (2005) |
| The study adopted different architectural concepts related to space arrangements, orientation, ideal window/wall proportion, shading, and shape to create sustainable schools | Iran | Hot climate | Zomorodian and Nasrollahi (2013) |
| The study nominated the cluster design as the best concept for school buildings in the different climates of Turkey, for its high efficiency in dealing with heat gain and loss | Turkey | Different climates | Harputlugil et al. (2011) |
| The study adopted passive refurbishment solutions to improve the envelope of school buildings (insulation, shading, and glazing) in a reference baseline building model | Mild Mediterranean climate | Different climates | Gil-Baez et al. (2019) |
| The study adopted a decision support model for reducing electric energy consumption in elementary school facilities | South Korea | Cold winter, hot summer | Hong et al. (2012) |
| The study adopted a comparative study of green school guidelines that included parameters such as lighting and indoor air quality | Malaysia | Hot | Ramli et al. (2012) |
| Their study focused on the importance of the landscaping in the schoolyards as it provides nice relaxing scenes; moreover, it can help in evaporative cooling for better thermal performance | Southeastern Michigan | Temperate climate | Matsuoka and Kaplan (2008) |
| The article discusses how to manage sustainable water in schools, sustainable methods, techniques, and initiatives that are used in internal and external school building design, as well as providing access to guidelines and recommendations on future actions for more sustainable schools | Egypt | Hot climate | EL-Nwsany et al. (2019) |
| The study aimed to decrease unwanted energy gains and raise cooling needs; most often, solar shading devices decrease the cooling load while increasing the heating demand as a result of reduced solar benefits | Cyprus | Mild | Heracleous et al. (2021) |
| The research sought to improve both student satisfaction and academic performance by conducting a quantitative analysis of school courtyard design | UAE | Hot | Salameh et al. (2023b) |
Díaz-López et al.’s groundbreaking research, encompassing 47 case studies, dissected and assessed passive cooling techniques, establishing their correlation with environmental ergonomics and sustainability optimization. Their discerning findings identified low thermal transmittance windows, natural ventilation, green roofs, and sun shading as predominant passive techniques. However, a notable exception emerged with the meager 13% incorporation of courtyards in school designs, a revelation that prompted Díaz-López et al. (2022) to endorse the efficacy of courtyards and other passive vernacular techniques in crafting distinct microclimates, especially in warmer regions. The incorporation of courtyards also enhances cities’ porosity, defined as the creation of voids.
Distinguishing between house buildings and school buildings in terms of occupants, occupancy duration, equipment types, and architectural design, this study is poised to make a significant contribution. Its primary aim is to delineate optimal courtyard ratios with superior thermal performance, tailored to contemporary and future school buildings in hot, humid areas. By delving into a real case study involving public school buildings with diverse courtyard configurations, the study aspires to pinpoint the most effective ratios, laying a robust foundation for subsequent in-depth investigations. The outcomes promise invaluable insights for researchers, architects, and designers, providing a strategic roadmap for enhancing the design of sustainable green school buildings based on pioneering passive design concepts. This initiative holds the potential to reshape the future of school architecture in the UAE and similar hot climate regions, fostering a more sustainable and efficient educational infrastructure.
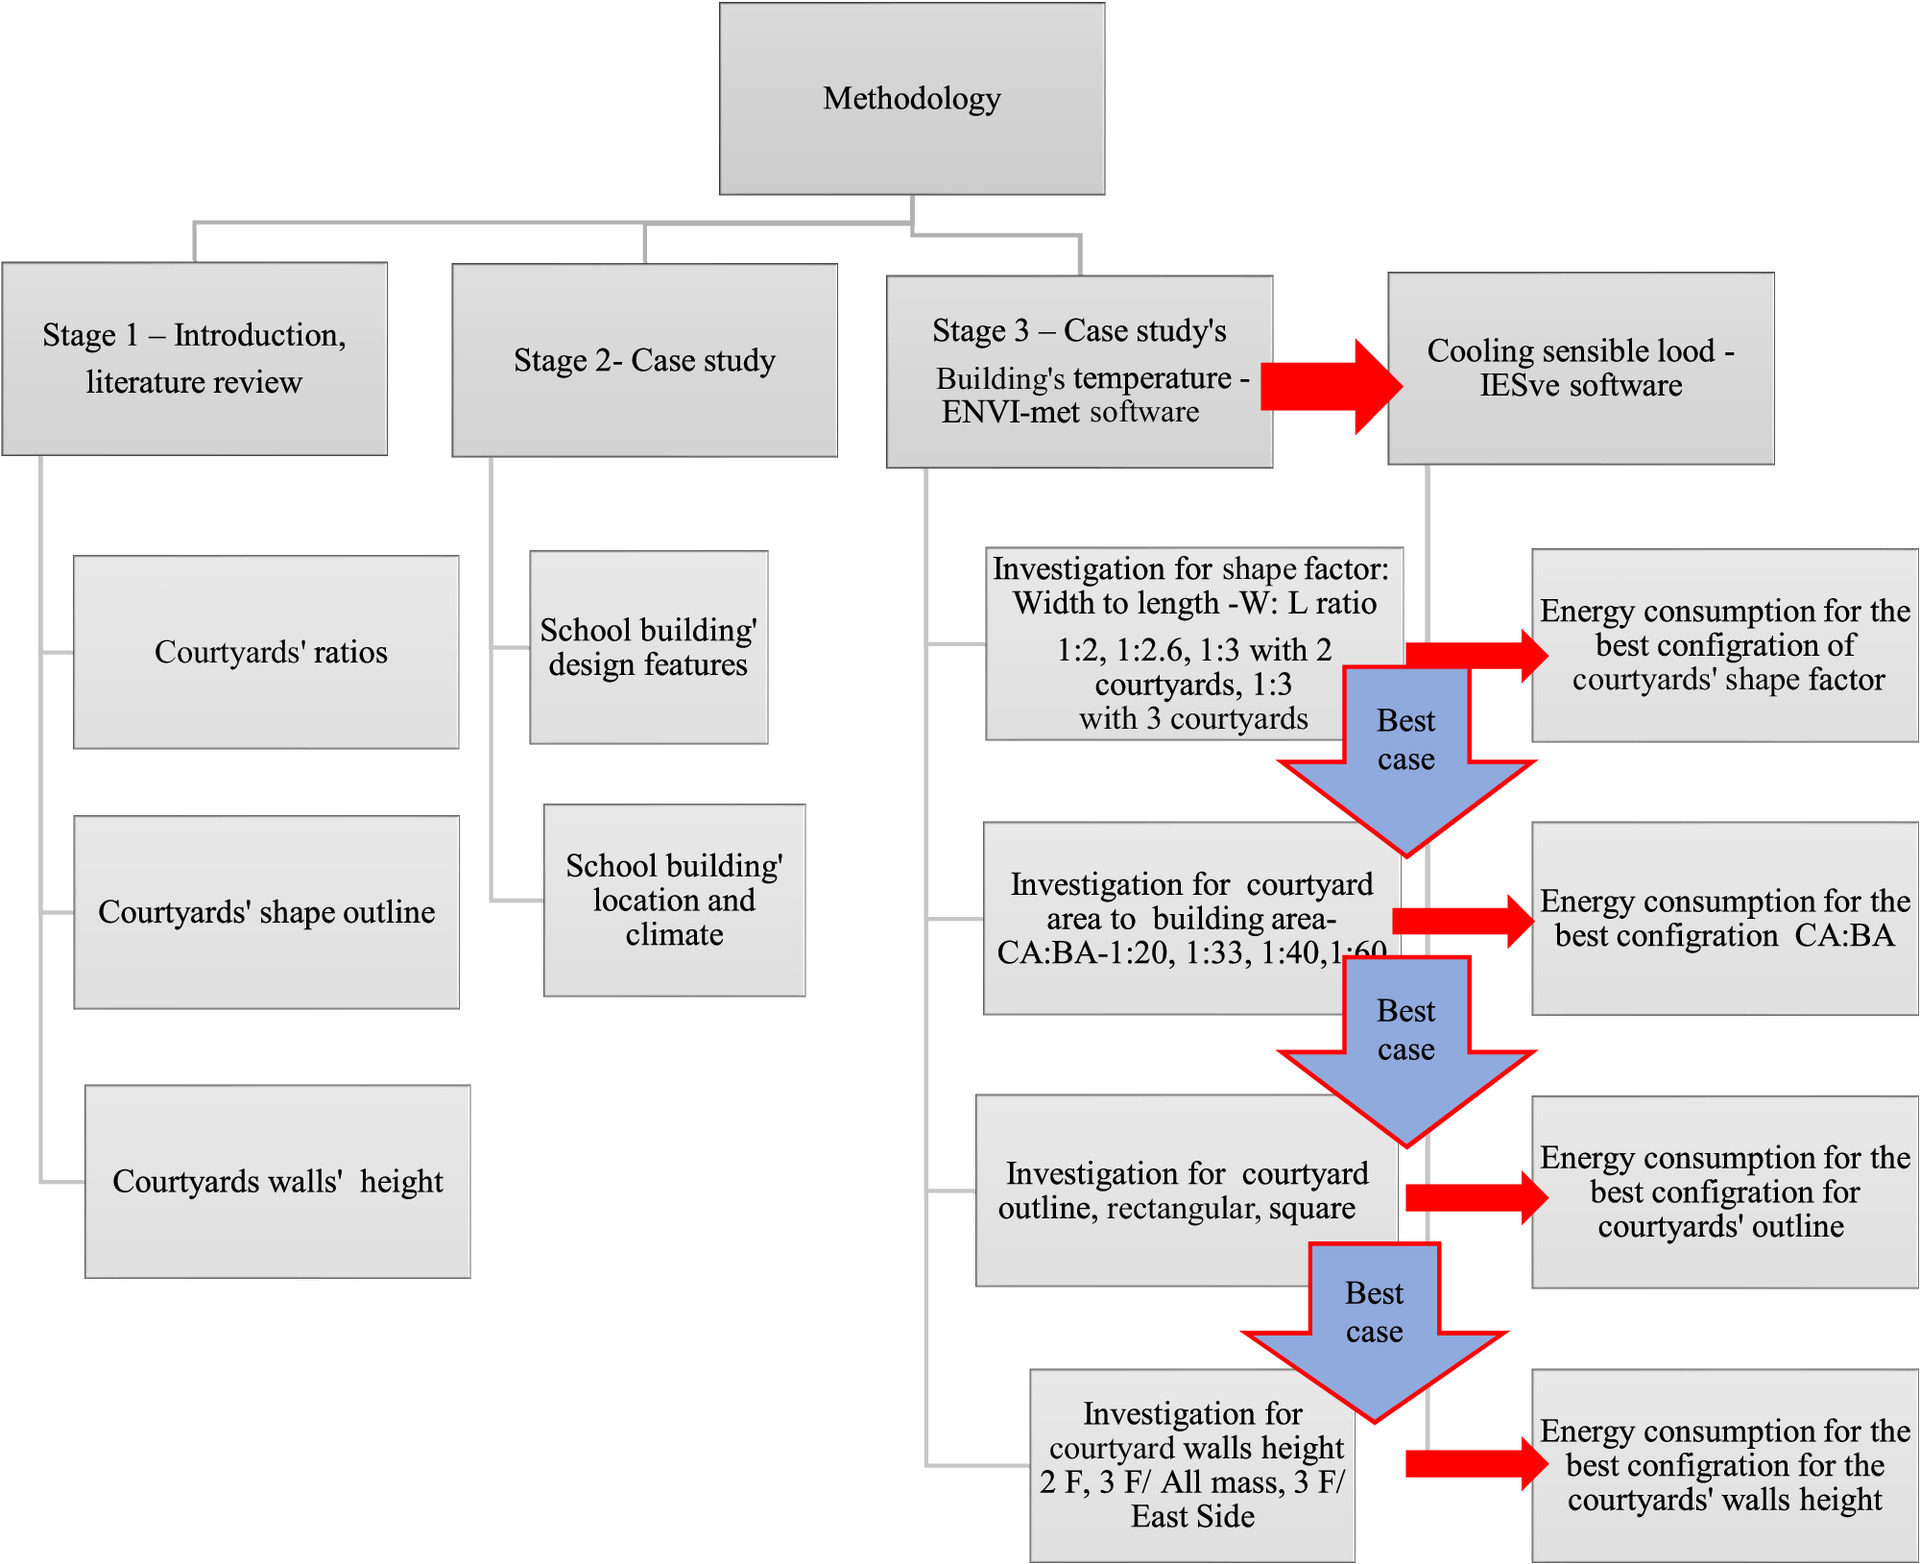
Methodology
In this research, a qualitative approach was employed to assess the thermal effects and energy usage associated with modifications in school courtyard design factors. The research focused on a specific case study, which involved the design of a new public school in the hot climate of the UAE. To conduct a thorough analysis, two software tools, ENVI-met for outdoor temperature assessment and Integrated Environmental Solutions Virtual Environment (IESve) for energy consumption evaluation, were utilized (Fig. 1). Further details regarding the methodology are elaborated in the subsequent subsections.
Case Study and Climate and Conditions
The research case study pertains to an existing modern school located in the hot and humid climate of the UAE, situated in the Middle East and southwest Asia. The UAE’s geographical coordinates range between 22°50′ and 26° north latitude and 51° to 56°25′ east longitude. The climate in the UAE is characterized by high temperatures, with an average maximum temperature of 41°C in August, and prevailing northwest winds.
The reason behind choosing this case study that it is the newest design for school buildings in the UAE. The specific school under study is known as UPA-fin, and it serves as a model for several other schools, including Al Gharayen 2 Elementary School in Sharjah. The UPA-fin school covers an area of approximately 10,206 m2 and comprises 38 classrooms, multipurpose rooms, six laboratories, activity areas, both indoor and outdoor play spaces, and administrative sections. Notably, the school’s courtyards are semienclosed spaces designed to provide comfortable environments for various student activities.
Khalfan and Sharples (2016) have defined the comfort zone temperature as ranging between 20°C and 27°C, following Schnieders’ thermal comfort chart. Consequently, the research simulations were conducted on significant dates during the school year when temperatures exceeded the comfort zone’s upper limit of 27°C. The selected dates were the September 21, characterized by the highest temperatures, and the March 21, known for the lowest temperatures. These dates were chosen as they both exceeded the comfort level, aligning with the primary challenge in hot arid regions such as the UAE, which is enhancing the microclimate around buildings and achieving cooling effects (Feroz 2015). Consequently, days with temperatures below the comfort level were excluded from the study.
Research Software and Simulation Validation
The research used two software: ENVI-met software to measure a school building’s average temperature and IESve software to calculate the cooling sensible load for the school buildings based on the proposed courtyard configurations. The decision to employ two distinct software applications, ENVI-met and IESve, in this research is driven by the comprehensive nature of assessing school thermal conditions and energy consumption within the context of optimizing courtyard design in a hot arid climate. ENVI-met software serves as an essential tool for measuring a school building’s average temperature and demonstrating improvements in outdoor thermal comfort within the courtyards. This software offers a microclimate perspective, which is crucial for understanding the local conditions. In contrast, IESve software plays a pivotal role in calculating the cooling sensible load for the school buildings based on the proposed courtyard configurations, addressing the broader energy consumption aspects. By combining these software tools, the research provides a more holistic view, encompassing microclimate enhancements and energy efficiency considerations, thus offering a well-rounded evaluation of the impact of courtyard design on school environments in hot arid climates.
ENVI-Met Software
It is a 3D micrometeorological model that enables data (air temperature and humidity) to be inserted in the climate boundary condition of the simulation to create real microclimate models based on real inputs to produce more accurate results (Salameh and Touqan 2022). In addition, it can calculate the average temperature of the building’s mass (Tb) by considering the energy balance and thermal exchange between the exterior atmospheric temperature, influenced by the courtyard’s design, and the building’s outer wall temperature (T1). This process also accounts for the heat transfer between the building’s exterior walls (T1) and the internal air (T2), as well as the temperature of the internal walls (T3). These interactions can significantly influence and assist in ascertaining the building’s indoor temperature throughout all its volume, ultimately yielding the Tb, as depicted in Fig. 2 (Huttner 2012). Recording the average building temperature is important in order to state the reduction in the temperature of the building while modifying the courtyard’s designs and the related microclimate through the research stages until reaching the optimum configuration for the courtyard. This software is widely used in many researches (e.g., Pass and Schneider 2016; Lee et al. 2016; Forouzandeh 2018; Salata et al. 2017; Salameh et al. 2023a; Salameh and Touqan 2022, 2023b).

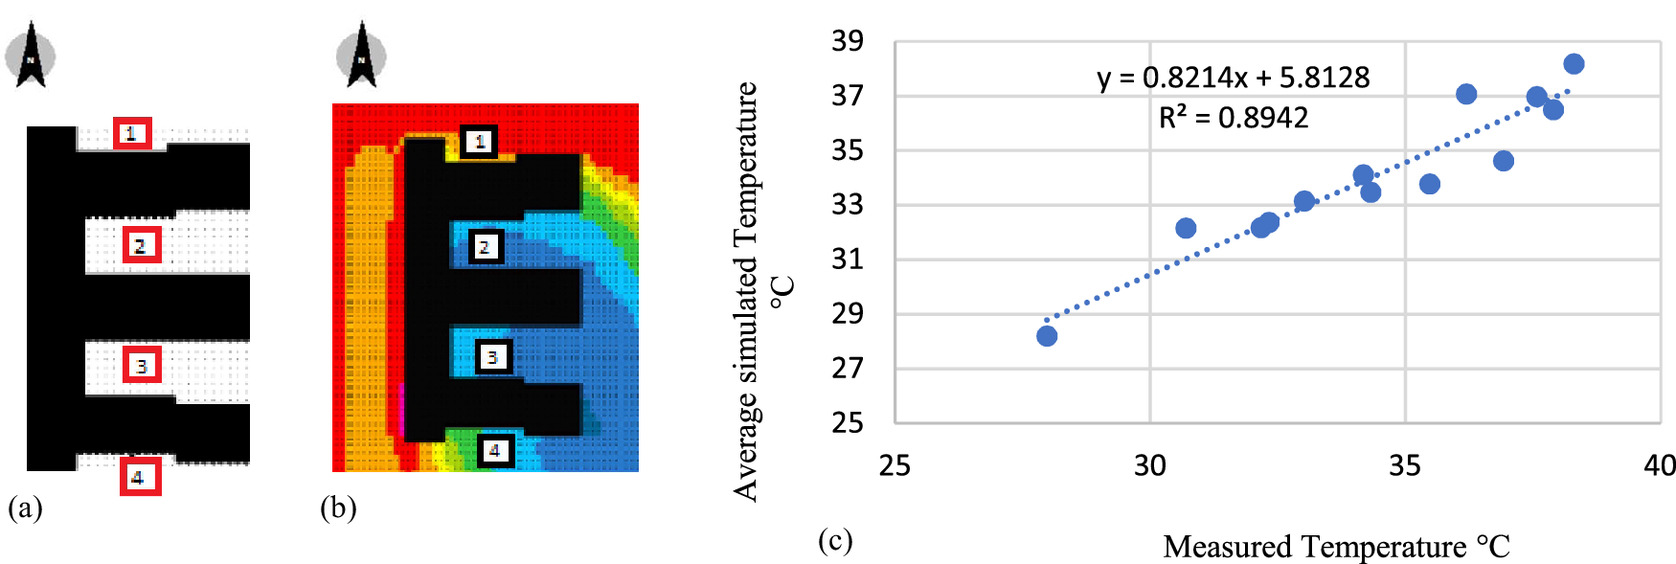
Field Measurements for ENVI-Met Validation
In this investigation, the “Upa-fin” school served as the primary case study for validating simulation software by matching simulated average air temperatures by ENVI-met software with actual field measurements. Measurements and simulations were taken at four strategic points within and around the school courtyards [Figs. 3(a and b)]. The simulations spanned a full day, while temperature logging, using Extech 45,170 m accurate to ± 1.2°C, was conducted from 8 a.m. to 8 p.m. on September 21. The study found a strong correlation (R2 around 0.89) [Fig. 3(c)] between the simulated and measured temperatures, suggesting the simulations are a reliable predictor of real-world conditions despite a small margin of error from the measuring devices.
IESve Software
The IESve software is widely used because of its good accuracy and ease of use (Hammad and Abu-Hijleh 2010; Lim et al. 2022; Salameh et al. 2022). Moreover, this software provides a variety of analysis tools that are related to buildings, such as indoor air temperature and energy consumption, as well as carbon emissions (Iesve.com 2018). Chadalavada (2017) used IESve software to investigate the thermal performance of courtyards with different proportions in vernacular houses in India. Salameh et al. (2022) used the IESve software to investigate the effect of courtyards on the thermal performance of traditional buildings. Hyun Kim et al. (2013) used the IESve for comparative research related to the standards of rating for LEED and ISO-CEN building energy consumption. Some of the buildings that were tested for the study had courtyards. AlMhafdy et al. (2013) used the IESve software to evaluate the courtyard strategy alternatives and microclimate effects on a hospital building in Malaysia. His study showed the thermal performance for the courtyard as a passive design solution. The adjustment of air temperature between the field quantities for the measurements and the simulation results by IESve gave acceptable values that were in a satisfactory boundary.
IESve software is used in this research to evaluate the cooling sensible load reduction in the case study of the school building connected to the reduction of the air temperature of it based on the improvement in the courtyard design (El-Deeb et al. 2014; Salameh and Taleb 2017; Sharmin and Steemers 2015). Moreover, Abdaljawad (2016) used this software to evaluate the effect of walls and windows in ministry schools in the UAE, based on energy consumption and lighting impacts. He added that it standard software in the UK. Heracleous and Michael (2017) used IESve software to evaluate thermal comfort based on the internal temperature for school buildings with courtyards in Cyprus. Moreover, Salameh and Taleb (2017) used IESve software to evaluate the effect of courtyards as a passive design concept for school buildings in hot areas by investigating school courtyard ratios and the effect on thermal performance and energy consumption of school buildings in the UAE. Based on that, IESve is perceived as an acceptable tool for investigating school buildings’ energy performance.
Simulation Criteria for the Research
This research embraces the concept of utilizing courtyards as passive design solutions for school buildings in hot climates, such as the UAE. The investigation is structured into a series of phases, with each phase focusing on evaluating a specific parameter related to courtyard design. The objective is to progressively identify and implement the optimal school courtyard design by carrying forward the best configurations from each phase.
The case study uses the UPA-fin school, which consists of two semiopened courtyards and two recessed spaces. The total courtyard area (CA) is 2,682 m2, while the total recessed space area is 774 m2. The entire plot area covers 10,206 m2, and the built-up area (BA) amounts to 6,750 m2. The ratios of courts to the plot area (CA/PA) and courts to the built-up area (CA/BA) are 26% and 40%, respectively, highlighting the integration of outdoor spaces within the school’s architectural design. The main two semiopened courtyards have a rectangular shape with W/L 1:2.6. The school has two floors in height, accordingly, and the five phases of the investigations are as follows:
1.
Phase 1: Courtyard ratios width/length. This is based on Manioğlu and Oral (2015), who insisted on the importance of the courtyard W/L ratio on its thermal performance, which they defined as the shape factor for the courtyard. Thus, the case study’s shape factor is W/L 1:2.6, and it is recommended to investigate new shape factor ratios for it, which are 1:2 and 1:3, besides the original one of 1:2.6.
2.
Phase 2: Courtyard area to be a built-up area ratio CA/BA, which shows the ratio of the area of the courtyard in relation to that of the built-up area. This is based on Soflaei et al. (2016b), who stated that traditional courtyards (good thermal performance) have CA/BA ranges between 18% and 44%. Thus, the case study shape factor has a CA/BA ratio of 40%, and it is recommended to investigate new CA/BA ratios for it, which are 20%, 33%, and 60% besides the original one at 40%.
3.
Phase 3: Courtyard outline shape square and rectangular. This is based on Tabesh and Sertyesilisik (2016), who stated that the geometry of the courtyard is a critical issue as the courtyard performance mainly depends on the amount of solar radiation access it has. They argued that because of the sun’s location and radiation, a square courtyard is ideal in relation to energy savings. Thus, the case study has a semiclosed rectangular outline courtyard, and it is recommended to transform the courtyard to a square shape.
4.
Phase 4: Courtyard walls height. This is based on Antonio and Carvalho (2015), who stated that the higher the walls around the courtyard, the cooler the temperature inside the courtyard and adjacent spaces. Thus, the case study has two floors with a height of 8 m, therefore it is recommended to investigate the thermal performance courtyards with three floors and a height up to 12 m.
5.
Phase 5: Further improvements will be implemented on the school buildings based on Kolozali and Kolozali (2016), who stated that greenery is an important landscape element in courtyards, as it casts a shadow for better thermal performance, defines the pathways, prevents dusty air, protects the soil structure, and offers beauty for relaxation, which agreed with Soflaei et al. (2016a). Moreover, more than one vegetation scenario can be integrated in this phase for the courtyard (Ghaffarianhoseini et al. 2015; Lee et al. 2016).
The selection of optimal configurations in the school building simulations is determined using ENVI-met software, primarily based on improvements in the Tb. These selected configurations are subsequently verified using IESve software to measure energy consumption reduction during school hours (7:00 a.m. to 2:00 p.m.), as solar gain is identified as a key factor impacting air temperature, aligning with previous research findings (Al-Khatatbeh and Ma’bdeh 2017).
Simulation Conditions and Input Data: ENVI-Met Software
The basic 3D model for the school case studies was established in ENVI-met. These are based on specific characteristics and conditions related to the location, climate, and the buildings, as presented in Tables 2 and 3.
| The basic 3D model (data) established in ENVI-met | Details of the input data |
|---|---|
| Location and climate | Dubai-UAE, hot arid climate |
| The main boundary model area | x-Grids = 60, y-Grids = 60, z-Grids = 20 |
| The cell size | dx = 3 m, dy = 3 m, dz = 2 m, this specific dimension was selected following multiple trials to optimize performance Top of Form |
| Wind direction is | 315° from the north |
| Wind speed is | 3.5 m/s |
| Roughness length z at reference point (m) is | 0.01 |
| Specific humidity is | 7.0 g water/kg air |
| The simulation period | The simulation ran for a full day, beginning at midnight on September 20 and concluding at midnight on September 21, with the same schedule applied for March 21 |
| Output interval main files | 60 min |
| Time | T°C September 21 | RH (%) September 21 | T°C March 21 | RH (%) March 21 |
|---|---|---|---|---|
| 00:00 | 35.75 | 64.25 | 21.00 | 76.67 |
| 01:00 | 35.31 | 66.94 | 20.20 | 77.33 |
| 02:00 | 34.88 | 69.63 | 19.40 | 78.00 |
| 03:00 | 34.44 | 72.31 | 18.60 | 78.67 |
| 04:00 | 34.00 | 75.00 | 17.80 | 79.33 |
| 05:00 | 34.88 | 69.63 | 17.00 | 80.00 |
| 06:00 | 35.75 | 64.25 | 18.33 | 78.89 |
| 07:00 | 36.63 | 58.88 | 19.67 | 77.78 |
| 08:00 | 37.50 | 53.5 | 21.00 | 76.67 |
| 09:00 | 38.38 | 48.13 | 22.33 | 75.56 |
| 10:00 | 39.25 | 42.75 | 23.67 | 74.44 |
| 11:00 | 40.13 | 37.38 | 25.00 | 73.33 |
| 12:00 | 41.00 | 32.00 | 26.33 | 72.22 |
| 13:00 | 40.56 | 34.69 | 27.67 | 71.11 |
| 14:00 | 40.13 | 37.38 | 29.00 | 70.00 |
| 15:00 | 39.69 | 40.06 | 28.20 | 70.67 |
| 16:00 | 39.25 | 42.75 | 27.40 | 71.33 |
| 17:00 | 38.81 | 45.44 | 26.60 | 72.00 |
| 18:00 | 38.38 | 48.13 | 25.80 | 72.67 |
| 19:00 | 37.94 | 50.81 | 25.00 | 73.33 |
| 20:00 | 37.50 | 53.50 | 24.20 | 74.00 |
| 21:00 | 37.06 | 56.19 | 23.40 | 74.67 |
| 22:00 | 36.63 | 58.88 | 22.60 | 75.33 |
| 23:00 | 36.19 | 61.56 | 21.80 | 76.00 |
Characteristics of the Buildings:
•
Height of building: The educational establishment is considered to have two levels, with each level being 4 m tall.
•
Construction materials: Default construction materials are determined as hollow block concrete slabs and walls for all simulation models.
•
Openings in the building: Window openings are consistently configured to make up 20% of the outer walls. This standard is informed by Al-Sallal (2010), who determined that the optimal window-to-wall ratio for classrooms should be at a minimum of 20%.
Simulation Conditions in the IESve Software
Once the models were transferred to IESve, enhancements were made by incorporating additional specifics related to the construction materials used for the walls, roofs, grounds, and openings. These details were standardized across all case studies, as outlined in Tables 4 and 5. Consequently, the thickness and u values of the construction materials for all school scenarios were also made uniform. As a result, the construction materials and their associated properties were treated as constant factors.
| Material | Thickness mm | Conductivity W/(m·k) | Density Kg/m3 | Specific Heat Capacity J/(kg·K) | Resistance m2K/W | Vapour resistivity GN·s/(kg·m) | Category |
|---|---|---|---|---|---|---|---|
| Walls-Cement plaster and aggregate | 5.0 | 0.7200 | 1,860.0 | 800.0 | 0.0069 | 140.000 | Plaster |
| Walls-Expended polystyrene | 50.0 | 0.0350 | 25.0 | 1,400.0 | 1.4286 | 200.000 | Insulating materials |
| Walls-Vermiculite insulating brick | 200.0 | 0.2700 | 700.0 | 837.0 | 0.7407 | 38.000 | Brick and blockwork |
| Walls-Vernikmite plastering | 5.0 | 0.2000 | 720.0 | 837.0 | 0.0250 | 10.000 | Plaster |
| Grounds-Insulation | 98.2 | 0.0250 | 700.0 | 1,000.0 | 3.9280 | — | Insulating materials |
| Grounds-Reinforced concrete | 100.0 | 2.3000 | 2,300.0 | 1,000.0 | 0.0435 | — | Concretes |
| Grounds-Concrete tiles | 20.0 | 1.1000 | 2,100.0 | 837.0 | 0.0182 | 500.000 | Tiles |
| Roofs-Insulation | 5.0 | 0.0300 | 40.0 | 1,450.0 | 0.1667 | — | Insulating materials |
| Roofs-Membrane | 0.1 | 1.0000 | 1,100.0 | 1,000.0 | 0.0001 | — | Asphalts and other roofing |
| Roofs-Concrete deck | 100.0 | 2.0000 | 2,400.0 | 1,000.0 | 0.0500 | — | Concrete |
| Roofs-Plasterboard | 12.5 | 0.2100 | 700.0 | 1,000.0 | 0.0595 | 0.000 | Plaster |
| Material | Thickness mm | Conductivity W/(m·k) | Density Kg/m3 | Transmittance | Resistance m2K/W | Outside reflectance same as inside reflectance | Refractive Index |
|---|---|---|---|---|---|---|---|
| Clear float 6 mm | 6.0 | 1.0600 | Fresnel | 0.780 | 0.0057 | 0.070 | 1.526 |
Justification for Using Courtyards as Passive Design Solution for School Building
The BcChart v2.1, set within a user-friendly Microsoft Excel environment, offers a step-by-step process through four spreadsheets, guiding from data input to result interpretation. It accounts for climatological data and provides both a basic and a modified bioclimatic chart, illustrating the influence of solar radiation. The analysis then leads to a comprehensive understanding of the bioclimatic potential, offering a solid foundation for justifying courtyard integration as a means to enhance environmental sustainability and building performance in specific locales (Košir and Pajek 2017).
After investigating the climate conditions of the UAE by BcChart v2.1 and forcing the climatic data based on Košir, and Pajek (2017), Ahmed and Shaikh (2013), and Eveloy and Alkendi (2021), the results of the bioclimatic chart showcases that the hot arid climate of UAE requires a substantial focus on passive cooling strategies. The data indicate an 18.3% potential for passive solutions suitable for hot arid climates, which underscores the importance of integrating design features such as shading and orientation to mitigate heat. In addition, with 15.4% of mechanical cooling and/or dehumidification needed and 18.1% of comfort achievable through shading, it is evident that optimizing shade and ventilation could substantially enhance thermal comfort. The zero percent indication for conventional heating highlights the non-necessity for heating solutions, further emphasizing the need for passive design strategies to cool buildings in such climates (Fig. 4).
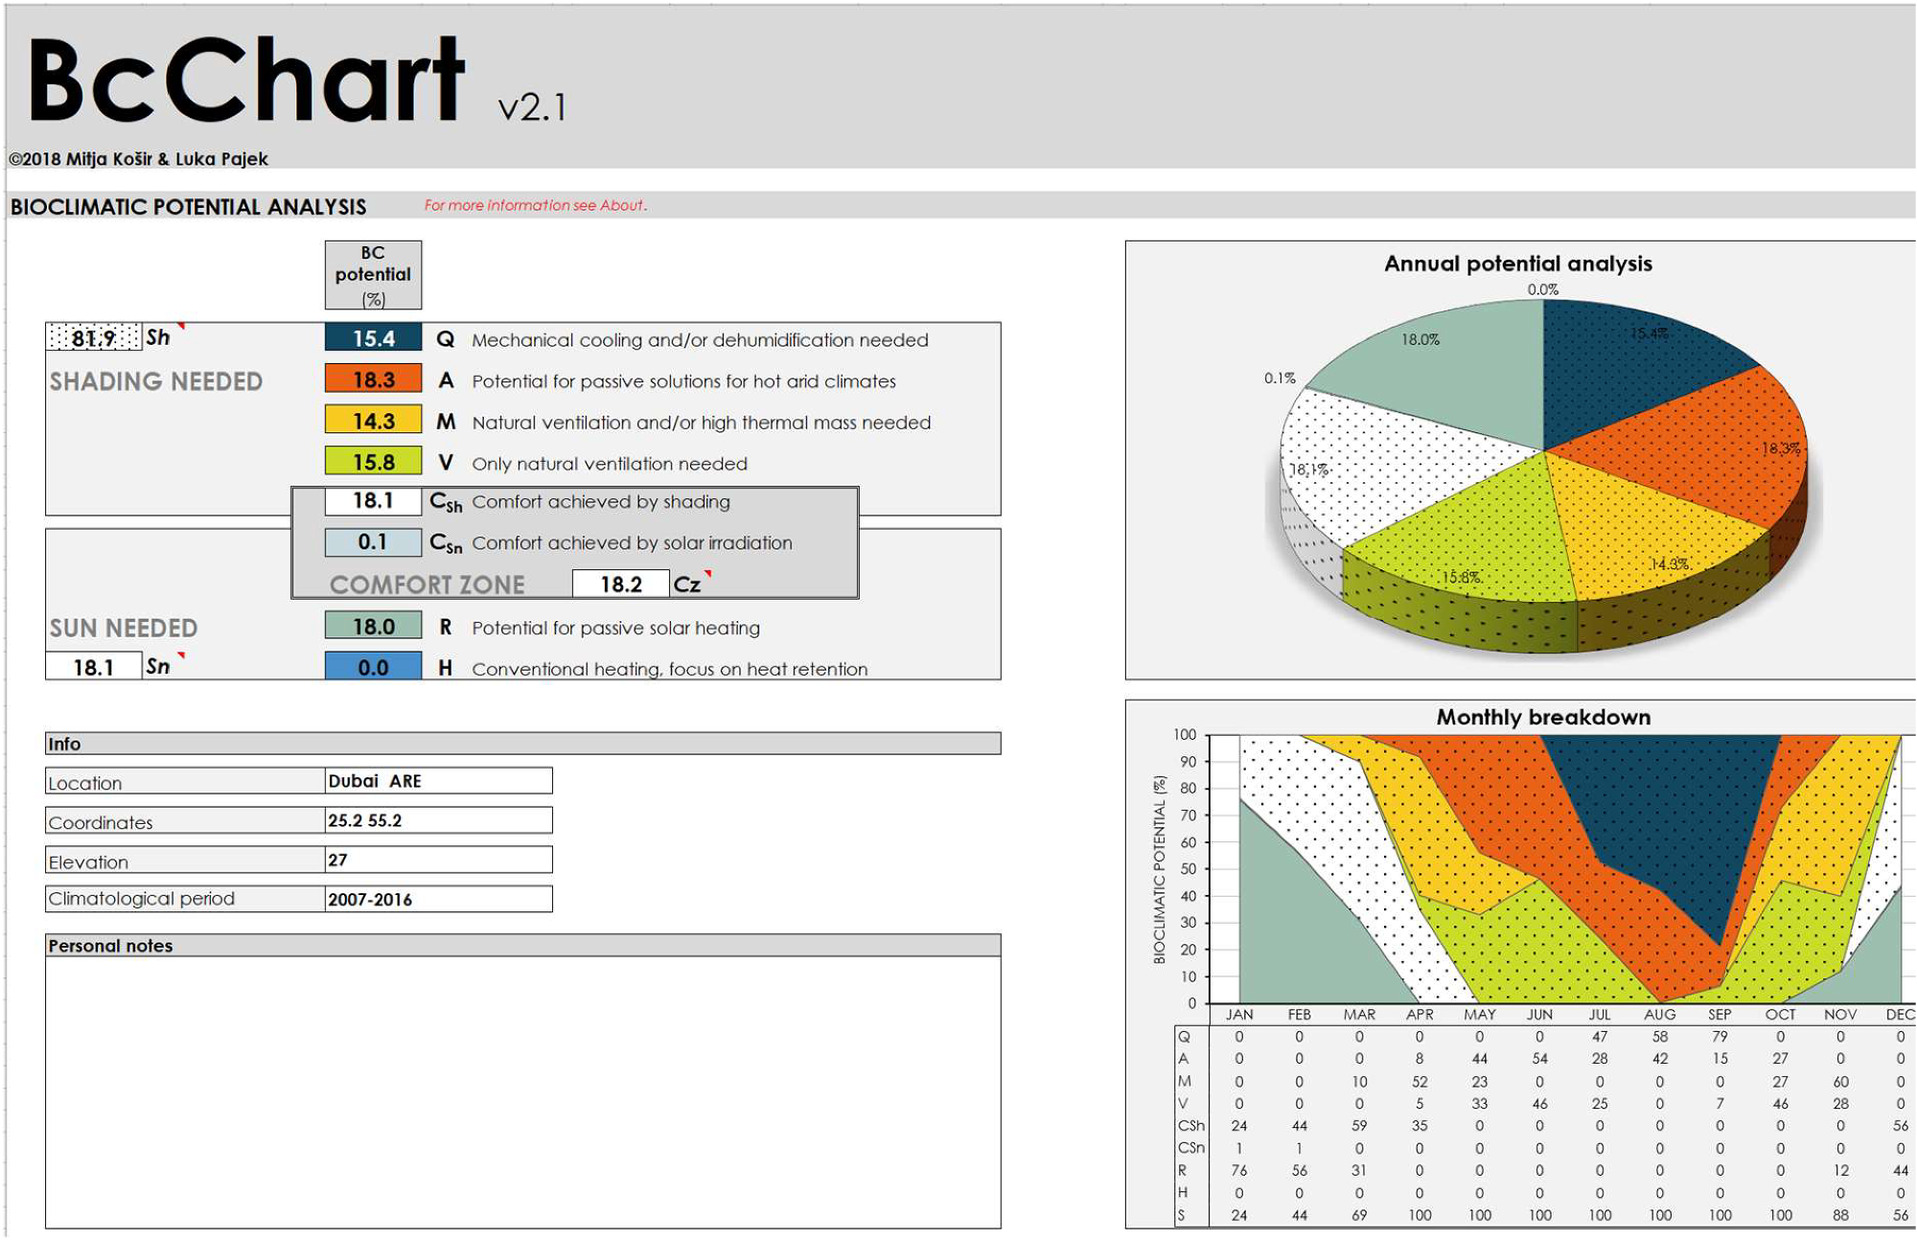
Given the substantial percentage for the need of shading (18.3%) and the effectiveness of shading in providing comfort (18.1%), courtyards emerge as a highly relevant passive design strategy. Courtyards can offer substantial shading, promote natural ventilation, and enhance thermal comfort in school buildings, making them an essential component in the design of energy-efficient, sustainable educational facilities in such climates.
Results and Discussion
In this study, the utilization of courtyards as passive design solutions for school buildings in hot climates, such as the UAE, was a key focus. The case study chosen for this investigation was the UPA-fin school. The research process involved a two-step simulation approach. Initially, the case study was simulated using ENVI-met software to assess the thermal performance under various courtyard design strategies. Subsequently, IESve software was employed to calculate the energy consumption reduction resulting from the enhanced thermal performance of the courtyards.
Section One by ENVI-Met Software: Courtyard Design Configurations
A courtyard is acknowledged as a climatic modifier, and its effectiveness in enhancing the thermal performance of the entire building is contingent on a range of parameters and factors. These factors encompass the courtyard’s shape, its relative size concerning the built-up area, the ratio of courtyard height to width, the sky view factor, and the height of the surrounding building masses, among others. The examination of these parameters is detailed in the following subsections. It is worth noting that the metric used to quantify improvements in a school building’s thermal performance is the school building’s temperature, denoted as Tb. This temperature is derived using ENVI-met software, as previously explained, which considers the dynamics of the buildings.
Phase 1: Courtyard Shape Factor—W/L
This phase aimed to assess the suitability of the number of courtyards and the shape factor, specifically the W/L ratio, for the UPA-fin school. Before implementing further courtyard design improvements, an initial investigation was conducted. The optimal case, UPA-fin, featured a CA/BA ratio of 40% and was equipped with two courtyards, each having a shape factor of 1:2.6. Additional scenarios were explored, varying the shape factor to 1:2, 1:3 with two courtyards, and 1:3 with three courtyards, as depicted in Fig. 5(a). It is worth noting that the impact of the courtyard shape factor is intertwined with other parameters, including the solar shadow index (SSI) and the thickness of the building masses surrounding the courtyard.
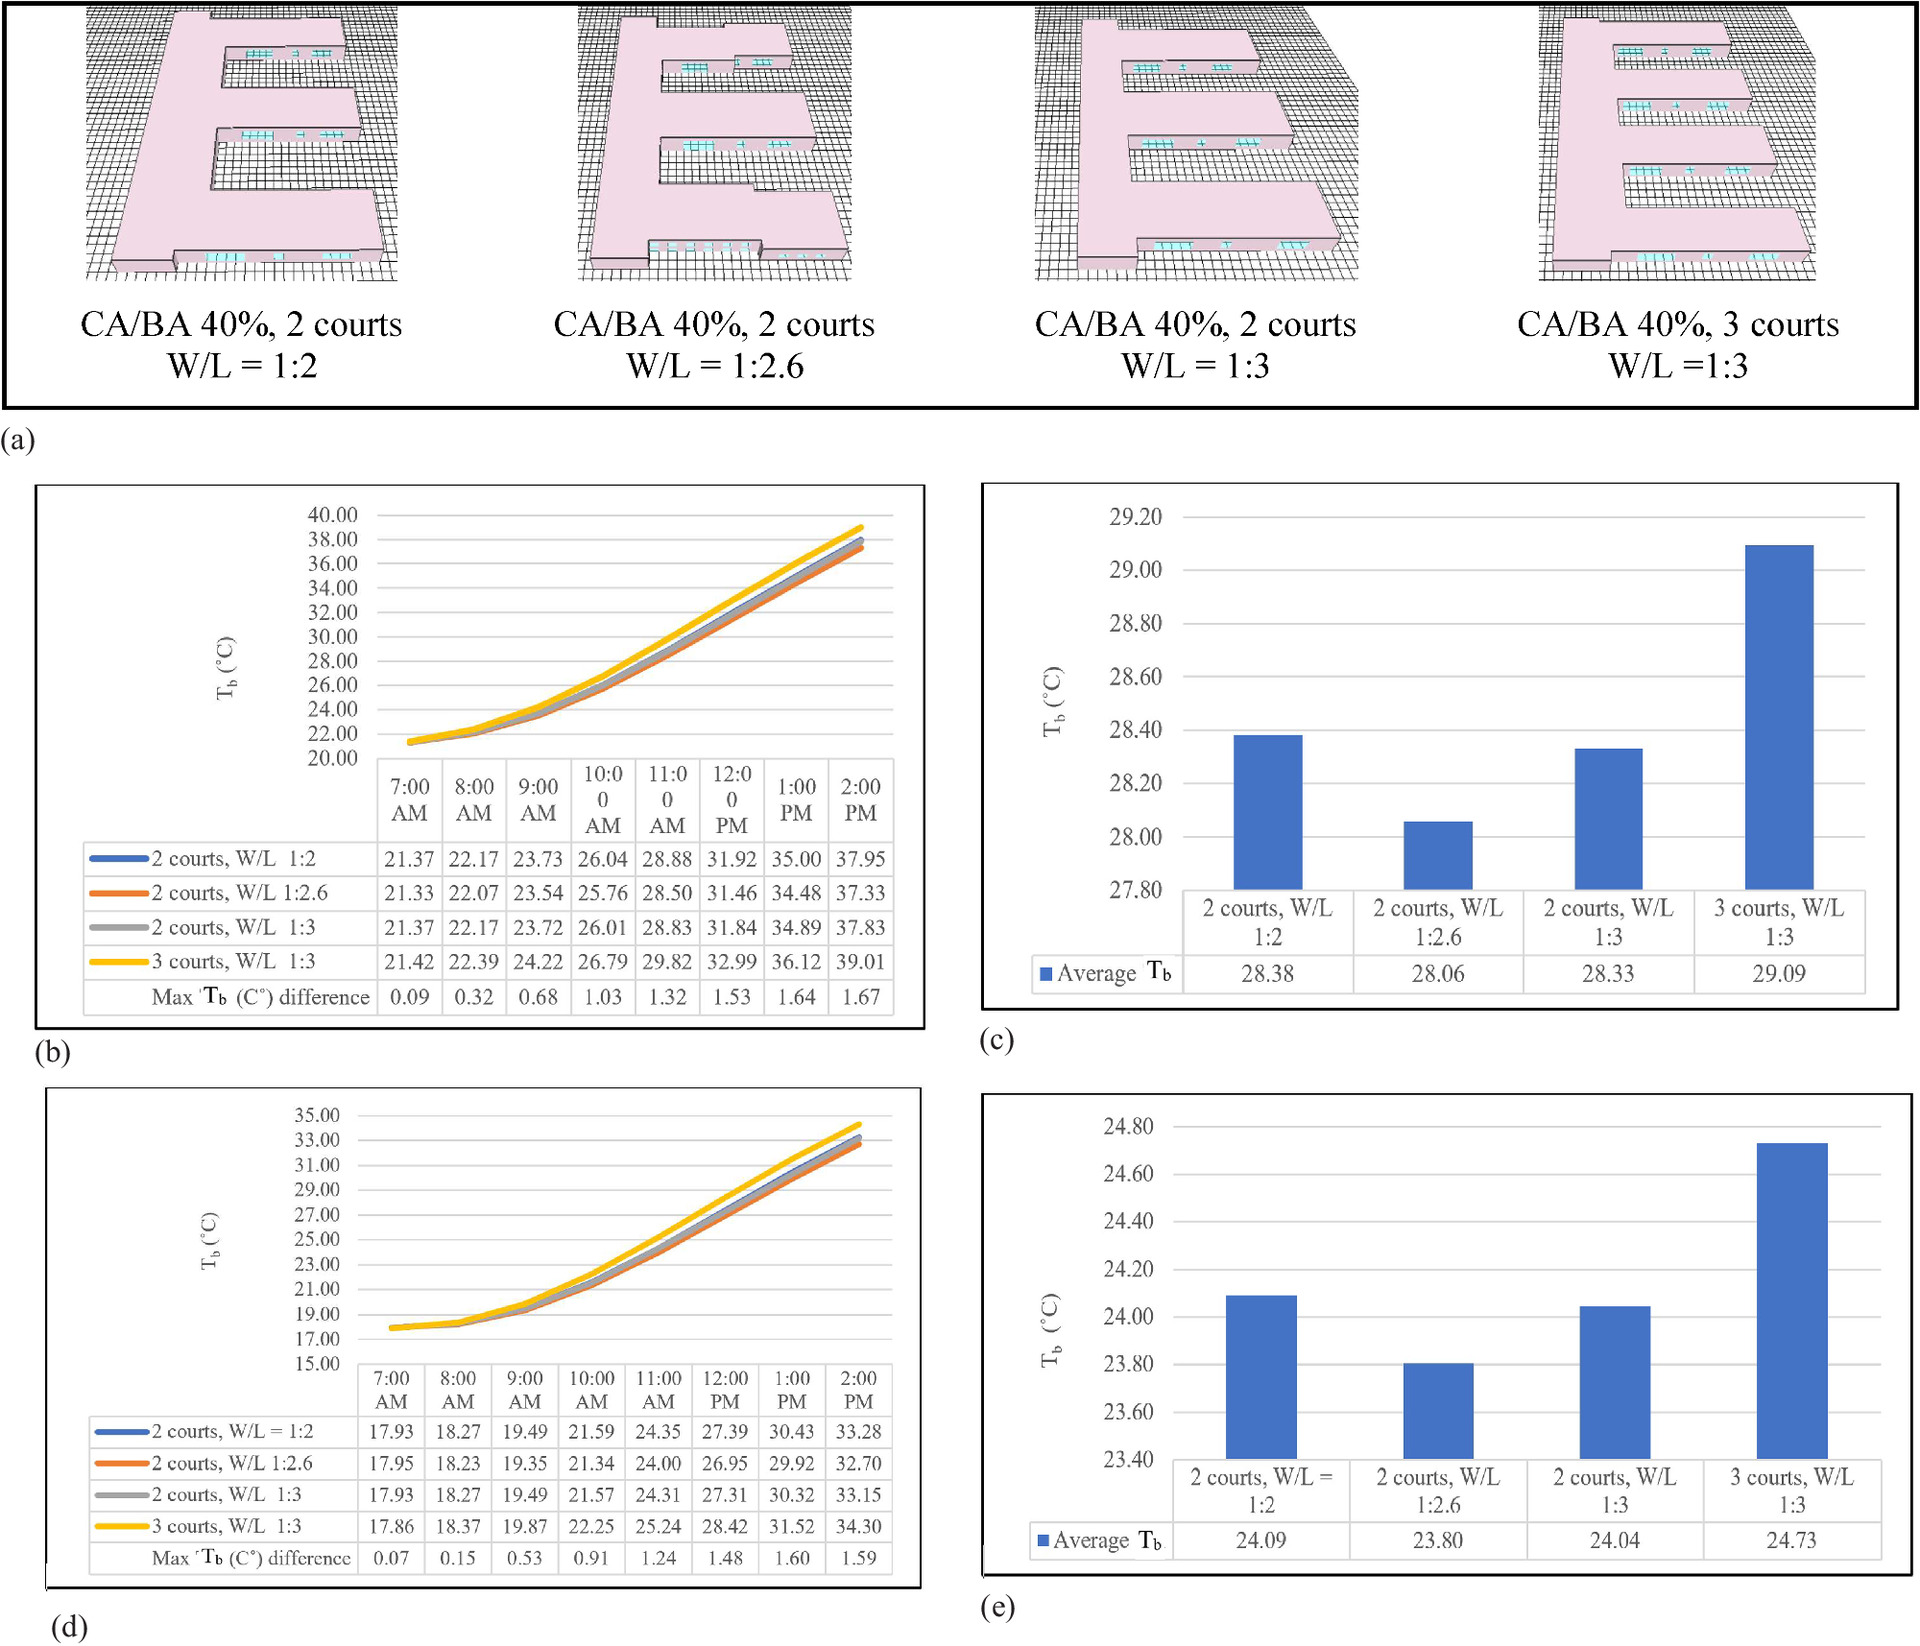
The analysis of the shape factor revealed that the UPA-fin school with a shape factor ratio (W/L) of 1:2.6 displayed the most favorable hourly and average Tb values among the various scenarios on both simulation dates, September 21 and March 21, with the lowest average Tb recorded at 28.06°C and 23.80°C, respectively [Figs. 5(b–e)]. Notably, these Tb values for UPA-fin were 1.03°C lower on September 21 and 0.93°C lower on March 21 compared with the least favorable case with a shape factor ratio of W/L 1:3 with three courtyards (Table 6). This discrepancy can be attributed to the variation in the amount of solar radiation received by the external walls. The poorest case with a shape factor ratio of W/L 1:3 and three courtyards exposed more external walls to the exterior climate, with thinner building masses, unlike the optimal case with a W/L ratio of 1:2.6, which had 30% fewer exposed walls with thicker masses. It becomes evident that increasing the surface area of the building’s exterior leads to higher interior temperatures, highlighting the superior performance of thicker building masses around the courtyard as compared with thinner counterparts.
| School | Shape factor | Number of courts | Shadow index SSI = south wall height/N–S floor width | Surrounding mass thickness | Average Tb (°C) September 21 (Difference in average Tb in relation to the Ref. value) | Average Tb (°C) March 21 (Difference in average Tb in relation to the Ref. value) | |
|---|---|---|---|---|---|---|---|
| West mass | Fingers (average) | ||||||
| CA/BA 40%, 2 courts | 1:2 | 2 | 8/27 = 0.29 | 27 m | 21 m | 28.38 (+0.32) | 24.09 (+0.29) |
| CA/BA 40%, 2 courts | 1:2.6 Best case | 2 | 8/22.5 = 0.36 | 21 m | 23 m | 28.06 (Ref.) | 23.80 (Ref.) |
| CA/BA 40%, 2 courts | 1:3 | 2 | 8/21 = 0.38 | 18 m | 23 m | 28.33 (+0.27) | 24.04 (+0.24) |
| CA/BA 40%, 3 courts | 1:3 | 3 | 8/18 = 0.44 | 24 | 17.3 m | 29.09 (+1.03) | 24.73 (+0.93) |
Furthermore, the UPA-fin school, featuring a shape factor ratio (W/L) of 1:2.6, outperforms its counterpart with a shape factor ratio of 1:2, exhibiting a temperature advantage of 0.34°C on September 21 and 0.29°C on March 21. This difference can be attributed to UPA-fin with a shape factor ratio of 1:2.6 boasting a superior SSI of approximately 0.36, while the 1:2 configuration registers an SSI of about 0.29, resulting in reduced shading within the courtyard, as indicated in Table 6. The expansion of the shaded areas within the courtyard reduces the cooling energy required during hot days. Notably, the courtyard’s passive design solution results in the shading effect produced by the surrounding walls on the courtyard floor. Despite UPA-fin with a shape factor ratio of W/L 1:3 featuring two courtyards and an SSI of around 0.38, UPA-fin with a shape factor ratio of W/L 1:2.6 and an SSI of 0.34 still outperforms it. This is because the former has a thicker mass on the west side, extending approximately 21 m, in contrast to the 1:3 configuration. This highlights the dominant influence of thicker building masses over the SSI factor.
A comprehensive investigation was carried out involving three courtyards to determine the optimal number of courtyards for the school building, prior to further enhancements. The results unequivocally demonstrate that the UPA-fin school benefits from two courtyards over three courtyards. The three-courtyard configuration records an average Tb of approximately 29.09 on September 21 and 24.73°C on March 21, exceeding the best-case scenario with a W/L ratio of 1:2.6 by 1.03°C and 0.93°C, respectively. This suboptimal performance can be attributed to the increased exposure of surfaces to the hot climate compared with the two-courtyard configuration. A higher ratio of exposed surfaces relative to the volume of air-conditioned spaces leads to elevated indoor temperatures.
Phase 2: Courtyard Area to Built-Up Area Ratio
The optimal configuration from Phase 1 was carried forward to Phase 2 for further examination. In Phase 2, the UPA-fin school was subjected to scrutiny, considering various CA/BA ratios, which included 20%, 33%, and 60%, in addition to the original 40% from the previous phase [as shown in Fig. 6(a)]. The CA/BA ratios of the courtyards have a significant impact on the thickness of the surrounding building masses, the courtyard areas, and the sky view factor (SSI) inside the courtyards.
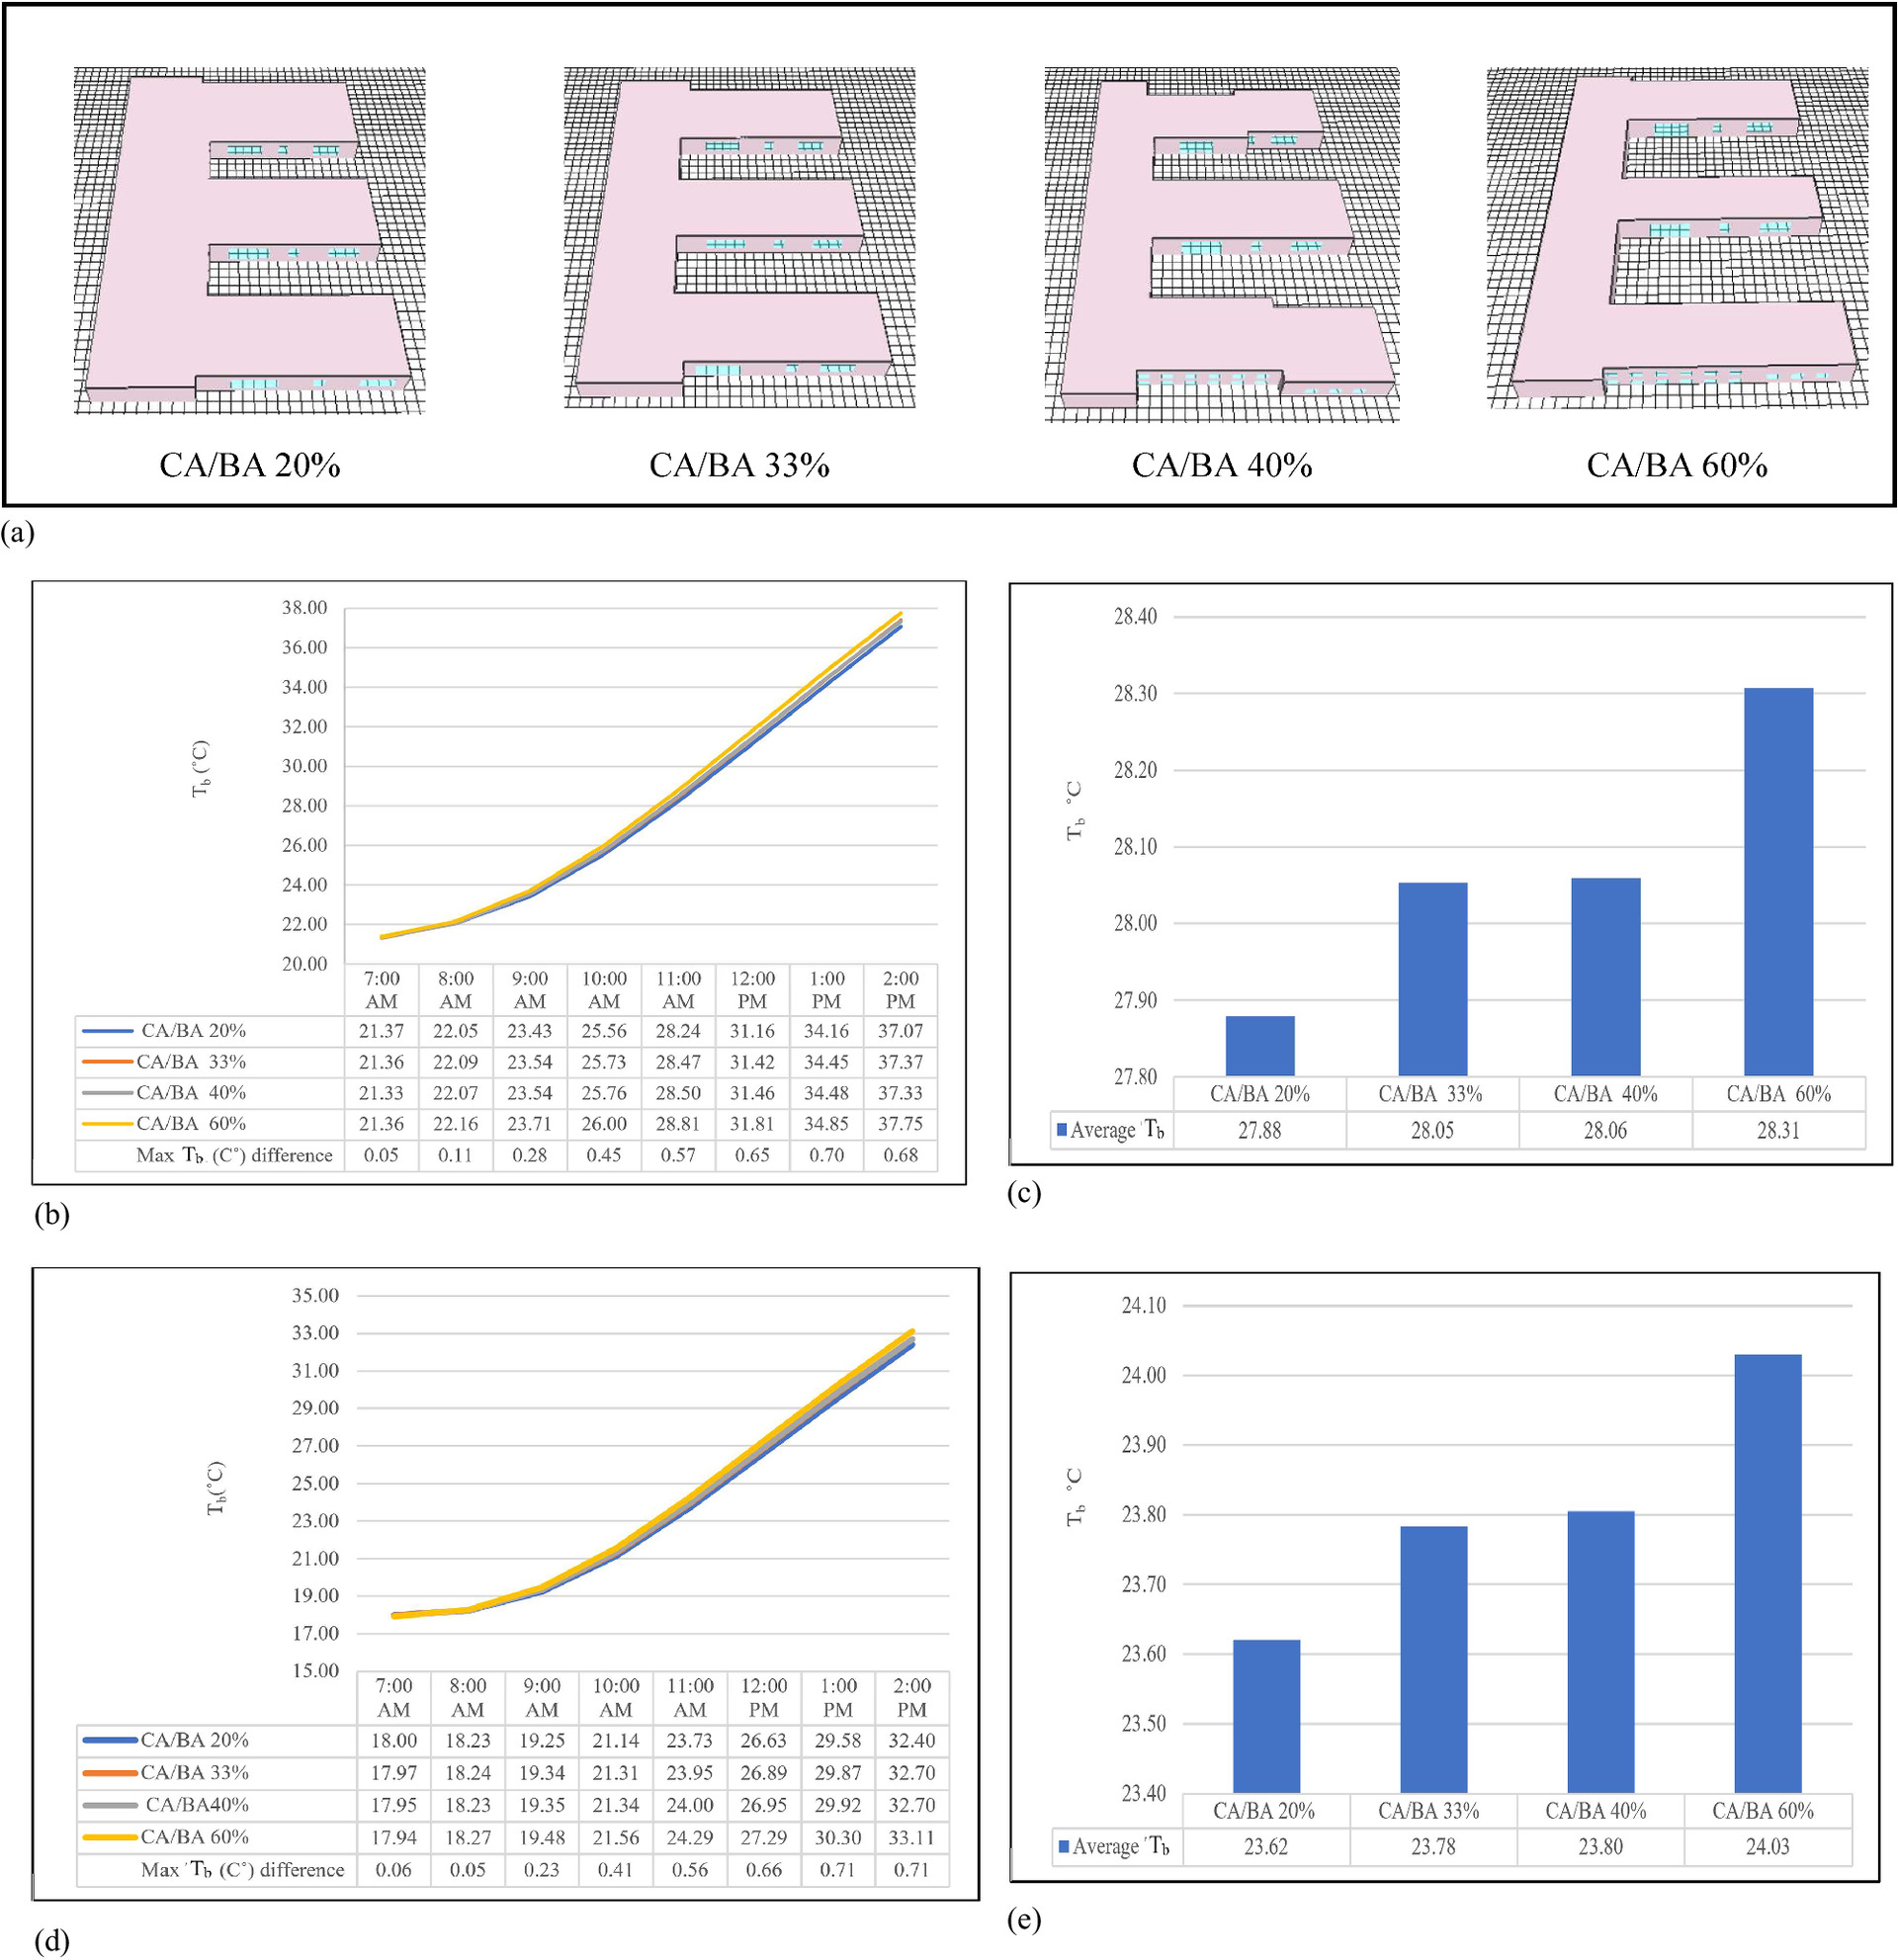
The investigation revealed that the UPA-fin school with a CA/BA ratio of 20% exhibited the most favorable hourly and average Tb readings in both simulation dates, September 21 and March 21, with the lowest average Tb values of 27.88°C and 23.62°C, respectively [as depicted in Figs. 6(b–e)]. These Tb values for UPA-fin are lower by 0.43°C on September 21 and 0.41°C on March 21 compared with the least favorable case with a CA/BA ratio of 60% (as outlined in Table 7). This discrepancy can be elucidated by examining the relationship between the CA/BA ratio and the courtyard areas, given a fixed number of courtyards and their surrounding heights. As the CA/BA ratio increases, so does the courtyard area. For instance, the case with the highest CA/BA ratio of 60% boasts the largest courtyard areas, which allows for greater solar radiation exposure to the ground and courtyard walls. Furthermore, it features more exterior walls exposed to the scorching outdoor climate, with thinner building masses. In contrast, the best-case scenario with a CA/BA ratio of 20% presents fewer exposed walls with thicker building masses, resulting in lower indoor temperatures and reduced cooling energy requirements.
| School with different CA/BA ratio | Shadow index SSI = south wall height/N–S floor width | Surrounding mass thickness | Average Tb (°C) September 21 (Difference in average Tb in relation to the Ref. value) | Average Tb (°C) March 21 (Difference in average Tb in relation to the Ref. value) | |
|---|---|---|---|---|---|
| East mass | Fingers (average) | ||||
| CA/BA 20% Best case | 8/18 = 0.44 | 30 m | 28 m | 27.88 (Ref.) | 23.62 (Ref.) |
| CA/BA 33% | 8/21 = 0.38 | 24 m | 24 m | 28.05 (+0.17) | 23.78 (+0.16) |
| CA/BA 40% | 8/22.5 = 0.36 | 21 m | 23 m | 28.06 (+0.18) | 23.80 (+0.18) |
| CA/BA 60% | 8/30 = 0.27 | 21 m | 20 m | 28.31 (+0.43) | 24.03 (+0.41) |
Furthermore, UPA-fin, with a CA/BA ratio of 20%, exhibits superior performance compared with the one with a CA/BA ratio of 60% due to its higher SSI of around 0.44, whereas the case with a CA/BA ratio of 60% has an SSI of approximately 0.27, leading to reduced shading within the courtyard, as illustrated in Table 7. Wider courtyards tend to accumulate more heat gain as they offer fewer shaded areas in contrast to their narrower counterparts. Furthermore, increasing the shaded area within the courtyard results in improved indoor temperatures for buildings in hot regions, subsequently reducing the demand for cooling energy. Thus, it is essential for courtyards in energy-efficient buildings to have appropriate proportions and orientations to control the shaded area and heat gain, recognizing the vital role of internal shaded courtyards in fostering thermal comfort. The shade generated by the surrounding courtyard walls significantly influences its microclimate. This shading is subject to variations depending on the orientation, the upper width of the courtyard, and the courtyard’s width-to-height ratio. This aligns with the simulation findings of school models in this phase; for example, the school model with a larger CA/BA ratio of 60% had a broader courtyard, resulting in less shaded area, while the school model with the lowest CA/BA ratio of 20% had a narrower courtyard with more shaded area within it.
In addition, courtyards with narrower dimensions tend to have lower sky view factors, such as in the case of the school model with a CA/BA ratio of 20%, in contrast to those with larger CA/BA ratios. Reducing the sky view factor can contribute to lowering the air temperature within the courtyards.
Furthermore, based on the data in Table 7, UPA-fin with a CA/BA ratio of 20% outperforms the case with a CA/BA ratio of 60% due to the thicker masses on the west side and the “fingers” with dimensions of approximately 30 and 28 m, respectively. Meanwhile, the case with a CA/BA ratio of 60% features a thickness of 21 m for the west side and an average thickness of 20 m for the finger masses.
In conclusion, UPA-fin, exhibiting the best performance with a CA/BA ratio of 20%, falls within the range specified by Soflaei et al. (2016b), who emphasized that in traditional courtyards with good thermal performance, the CA/BA ratio should ideally range between 18% and 44%. Subsequently, in a later study within the same year, they further refined this, suggesting that the courtyard area ratio should preferably fall within the range of 18% to 32%, with an even more preferable range below 30%. These recommendations are based on the courtyard area ratio concerning traditional buildings with efficient thermal performance in hot climates.
Phase 3: Courtyard Outline Shape
The most favorable scenario from Phase 2 was carried forward to Phase 3 to undergo further scrutiny. Phase 3 specifically delved into the courtyard’s layout, comparing the performance of square and rectangular configurations. The outcomes revealed that the school with a square courtyard exhibited superior hourly and average temperatures (Tb) on both September 21 and March 21, during school hours, as depicted in Fig. 7. The school featuring square courtyards maintained an average Tb of approximately 27.47°C, marking a 0.41°C reduction compared with the average Tb of the same school with rectangular courtyards on September 21. Likewise, on March 21, the simulation results showed that the UPA-fin school with a square courtyard surpassed its counterpart with a rectangular outline, boasting a Tb of approximately 23.30°C, which was 0.32°C cooler than the rectangular design.
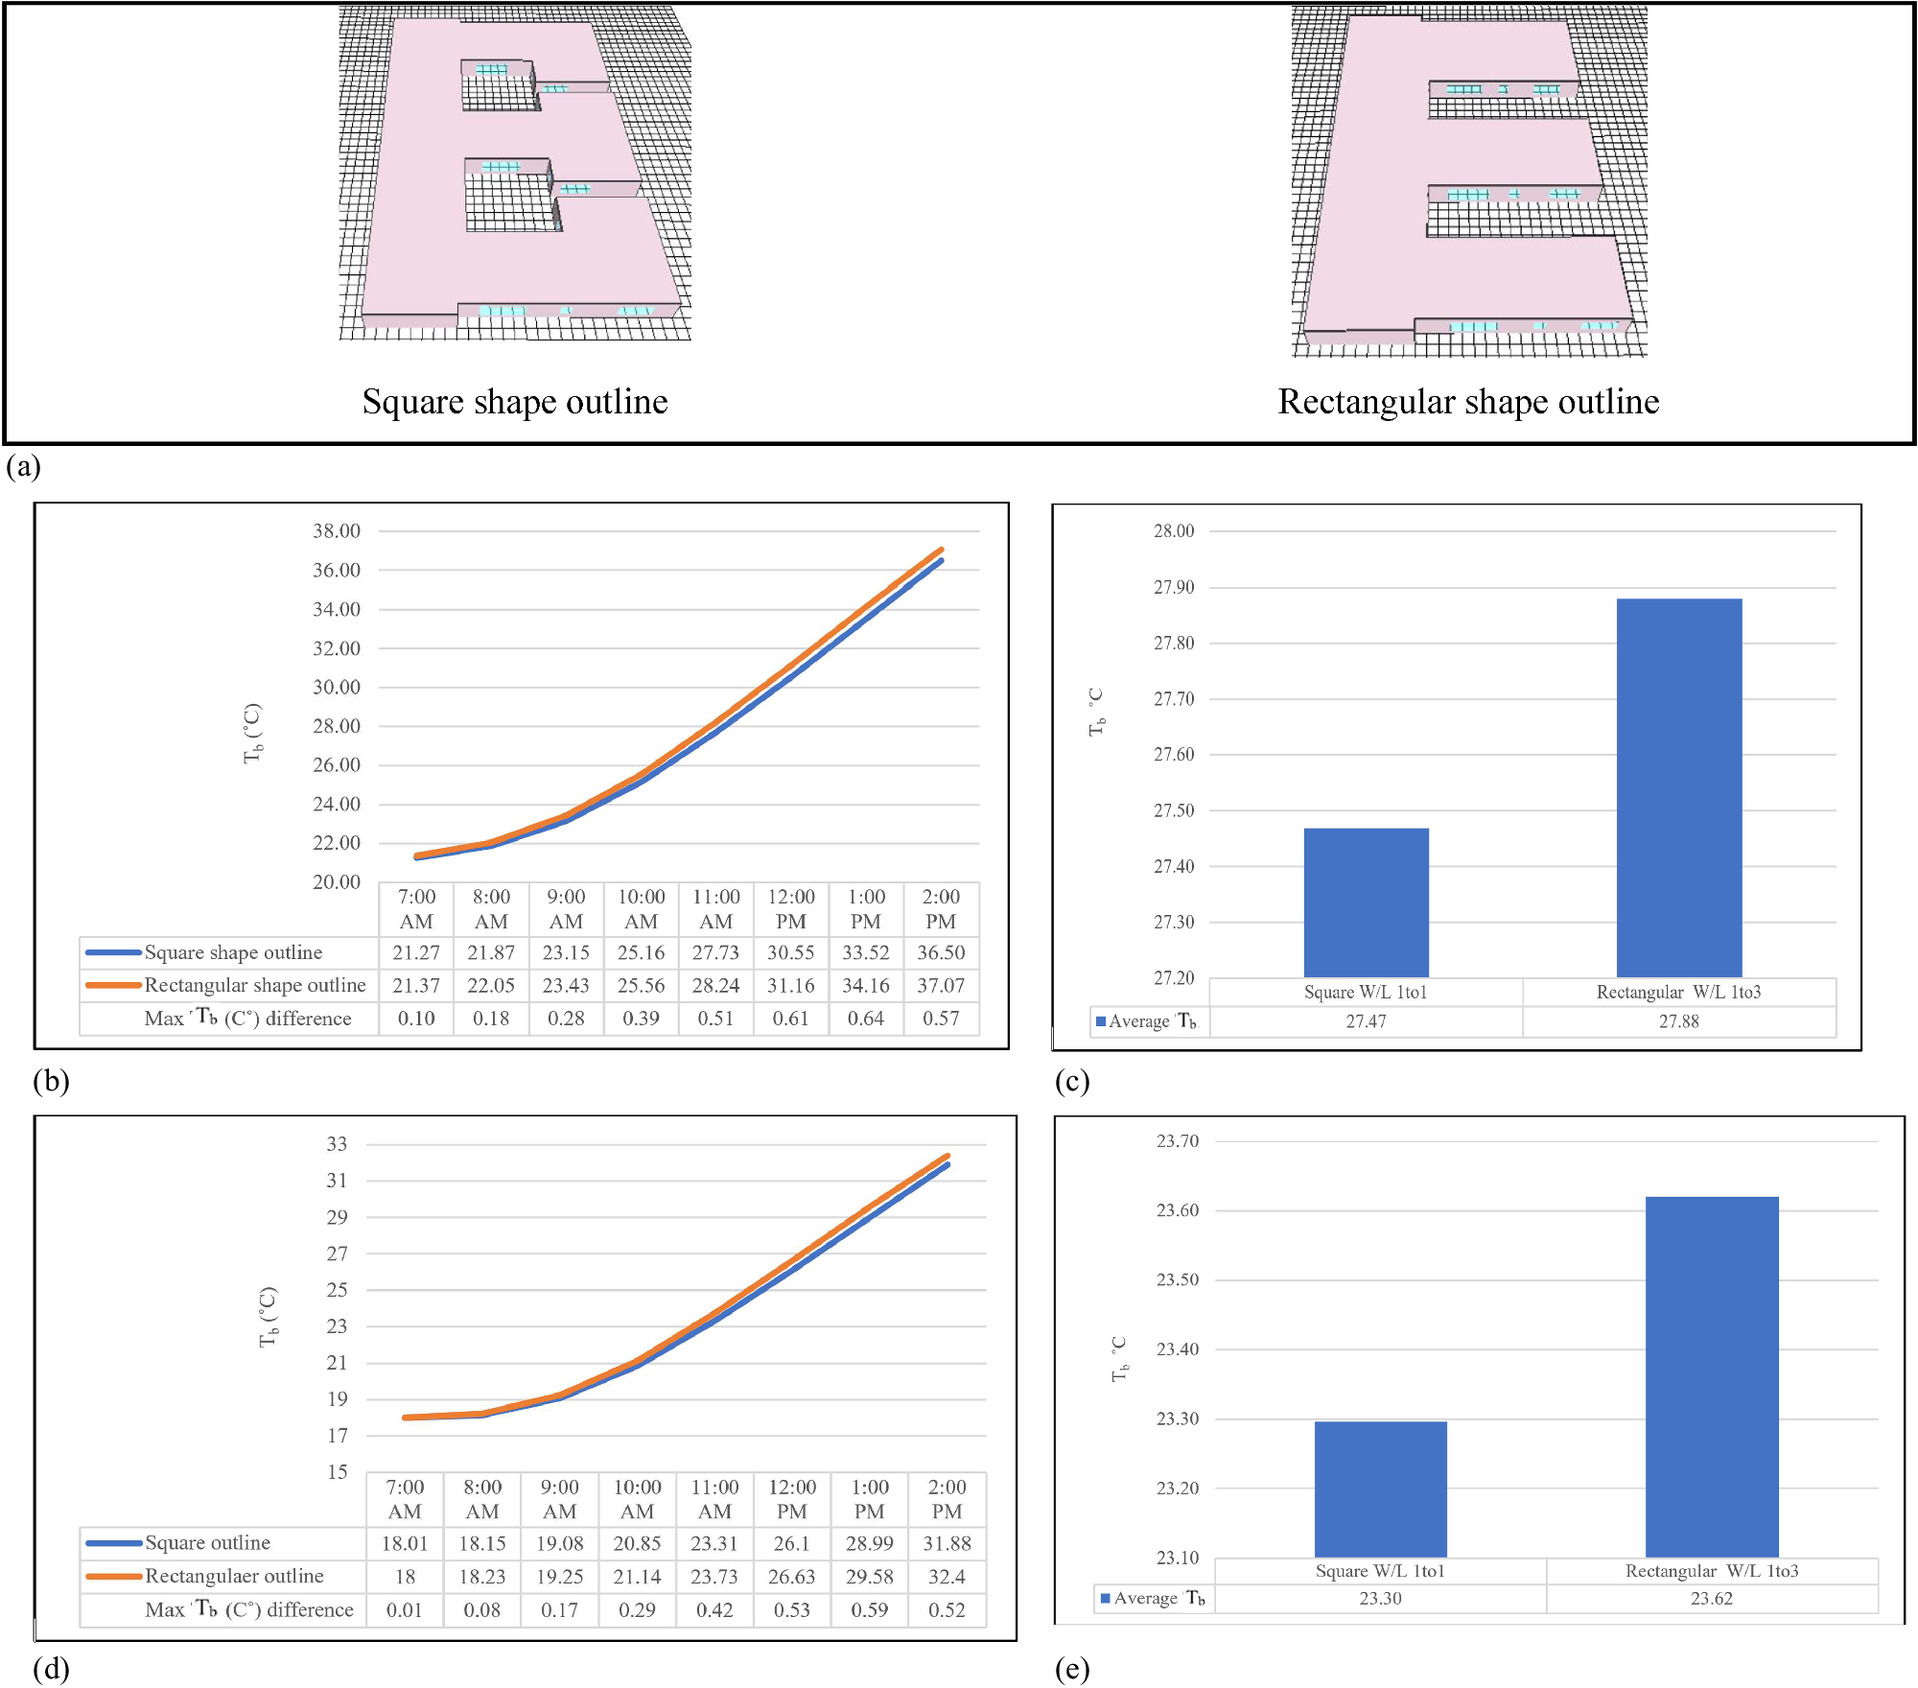
The findings in Phase 3 are consistent with the observations of Yaşa and Ok (2014), who posited that an increase in the courtyard’s length is likely to result in higher energy consumption for a building. They also noted that in hot regions, a more square-like shape of the courtyard is expected to increase the shaded area within, consequently reducing the energy required for cooling during the summer as Tb decreases. Furthermore, the geometric configuration of the courtyard plays a pivotal role in its performance. Owing to the sun’s position and radiation, a square-shaped courtyard is considered ideal in terms of energy efficiency.
Furthermore, when comparing a square courtyard to a rectangular one in the context of school UPA-fin, it becomes evident that the square design surpasses the rectangular layout. This is due to the rectangular courtyard being open from the east side, as opposed to the square courtyard, which is enclosed by walls on the east side. These walls cast shade within the square courtyard, especially during the morning hours when the school is in use. Consequently, the additional shaded area significantly contributes to enhancing the microclimate within the courtyard and the overall building. The shading effect resulting from the surrounding walls, in conjunction with the shading on the southern wall of the courtyard, represents a primary advantage of the courtyard’s role as a passive design solution.
Phase 4: Courtyard Walls Height
During this phase of the study, the UPA-fin school was subject to simulations with two new configurations featuring a height of 12 m, in addition to the original design from the previous phase, which had a two-floor height of 8 m [as illustrated in Fig. 8(a)]. The primary aim of this phase was to enhance the school building’s capacity to accommodate more students while concurrently lowering the Tb. It is well established that roof areas should generally be minimized by constructing multistory buildings instead of extending horizontally across a vast site. This approach reduces the surface-to-volume ratio, leading to fewer surfaces being exposed to the harsh weather conditions of summer. An investigation into various courtyard configurations with distinct surface-to-volume ratios confirmed that higher surface-to-volume ratios can raise the internal temperatures of buildings.
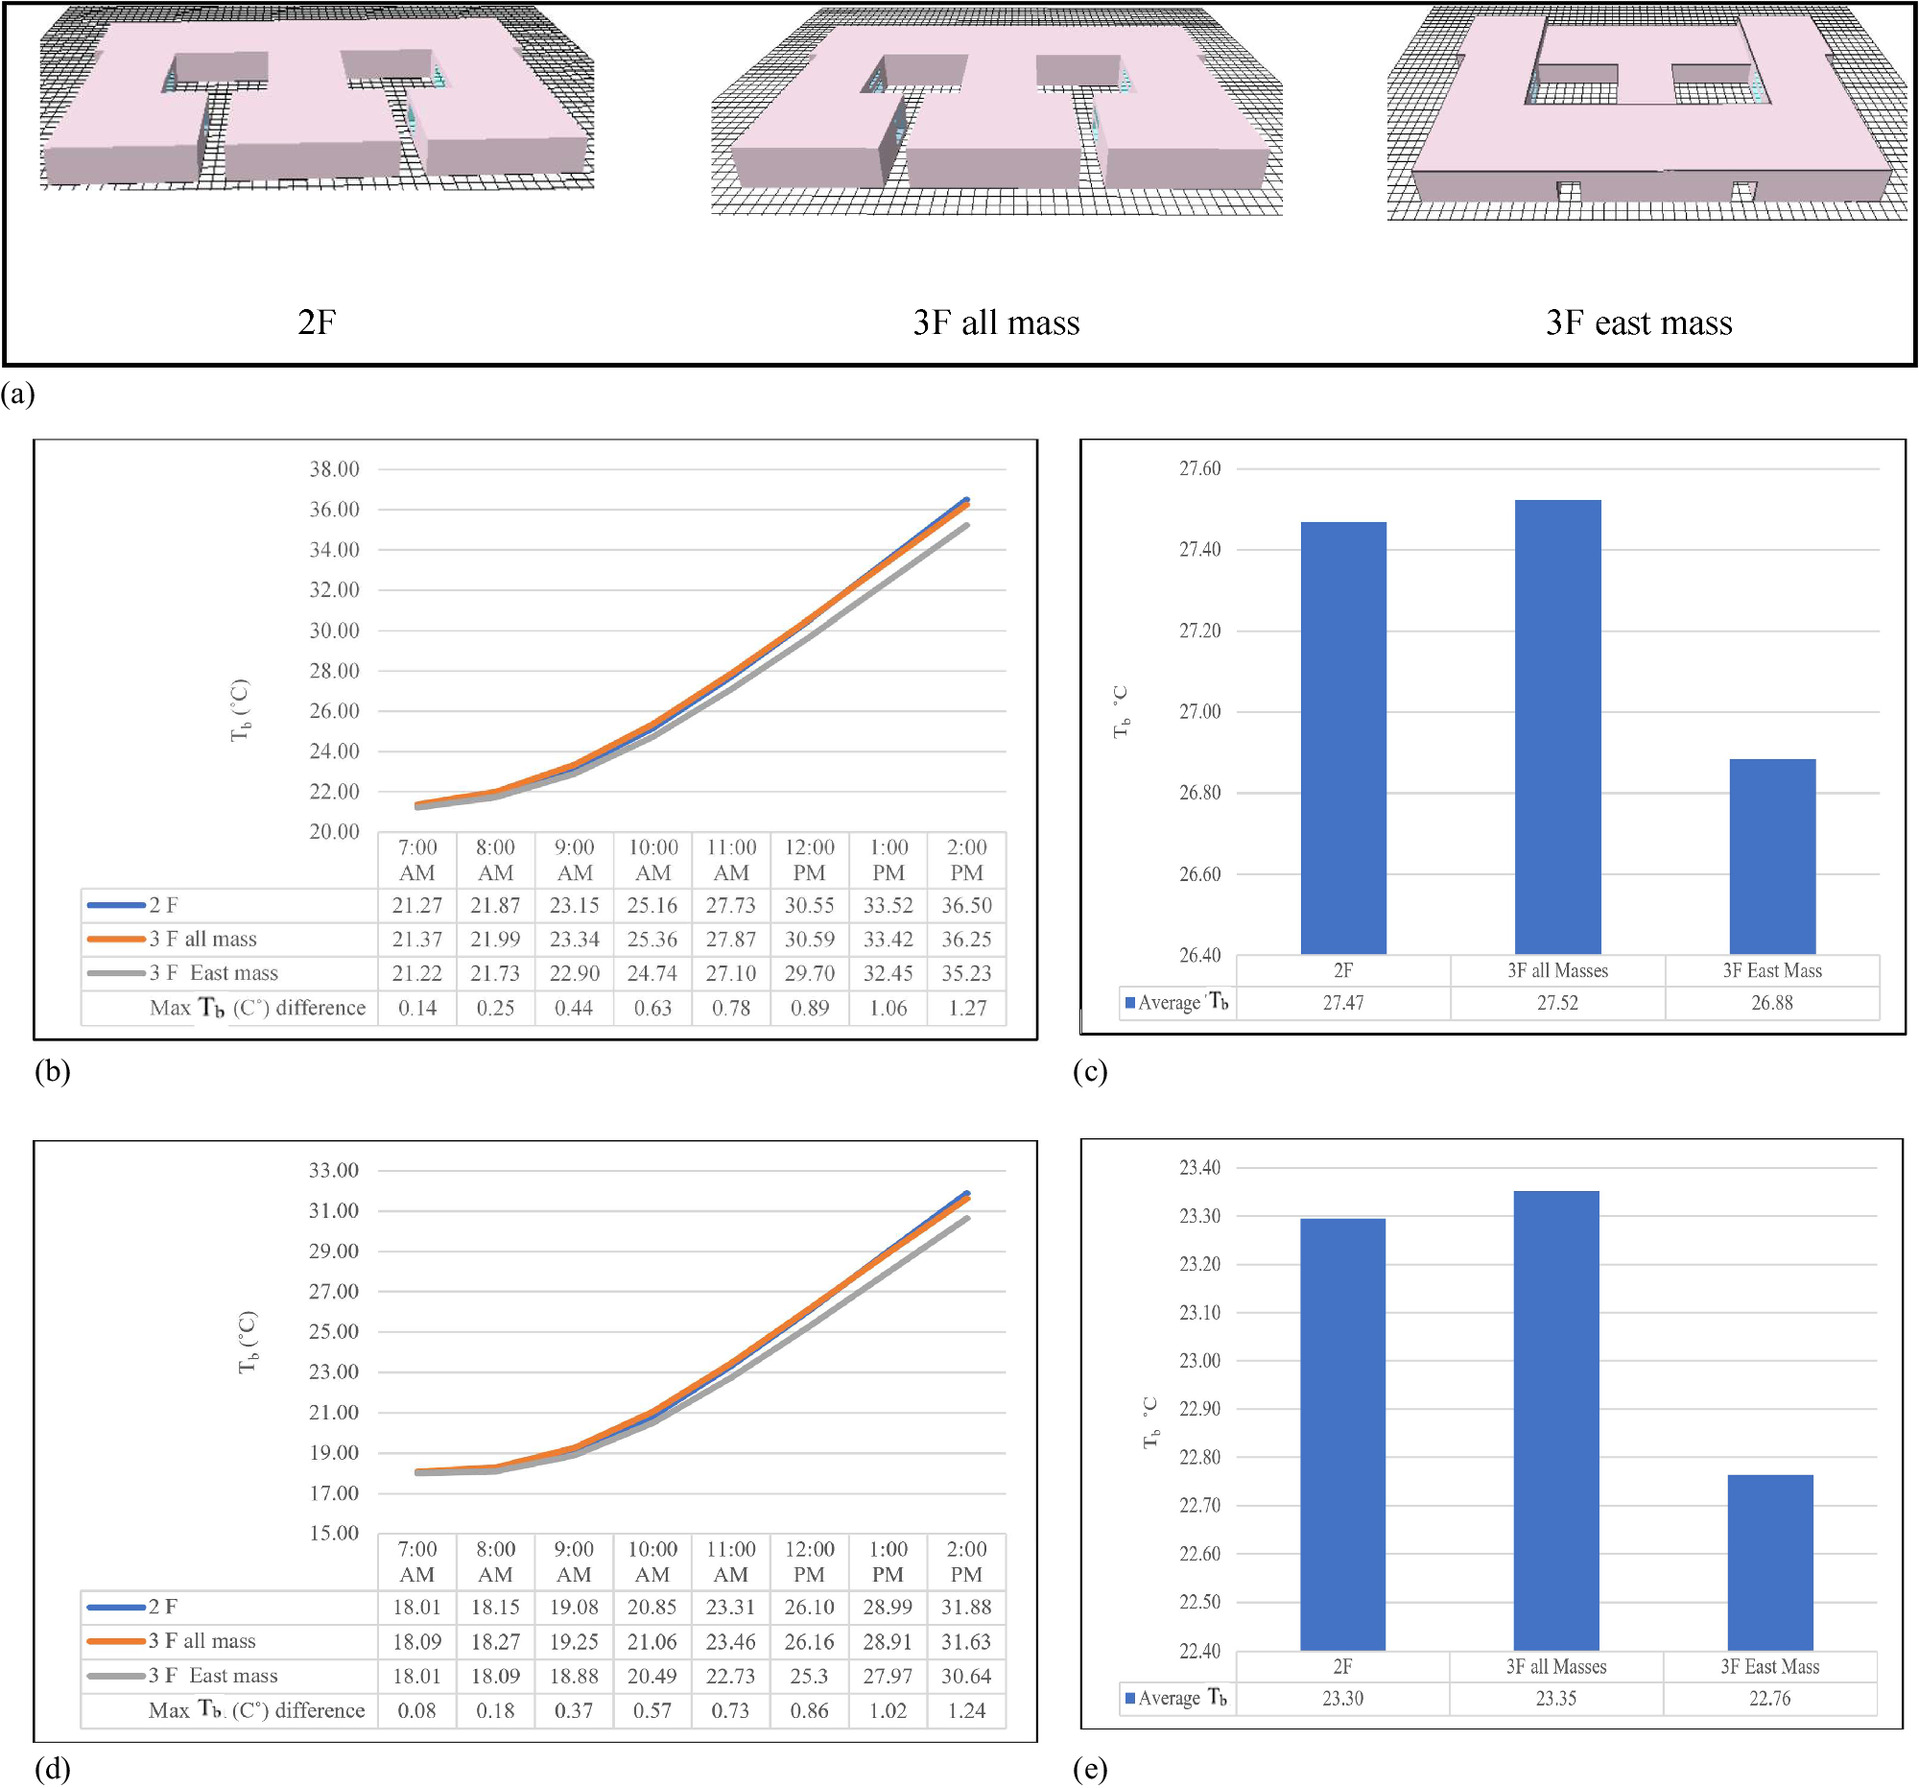
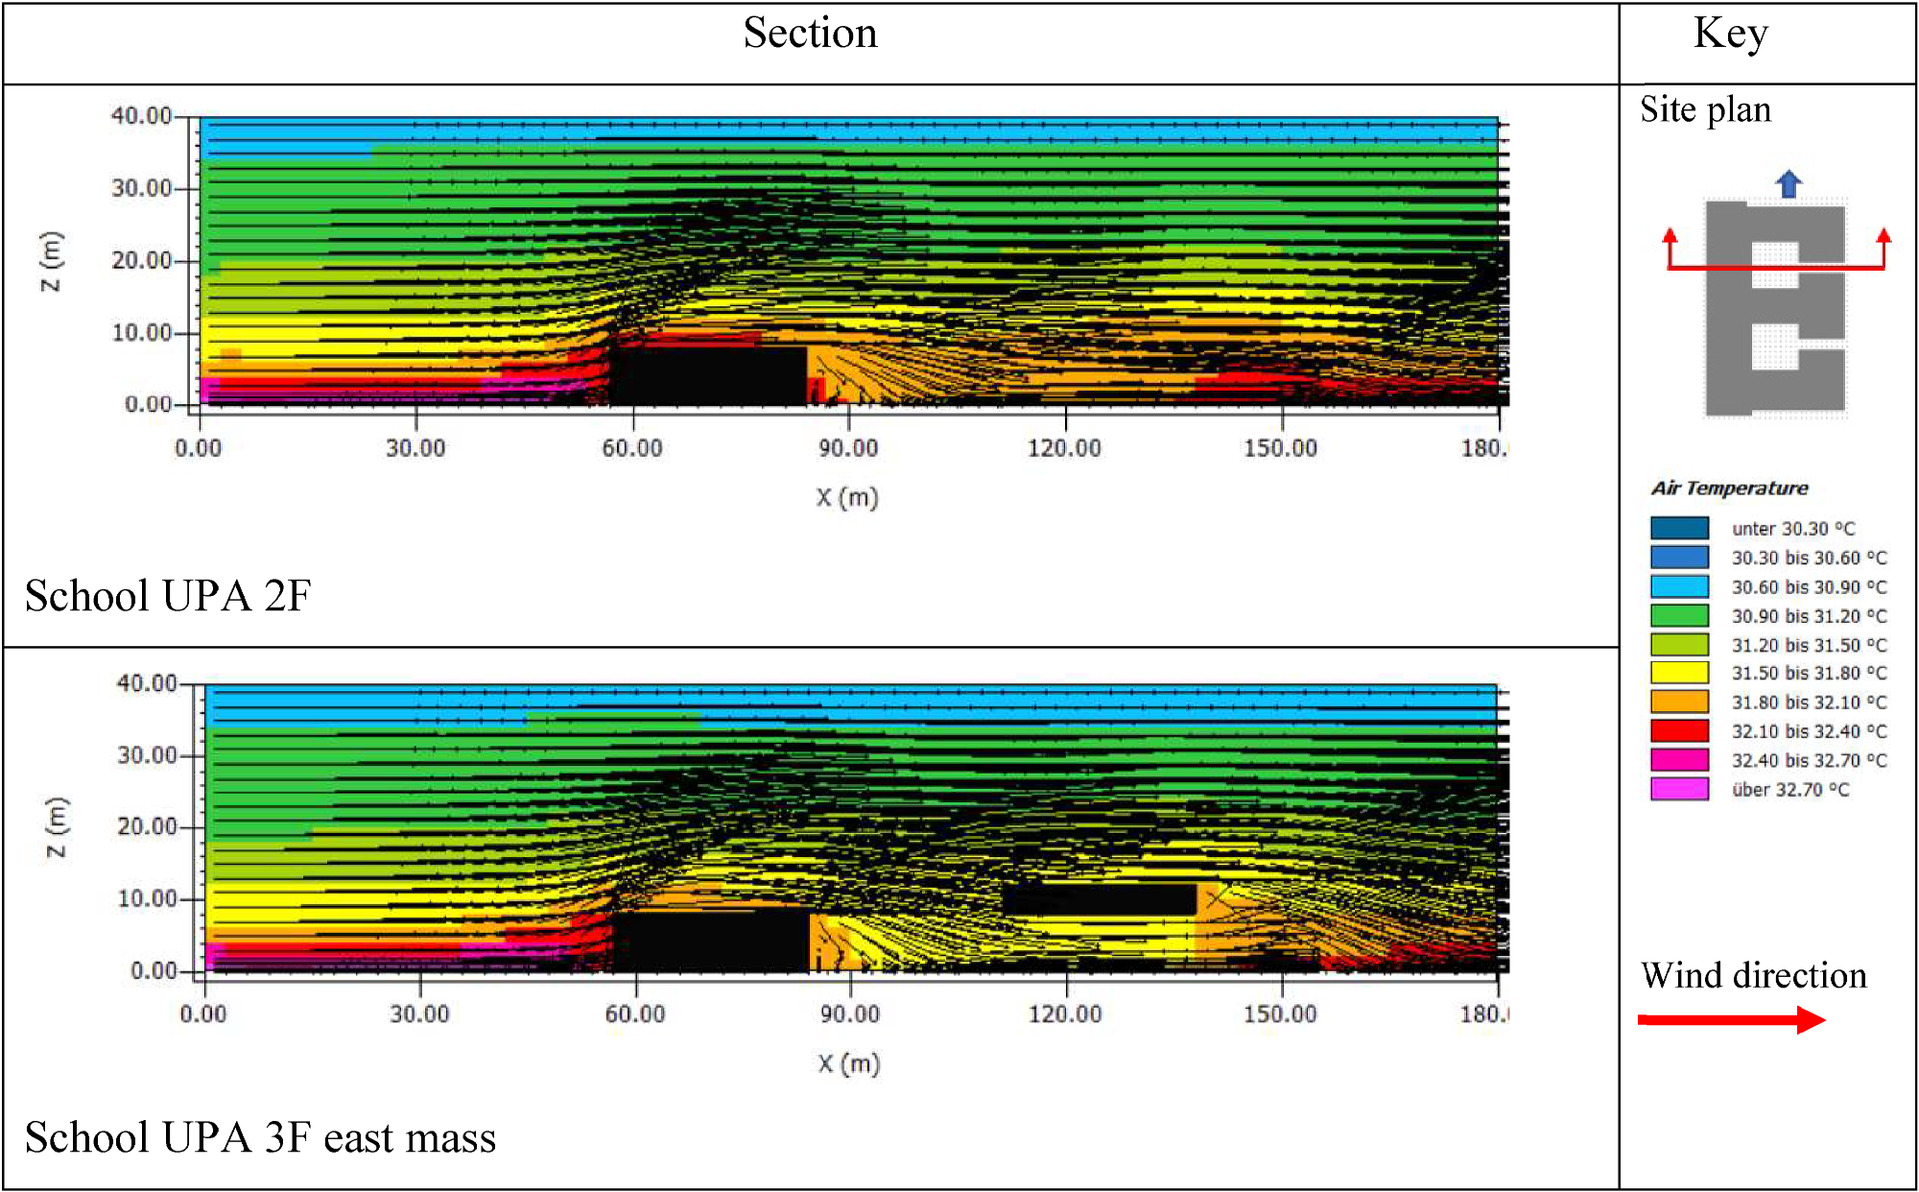
The assessment of the increased height (12 m) of the masses surrounding the courtyards, conducted on September 21, demonstrated that the UPA-fin school, with three floors for the east, north, and south masses collectively referred to as the “3F east mass” (given the larger size of the east mass), exhibited superior Tb values compared with other configurations, as depicted in Figs. 8(b) and 5(c). This 3F east mass school recorded an average Tb of approximately 26.88°C, representing a decrease of 0.59°C compared with the average Tb of the same school with only two floors.
Similarly, on March 21, the simulation results [as shown in Figs. 8(d and e)] indicated that the UPA-fin school with a square courtyard and the 3F configuration outperformed the other designs, boasting an average Tb of 22.76°C, which was 0.54°C lower than the Tb for the 2F configuration. Moreover, it became evident that the “3F all masses” configuration resulted in the highest Tb on both simulation dates. Hence, varying the heights of the masses surrounding the courtyards was deemed beneficial for enhancing the stack effect within the courtyards and influencing the overall Tb of the building. It is worth noting that optimizing the walls surrounding the courtyard, with varying heights, especially taller walls on south side, was recommended to minimize the heat gain from solar radiation.
In the optimal scenario featuring the UPA-fin 3F east mass design, the third floor was strategically positioned in a U-shaped configuration above the northeastern and southern sides of the school, in contrast to the ground and first floors. This positioning served a dual purpose. First, it offered protection from direct solar radiation during the school hours (7 a.m.–2 p.m.), especially during the morning and noon when the sun rises from the east and casts abundant shade in the courtyards.
Second, this layout created open spaces on the east side, allowing for cross-ventilation to permeate through the courtyards from one direction. This ventilation enhancement had a positive impact on the thermal performance of both the courtyards and the entire building, leading to a reduction in the accumulation of thermal mass. This underscores the significance of shielding the building from solar energy and regulating wind circulation to enhance the thermal performance of courtyards and their associated structures. Consequently, even a single-sided ventilation approach improved airflow and contributed to the stack effect within the courtyards. Thus, it is advisable to incorporate voids within the structures surrounding the courtyard to facilitate improved wind flow and circulation within the courtyard. This method led to enhanced daytime ventilation within the courtyards, despite the indoor spaces being sealed off during periods of elevated temperatures (as shown in Fig. 9).
It is crucial to note that adopting daytime ventilation for indoor spaces in hot and humid regions is not recommended, as it would allow hot air to infiltrate the interior areas, resulting in increased indoor temperatures within the building.
Finally, in the optimal UPA-fin 3F east mass configuration, the average height of the masses encircling each courtyard was set at X, with a height of approximately 10 m, while the width extended to 27 m, falling within the range of 10–30 m (from X to 3X). This arrangement aligns with the guidance provided by Koch-Nielsen (2002), who recommended this height-to-width ratio for optimal courtyard performance. According to Koch-Nielsen, when the courtyard’s height is X, it is most effective to have a width ranging from X to 3X, effectively improving the thermal comfort of the building.
Phase 5: Courtyard and Vegetation
His phase aimed to enhance the thermal performance of the courtyard by introducing greenery. The simulation was carried out on two specific dates, September 21 and March 21, under constant parameters and design conditions outlined in Stage 5. These conditions included a CA/BA ratio of 20% and a square outline with 3F east mass at a height of 12 m for the northeastern and southern walls of the school. Various vegetation scenarios were explored as follows:
1.
The first scenario exclusively featured grass, covering approximately 86% of the area, while the remaining 14% consisted of concrete tiles, serving as basic paved pathways connecting school wings to the open courtyard sides. These pathways were essential for equipment movement.
2.
In the second scenario, trees were the sole source of vegetation, covering roughly 30% of the area, with the rest paved in concrete tiles. The Maryland Department of Education (MSDE 2012) recommended positioning trees at least 3–5 m away from courtyard walls to prevent wall foundation damage and allow light into interior spaces. In addition, Abanomi and Jones (2005) advised the use of deciduous trees in schools, as they offer summer shade and permit sunlight in the winter, while providing students with a sense of changing seasons. Deciduous trees were strategically planted in the middle of the courtyard to reduce heat gain, primarily in the center exposed to the most solar radiation. Placed 6 m away from the walls, they covered roughly 30% of the courtyard, totaling around 25 deciduous trees with dimensions of 12 m in height and 9 m in width.
3.
The third scenario combined both trees and grass, with trees constituting approximately 30% in the middle and grass covering around 56%. The remaining 14% of the courtyard area was maintained as concrete tiles.
These scenarios were devised based on insights from prior studies, such as Lee et al. (2016), who examined the impact of greenery (grass and trees) on heat stress and thermal comfort through three different scenarios.
The outcomes of the simulation with various vegetation scenarios revealed that the school with the 3F east mass, featuring grass and trees, exhibited superior thermal performance compared with the others (Fig. 10). Specifically, this configuration had an average Tb of approximately 26.17°C, representing a 0.71°C reduction compared with the scenario without vegetation. Similarly, on March 21, the simulation results indicated that the UPA-fin school with a square courtyard and the 3F east mass, featuring grass and trees, outperformed the others with a Tb of 22.12°C. This temperature was 0.64°C lower than the scenario without vegetation, as presented in Table 8.
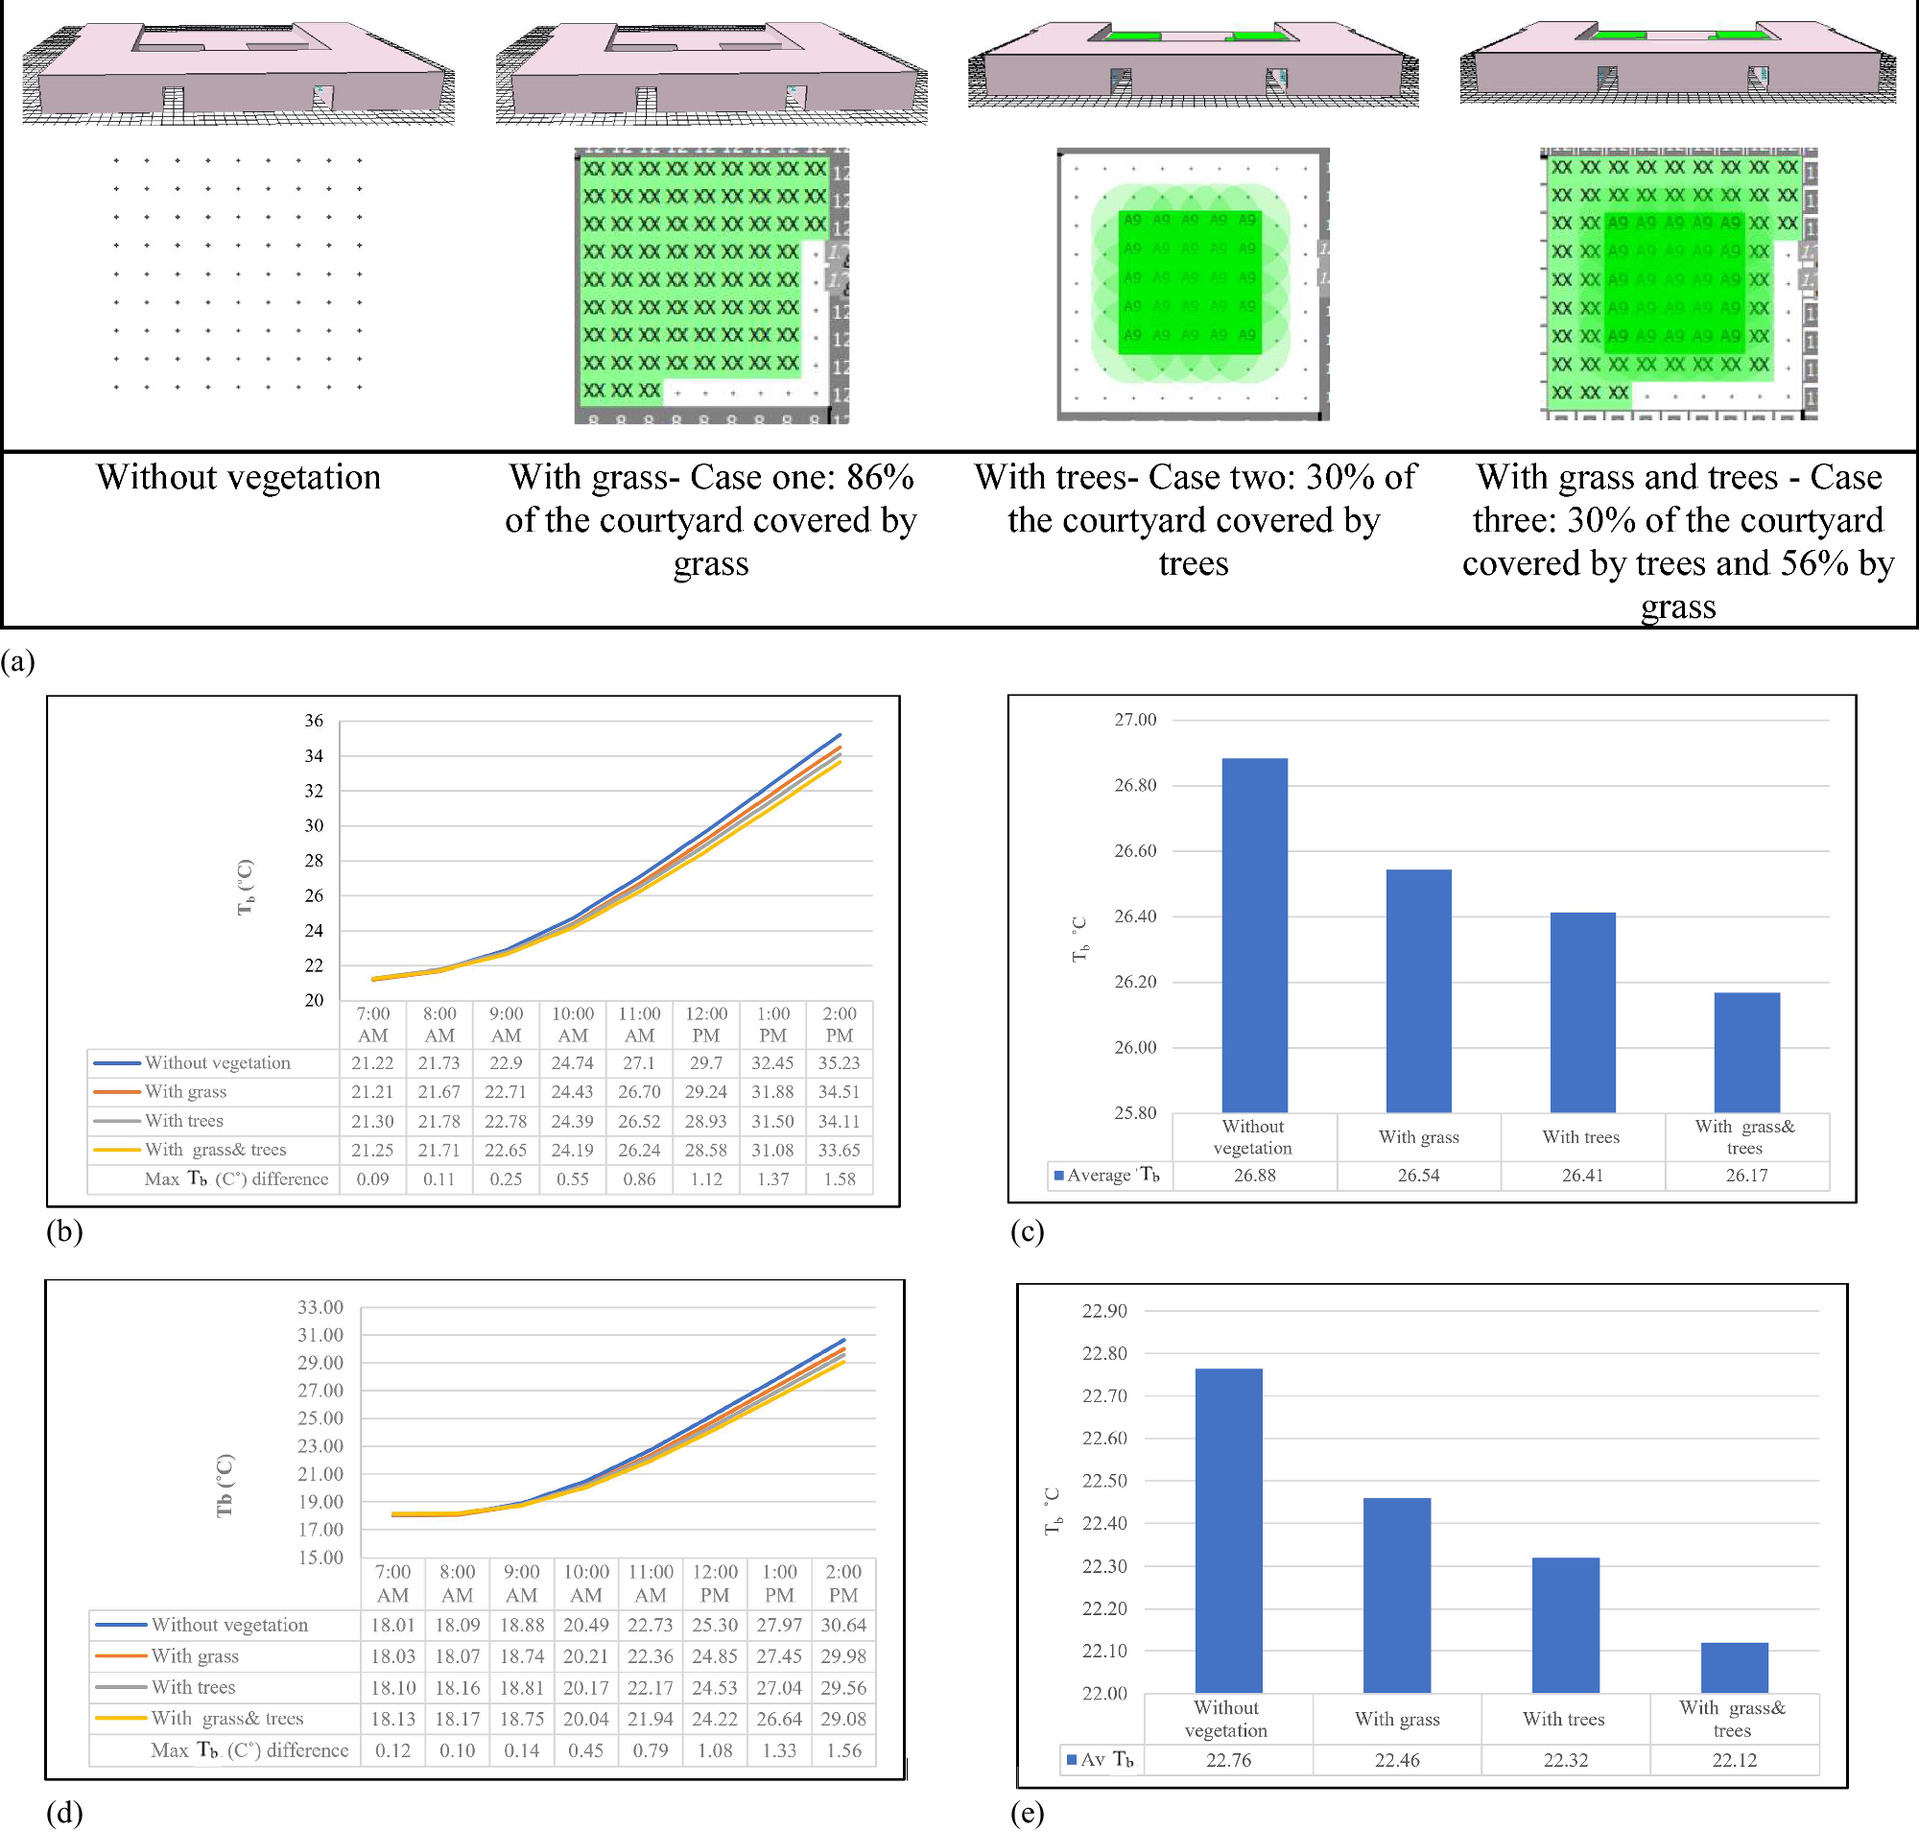
| UPA-fin school with scenarios for vegetation | Average Tb (°C) September 21 (Difference in average Tb in relation to the Ref. value) | Average Tb (°C) on March 21 (Difference in average Tb in relation to the Ref. value) |
|---|---|---|
| Without vegetation | 26.88 (+0.71) | 22.76 (+0.64) |
| With grass. Case one: 86% of the courtyard covered by grass | 26.54 (+0.37) | 22.46 (+0.34) |
| With trees. Case two: 30% of the courtyard covered by trees | 26.41 (+0.24) | 22.32 (+0.20) |
| With grass and trees. Case three: 30% of the courtyard covered by trees and 56% by grass—Best case | 26.17 (Ref.) | 22.12 (Ref.) |
Note: Configuration titles are displayed in boldface.
Furthermore, it became evident that the scenarios involving vegetation, whether grass or trees, exhibited superior performance compared with the one lacking vegetation. This aligns with prior research emphasizing the positive effects of plants on air temperature reduction and enhanced thermal comfort. Vegetation achieves this by limiting heat transfer to the air and through the process of evapotranspiration. It is also recognized that the presence of greenery is a crucial factor in enhancing thermal comfort and mitigating health risks for individuals exposed to outdoor conditions in urban environments. The importance of landscaping, especially in hot regions, is underscored as it contributes to the improvement of a building’s microclimate and aids in cooling interior spaces by reducing heat gain.
Furthermore, it became evident that the presence of grass in the courtyards, while not the optimal scenario, was more effective than having only concrete tiles. Grass, as a ground cover, proved superior to concrete pavement due to its capacity to reflect approximately 2% of solar radiation, compared with concrete’s 4%. Consequently, grass mitigated the direct solar radiation impact on the courtyard floor and reduced the reflection of solar radiation onto the surrounding walls.
Within the scope of this research, the scenario involving trees alone outperformed the scenario with grass as the primary ground cover. Trees exhibited more favorable effects on thermal conditions, primarily through shading the ground and facilitating evaporative cooling. The researchers highlighted that trees within courtyards were more effective in enhancing thermal conditions compared with grass alone. They concluded that introducing greenery, especially trees, covering 0% to 50% of the courtyard area significantly improved daytime thermal conditions.
Furthermore, trees had a more pronounced impact on reducing courtyard temperatures compared with grass, despite the fact that trees reduced wind speed. This reduction in wind speed did not lead to increased temperatures in the courtyard, as indicated by Feroz’s study in Dubai. He found that northwest courtyards that allowed northwest winds recorded higher temperatures and wind speeds. In such cases, hot winds should be cooled by passing over cooling systems such as ponds and vegetation before entering spaces to effectively lower temperatures. While the thermal effect of vegetation in reducing outdoor temperatures was positive, its magnitude varied depending on specific characteristics. Vegetation achieved this through the process of evapotranspiration, where water is released from leaves and stems, and through the absorption of solar energy and its conversion into food, ultimately cooling the air.
Thermal Comfort
Outdoor thermal comfort in courtyards is crucial, with ASHRAE’s thermal sensation scale defining comfort levels from hot (+3) to cold (−3), and a neutral point (0) (ASHRAE Standard 55; ASHRAE 2023). Salata et al. (2016) identified it as a suitable reference for predicted mean vote (PMV) assessment inside courtyards. A study by van Hoof et al. (2010) suggests that −0.5 < PMV < + 0.5 is the most suitable range for outdoor comfort. PMV is commonly used to assess comfort, with a range of −0.5 to +0.5 indicating optimal conditions. Moreover, physiological equivalent temperature (PET), based on the Munich energy balance model, also evaluates thermal conditions, considering factors such as activity, clothing insulation, and indoor climate standards (Höppe 1999; Matzarakis 2008).
Predicted Mean Vote
Despite potentially high PMV readings in courtyards in regions such as Malaysia, many users perceive them as thermally comfortable due to psychosomatic adaptation. People in hot areas are more accepting of a warm thermal atmosphere.
To evaluate the PMV improvement for the UPA-fin school across the five phases of courtyard design modifications, simulations were conducted for the best five cases at 10:00 a.m. on September 21 and March 21. The outdoor average temperature on September 21 ranged from 32.5°C to 35°C, while on March 21, it was around 28.3°C to 31.0°C at 10 a.m.
Simulation results revealed enhanced thermal comfort through the courtyard design improvements on both September 21 and March 21. Changes from Phase 1 to Phase 2 with CA/BA 20% showed insignificant improvements in PMV (Fig. 11). Similar marginal improvement occurred when changing the courtyard outline to square in phase three.
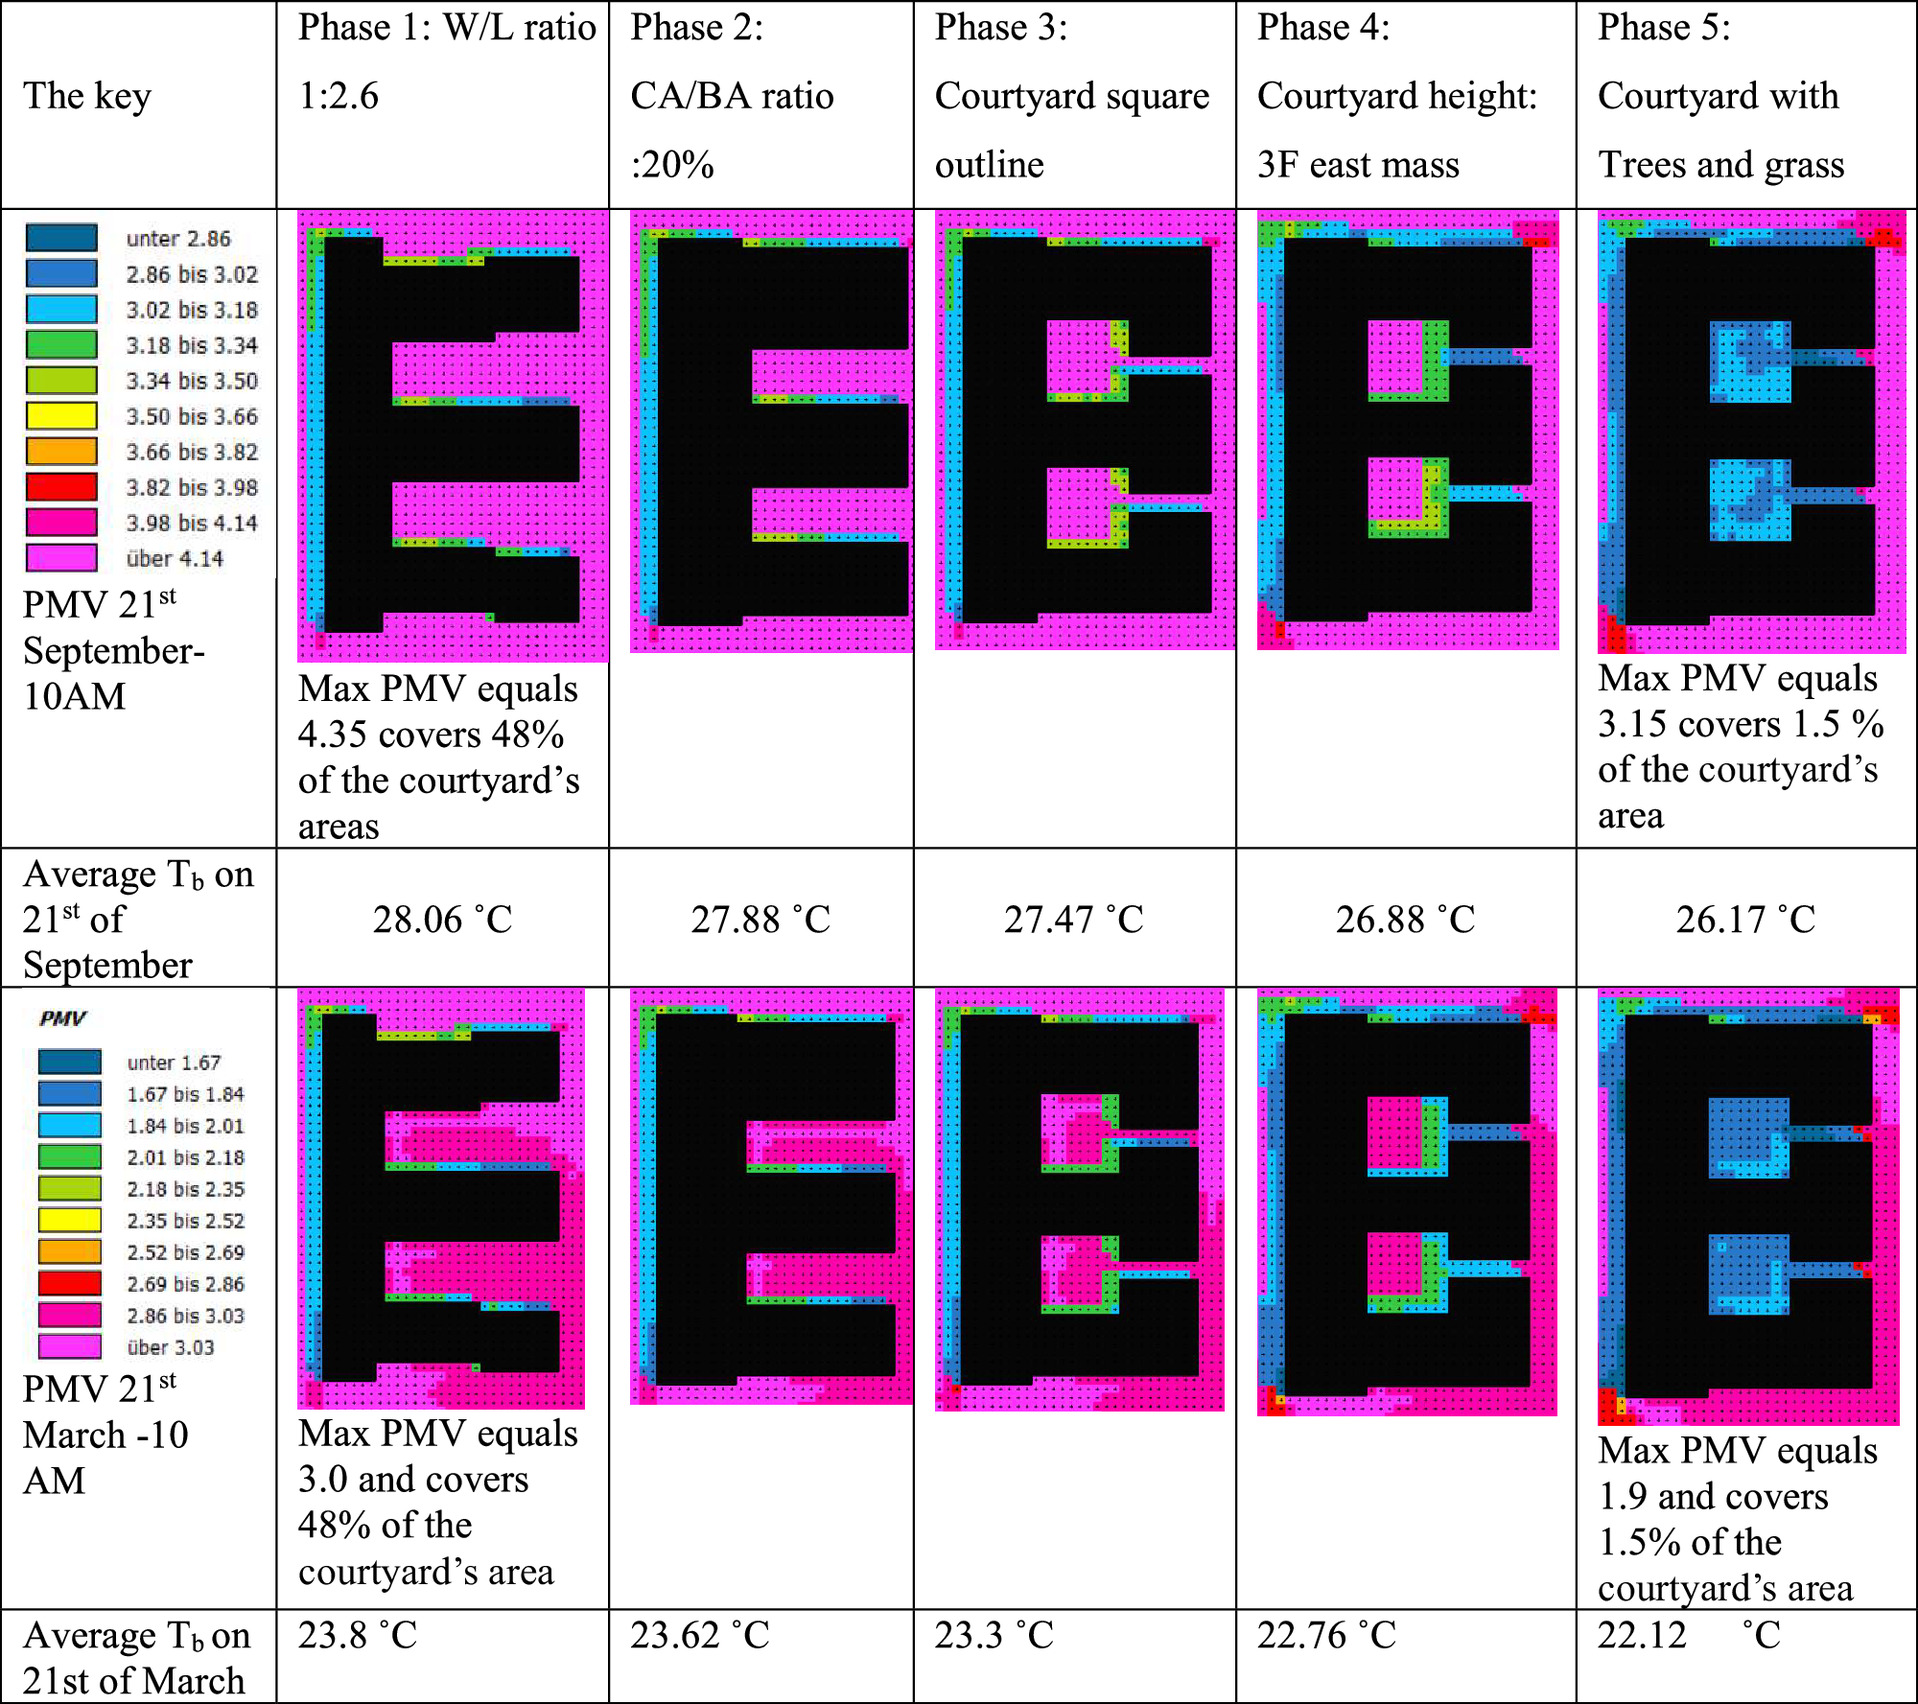
On September 21, most courtyard spaces in phases one and two were uncomfortable, with a PMV around 4 due to high solar radiation concentration. Less shaded areas, resulting from courtyard configurations and low surrounding mass height in the initial phases, led to prolonged exposure to direct solar radiation.
Significant PMV improvement was observed when the height increased to 3 F and vegetation was added. Changing the height to 3 F east mass doubled the area with a green color (3.18–3.34), especially on the east and south sides of the courtyards (Fig. 11). New areas with PMV under 2.86 (warm) began to appear compared with Phase 3 on September 21. Increasing mass height around courtyards can decrease the sky view factor, blocking solar radiation and improving thermal comfort. A similar situation occurred on March 21, with UPA-fin 3 F east mass having more areas with PMV readings between (1.84–2.01) slightly warm and (2.01–2.18) warm, represented by green and blue colors in Fig. 11, than in previous phases.
Phase 5 showed significant improvements in PMV on both simulation dates by incorporating vegetation. On September 21, most courtyard areas achieved PMV readings between 2.82 and 3.02 and below, transitioning from hot to warm on the PMV scale. In contrast, the initial phase had most courtyard areas above 4 (very hot) on the PMV scale. On September 21, the maximum PMV reading for the least favorable case in Stage 2 was 4.35, covering 48% of courtyard areas, while the maximum PMV reading for the optimal case in Stage 2 (Phase 5) was 3.15, covering 1.5% of courtyard areas, representing a 1.2 reduction on the PMV scale.
Similar improvements occurred on March 21 during Phase 5 by introducing vegetation. Most courtyard areas shifted from warm to slightly warm with readings around 1.67 on the PMV scale. In contrast, the initial phase had courtyard areas ranging between 2.86 and 3.03 (warm and hot) on the PMV scale. Incorporating vegetation proved more effective in enhancing the outdoor thermal performance of the courtyard compared with relying solely on design strategies without vegetation. It is recommended to integrate trees and plants in outdoor spaces to enhance thermal comfort, even though trees may reduce wind speed and long-wave radiation, as they offer greater thermal comfort improvements than grass alone.
In conclusion, an improved courtyard design that reduces indoor temperature also enhances the outdoor microclimate of the courtyard. The best case in Stage 5, featuring optimal courtyard design and the lowest average Tb, occurred in the UPA-fin school with vegetation, similarly achieving the best PMV performance on both simulation dates. Despite potentially high PMV readings in courtyards in hot areas, users often perceive them as thermally comfortable due to psychosomatic adaptation. People in hot areas are more accepting of a warm thermal atmosphere, influenced by expectations related to extreme hot areas, such as the monsoon province in Malaysia. The strong connection observed between outdoor thermal comfort and indoor temperature highlights that enhancing courtyard design contributes to improved outdoor thermal comfort and reduced indoor average temperature.
Physiological Equivalent Temperature
PET is a metric designed for assessing outdoor thermal comfort (Mouada et al. 2019). It is a vital metric for determining thermal comfort, especially in outdoor environments. It is used to find an equivalent temperature where the human body would maintain its heat balance under defined indoor conditions, with the same core and skin temperatures that would be expected in the complex conditions of the outdoors. PET relies on the Munich energy balance model for individuals, factoring in uniform activity levels, clothing insulation, and standardized indoor climate variables to measure the thermal conditions of the body and translate them into PET values. The standard calculations involve a light work metabolism of 80 W, and thermal insulation from clothing equivalent to 0.9 clo (Höppe 1999; Matzarakis 2008). Lin and Matzarakis (2008) stated that the value of 30°C for the PET index represents the range of acceptable conditions in subtropical regions.
In the context of a school in the UAE, PET readings were recorded at 10 a.m., a common break time for students, across different design phases of the school’s courtyard. On September 21 (Fig. 12), the highest PET value of 56°C, which initially affected 6% of the courtyard area, saw a substantial reduction in Phase 5, where trees and grass were introduced, bringing the maximum PET down to 52°C affecting only 1% of the courtyard. On March 21, adding greenery decreased the maximum PET from 52°C affecting 8% of the area to 30°C affecting 2% in Phase 5. These modifications clearly illustrate how changes in courtyard design can significantly improve thermal comfort, which is particularly important in school settings where students spend time outdoors during breaks.
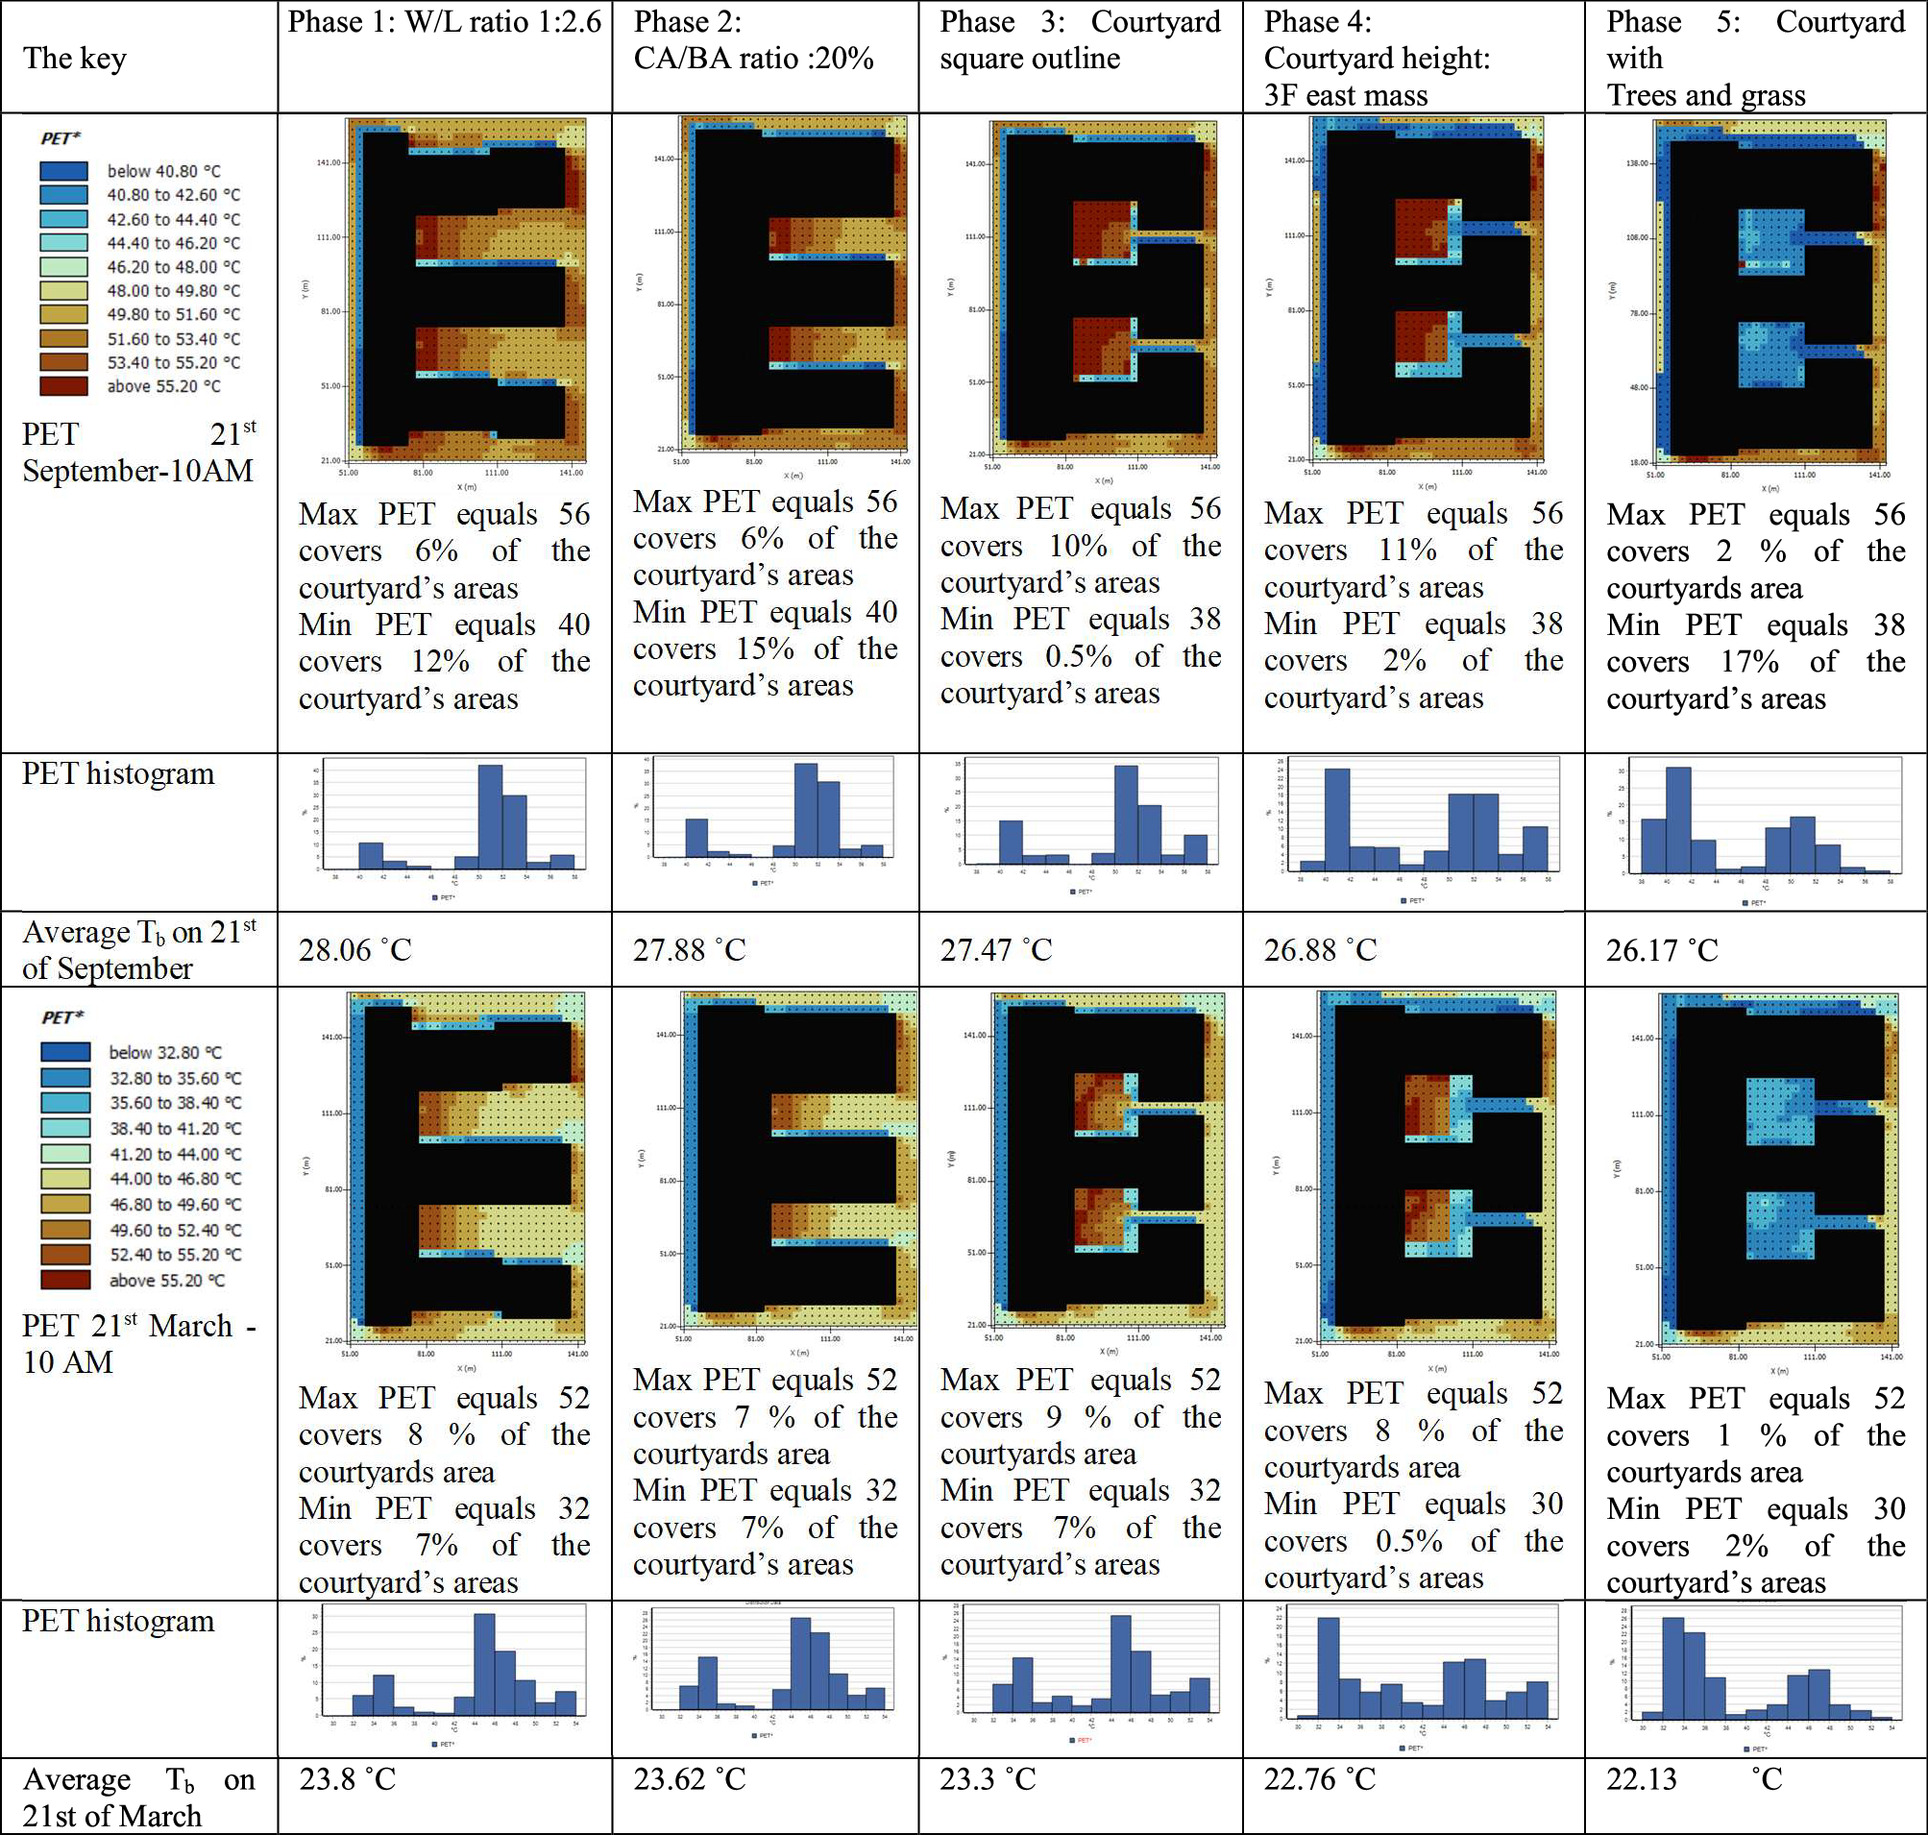
The alterations through Phases 2, 3, and 4 also demonstrate significant improvements in PET values. Phase 2’s adjustment of the CA/BA ratio to 20% led to lower maximum PET readings, enhancing the thermal comfort within the courtyard by altering its spatial dynamics and promoting a cooler microclimate. In Phase 3, the courtyard’s transformation into a square shape aimed to balance solar exposure and minimize heat retention, as evidenced by the further drop in maximum PET values on September 21. Phase 4’s increase in the height of courtyard walls to three floors offered more shade and potentially facilitated better wind circulation, leading to a decrease in maximum PET values and suggesting a positive impact of higher walls on the courtyard’s microclimate and less exposure to solar radiation.
Overall, these phased design interventions underline the benefits of both horizontal and vertical adjustments to courtyard architecture for thermal comfort. They support the literature’s assertions that thoughtful design of outdoor spaces can create microclimates that enhance comfort and facilitate learning, which is vital in educational settings (Höppe 1999; Matzarakis 2008).
Energy Consumption and Courtyard Design
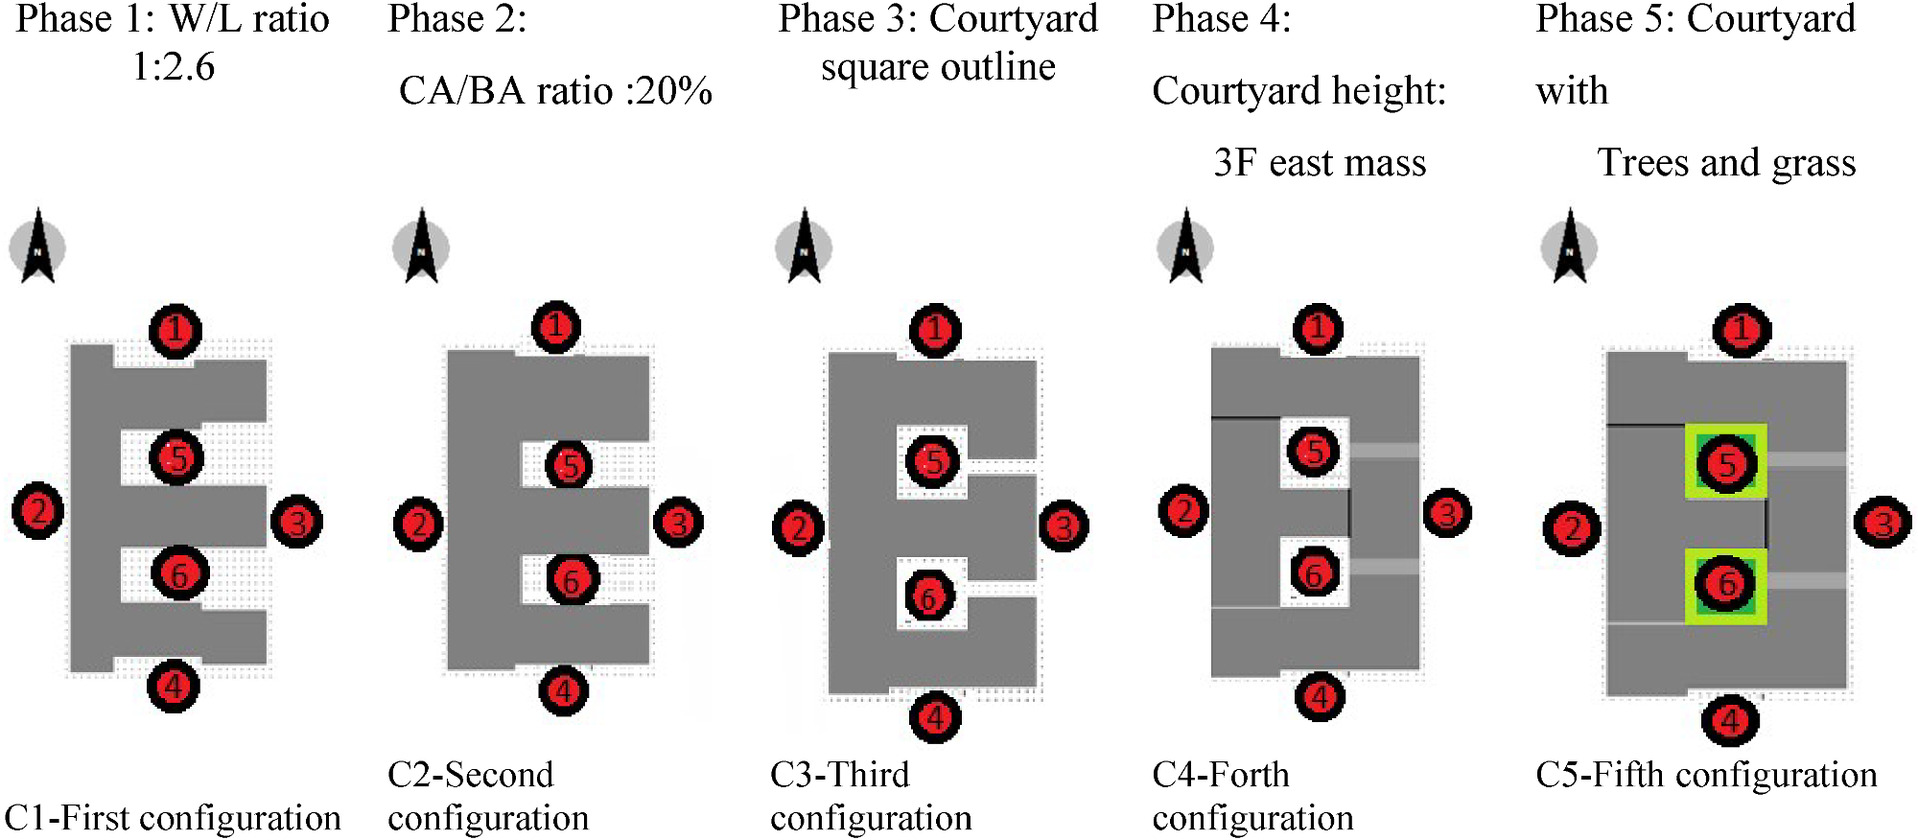
Grasping the nuanced impact of school courtyard improvements on microclimate, and subsequently on energy consumption, is crucial. The results of ENVI-met simulation emphasized on the courtyard’s ability to generate a distinct microclimate that can beneficially influence a building’s temperature and interior environment. This unique microclimate, diverging from the regional climate, should be the basis for energy consumption assessments. This study bridges ENVI-met for microclimatic analysis and IESve for dynamic energy modeling, predicting cooling needs based on evolved courtyard characteristics.
The specialized microclimate data generated through ENVI-met—in the section “Case Study and Climate and Conditions”—were crucial for evaluating the impact of courtyard designs on school buildings. To ascertain the microclimate for the optimized designs over five phases, six strategic points were established within each model (Fig. 13), both around and within the courtyards, mirroring the methodology of Sharmin and Steemers (2015). Weighted average calculations, considering wall areas and proximity to these points, were instrumental in determining the microclimate at each phase. Significant reductions in air temperature—ranging from approximately 0.74°C to 1.45°C in September and 0.5°C to 1.4°C in March—were observed, underscoring the efficacy of the courtyard designs in moderating the microclimatic temperature compared with the baseline climate data used in IESve. Thus the resulted microclimates, based on the average air temperature, were forced in IESve on both dates of simulation to calculate the cooling sensible load accurately (Table 9), as IESve used only the general microclimate for all the simulations.
| Time | September 21 | March 21 | ||||||||||
|---|---|---|---|---|---|---|---|---|---|---|---|---|
| Phase 1: W/L ratio 1:2.6 | Phase 2: CA/BA ratio :20% | Phase 3: Courtyard square outline | Phase 4: Courtyard height: 3 F east mass | Phase 5: Courtyard with trees and grass | General climate from IES | Phase 1: W/L ratio 1:2.6 | Phase 2: CA/BA ratio :20% | Phase 3: Courtyard square outline | Phase 4: Courtyard height: 3 F east mass | Phase 5: Courtyard with trees and grass | General climate from IES | |
| 7:00 a.m. | 25.88 | 25.94 | 25.99 | 26.03 | 26.16 | 25.30 | 18.41 | 18.45 | 18.51 | 18.66 | 18.55 | 17.80 |
| 8:00 a.m. | 28.03 | 28.05 | 28.16 | 28.07 | 28.22 | 28.00 | 20.94 | 20.95 | 20.97 | 20.92 | 20.69 | 21.00 |
| 9:00 a.m. | 30.52 | 30.51 | 30.57 | 30.42 | 30.48 | 31.00 | 24.57 | 24.58 | 24.50 | 24.33 | 24.13 | 26.00 |
| 10:00 a.m. | 32.12 | 32.07 | 32.08 | 31.90 | 31.87 | 32.50 | 26.95 | 26.93 | 26.82 | 26.59 | 26.41 | 28.30 |
| 11:00 a.m. | 34.19 | 34.14 | 34.03 | 33.83 | 33.73 | 35.00 | 29.45 | 29.42 | 29.26 | 29.00 | 28.81 | 31.00 |
| 12:00 p.m. | 36.08 | 36.01 | 35.80 | 35.59 | 35.46 | 37.00 | 30.85 | 30.78 | 30.61 | 30.32 | 30.17 | 32.00 |
| 1:00 p.m. | 37.45 | 37.37 | 37.11 | 36.88 | 36.82 | 38.30 | 29.27 | 29.08 | 28.99 | 28.68 | 28.61 | 28.30 |
| 2:00 p.m. | 38.26 | 38.18 | 38.10 | 37.90 | 37.55 | 39.00 | 31.10 | 31.01 | 30.83 | 30.53 | 30.35 | 32.00 |
Note: The values under the time and the general climate were illustrated in boldface to show how they differ from the microclimates.
To assess the energy consumption improvements in the UPA-fin school resulting from the courtyard design modifications, simulations were conducted for the top five cases from the five phases outlined each with its related forced in microclimate in IESve on both September 21 and March 21. The energy consumption indicator used for this assessment was the cooling plant sensible load, defined as the sum of the room cooling plant sensible loads for all rooms in the building, following the IESve definitions guide.
The calculation of cooling energy consumption considered the assumption that school buildings are occupied exclusively during schooling hours (7:00 a.m.–2:00 p.m.). Consequently, the air conditioning system was assumed to operate continuously to maintain thermal comfort for occupants, adhering to the set point temperature of 23°C in the IESve.
Energy Consumption on Both Dates of Simulation
The simulation results demonstrated a reduction in the cooling plant sensible load for the UPA-fin school as a consequence of enhancing the courtyard design across the five phases of Stage 2, observed on both September 21 and March 21, albeit at varying levels.
On September 21, depicted in Fig. 14, the initial phase (Phase 1) showed a cooling plant sensible load of approximately 134.27 W/m2 at 1:30 p.m. Subsequently, modifying the courtyard design by adjusting the CA/BA ratio to 20% in the second phase led to a decrease in the cooling plant sensible load to 129.60 W/m2, resulting in 97% reduction in the cooling load compared with Phase 1.
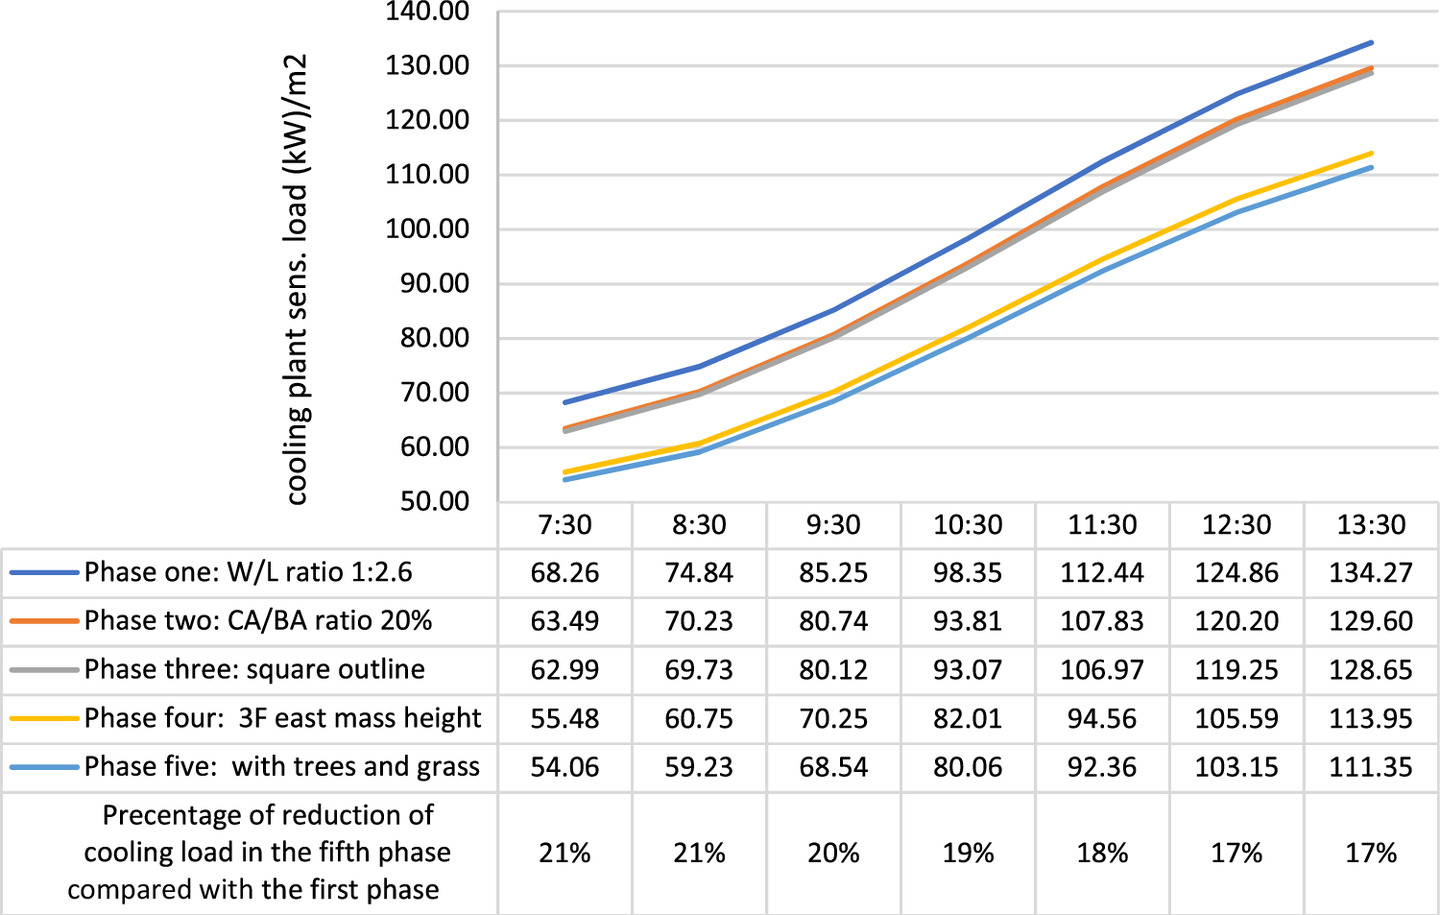
Furthermore, the introduction of an additional floor in the school’s east mass during Phase 4 (3 F east mass) managed to reduce the hourly cooling plant sensible load to 87%–88% of that observed with a square outline in Phase 3, varying with time. At the peak time, the cooling plant sensible load was reduced from 128.65 W/m2 to 113.95 W/m2 at 1:30 p.m. The smallest reduction occurred during the incorporation of greenery in Phase 5, amounting to approximately 2.3%.
In summary, considering the modifications applied to the UPA-fin school from the first phase to the fifth phase on September 21, there was an overall reduction in the cooling plant sensible load ranging between 79% and 83% W/m2.
On March 21, illustrated in Fig. 15, the adjustment of the CA/BA ratio to 20% for the UPA-fin school in the second phase resulted in an hourly cooling plant sensible load ranging from 47% to 88% of the load observed in Phase 1 during school hours. Furthermore, the addition of another floor in the school’s 3 F east mass during Phase 4 achieved a reduction in the hourly cooling plant sensible load to 75%–87% compared with the load with a square outline in Phase 3 throughout the school day. During peak hours, the cooling plant sensible load was diminished from 65.10 W/m2 to 56.57 W/m2 at 1:30 p.m. by incorporating a third floor. The reduction attributed to the introduction of greenery was approximately 14% at 9:30 a.m., decreasing to only 5% at noon when the temperature rose to 32.9°C as the outdoor temperature.
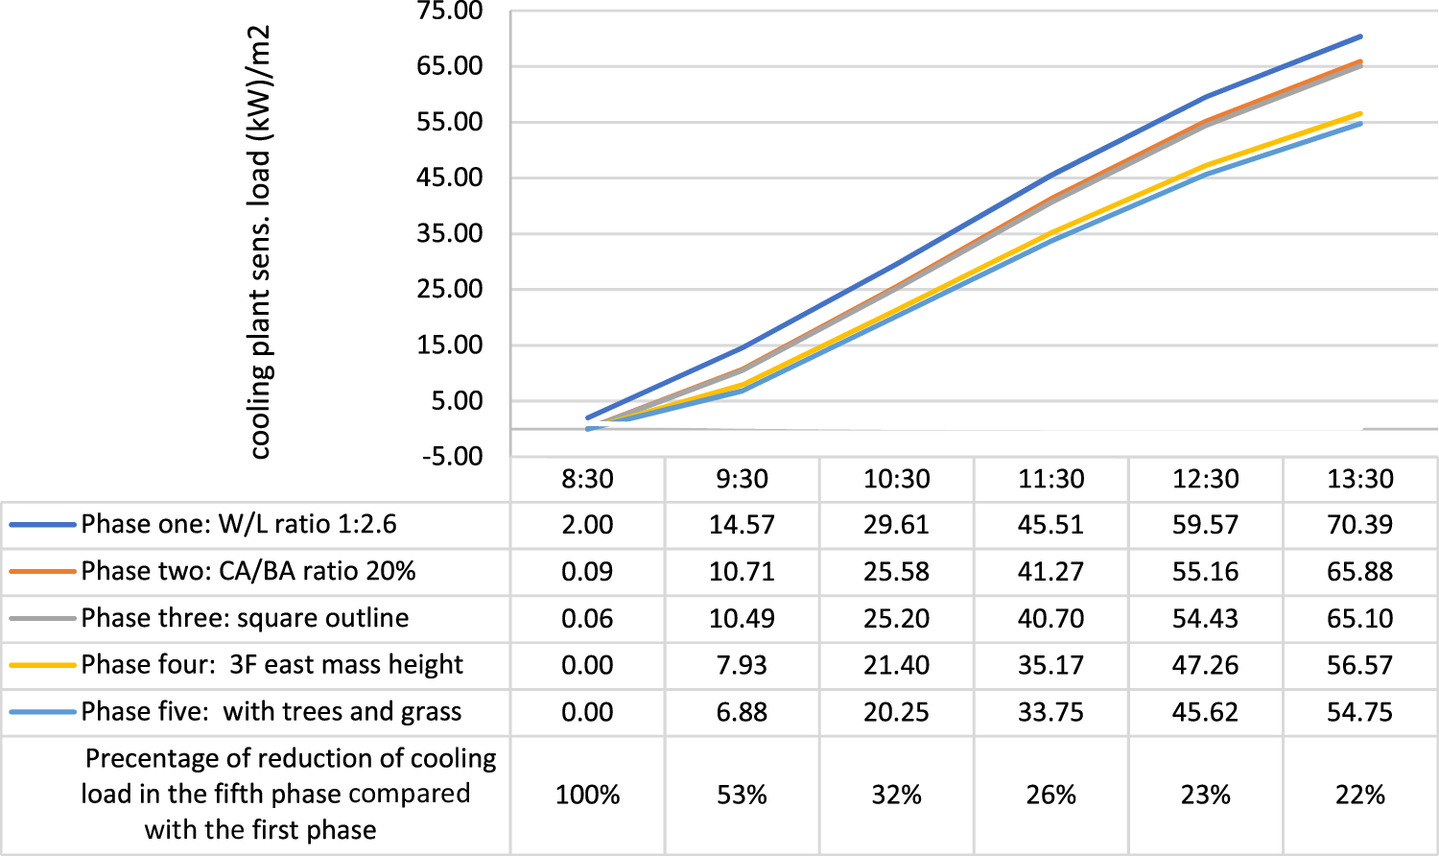
In summary, the overall reduction in the cooling plant sensible load was approximately 53% in the morning at 9:30 a.m., decreasing to 22% at 1:30 p.m. This reduction was achieved by implementing modification strategies on the UPA-fin school from the first phase to the fifth phase on March 21.
On September 21, Fig. 16(a) presents the daily cooling plant sensible load for the optimal cases from the five phases of Stage 2. Specifically, the daily cooling plant sensible load was 698.27 Wh/m2 for the UPA-fin school in Phase 1 with a W/L ratio of 1:2.6, 665.91 Wh/m2 for the UPA-fin school in Phase 2 with a CA/BA ratio of 20%, 660.78 Wh/m2 for the UPA-fin school in Phase 3 with a square outline, 582.59 Wh/m2 for the UPA-fin school in Phase 4 with a 3 F east mass height, and finally, 568.76 Wh/m2 for the UPA-fin school in Phase 5 with trees and grass. The overall average reduction in the cooling plant sensible load was approximately 19% by introducing trees and grass to the UPA-fin school in the fifth phase compared with the first phase with a 1:2.6 W/L ratio.
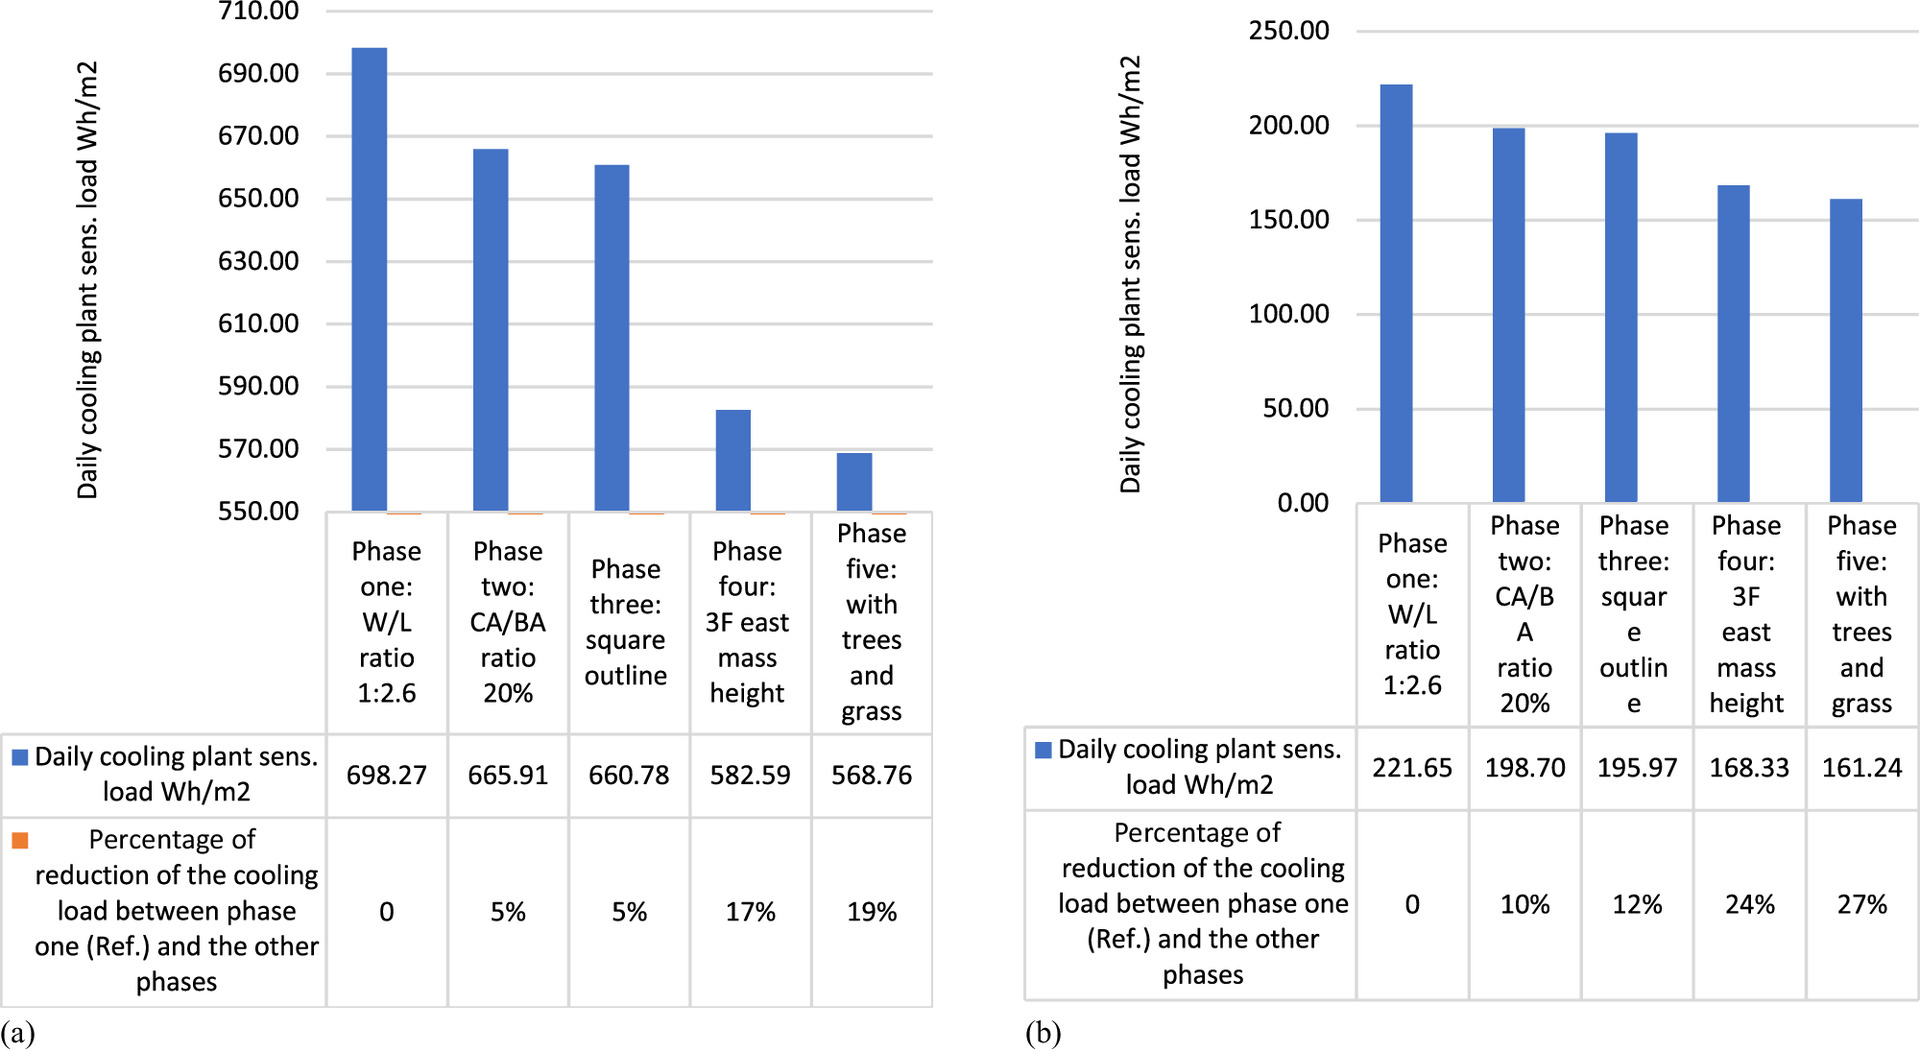
Similarly, on March 21, comparable reductions in the cooling plant sensible load aligned with the design enhancements in the five stages of Stage 2, as depicted in Fig. 16(b). Accordingly, the cooling plant sensible load was 221.65 Wh/m2 for the UPA-fin school in Phase 1 with a W/L ratio of 1:2.6, 198.70 Wh/m2 for the UPA-fin school in Phase 2 with a CA/BA ratio of 20%, 195.97 Wh/m2 for the UPA-fin school in Phase 3 with a square outline, 168.33 Wh/m2 for the UPA-fin school in Phase 4 with a 3 F east mass height, and finally, 161.24 Wh/m2 for the UPA-fin school in Phase 5 with trees and grass. The overall average reduction in the cooling plant sensible load was about 27% by incorporating trees and grass into the UPA-fin school in the fifth phase compared with the first phase with a 1:2.6 W/L ratio.
Ultimately, the optimal configuration of the courtyard across the five phases effectively reduced the sensible load for cooling the school buildings by lowering their temperature. The implementation of various strategies, such as maintaining a 20% CA/BA ratio, adopting a square courtyard outline, adding a third floor predominantly on the east mass, and incorporating vegetation within the courtyards, contributed to reducing the temperature by 1.9°C on September 21 and 1.7°C on March 21. Consequently, notable average energy savings for the cooling load were achieved during the progression from Phase 1 to Phase 5. Adjusting the CA/BA ratio to 20% on September 21 resulted in a reduction of approximately 4.6%, whereas on March 21, the savings increased to about 10.4%. Transitioning from Phase 2 to Phase 3, where the courtyard outline shifted to a square shape, yielded energy savings of around 1.0% on September 21, escalating to approximately 1.4% on March 21. Moreover, moving from Phase 3 to Phase 4, where the height of the east mass increased to three floors, significantly increased energy savings, reaching around 11.8% on September 21 and 14.1% on March 21. Introducing vegetation in Phase 5 resulted in energy savings of about 2.4% on September 21, escalating to about 4.2% on March 21. The cumulative impact of these enhancements, spanning from Phase 1 to Phase 5 with the optimal courtyard design, led to a substantial total average energy savings of approximately 19% on September 21 and 27.3% on March 21 (Fig. 17).
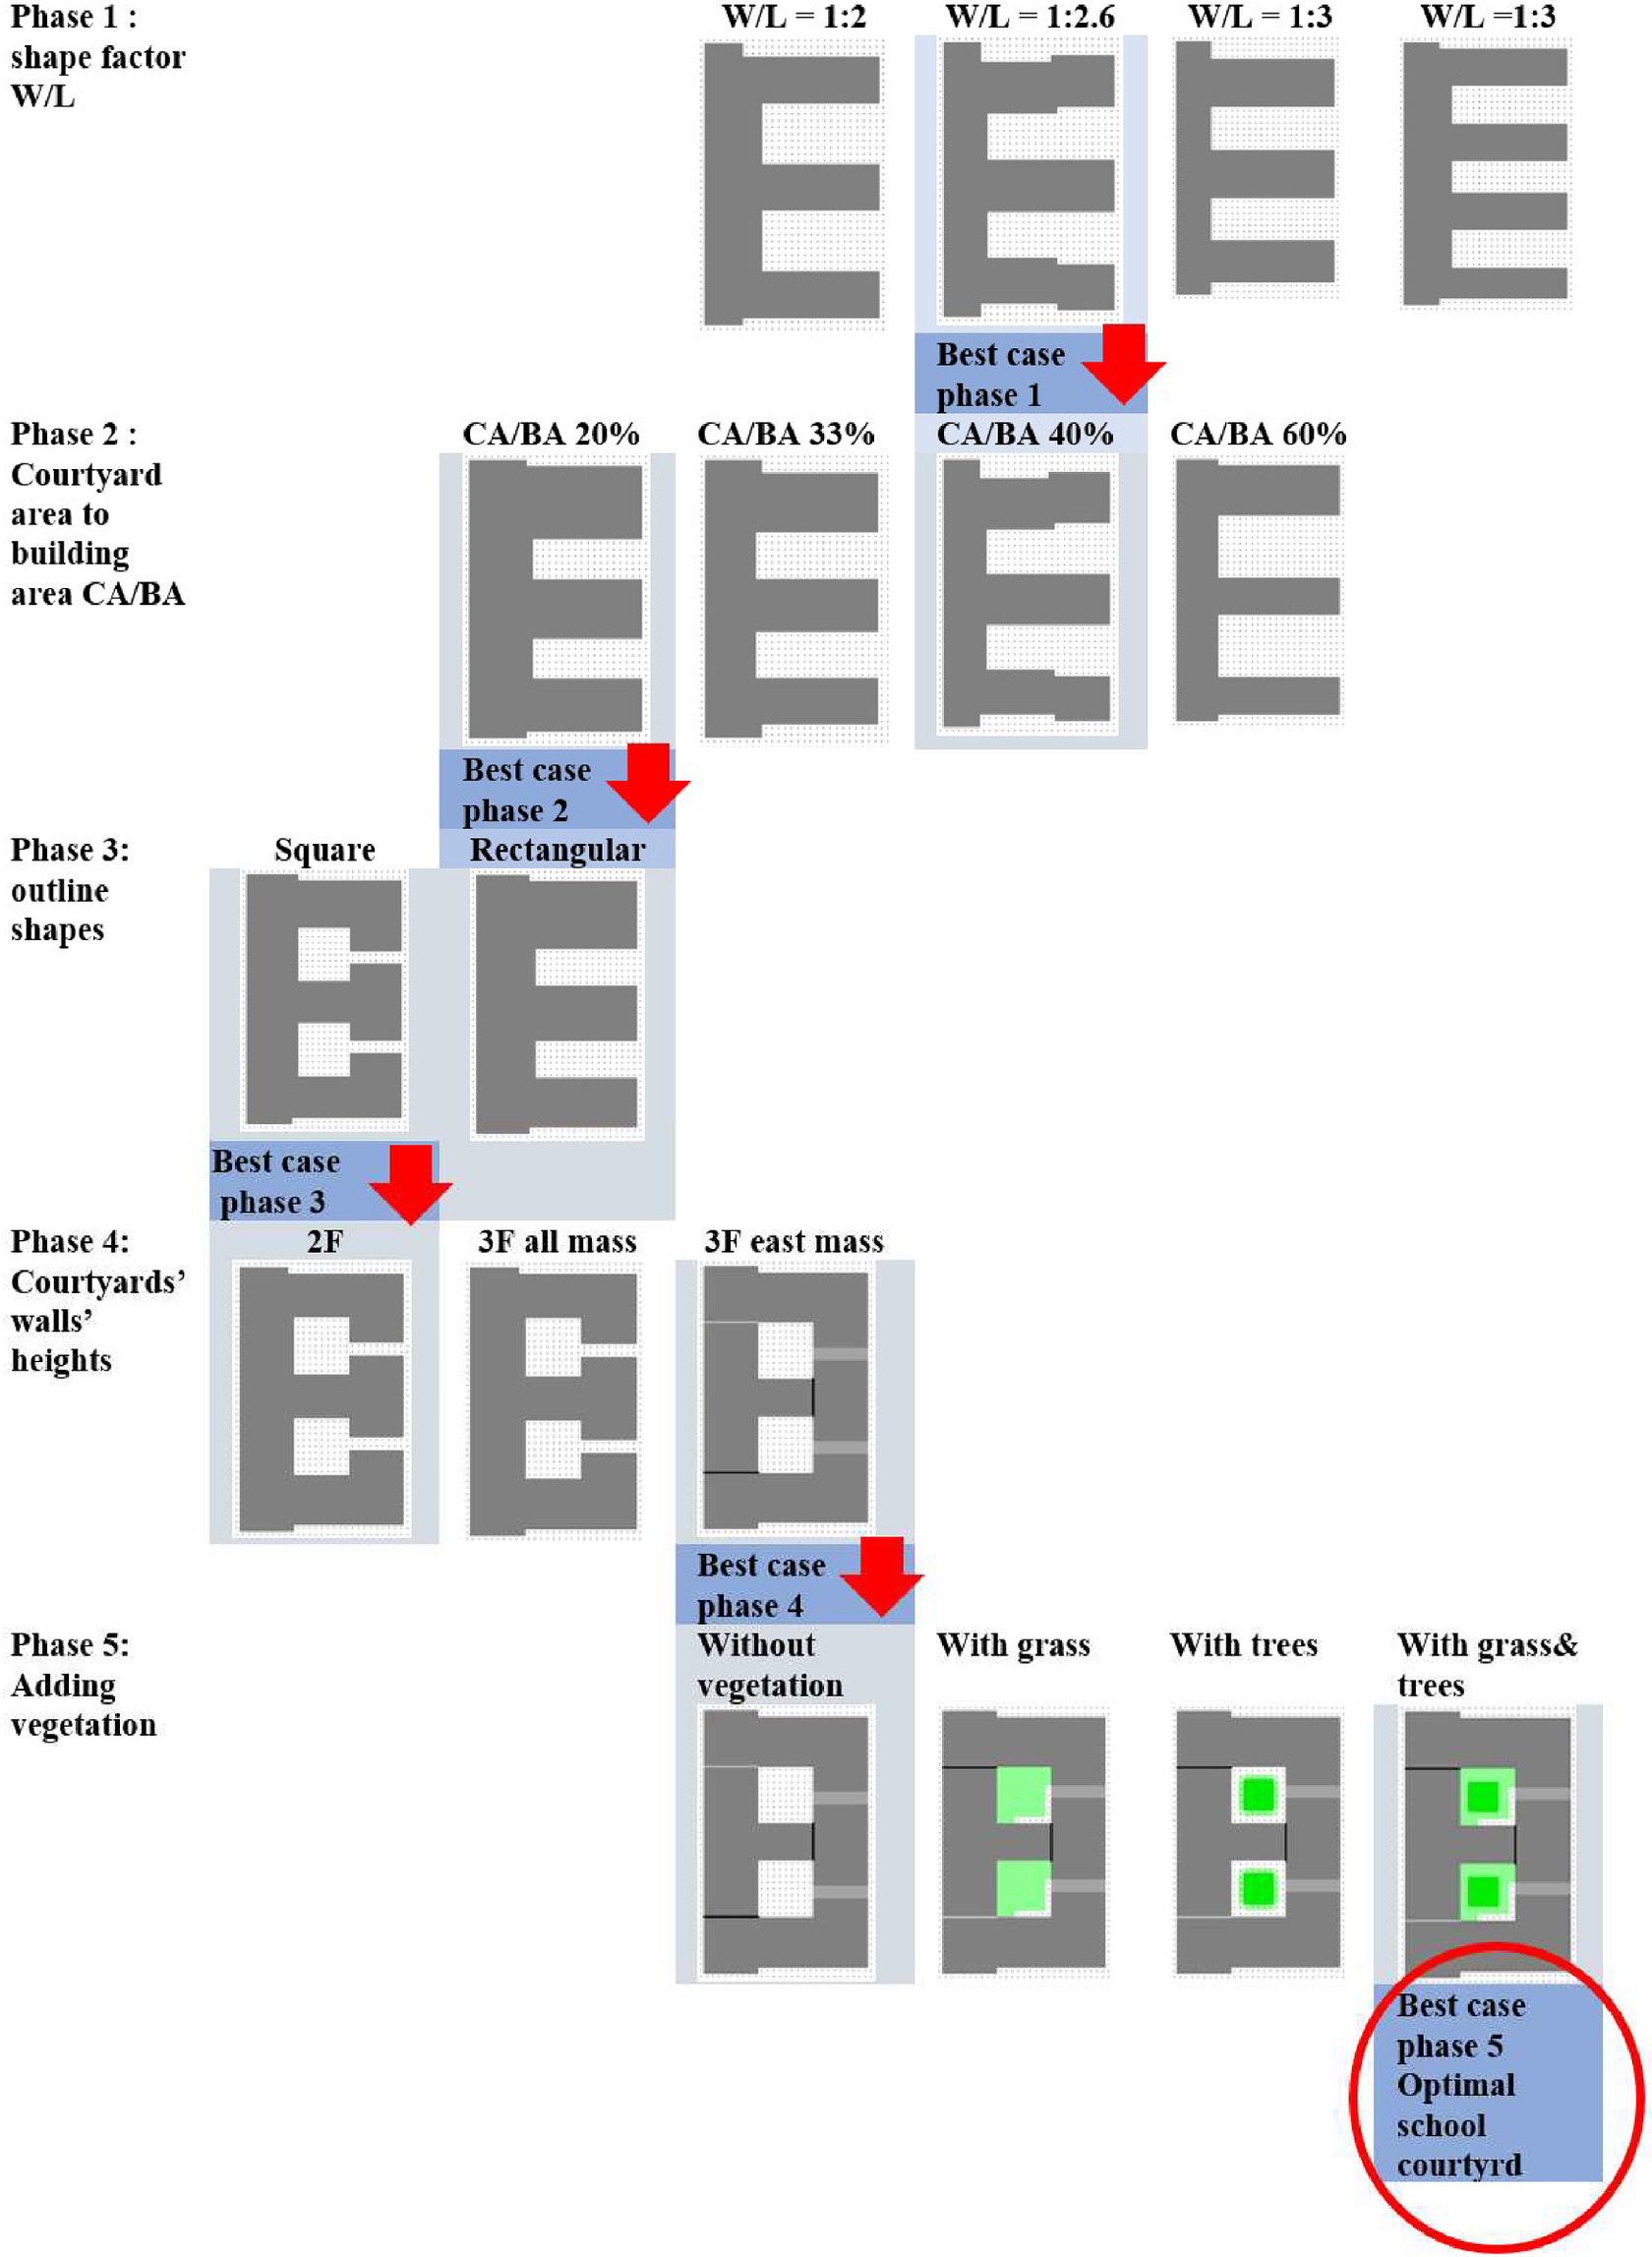
Conclusion
It is evident from the existing literature that few researchers have explored courtyards as passive solutions for school buildings, especially in hot climates, without specifying suitable ratios. This study addresses this gap by employing an effective passive design strategy—well-designed courtyards—to decrease temperatures and reduce the energy required for cooling in UAE school buildings. In addition, the study emphasizes the positive impact of the optimal school courtyard on thermal comfort (PMV), anticipating improved student satisfaction with the school building as it provides an enjoyable area for socialization, contributing to psychological and physical health during breaks.
The optimized school courtyard, evolving through five phases of the research, features a square shape that expands the shaded area and cools the surrounding spaces on hot days. The 20% CA/BA ratio increases the thickness of masses around the courtyard, enhancing the shadow index within. Furthermore, the optimal courtyard incorporates three floors for the east, north, and south masses, creating voids on the east side that facilitate cross-ventilation, ultimately enhancing thermal performance and reducing accumulated thermal mass. In addition, the optimal courtyard, adorned with both grass and trees, outperforms scenarios with grass-only or trees-only. Solely having grass fails to create extra shade, while relying solely on trees fills the courtyard space and impedes air movement.
In conclusion, the courtyard design effectively lowers school building temperatures and, consequently, the cooling sensible load. The implementation of specific strategies—CA/BA ratio of 20%, a square courtyard outline, an additional third floor primarily on the east mass, and the integration of vegetation—resulted in a temperature reduction (Tb) to 1.9°C on September 21 and 1.7°C on March 21. This contributed to a 19% reduction in the cooling load on September 21 and a 27% reduction on March 21 in the fifth phase of courtyard design improvements, compared with the baseline case in Phase 1.
Limitation of this research, which concentrated on investigating thermal conditions and energy consumption in optimal school courtyard designs within a hot arid climate, lies in its specific regional focus. The findings may lack direct applicability to regions with differing climatic conditions. To overcome this limitation, future studies could broaden their scope to include a more diverse range of climatic zones, thereby offering a more comprehensive understanding of how courtyard design impacts thermal conditions and energy consumption across various climates. Furthermore, exploring the long-term sustainability of the proposed courtyard configurations and their influence on energy usage could be a valuable avenue for further inquiry. Investigating the incorporation of renewable energy sources and innovative cooling technologies within these courtyard designs to enhance their energy efficiency in hot arid climates is also a promising area for future exploration. Such an expansion of research parameters would contribute to a more holistic and adaptable approach to sustainable school design and operation in diverse environments.
Data Availability Statement
All data, models, and code generated or used during the study appear in the published article.
Acknowledgments
The author would like to recognize the support provided by Ajman University and the Healthy and Sustainable Built Environment Research Center for the publication of this research.
References
Abanomi, W., and P. Jones. 2005. “Passive cooling and energy conservation design strategies of school buildings in hot, arid region: Riyadh, Saudi Arabia.” In Proc., of the Int. Conf. Passive and Low Energy Cooling for the Built Environment, 619–630. Santorini, Greece: Heliotopos Conferences.
Abbaas, E. S., A. A. Saif, M. A. C. Munaaim, and M. Azree Othuman Mydin. 2018. “Influence of courtyard ventilation on thermal performance of office building in hot-humid climate: A case study.” E3S Web Conf. 34: 02053. https://doi.org/10.1051/e3sconf/20183402053.
Abdaljawad, I. 2016. “Impact of ministry schools’ envelopes on day lighting and energy performance in the UAE.” MSc Dissertation, Faculty of Engineering and Information Technology, British University.
Abdulkareem, H. A. 2016. “Thermal comfort through the microclimates of the courtyard. A critical review of the middle-eastern courtyard house as a climatic response.” Procedia Social Behav. Sci. 216: 662–674. https://doi.org/10.1016/j.sbspro.2015.12.054.
Abdullah, A. M., A. A. Aziz, A. S. Ahmad, and S. S. S. Mahdzar. 2013. “Green technology: Comparison of thermal comfort levels for two traditional bugis houses in Malaysia.” Adv. Sci. Lett. 19 (12): 3512–3514. https://doi.org/10.1166/asl.2013.5208.
Abuhussain, M. A., N. Al-Tamimi, B. S. Alotaibi, M. K. Singh, S. Kumar, and R. Elnaklah. 2022. “Impact of courtyard concept on energy efficiency and home privacy in Saudi Arabia.” Energies 15 (15): 5637. https://doi.org/10.3390/en15155637.
Ahmed, M. A., and S. A. Shaikh. 2013. “Solar radiation studies for Dubai and Sharjah, UAE.” Int. J. Phys. Math. Sci. 7 (1): 130–137.
Albattah, M., and L. Bande. 2023. “Awareness and perception of the environmental sustainability of the UAE University campus: A case study of sustainability course.” Int. J. Sustainability Higher Educ. 24 (7): 1610–1628. https://doi.org/10.1108/IJSHE-04-2022-0129.
Al Dakheel, J., K. Tabet Aoul, and A. Hassan. 2018. “Enhancing green building rating of a school under the hot climate of UAE; renewable energy application and system integration.” Energies 11 (9): 2465. https://doi.org/10.3390/en11092465.
Al-Hafith, O., B. K. Satish, S. Bradbury, and P. de Wilde. 2017. “The impact of courtyard parameters on its shading level an experimental study in Baghdad, Iraq.” Energy Procedia 134: 99–109. https://doi.org/10.1016/j.egypro.2017.09.539.
Al-Hemiddi, N. A., and K. A. Megren Al-Saud. 2001. “The effect of a ventilated interior courtyard on the thermal performance of a house in a hot–arid region.” Renewable Energy 24 (3–4): 581–595. https://doi.org/10.1016/S0960-1481(01)00045-3.
Al-Khatatbeh, B. J., and S. N. Ma’bdeh. 2017. “Improving visual comfort and energy efficiency in existing classrooms using passive daylighting techniques.” Energy Procedia 136: 102–108. https://doi.org/10.1016/j.egypro.2017.10.294.
AlMhafdy, A., N. Ibrahim, S. Ahmad, and J. Yahya. 2013. “Courtyard design variants and microclimate performance.” Procedia Social Behav. Sci. 101: 170–180. https://doi.org/10.1016/j.sbspro.2013.07.190.
Al-Naemi, B. N. 2024. “A methodology to asses environmental sustainability of educational buildings in Qatar with a case study.” Ph.D. thesis, College of Engineering, Qatar Univ.
Al-Sallal, K. A. 2010. “Daylighting and visual performance: Evaluation of classroom design issues in the UAE.” Int. J. Low-Carbon Technol. 5 (4): 201–209. https://doi.org/10.1093/ijlct/ctq025.
Alzanfer, B. 2014. “The impact of the neigbourhood geometries on outdoors thermal comfort and energy consumption from urban dwellings.” Ph.D. thesis, School of Architecture, Cardiff Univ.
Antonio, R., and D. D. Carvalho. 2015. Courtyard housing as a subtropical urban design model. Doctoral Dissertation, School of Design Creative Industries Faculty, Queensland Univ. of Technology.
ASHRAE. 2023. “Thermal environmental conditions for human occupancy.” ASHRAE Standard 55. Accessed December 28, 2023. https://www.ashrae.org/technical-resources/bookstore/standard-55-thermal-environmental-conditions-for-human-occupancy.
Berkovic, S., A. Yezioro, and A. Bitan. 2012. “Study of thermal comfort in courtyards in a hot arid climate.” Sol. Energy 86 (5): 1173–1186. https://doi.org/10.1016/j.solener.2012.01.010.
Brebbia, C., and E. Beriatos. 2011. Sustainable development and planning V. Southampton, UK: WIT Press.
Chadalavada, K. 2017. “Analyzing vernacular sustainable design principles- A case study of a vernacular dwelling in Godavari region of Andhra Pradesh, India.” Int. J. Emerging Trends Sci. Technol. 03 (03): 5010–5017. https://doi.org/10.18535/ijetst/v4i3.05.
Dias Pereira, L., D. Raimondo, S. P. Corgnati, and M. Gameiro Da Silva. 2014. “Energy consumption in schools – A review paper.” Renewable Sustainable Energy Rev. 40: 911–922. https://doi.org/10.1016/j.rser.2014.08.010.
Díaz-López, C., A. Serrano-Jiménez, K. Verichev, and Á Barrios-Padura. 2022. “Passive cooling strategies to optimise sustainability and environmental ergonomics in Mediterranean schools based on a critical review.” Build. Environ. 221: 109297. https://doi.org/10.1016/j.buildenv.2022.109297.
Diz-Mellado, E., V. P. López-Cabeza, C. Rivera-Gómez, C. Galán-Marín, J. Rojas-Fernández, and M. Nikolopoulou. 2021. “Extending the adaptive thermal comfort models for courtyards.” Build. Environ. 203: 108094. https://doi.org/10.1016/j.buildenv.2021.108094.
Diz-Mellado, E., V. P. López-Cabeza, C. Rivera-Gómez, J. Roa-Fernández, and C. Galán-Marín. 2020. “Improving school transition spaces microclimate to make them liveable in warm climates.” Appl. Sci. 10 (21): 7648. https://doi.org/10.3390/app10217648.
El-Deeb, K., A. Sherif, and A. El-Zafarany. 2024. “Effect of courtyard height and proportions on energy performance of multi-storey air-conditioned desert buildings.” In Proc., 30th Int. Plea Conf. Ahmedabad, India: CEPT University.
Elkhapery, B., P. Kianmehr, and R. Doczy. 2023. “Tradeoff between well-being of students and cost of greening schools in arid regions.” Manage. Environ. Qual. Int. J. 34 (3): 794–819. https://doi.org/10.1108/MEQ-09-2022-0249.
Elmasry, S. K., and M. A. Haggag. 2011. “Whole-building design for a green school building in Al-Ain, United Arab Emirates.” WIT Trans. Ecol. Environ. 150: 165–176. https://doi.org/10.2495/SDP110151.
EL-Nwsany, R. I., I. Maarouf, and W. Abd el-Aal. 2019. “Water management as a vital factor for a sustainable school.” Alexandria Eng. J. 58 (1): 303–313. https://doi.org/10.1016/j.aej.2018.12.012.
Emirates GBC (Emirates Green Building Council). 2023. “Bea fact sheets school final.” Accessed December 28, 2023. https://emiratesgbc.org/wp-content/uploads/2020/06/BEA-Fact-Sheets-School-Final.pdf.
Eveloy, V., and Y. Alkendi. 2021. “Thermodynamic performance investigation of a small-scale solar compression-assisted multi-ejector indoor air conditioning system for hot climate conditions.” Energies 14 (14): 4325. https://doi.org/10.3390/en14144325.
Feroz, S. M. 2015. “Achieving thermal comfort by applying passive cooling strategies to courtyard houses in Dubai (UAE).” Masters thesis, Faculty of Engineering, British University in Dubai (BUiD).
Forouzandeh, A. 2018. “Numerical modeling validation for the microclimate thermal condition of semi-closed courtyard spaces between buildings.” Sustainable Cities Soc. 36: 327–345. https://doi.org/10.1016/j.scs.2017.07.025.
Ghaffarianhoseini, A., U. Berardi, and A. Ghaffarianhoseini. 2015. “Thermal performance characteristics of unshaded courtyards in hot and humid climates.” Build. Environ. 87: 154–168. https://doi.org/10.1016/j.buildenv.2015.02.001.
Gil-Baez, M., Á. B. Padura, and M. M. Huelva. 2019. “Passive actions in the building envelope to enhance sustainability of schools in a Mediterranean climate.” Energy 167 (C): 144–158. https://doi.org/10.1016/j.energy.2018.10.094.
Hammad, F., and B. Abu-Hijleh. 2010. “The energy savings potential of using dynamic external louvers in an office building.” Energy Build. 42 (10): 1888–1895. https://doi.org/10.1016/j.enbuild.2010.05.024.
Harputlugil, G. U., J. Hensen, and G. Celebi. 2011. “A prospect to develop thermally robust outline design and to explore its applicability to the different climate necessities of Turkey.” Int. J. Low-Carbon Technol. 6 (1): 76–85. https://doi.org/10.1093/ijlct/ctq050.
Heracleous, C., and A. Michael. 2017. “Climate change and thermal comfort in educational buildings of Southern Europe: The case of Cyprus.” In Proc., 10th Int. Conf. on Sustainable Energy & Environmental Protection. London, UK: Social Education and Environment Protection (SEEP).
Heracleous, C., A. Michael, A. Savvides, and C. Hayles. 2021. “Climate change resilience of school premises in Cyprus: An examination of retrofit approaches and their implications on thermal and energy performance.” J. Build. Eng. 44: 103358. https://doi.org/10.1016/j.jobe.2021.103358.
Hernandez, P., K. Burke, and J. O. Lewis. 2008. “Development of energy performance benchmarks and building energy ratings for non-domestic buildings: An example for Irish primary schools.” Energy Build. 40 (3): 249–254. https://doi.org/10.1016/j.enbuild.2007.02.020.
Hong, T., C. Koo, and K. Jeong. 2012. “A decision support model for reducing electric energy consumption in elementary school facilities.” Appl. Energy 95: 253–266. https://doi.org/10.1016/j.apenergy.2012.02.052.
Höppe, P. 1999. “The physiological equivalent temperature–a universal index for the biometeorological assessment of the thermal environment.” Int. J. Biometeorol. 43 (2): 71–75. https://doi.org/10.1007/s004840050118.
Huttner, S. 2012. Further development and application of the 3D microclimate simulation ENVI-met. Mainz, Germany: Johannes Gutenberg-Universitat.
Hyun Kim, J., G. Augenbroe, and H. S. Suh. 2013. “Comparative study of the LEED and ISO-CEN building energy performance rating methods.” In Vol. 13 Proc., 13th Conf., of Int. Building Performance Association, 3104–3111. Rapid City, SD: International Building Performance Simulation Association (IBPSA).
Iesve.com. 2018. “About IES.” Accessed March 16, 2018. https://www.iesve.com/about.
Jamaludin, A. A., H. Hussein, A. R. Mohd Ariffin, and N. Keumala. 2014. “A study on different natural ventilation approaches at a residential college building with the internal courtyard arrangement.” Energy Build. 72: 340–352. https://doi.org/10.1016/j.enbuild.2013.12.050.
Jesse. 2023. “UAE school, edarabia.com.” Accessed December 29, 2023. https://www.edarabia.com/school-holidays-uae/#:∼:text=UAE%20School%20Holidays%20(2024)&text=The%20United%20Arab%20Emirates%20(UAE,793%2C295%20students%20(private%20schools).
Khalfan, M., and S. Sharples. 2016. “Thermal comfort analysis for the first Passivhaus project in QATAR.” In Proc., of SBE16 Dubai. Qatar, Dubai: The British University.
Koch-Nielsen, H. 2002. Stay cool: A design guide for the built environment in hot climates. London: Earthscan.
Kolozali, R., and T. Kolozali. 2016. “The role of the courtyard in the establishment of architecture in Cyprus.” Archit. Res. 6 (5): 123–130.
Košir, M., and L. Pajek. 2017. “Bcchart v2. 0-A tool for bioclimatic potential evaluation.” In Proc., of SWC2017/SHC2017. Freiburg, Germany: International Solar Energy Society.
Kujundzic, K., S. Stamatovic Vuckovic, and A. Radivojević. 2023. “Toward regenerative sustainability: A passive design comfort assessment method of indoor environment.” Sustainability 15 (1): 840. https://doi.org/10.3390/su15010840.
Lee, H., H. Mayer, and L. Chen. 2016. “Contribution of trees and grasslands to the mitigation of human heat stress in a residential district of Freiburg, Southwest Germany.” Landscape Urban Plann. 148: 37–50. https://doi.org/10.1016/j.landurbplan.2015.12.004.
Lim, T., W.-S. Yim, and D.-D. Kim. 2022. “Analysis of the thermal and cooling energy performance of the perimeter zones in an office building.” Buildings 12 (2): 141. https://doi.org/10.3390/buildings12020141.
Lin, T.P., and A. Matzarakis. 2008. “Tourism climate and thermal comfort in Sun Moon Lake, Taiwan.” Int. J. Biometeorol. 52: 281–290. https://doi.org/10.1016/j.egypro.2015.11.250.
Manioğlu, G., and G. K. Oral. 2015. “Effect of courtyard shape factor on heating and cooling energy loads in hot-dry climatic zone.” Energy Procedia 78: 2100–2105. https://doi.org/10.1016/j.egypro.2015.11.250.
Markus, B. 2016. “A review on courtyard design criteria in different climatic zones.” Afr. Res. Rev. 10 (5): 181. https://doi.org/10.4314/afrrev.v10i5.13.
Markus, B., H. Malsiah, Y. W. Lim, and B. L. Tanko. 2017. “Examination of courtyard dimensions and proportions in Universiti Teknologi Malaysia buildings.” Int. J. Real State Stud. 11 (2): 1–5.
Martinelli, L., and A. Matzarakis. 2017. “Influence of height/width proportions on the thermal comfort of courtyard typology for Italian climate zones.” Sustainable Cities Soc. 29: 97–106. https://doi.org/10.1016/j.scs.2016.12.004.
Matsuoka, R. H., and R. Kaplan. 2008. “People needs in the urban landscape: Analysis of landscape and urban planning contributions.” Landscape Urban Plann. 84 (1): 7–19. https://doi.org/10.1016/j.landurbplan.2007.09.009.
Matzarakis, A. 2008. “Physiological equivalent temperature as indicator for impacts of climate change on thermal comfort of humans.” In Seasonal forecasts, climatic change and human health, edited by M. C. Thomson, R. Garcia-Herrera, and M. Beniston, 161–172. Dordrecht, Netherlands: Springer.
Mouada, N., N. Zemmouri, and R. Meziani. 2019. “Walking behavior and outdoor thermal comfort: Case Study–Abu Dhabi.” In Vol. 2 of Proc., of the Int. Conf., of Contemporary Affairs in Architecture and Urbanism, 72–84. Antalya, Türkiye: Alanya University.
MSDE (Maryland State Dep. of Education). 2012. A practical guide to planning, constructing, and using school courtyards. Baltimore: MSDE Division of Instruction.
Muhaisen, A. S, and M. B. Gadi. 2005. “Mathematical model for calculating the shaded and sunlit areas in a circular courtyard geometry.” Build. Environ. 40 (12): 1619–1625. https://doi.org/10.1016/j.buildenv.2004.12.018.
Muhaisen, A. S., and M. B. Gadi. 2006. “Shading performance of polygonal courtyard forms.” Build. Environ. 41 (8): 1050–1059. https://doi.org/10.1016/j.buildenv.2005.04.027.
Ok, V., E. Yasa, and M. Özgunler. 2008. “An experimental study of the effects of surface openings on air flow caused by wind in courtyard buildings.” Archit. Sci. Rev. 51 (3): 263–268. https://doi.org/10.3763/asre.2008.5131.
Pass, B., and C. Schneider. 2016. “A comparison of model performance between ENVI-met and Austal2000 for particulate matter.” Atmos. Environ. 145: 392–404. https://doi.org/10.1016/j.atmosenv.2016.09.031.
Rahmani, M., K. A. Al-Sallal, O. Alkhatib, and M. Khoukhi. 2023. “Potential of form-pocketed design in mitigating heat in a university educational glazed-curtained building in the desert climate of UAE.” Energy Build. 297: 113424. https://doi.org/10.1016/j.enbuild.2023.113424.
Rajapaksha, I., H. Nagai, and M. Okumiya. 2003. “A ventilated courtyard as a passive cooling strategy in the warm humid tropics.” Renewable Energy 28 (11): 1755–1778. https://doi.org/10.1016/S0960-1481(03)00012-0.
Ramli, N. H., M. H. Masri, M. Zafrullah, H. M. Taib, and N. Abd Hamid. 2012. “A comparative study of green school guidelines.” Procedia Social Behav. Sci. 50: 462–471. https://doi.org/10.1016/j.sbspro.2012.08.050.
Reynolds, J. 2002. Courtyards. New York: Wiley.
Rojas-Fernandez, J., C. Galán-Marín, J. Roa-Fernández, and C. Rivera-Gómez. 2017. “Correlations between GIS-based urban building densification analysis and climate guidelines for Mediterranean courtyards.” Sustainability 9 (12): 2255. https://doi.org/10.3390/su9122255.
Saeed, T. A. 2007. “Studies on the geometrical properties of courtyard house form considering natural ventilation in hot-dry regions”. Chicago, IL: Illinois Institute of Technology.
Salameh, M., B. Abu-Hijleh, and B. Touqan. 2024. “Impact of courtyard orientation on thermal performance of school buildings” temperature.” Urban Clim. 54: 101853. https://doi.org/10.1016/j.uclim.2024.101853.
Salameh, M., E. Mushtaha, and A. El Khazindar. 2023a. “Improvement of thermal performance and predicted mean vote in city districts: A case in the United Arab Emirates.” Ain Shams Eng. J. 14 (7): 101999. https://doi.org/10.1016/j.asej.2022.101999.
Salameh, M., and H. Taleb. 2017. “Courtyard as passive design solution for school buildings in hot area.” In Proc., 2nd World Congress on Civil, Structural, and Environmental Engineering. Orléans, ON: AVESTIA Publication.
Salameh, M., and B. Touqan. 2023a. “Courtyard’ design as a sustainable tool for classrooms’ lighting and thermal performance.” In Proc., 6th Int. Conf. on Architecture and Civil Engineering, Advances in Civil Engineering Materials, edited by E. M. Nia, L. Ling, M. Awang, and S. S. Emamian, 355–366. Singapore: Springer.
Salameh, M., and B. Touqan. 2022. “Traditional passive design solutions as a key factor for sustainable modern urban designs in the hot, arid climate of the United Arab Emirates.” Buildings 12 (11): 1811. https://doi.org/10.3390/buildings12111811.
Salameh, M., and B. Touqan. 2023b. “From heritage to sustainability: The future of the past in the hot arid climate of the UAE.” Buildings 13 (2): 418. https://doi.org/10.3390/buildings13020418.
Salameh, M. M., B. A. Touqan, J. Awad, and M. M. Salameh. 2022. “Heritage conservation as a bridge to sustainability assessing thermal performance and the preservation of identity through heritage conservation in the Mediterranean city of Nablus.” Ain Shams Eng. J. 13 (2): 101553. https://doi.org/10.1016/j.asej.2021.07.007.
Salameh, M., B. Touqan, and A. Suliman. 2023b. “Enhancing student satisfaction and academic performance through school courtyard design: A quantitative analysis.” Archit. Eng. Des. Manage. https://doi.org/10.1080/17452007.2023.2295344.
Salata, F., I. Golasi, R. de Lieto Vollaro, and A. de Lieto Vollaro. 2016. “Urban microclimate and outdoor thermal comfort. A proper procedure to fit ENVI-met simulation outputs to experimental data.” Sustainable Cities Soc. 26: 318–343. https://doi.org/10.1016/j.scs.2016.07.005.
Salata, F., I. Golasi, D. Petitti, E. de Lieto Vollaro, M. Coppi, and A. de Lieto Vollaro. 2017. “Relating microclimate, human thermal comfort and health during heat waves: An analysis of heat island mitigation strategies through a case study in an urban outdoor environment.” Sustainable Cities Soc. 30: 79–96. https://doi.org/10.1016/j.scs.2017.01.006.
Sharmin, T., and K. Steemers. 2015. “Exploring the effect of micro-climate data on building energy performance analysis.” In Proc., 7th Int. Conf. on Sustainable Development in Building and Environment (SuDBE 2015). Chongqing, China: National Centre for International Research of Low-Carbon Green Buildings, Chongqing University.
Soflaei, F., M. Shokouhian, and S. M. Mofidi Shemirani. 2016a. “Traditional Iranian courtyards as microclimate modifiers by considering orientation, dimensions, and proportions.” Front. Archit. Res. 5 (2): 225–238. https://doi.org/10.1016/j.foar.2016.02.002.
Soflaei, F., M. Shokouhian, and S. M. Mofidi Shemirani. 2016b. “Investigation of Iranian traditional courtyard as passive cooling strategy (a field study on BS climate).” Int. J. Sustainable Built Environ. 5 (1): 99–113. https://doi.org/10.1016/j.ijsbe.2015.12.001.
Soltanzadeh, S. 2011. “The role of geography on formation courtyards in traditional houses in IRAN.” Geogr. Res. Q. 42 (75): 69–86.
Sthapak, S., and A. Bandyopadhyay. 2014. “Courtyard houses: An overview.” Recent Res. Sci. Technol. 6 (1): 70–73.
Sun, Q., Z. Luo, and L. Bai. 2023. “The impact of internal courtyard configuration on thermal performance of long strip houses.” Buildings 13 (2): 371. https://doi.org/10.3390/buildings13020371.
Tabesh, T., and B. Sertyesilisik. 2016. “An investigation into energy performance with the integrated usage of a courtyard and atrium.” Buildings 6 (2): 21. https://doi.org/10.3390/buildings6020021.
Tablada, A. 2013. “Design recommendations for new courtyard buildings in compact historical Centre of Havana.” In Proc., Sustainable Building -Hong Kong Regional Conf. Urban Density & Sustainability. Hong Kong: Hong Kong Green Building Council.
Tablada, A., B. Blocken, J. Carmeliet, F. De Troyer, and H. Verschure. 2005. “The influence of courtyard geometry on airflow and thermal comfort: CFD and thermal comfort simulations.” In Vol. 1 of Proc., 22nd Conf., on Passive and Low Energy Architecture, 75–80. Beirut, Lebanon: PLEA. https://www.plea-arch.org/conferences/
Taleghani, M., M. Tenpierik, and A. van den Dobbelsteen. 2014a. “Energy performance and thermal comfort of courtyard/atrium dwellings in The Netherlands in the light of climate change.” Renewable Energy 63: 486–497. https://doi.org/10.1016/j.renene.2013.09.028.
Taleghani, M., M. Tenpierik, A. van den Dobbelsteen, and D. J. Sailor. 2014b. “Heat in courtyards: A validated and calibrated parametric study of heat mitigation strategies for urban courtyards in The Netherlands.” Sol. Energy 103: 108–124. https://doi.org/10.1016/j.solener.2014.01.033.
TERI. 2004. Sustainable building. Dublin, Ireland: ENFO.
van Hoof, J., M. Mazej, and J. L. M. Hensen. 2010. “Thermal comfort: Research and practice.” Front. Biosci. 15: 765–788. https://doi.org/10.2741/3645.
Yasa, E., and V. Ok. 2014. “Evaluation of the effects of courtyard building shapes on solar heat gains and energy efficiency according to different climatic regions.” Energy Build. 73: 192–199.
Yousef Mousa, W. A., W. Lang, and T. Auer. 2017. “Numerical assessment of the efficiency of fenestration system and natural ventilation mechanisms in a courtyard house in hot climate.” Build. Simul. 10 (5): 737–754. https://doi.org/10.1007/s12273-017-0357-0.
Zakaria, M. A., and T. Kubota. 2014. “Environmental design consideration for courtyards in residential buildings in hot-humid climates: A review.” Int. J. Built Environ. Sustainability 1 (1): 45–51. https://doi.org/10.11113/ijbes.v1.n1.7.
Zhang, A., R. Bokel, A. van den Dobbelsteen, Y. Sun, Q. Huang, and Q. Zhang. 2017. “The effect of geometry parameters on energy and thermal performance of school buildings in cold climates of China.” Sustainability 9 (10): 1708. https://doi.org/10.3390/su9101708.
Zomorodian, Z. S., and F. Nasrollahi. 2013. “Architectural design optimization of school buildings for reduction of energy demand in hot and dry climates of Iran.” Int. J. Archit. Eng. Urban Plan 23 (1): 41–50.
Information & Authors
Information
Published In

Journal of Architectural Engineering
Volume 30 • Issue 4 • December 2024
Copyright
This work is made available under the terms of the Creative Commons Attribution 4.0 International license, https://creativecommons.org/licenses/by/4.0/.
History
Received: Jan 4, 2024
Accepted: May 29, 2024
Published online: Sep 9, 2024
Published in print: Dec 1, 2024
Discussion open until: Feb 9, 2025
Authors
Metrics & Citations
Metrics
Citations
Download citation
If you have the appropriate software installed, you can download article citation data to the citation manager of your choice. Simply select your manager software from the list below and click Download.