Influence and Mechanism of Coflow Jet Airfoil Parameters in Subsonic Flow
Publication: Journal of Aerospace Engineering
Volume 38, Issue 1
Abstract
Many studies have focused on the application and mechanism of coflow jet (CFJ) flow control technique in incompressible flow. However, the influence of CFJ parameters in subsonic flow is still uncertain. Five major CFJ airfoil parameters are investigated for their influence and mechanism on lift enhancement, flow separation control, and aerodynamic efficiency at Mach numbers 0.3 and 0.5 in this study. Two optimized CFJ airfoils are then designed to achieve better overall performance, and are compared with a baseline CFJ airfoil. An improved computational model using an actuator disk boundary is applied to simplify the iteration process in numerical simulation. The results show that the interaction between the jet flow and supersonic region on the upper surface is the prominent factor for CFJ airfoils in subsonic flow, and the proper injection location should be downstream of the normal shock wave to prevent interaction, increase maximum lift, and delay stall. Moderate injection orifice size and proper jet momentum coefficient are recommended to balance the energy consumption and aerodynamic performance at high angles of attack. A control strategy that varies the jet momentum coefficient for different angles may achieve high aerodynamic efficiency as much as possible. A relatively front suction location can suppress flow separation more efficiently, and larger suction orifice is better for reducing energy consumption. The optimized CFJ airfoils have much better overall performance than the baseline CFJ airfoil. The enhancement of maximum lift increases to more than 30% and the stall is delayed by 3° with high jet momentum coefficient. The energy consumption is largely reduced, and the maximum corrected lift-to-drag ratio increases by 61% and 28% at Mach numbers 0.3 and 0.5, respectively. Also, the optimized CFJ airfoils can provide higher lift than the baseline airfoil with the same aerodynamic efficiency.
Introduction
Improvement of aircraft performance always results from better aerodynamic characteristics. Flow separation control, lift enhancement, and drag reduction are the primary purposes to improve aerodynamic design for aircraft, especially for commercial aviation airliners and transporters. According to research from Meredith (1993), a 1.0% increase in the maximum lift of a transport aircraft results in an additional payload of 4,400 lbs for a fixed approach speed upon landing. Furthermore, new demands for short takeoff/landing (STOL) require high lift at high angles of attack (AoAs) and efficient flow separation control (Morgenstern et al. 2010). Traditional aerodynamic design methods improve performance by optimizing geometric parameters of airfoils and wings, but not all configurations can be considered due to the constraint of parameterization method, resulting in a limit on performance improvement under a certain flow field. However, flow control technology can create advantageous flow fields and significantly improve aerodynamic performance, which has played important roles over the past few decades.
Many passive flow control techniques, such as winglets (Whitcomb 1976), Gurney flaps (Liebeck 1978), and vertex generators (Bragg and Gregorek 1987) have been widely used in aviation aircraft. In recent years, active flow control techniques have drawn more attention due to the development of computational fluid dynamics (CFD), materials, controls, and wind tunnel test technology. Researchers have studied various active flow control methods to achieve flow separation control, lift enhancement, and drag reduction, such as synthetic jets (Smith and Glezer 1998; Monastero et al. 2019; Wang and Feng 2020), plasma actuators (Patel et al. 2007; Little et al. 2012; Sun et al. 2022), and circulation controls (Friedman et al. 2016; Kanistras et al. 2018). A novel active flow control method named coflow jet (CFJ) has been proposed and developed by Zha and Paxton (2004), which has shown significant improvements on the aerodynamic performance of airfoils and wings. The CFJ technique places an injection orifice near the leading edge and a suction orifice near the trailing edge on the upper surface, which are connected by a duct inside the airfoil. A certain amount of mass flow is sucked in through the suction orifice utilizing a fan or pump, and then injected into the main flow through the injection orifice. The energy is transferred from the jet flow to the main flow, allowing it to overcome adverse pressure gradients and remain attached even at high AoAs. In addition, CFJ can also achieve significant lift enhancement and drag reduction at nearly all AoAs. During the entire process, no mass flow is added to the system, making it a zero net mass flux flow control.
Many researchers have focused on improving the aerodynamic performance of CFJ airfoils since its proposal. Zha initially investigated the CFJ airfoil modified from National Advisory Committee for Aeronautics (NACA) 2415 and NACA 0025 using numerical methods (Zha and Paxton 2004; Zha et al. 2006). A wind tunnel test of NACA 0025 and the corresponding CFJ airfoil were carried out (Zha et al. 2007), which validated the ability of CFJ to enhance lift, reduce drag, and increase stall AoA. Dano et al. (2010) preliminarily analyzed the flow mechanism of CFJ through a wind tunnel test at a velocity of . Lefebvre and Zha (2014b, c) conducted a parametric study of CFJ airfoils based on NACA 23121 through numerical methods and systematically denoted the trend of performance improvement at Mach number 0.15 when geometric parameters and Reynolds number changed. The performance of CFJ airfoils based on NACA 6415 at a Mach number range of 0.03 to 0.4 was also preliminarily studied by Lefebvre et al. (2016), and the results showed that the airfoil suffered stall at Mach number 0.4 due to the appearance of a strong shock wave. Wang and Zha (2019) extended the range of Mach number and mainly analyzed the performance of CFJ airfoils at cruise conditions. Liu and Zha (2016) investigated the application of CFJ on supercritical airfoils and proved that CFJ can improve the lift-to-drag ratio of supercritical airfoils at cruise condition. Xu et al. (2019) numerically investigated drag minimization techniques of the CFJ control surface when it is not activated at cruise condition. Dhakal et al. (2017) studied the influence of CFJ on supercritical airfoils at takeoff/landing conditions and concluded that CFJ is beneficial to STOL. Xu and Zha (2020) applied CFJ to a wind turbine airfoil and proved a significantly positive effect on improving aerodynamic performance. Zhang et al. (2021a, b, c) investigated the influence of two parameters on CFJ wind turbine airfoil and conducted wind tunnel tests of CFJ and discrete CFJ using a built-in fan. Vigneswaran and VishnuKumar (2023) explored the effect of the jet velocity, injection height, and mass flow rate on the aerodynamic performance. Jiang et al. (2022) integrated CFJ into aerodynamic shape optimization to improve the performance of CFJ 6409 airfoil in low-speed flow. Li et al. (2022) developed the CFJ driven by plasma actuator and conducted a wind tunnel test. There are also some studies focused on suppressing dynamic stall using the CFJ technique. Lefebvre and Zha (2014a) investigated the influence of CFJ on SC1095 pitching airfoil, and the results demonstrated that different levels of dynamic stall can be suppressed even at Mach number 0.4. Xu et al. (2016) studied the dynamic characteristics of the S809 airfoil using CFJ and proved the good performance of increasing lift and reducing drag and moment. Liu et al. (2022) also studied the application of CFJ on SC1095 pitching airfoil and increased the Mach number to 0.7 and then analyzed the performance of an improved CFJ on suppressing dynamic stall. Furthermore, some studies investigated the application of CFJ on wing and control surface. Wang and Zha (2020) studied the wing using CFJ and compared its performance at different Mach numbers. Xu and Zha (2021, 2023) applied CFJ on the control surface, and the results showed that the CFJ control surface can achieve high control authority with low energy expenditure. Zhu et al. (2022) combined CFJ with traditional high-lift devices and investigated the influence of three parameters on aerodynamic performance in low-speed takeoff and landing.
In summary, CFJ is an active flow control method with potential that significantly improves the aerodynamic performance of airfoils. Some studies have investigated the influence of CFJ parameters and preliminarily revealed the mechanism of improving aerodynamic characteristics in incompressible flow. However, in subsonic flow, the influence and mechanism of CFJ airfoil parameters are still uncertain, despite that some research have studied the application of the CFJ technique on airfoils at Mach numbers higher than 0.3.
In the present study, the NACA 23012 airfoil is selected as the baseline because it is widely used by many aviation aircraft, including some Cessna business jets. An improved computational model using actuator disk boundary is applied for numerical simulation. Analysis is performed at Mach numbers of 0.3 and 0.5 using numerical methods for five major CFJ parameters, including injection location, injection orifice size, suction location, suction orifice size, and jet momentum coefficient, and the influence mechanism on lift enhancement, flow separation control, energy consumption, and aerodynamic efficiency is revealed for each of the parameters. Finally, two CFJ airfoils with optimized parameters are designed and evaluated in comparison with the baseline CFJ airfoil to validate the conclusion of the parameter study.
Methodology
Improved Computational Model Using Actuator Disk Boundary Condition
In previous studies, the computational model in Fig. 1(a) is adopted to simulate the CFJ airfoil, which achieves injection and suction by adjusting the inlet and outlet boundary conditions. Total pressure and total temperature are set at the inlet boundary to achieve the specified jet momentum coefficient. Static pressure is set at the outlet boundary to generate the same mass flow rate passed through, so as to achieve zero net mass flux. Both boundary conditions are related and iterated during the simulation.
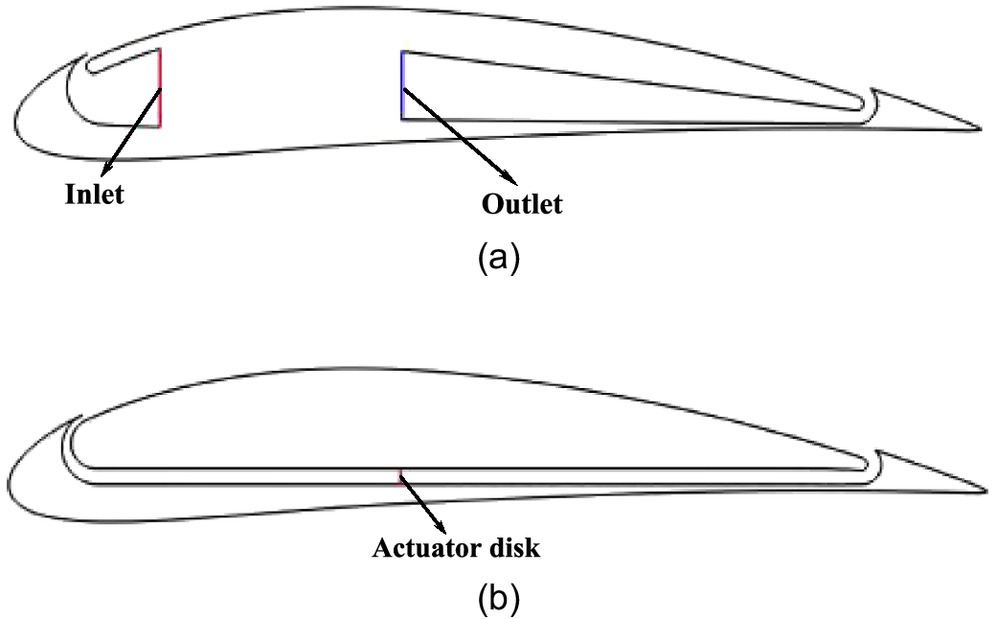
An improved computational model for CFJ airfoil is proposed in the present study, which is shown in Fig. 1(b). The injection and suction orifices are connected by a duct, and an actuator disk (Horlock 1978) boundary is placed in the middle to simulate the effect of fan of the air pump. In this way, any specified jet momentum coefficient can be achieved by adjusting the pressure jump, and the zero net mass flux is satisfied automatically. During the numerical simulation, only one parameter of boundary condition is involved, which simplifies the iteration process.
Numerical Method
The CFD software, FLUENT (ANSYS Inc. 2009), is used to perform the simulation. The density-based solver is applied to solve the two-dimensional Reynolds-averaged Navier-Stokes (RANS) equations. The two-equation shear-stress transport turbulence model is applied to close the governing equations. Compared with other turbulence models, the shear-stress transport model can better handle the transport of turbulent shear stress in the reverse pressure gradient and separated boundary layer, and its precise prediction and reliability allow it to be used in a wide class of flows. The Advection Upstream Splitting Method (AUSM) scheme is used to compute the flux vector. The least squares cell-based scheme is used for gradient discretization, and the second-order upwind scheme is used for discretization of flow term, turbulent kinetic energy term, and specific dissipation rate. The Euler implicit time-marching method is used for temporal discretization. The Message Passing Interface technique and multigrid method are utilized to save the simulation time. The simulation is considered to be converged when residual and monitored aerodynamic coefficients become constant.
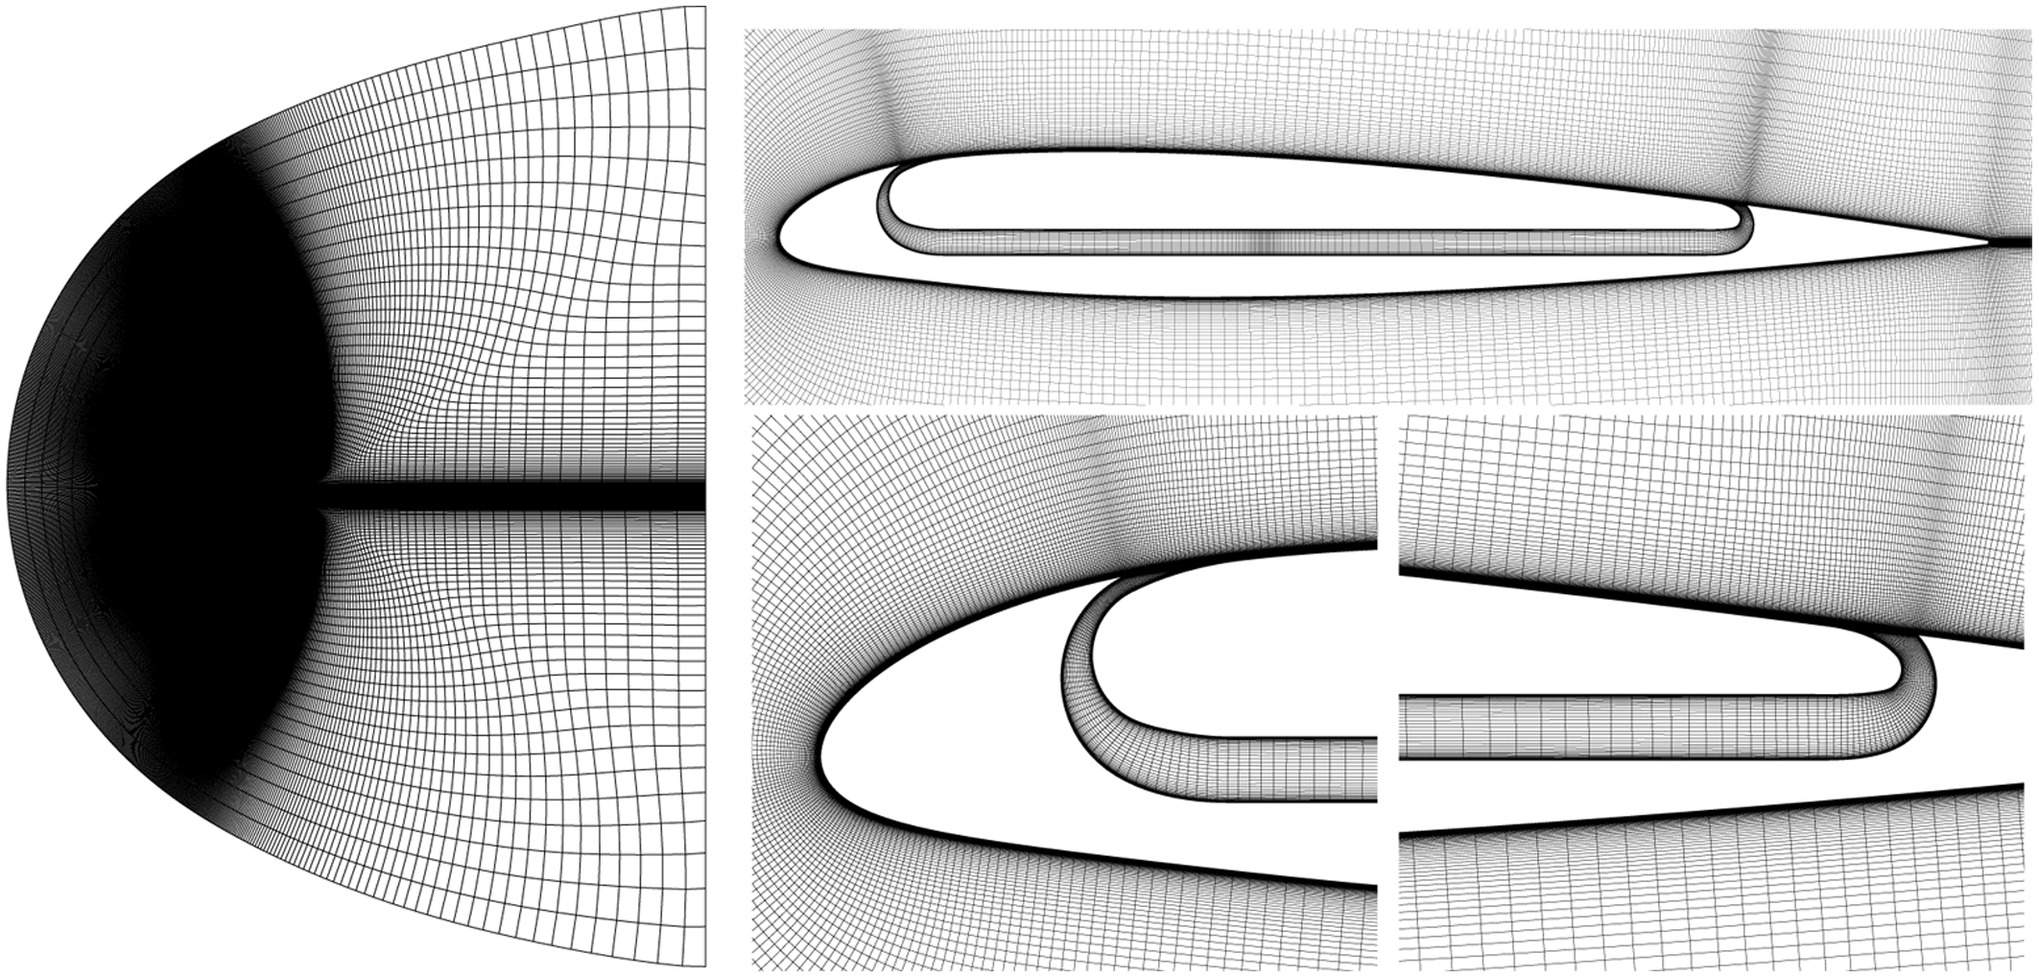
The mesh for the CFJ airfoil in this study is constructed using C-type mesh topology to ensure better mesh orthogonality near the trailing edge and accurate simulation of shear layer in the wake. The far-field boundary is located at 35 times the chord length in the front of leading edge and 50 times the chord length behind the trailing edge. The height of the first mesh cell off the wall boundary is set by a criterion of to meet the resolution requirements of the turbulence model. Fig. 2 shows the schematic of the CFJ airfoil mesh and details around the airfoil.
Static pressure, static temperature, flow velocity, and direction are specified for the far-field boundary conditions. The no-slip wall condition with wall treatment is adopted for airfoil and duct surfaces. The simplified two-dimensional actuator disk boundary is set at a 40% chordwise position, with its normal direction parallel to the chord. The expressions of flow variables before and after the actuator disk boundary are as follows:where , , and = static pressure, density, and velocity near the actuator disk boundary. The subscripts and represent the flow variable before and after the actuator disk boundary, respectively, and = static pressure jump when the flow passes through the actuator disk.
(1)
Definition of CFJ Parameters
Some previous studies have investigated the effects of certain geometric parameters of CFJ airfoil. However, most of them did not consider a comprehensive range of parameters, and some may result in dependence between the parameters. Therefore, a new CFJ airfoil modeling method is proposed in this section that includes multiple key parameters of the CFJ airfoil and guarantees their independence.
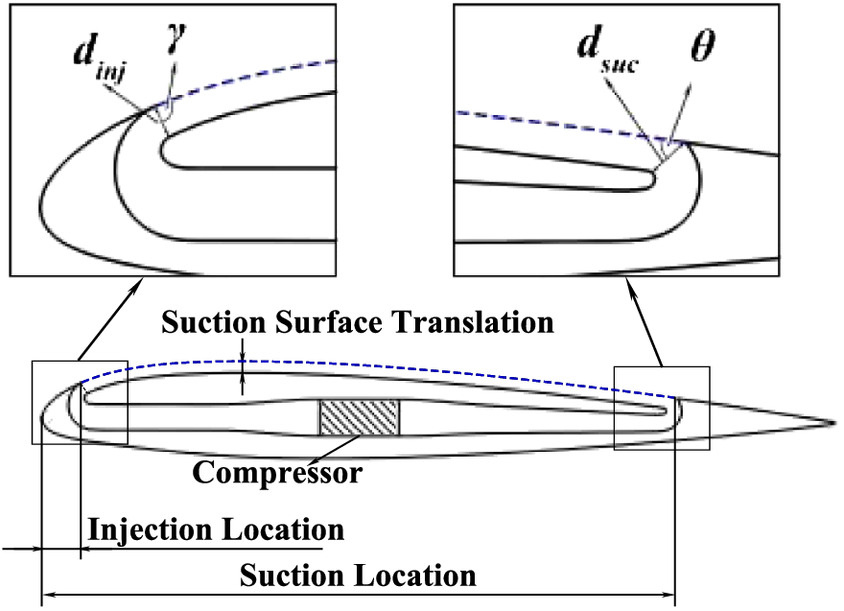
The schematic diagram of the proposed CFJ airfoil modeling method is shown in Fig. 3. Injection and suction orifices are placed near the leading and trailing edge, respectively, and their normal directions are angled with the baseline upper surface of the airfoil by and , respectively, but are vertical to the duct near the orifices. The suction surface between the injection and suction orifices is modified from the baseline airfoil by translating along the direction of thickness, and the distance is defined as the suction surface translation. The portions of the suction surface near the injection and suction orifices are reconstructed with splines to adapt to different designs of the orifices. Therefore, seven geometric parameters can be defined independently in this CFJ airfoil modeling method, including the location, size, and angle of the injection orifice, the location, size, and angle of suction orifice, and the suction surface translation.
The jet intensity of CFJ airfoil is evaluated by the jet momentum coefficient , which is defined as follows:where and = mass flow rate and velocity of jet flow, respectively, and = density and velocity of freestream; and = reference area.
(2)
The power consumed inside the CFJ airfoil and corresponding power coefficient can be defined as (Lefebvre and Zha 2014b)where = total pressure of jet flow; and = total pressure and total temperature of flow through the suction orifice; and = efficiency of pump. In this study, the pump efficiency is taken to be 1.0.
(3)
(4)
The conventional lift-to-drag ratio can be written aswhere and = lift and drag coefficients of the airfoil, respectively.
(5)
To take the power consumed when CFJ working into consideration of aerodynamic performance, the corrected lift-to-drag ratio is defined as
(6)
Numerical Method Validation
Validation of CFD Solver and Mesh Independency
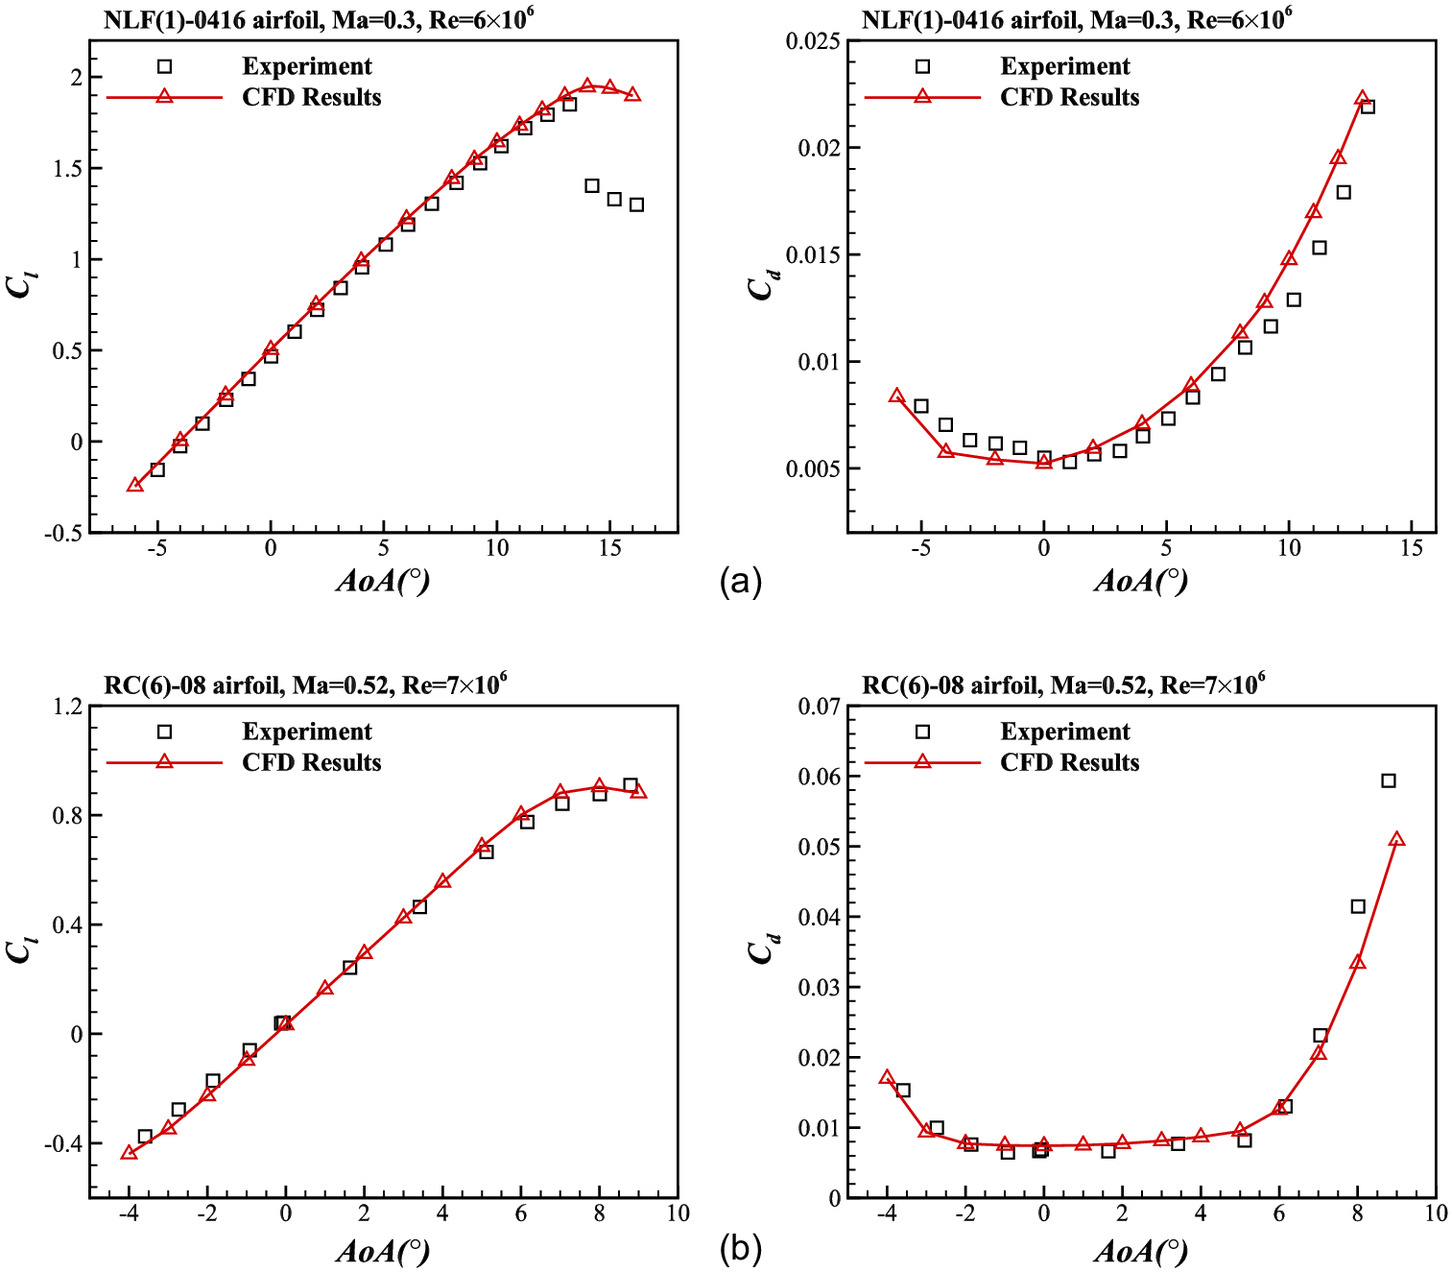
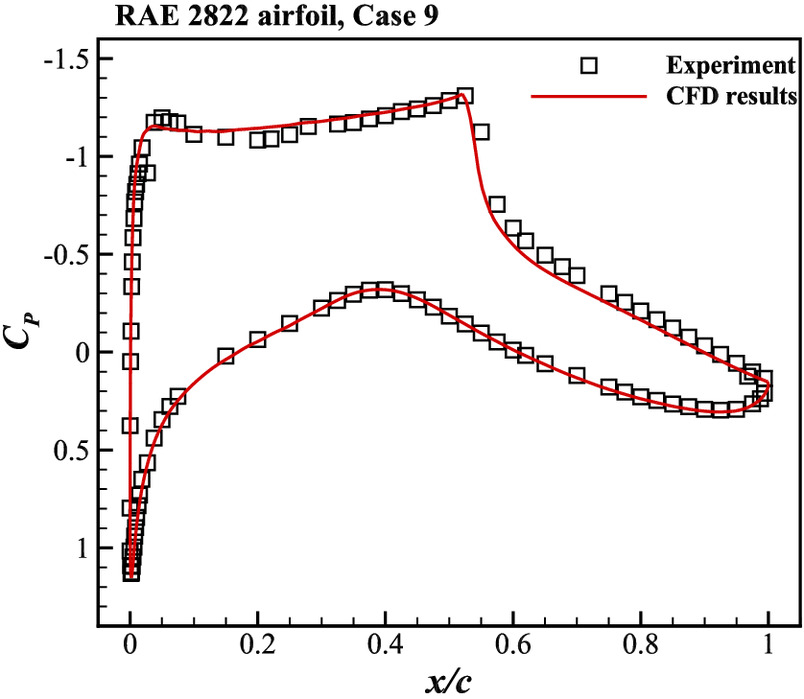
Some examples are presented to validate the accuracy of the numerical method. To cover the range of Mach number from 0.3 to 0.5, the aerodynamic characteristics of NLF(1)-0416 and RC(6)-08 airfoils are obtained and compared with their wind tunnel results (Somers 1981; Noonan 1991). On the other hand, an example of RAE 2822 airfoil is also presented to validate the prediction of shock wave.
A mesh independence study based on RAE 2822 airfoil is first conducted using a C-mesh, and four sets of meshes with different resolutions are tested. Table 1 lists the details of each mesh. Table 2 presents a comparison of aerodynamic coefficients at the condition of Case 9 in the wind tunnel test (McDonald and Firmin 1979). The results indicate that the aerodynamic force coefficients become more stable as the mesh is refined. Considering both accuracy and efficiency, the medium mesh is selected as the most appropriate one.
| Parameters | Coarsest mesh | Coarse mesh | Medium mesh | Fine mesh |
|---|---|---|---|---|
| Wraparound points | 321 | 449 | 561 | 785 |
| Normal layers | 97 | 137 | 161 | 225 |
| Wake points | 89 | 129 | 161 | 225 |
| Total number of cells, | 4.8 | 9.6 | 14.1 | 27.6 |
| Aerodynamic coefficient | Coarsest mesh | Coarse mesh | Medium mesh | Fine mesh |
|---|---|---|---|---|
| 0.78294 | 0.78612 | 0.78645 | 0.78636 | |
| 0.01675 | 0.01689 | 0.01691 | 0.01691 |
Two validation examples based on NLF(1)-0416 and RC(6)-08 airfoils are then conducted at conditions of Mach numbers 0.3 and 0.52, respectively. Fig. 4 presents the comparisons between numerical simulation and experiment. The lift and drag coefficients from the CFD method match well with wind tunnel test results before stall, and the stall prediction is relatively precise. The discrepancy of aerodynamic coefficients after stall could be attributed to the inability of the RANS equations to accurately predict turbulence stress in separated flow. Fig. 5 shows the comparison of pressure distribution between simulation and wind tunnel test of RAE 2822. It is obvious that the simulation result has a good match with the experiment, which validates the prediction accuracy of the shock wave.
Validation of Improved CFJ Airfoil Computational Model
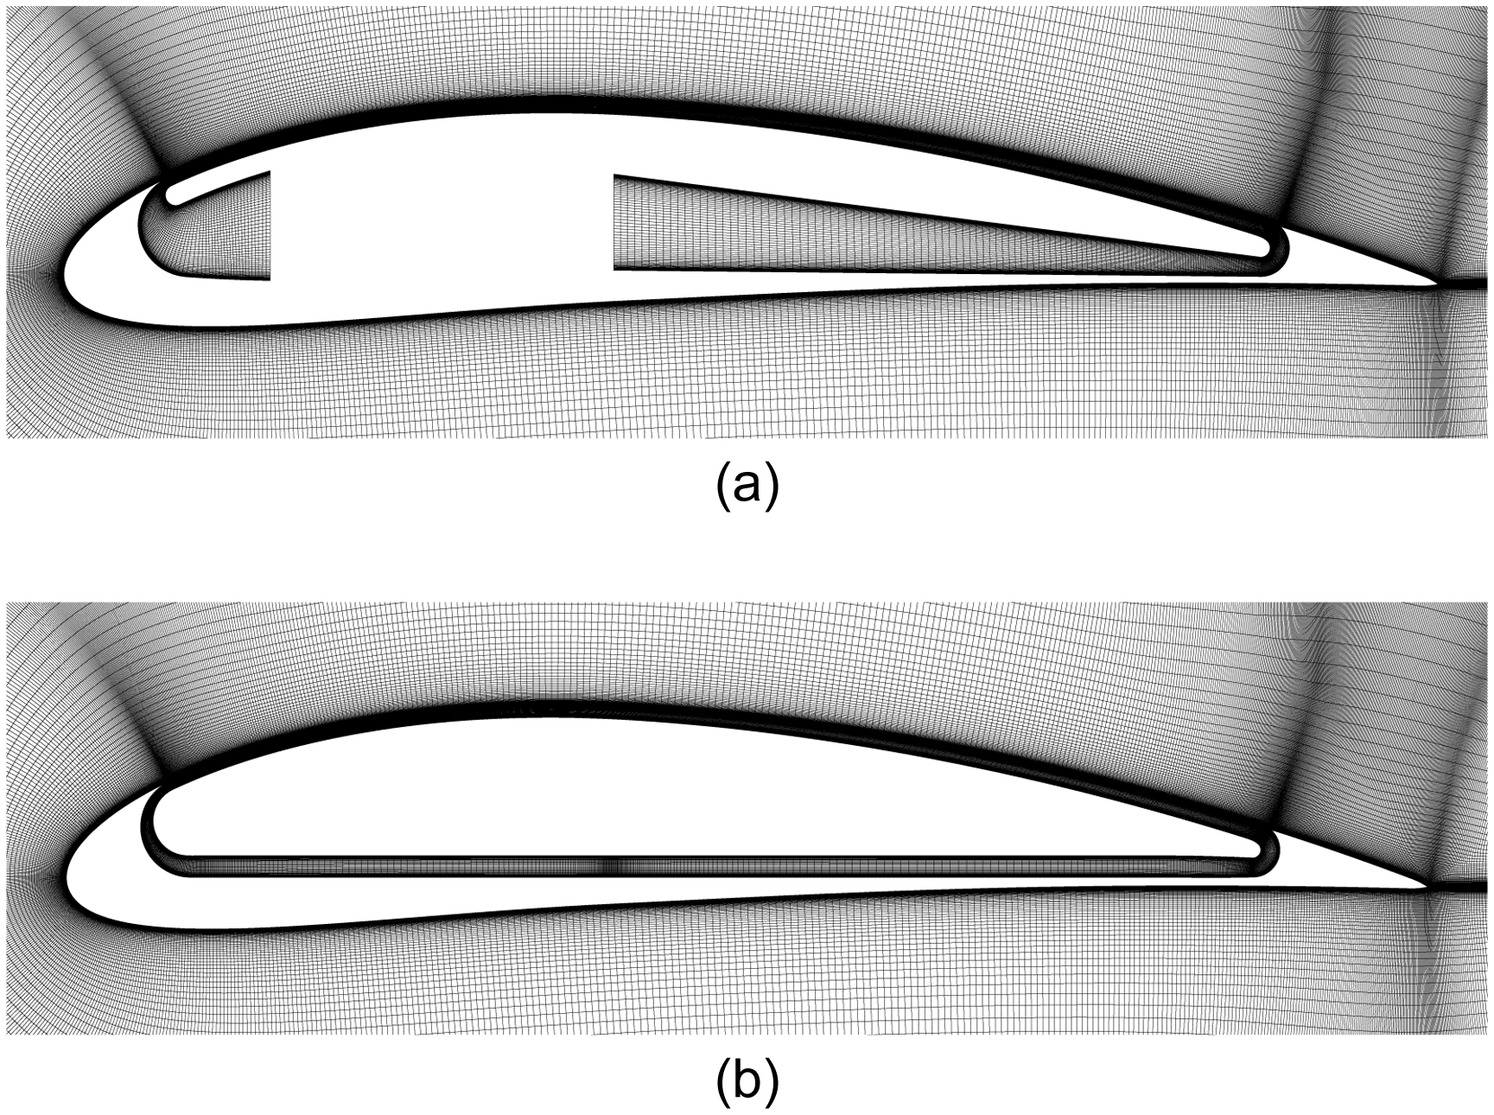
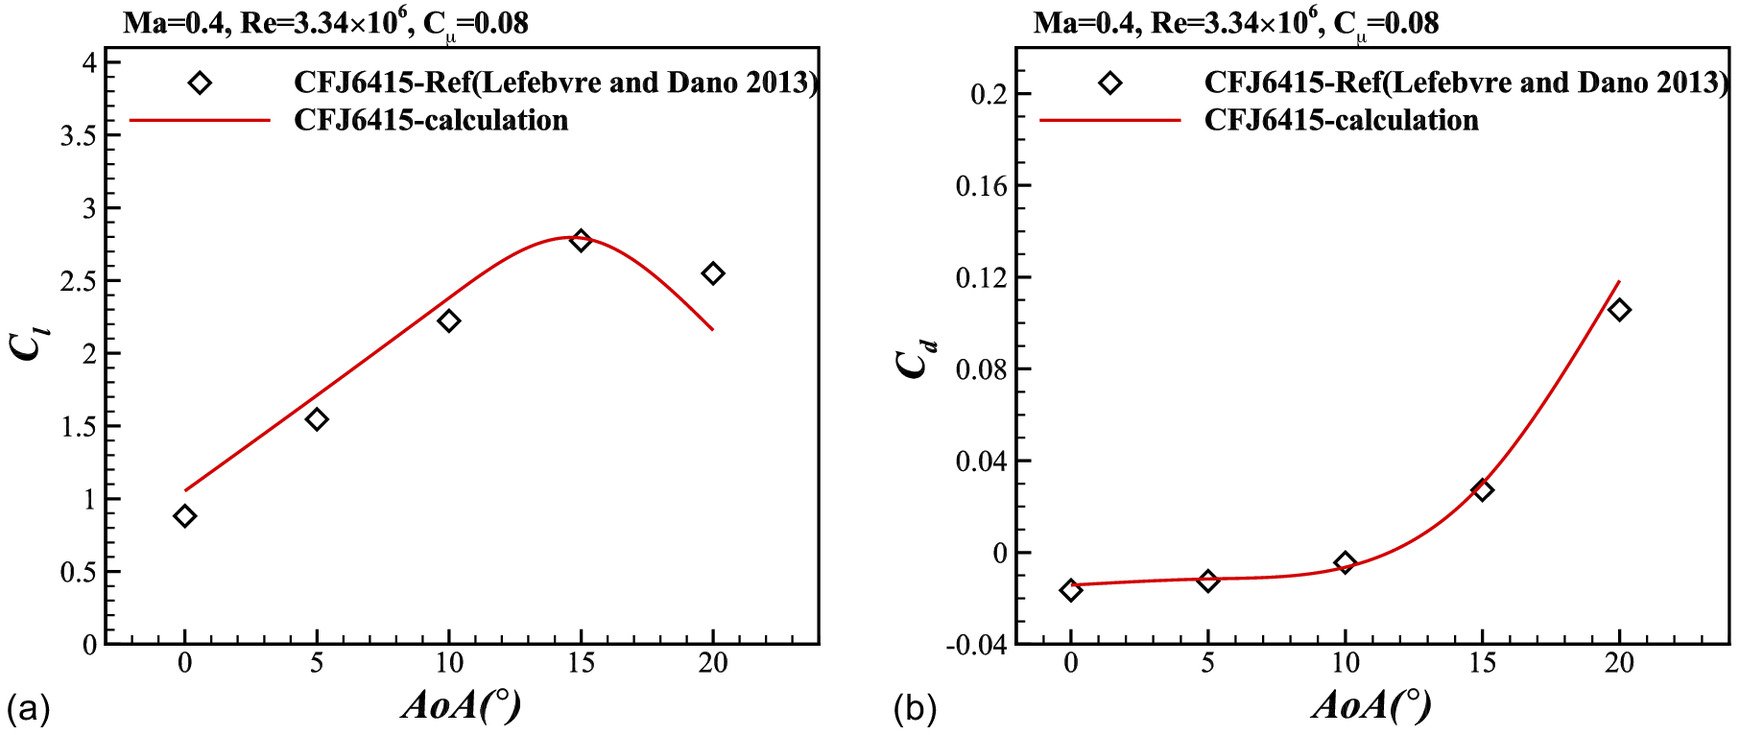
A numerical case of the CFJ 6415 airfoil, which was modified from NACA 6415 by Lefebvre et al. (2013), is simulated to validate the improved computational model using actuator disk boundary. According to the reference, the geometric parameters of the CFJ 6415 airfoil are listed in Table 3, and the simulation conditions are as follow: , . Fig. 6 shows the mesh of the two computational models, while Fig. 7 shows the simulation results of lift and drag coefficients compared with the reference. The results validate the accuracy of the computational model adopted in this paper.
| Geometric parameters | Detail value |
|---|---|
| Injection location | 7.50% chordwise location |
| Injection orifice size | 0.65% chord length |
| Suction location | 88.5% chordwise location |
| Suction orifice size | 1.42% chord length |
Results and Discussion
Comparison between Baseline and CFJ Airfoil in Subsonic Flow
In this section, a comparative study of aerodynamic characteristics between NACA 23012 and its corresponding CFJ airfoil is conducted at Mach numbers of 0.3 and 0.5 and a Reynolds number of . The flow conditions are determined in reference to typical working conditions of a wide range of unmanned aerial vehicles, aviation aircrafts, and business jets with fixed-wings. The CFJ airfoils in this study, which are based on NACA 23012, are collectively referred to as the CFJ 23012 airfoil family. A set of geometric parameters is chosen as a reference and named as the baseline CFJ 23012, with its parameters listed in Table 4.
| Geometric parameters | Detail value |
|---|---|
| Injection location | 10% chordwise location |
| Injection orifice size | 0.6% chord length |
| Injection normal direction angle | 75° |
| Suction location | 80% chordwise location |
| Suction orifice size | 1.0% chord length |
| Suction normal direction angle | 50° |
| Suction surface translation | 0.1% chord length |
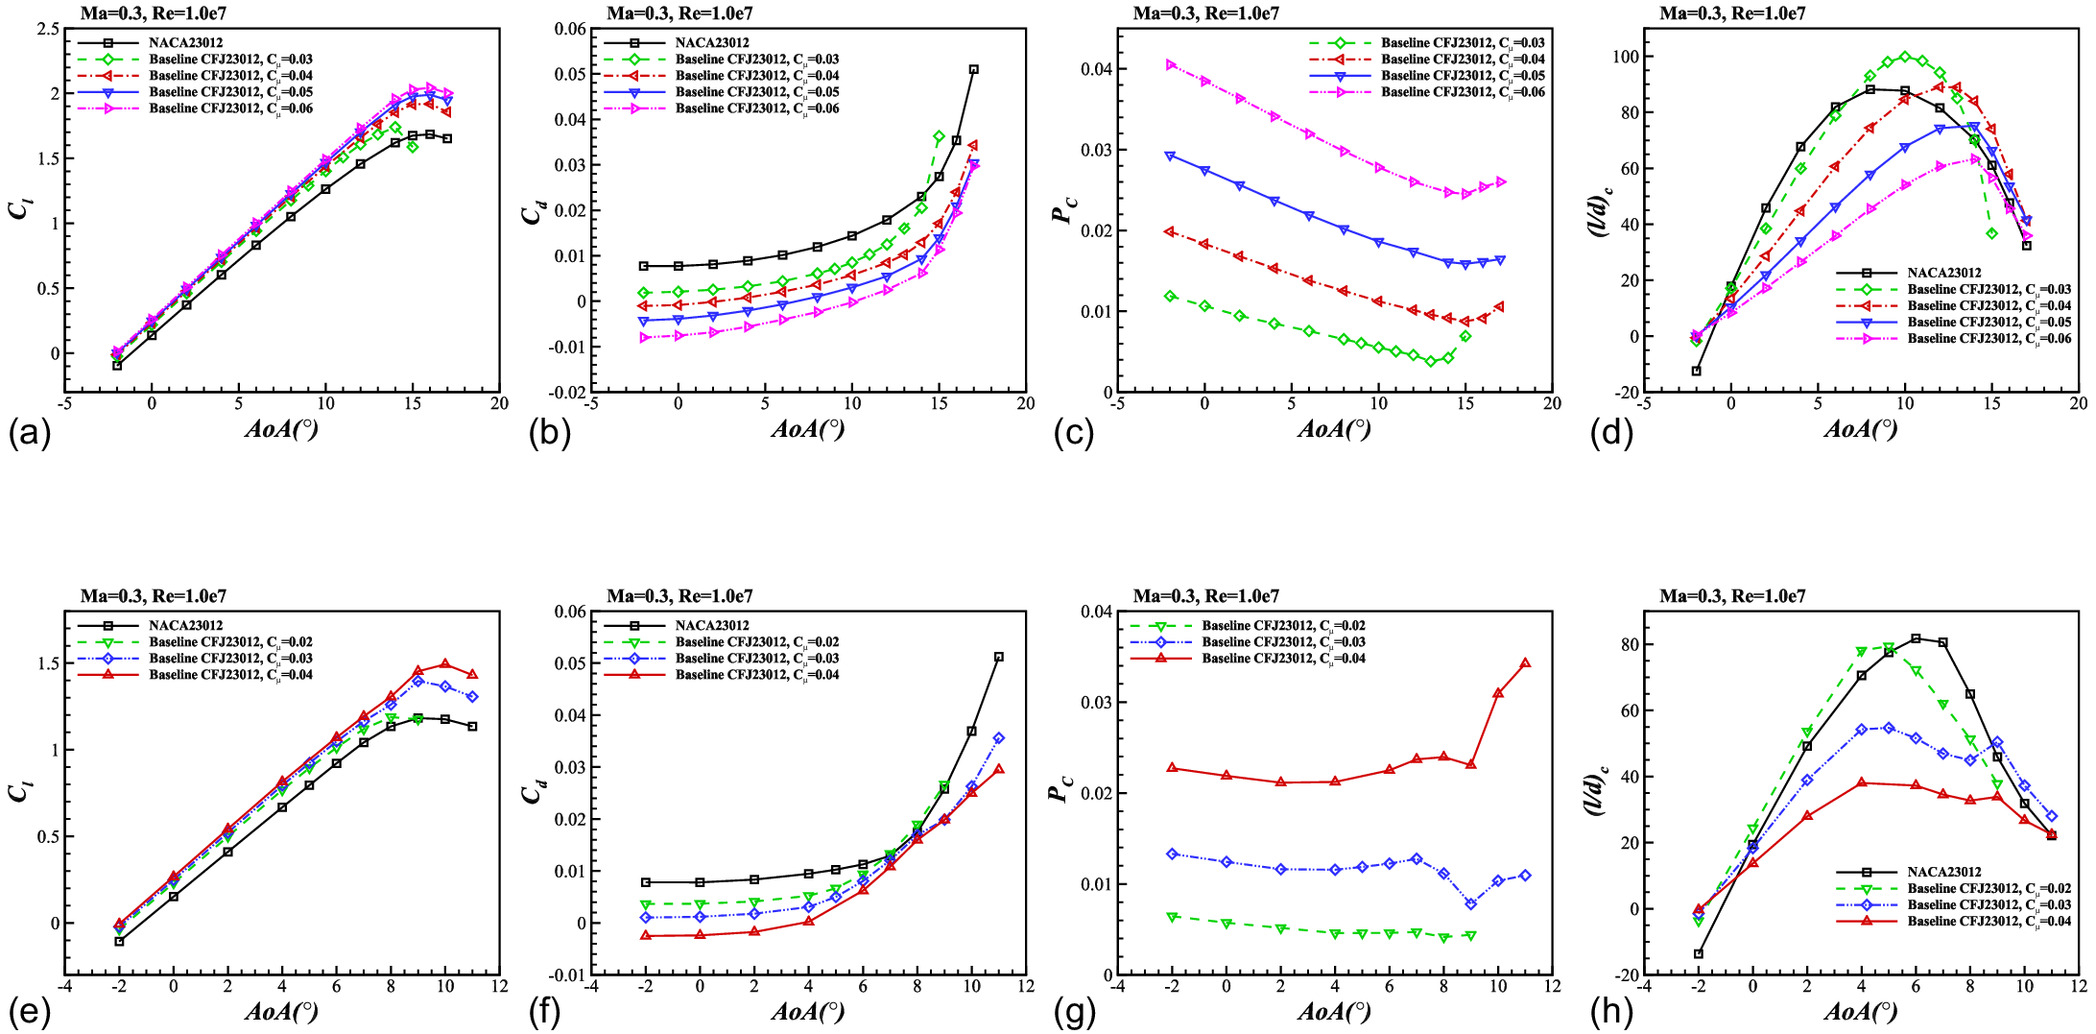
Fig. 8 illustrates a comparison of aerodynamic coefficients for NACA23012 and baseline CFJ 23012. The results show that the CFJ technique can significantly improve the lift and reduce the drag at both Mach numbers with the given . The maximum lift of both Mach numbers increase by 18.1%, and the drag reduces significantly at almost all AoAs. However, when the AoA is between 6° and 8° at conditions of , the drag of CFJ 23012 is greater than that of NACA 23012. On the other hand, the drag can even be negative at low AoA at the condition, indicating that the CFJ technique can provide thrust under certain conditions. This phenomenon results from the thrust effect caused by the jet flow, and a large intensity of CFJ could offset the drag on the airfoil surfaces.
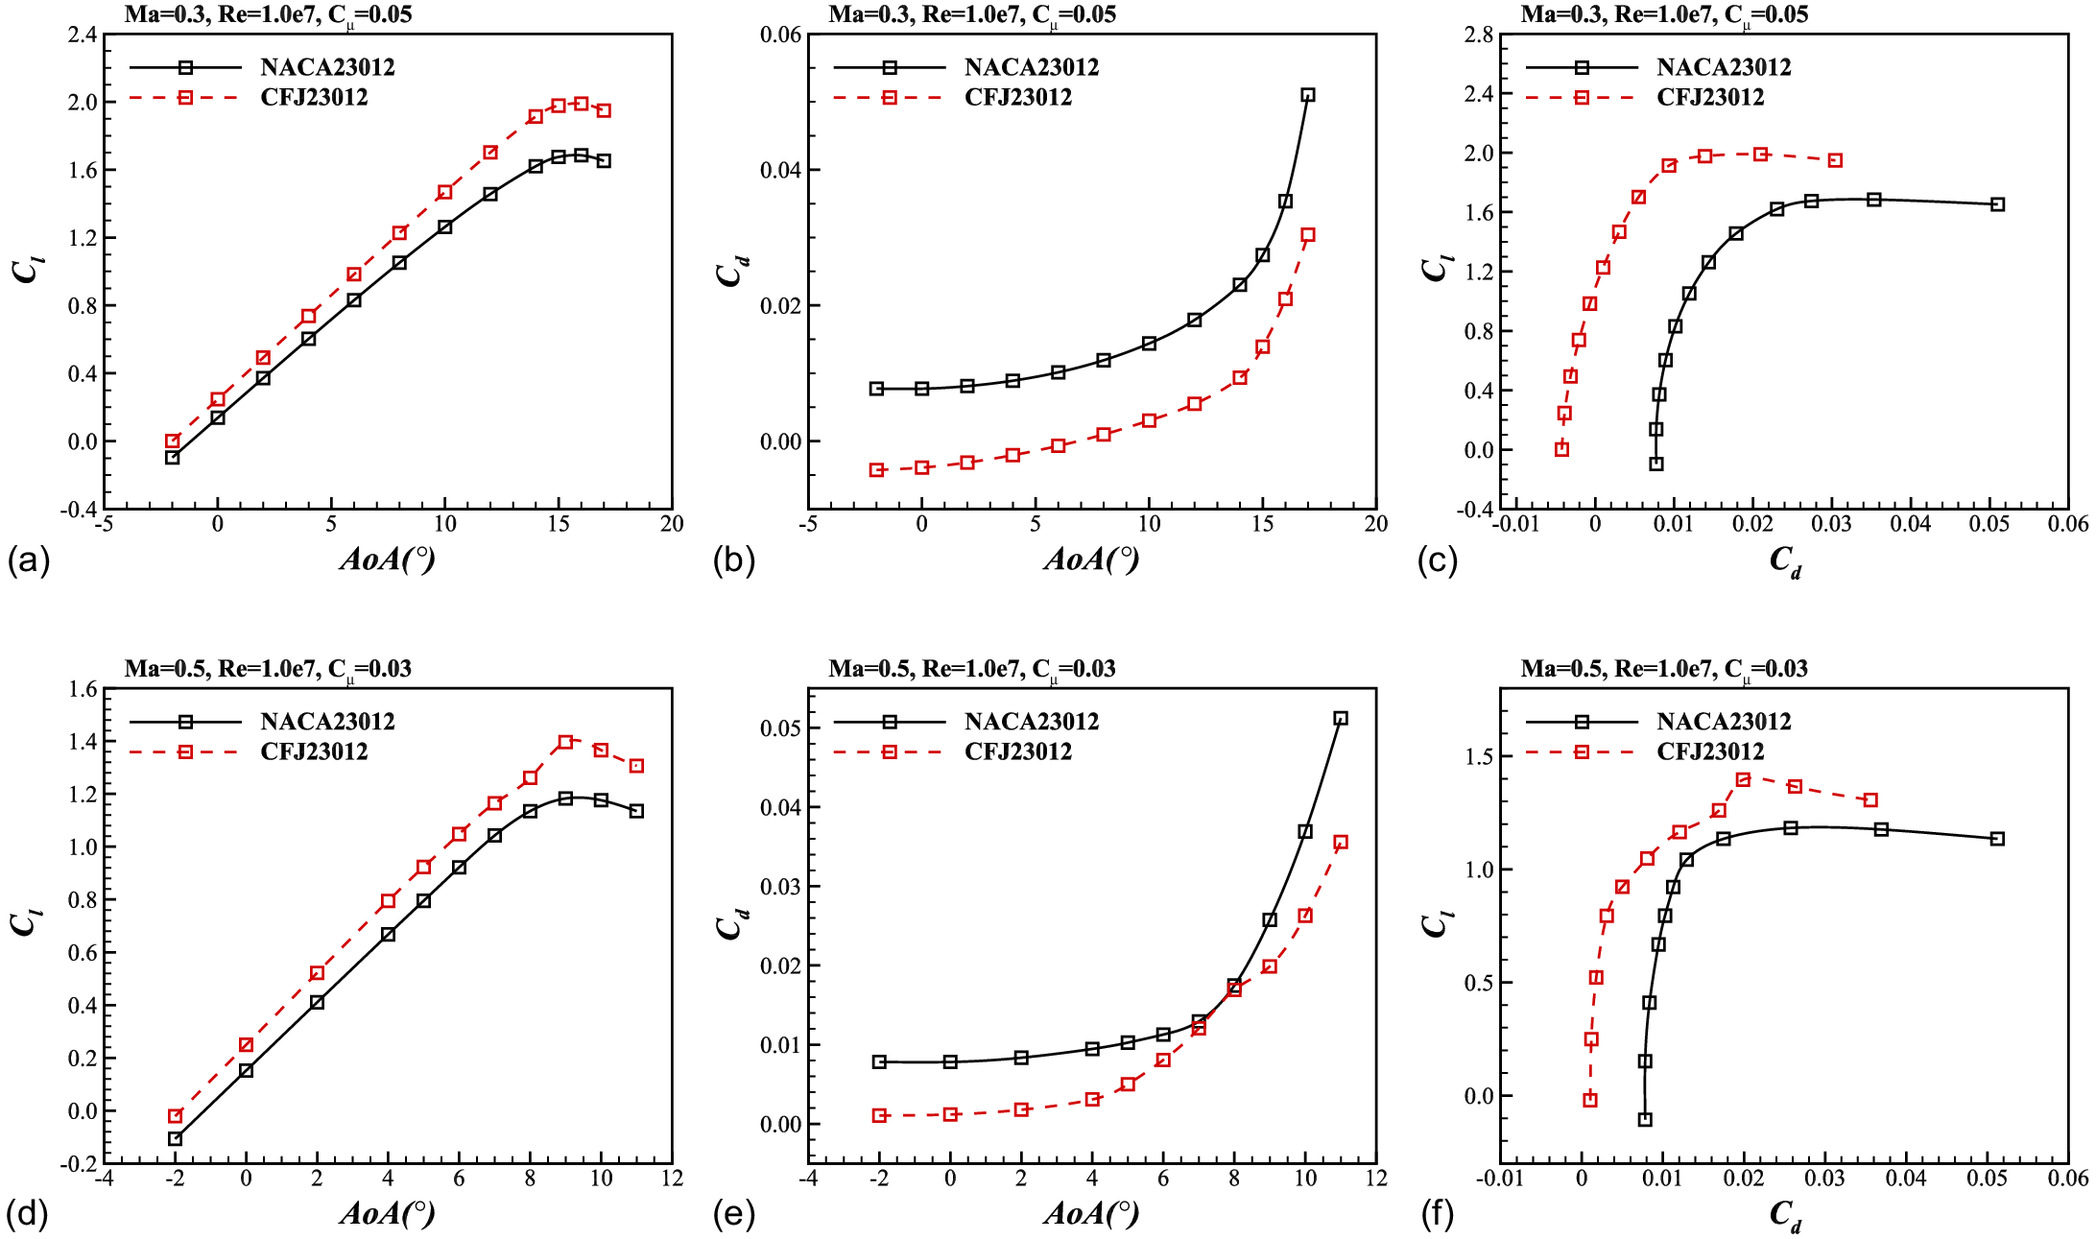
Fig. 9 compares the pressure coefficient distributions between NACA 23012 and baseline CFJ 23012. It is clear that the negative pressure of the CFJ 23012 between the injection and suction orifices is greater than that of NACA 23012, resulting in an increase in lift. However, when the Mach number is 0.5, it is evident that the CFJ influences the supersonic region near the leading edge, which may cause adverse effects.
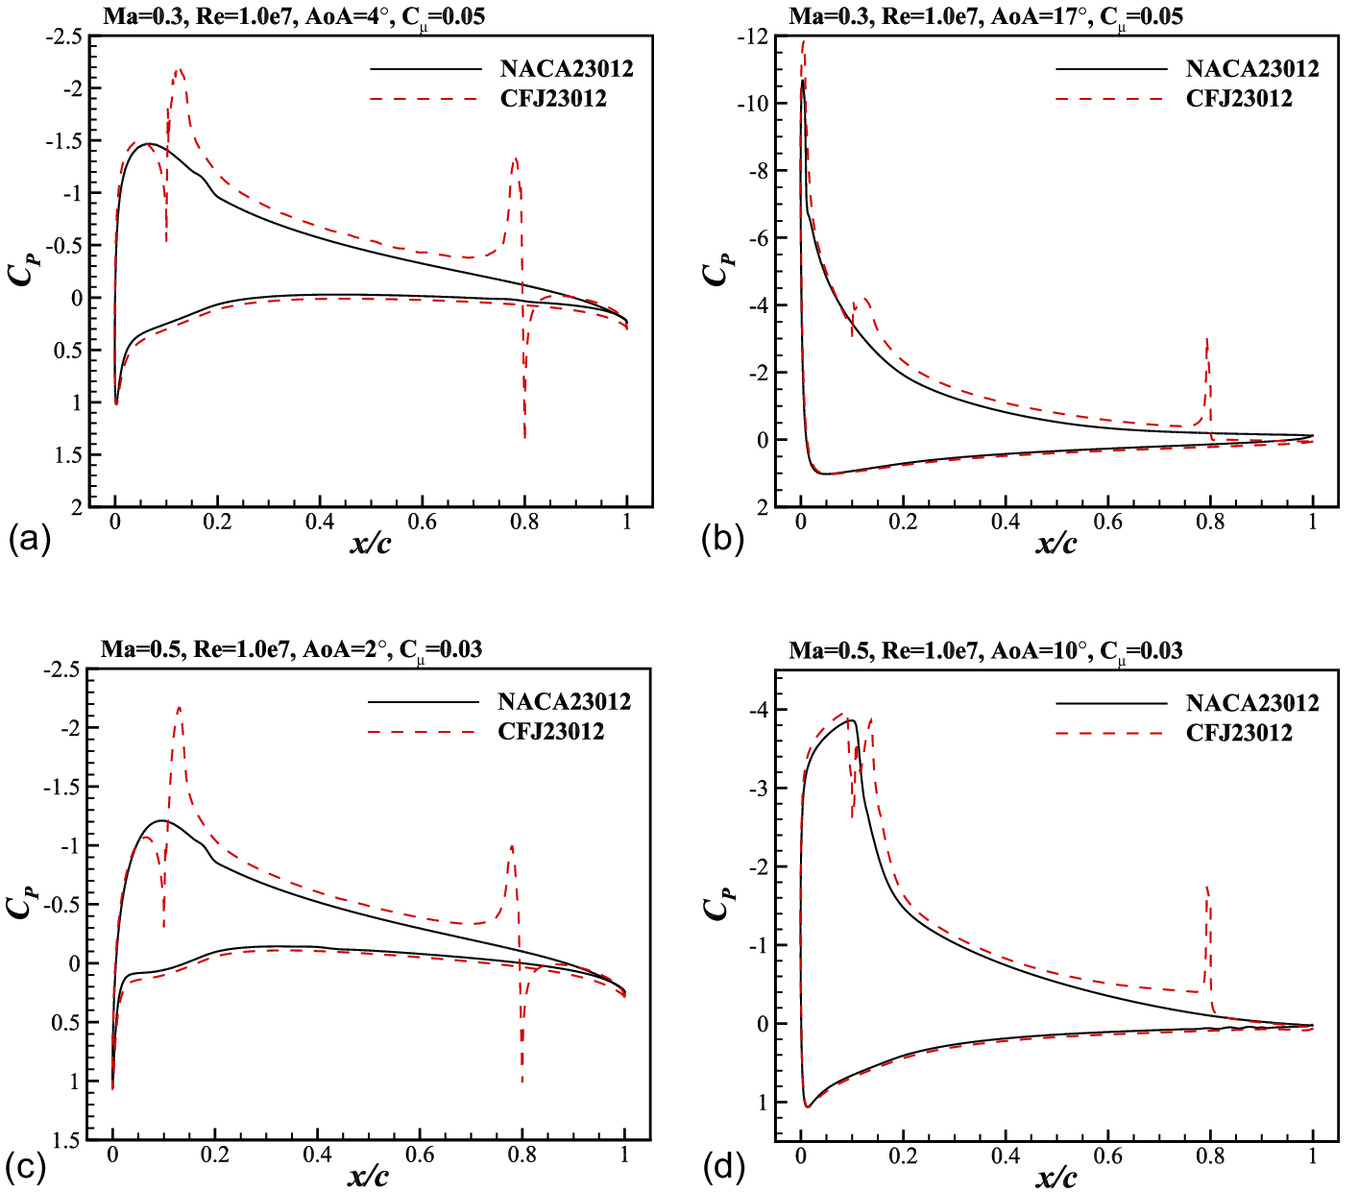
Fig. 10 compares the flow field of NACA 23012 and baseline CFJ 23012 airfoils at Mach numbers 0.3 and 0.5. At Mach number 0.3, the shock wave only appears at high AoAs, and the location is far ahead of the injection orifice. The jet flow with high velocity induces the main flow to accelerate, resulting in a stronger shock wave near the leading edge. At AoA of 17°, the flow around the trailing edge of the NACA 23012 airfoil becomes separated, whereas the flow around the CFJ airfoil remains attached, demonstrating the CFJ’s capability of suppressing flow separation.
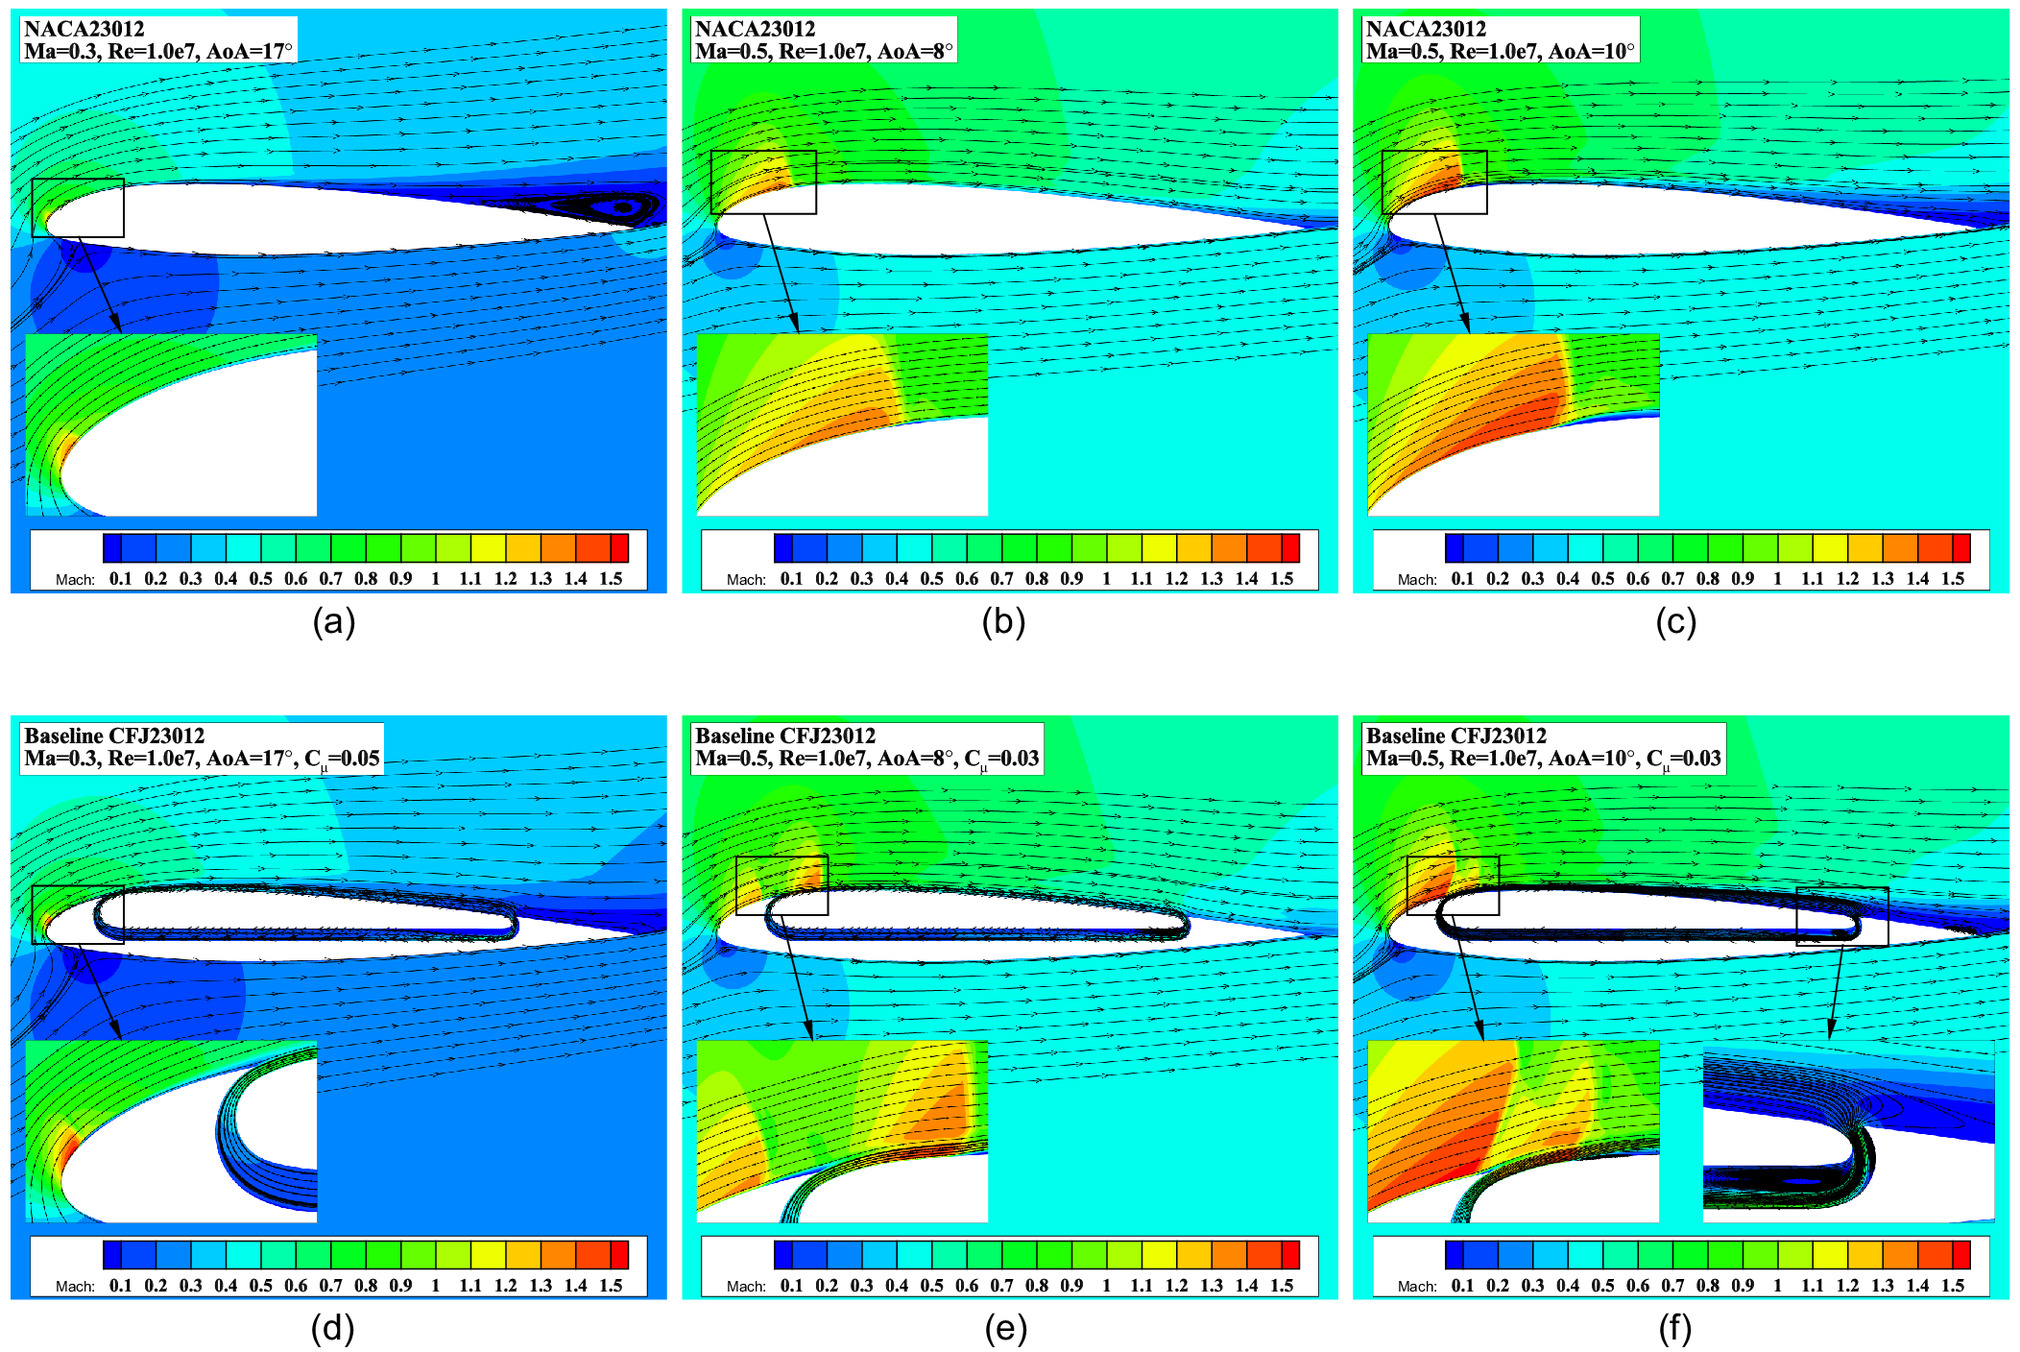
As the Mach number increases to 0.5, the shock wave appears at a relatively low AoA and moves backward on the upper surface, which cause the injection orifice to interact with the supersonic region. When AoA is 8°, two shock waves appear on CFJ 23012, as shown in Fig. 10(e). The first one appears before that of the NACA 23012, while the second one locates after the injection orifice and is stronger. Therefore, the drag coefficient of CFJ 23012 is larger than that of NACA 23012 at the current AoA. When the AoA increases to 10°, the phenomenon becomes more complicated. The first shock wave occurs because of the influence of the jet flow, making it an oblique shock wave. On the other hand, the jet flow becomes supersonic, inducing the main flow to accelerate, and ends up with the second shock wave. Finally, the shock-wave/boundary-layer interaction results in a flow separation, even though the suction near the trailing edge suppresses the separation to some extent.
In summary, the CFJ technique can achieve lift enhancement and drag reduction at Mach numbers 0.3 and 0.5, but the supersonic region and shock wave near the leading edge make it complicated for performance improvement, which is different from the CFJ airfoil in incompressible flow. Therefore, further investigation should be undertaken to reveal how CFJ parameters influence the performance of the airfoil in subsonic flow.
Parameter Study and Mechanism Analysis of CFJ Airfoil in Subsonic Flow
In this section, a parameter study is performed for the CFJ 23012 airfoil family. Parameters including injection location, suction location, injection orifice size, suction orifice size, and jet momentum coefficient are investigated at Mach numbers 0.3 and 0.5 with a Reynolds number of . Table 5 provides a detailed range of values for the parameters to be investigated. When investigating one of the parameters, the others are kept constant.
| Geometric parameters | Detail value |
|---|---|
| Injection location | 2%c, 5%c, 10%c, 15%c, 20%c |
| Injection orifice size | 0.5%c, 0.6%c, 0.7%c, 0.8%c |
| Suction location | 60%c, 70%c, 80%c, 90%c |
| Suction orifice size | 0.8%c, 1.0%c, 1.2%c, 1.4%c |
| Jet momentum coefficient | 0.03, 0.04, 0.05, 0.06 () |
| 0.02, 0.03, 0.04 () |
Note: “c” means chord.
Effect of Injection Location
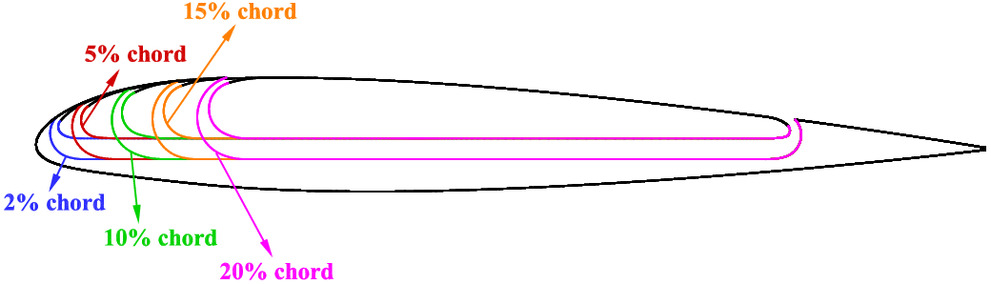
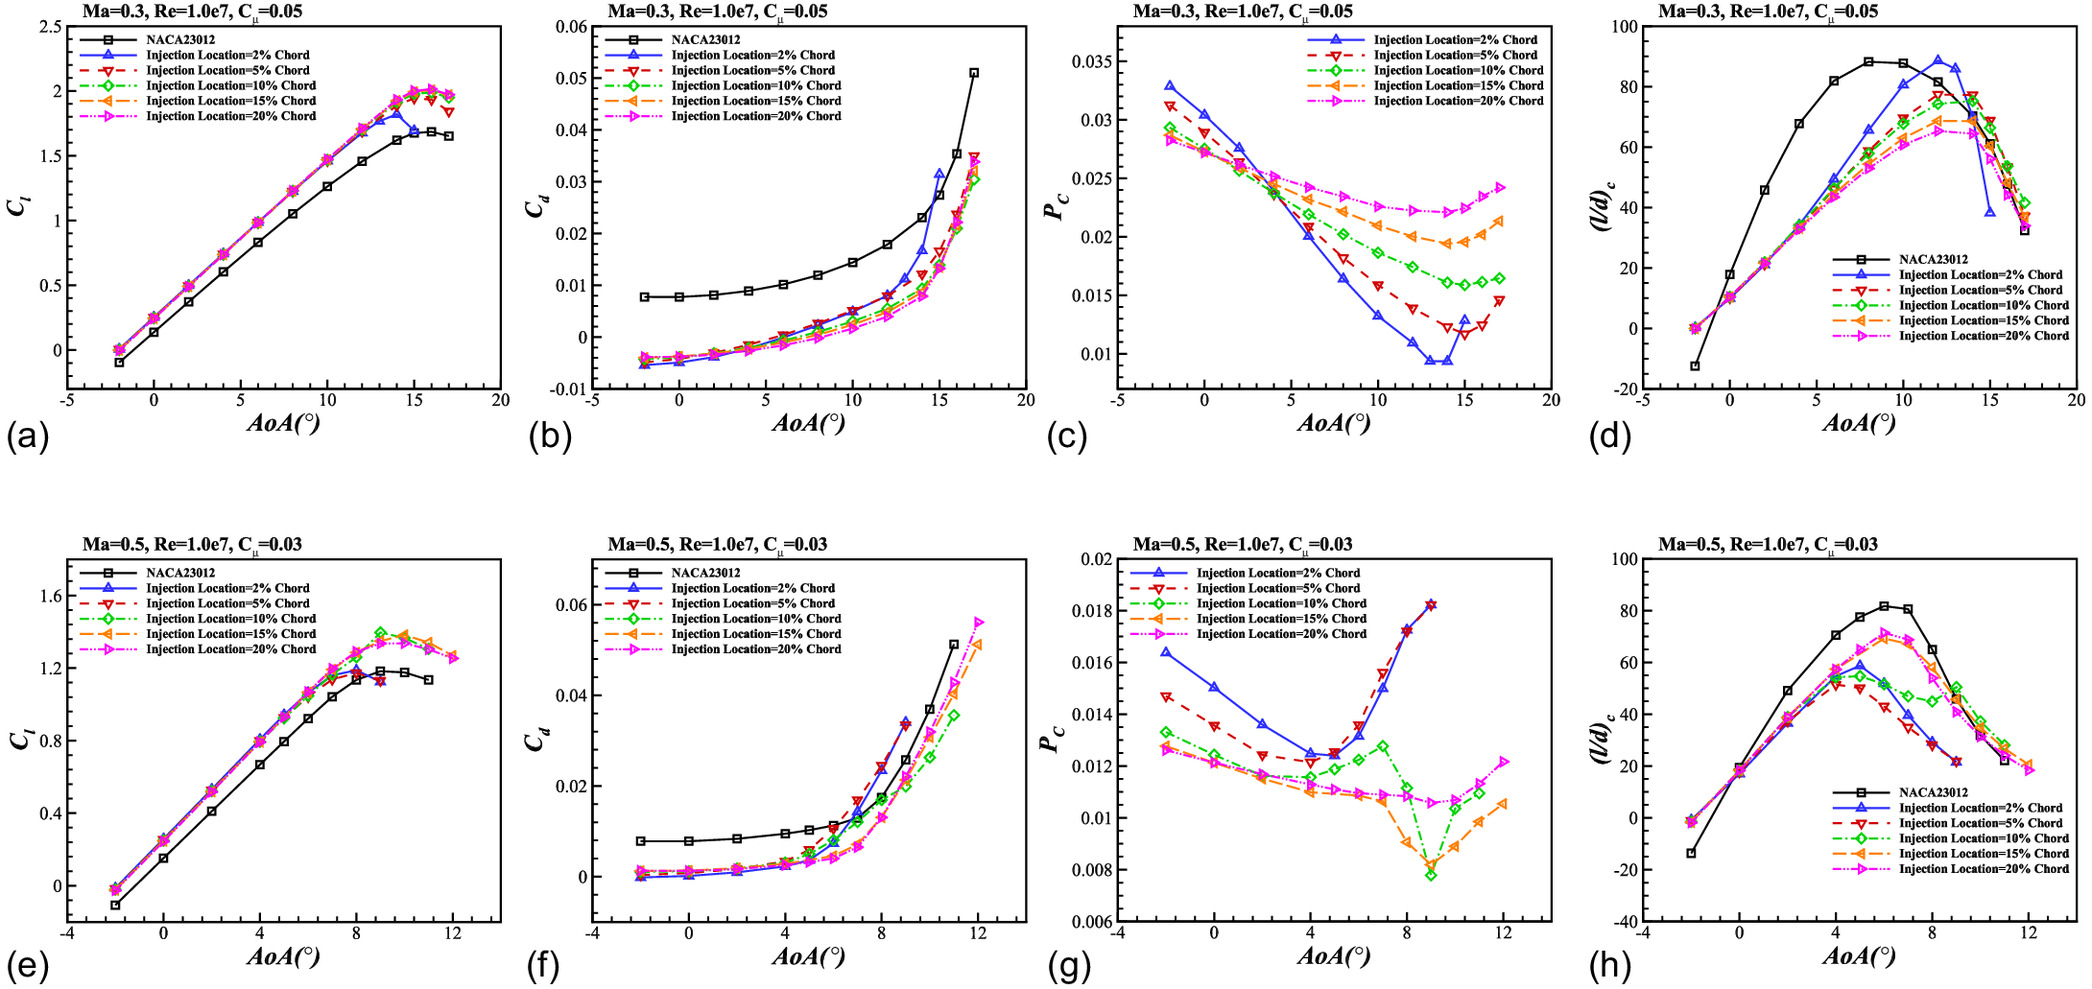
Based on the baseline CFJ 23012, CFJ airfoils with injection locations of 2%, 5%, 10%, 15%, and 20% chordwise are designed and shown in Figs. 11 and 12 demonstrates comparisons of aerodynamic characteristics. Table 6 exhibits the enhancements of maximum lift and stall AoAs of CFJ 23012 with different injection locations.
| Mach number | Aerodynamic characteristics | Improvement of CFJ 23012 with various injection locations | ||||
|---|---|---|---|---|---|---|
| 2%c | 5%c | 10%c | 15%c | 20%c | ||
| 0.3 | 8.0% | 15.4% | 18.1% | 19.1% | 19.5% | |
| 14° | 15° | 16° | 16° | 16° | ||
| 0.5 | 0.5% | 18.1% | 16.9% | 13.0% | ||
| 8° | 8° | 9° | 10° | 10° | ||
For conditions of , it can be concluded that lift enhancement is nearly the same with various injection locations when AoA is within 10°, while differences show at larger AoAs. As the injection location moves backward, the stall AoA increases from 14° to 16°, and the enhancement of maximum lift increases from 8.04% to 19.54%. However, when the injection orifice is moved backward beyond 15% chordwise, there is little improvement. The front injection location makes the drag lower when the AoA is below 4°, but the results are opposite when the AoA is between 4° and 15°. When the AoA is greater than 15°, the drag of the CFJ airfoil grows rapidly. For a given in attached flow, the reduces as the AoA increases, and it reduces faster for the airfoil with a front injection location. However, when the flow separates, increases. As for corrected lift-to-drag ratio, a front injection location leads to better performance, but only at high AoAs can CFJ airfoils exceed the baseline airfoil at current .
When the Mach number increases to 0.5, the lift of CFJ airfoils with a front injection location are slightly higher when the AoA is below 6°, but for larger AoAs, the rear injection location provides higher stall AoA and lift. The airfoil with an injection location of 15% achieves a stall AoA of 10° and maximum lift enhancement of 16.9%. Fig. 12(f) illustrates that airfoils with rear injection locations have larger drag when the AoA is below 4°, but a later increase than those with front injection locations as the AoA increases. For an AoA larger than 9°, the CFJ airfoil of injection location of 10% has the lowest drag, while the one with an injection location of 20% has the largest. The values of injection locations 2% and 5% chordwise are the largest and increase rapidly when the AoA is above 4°, while injection location of 15% leads to the lowest energy consumption at the current . When it comes to corrected lift-to-drag ratio, airfoils with injection locations of 15% and 20% chordwise have better performance.
Fig. 13(a) illustrates the velocity contours and streamlines of CFJ airfoils at the AoA of 14° with various injection locations for . It is apparent that the flow around the suction orifice becomes attached as the injection moves backward, which is also revealed in Fig. 12(a). Because of the constant injection orifice size and , the velocity of jet flow is nearly the same, but the velocity of the main flow around the front injection orifice is higher, which means a smaller velocity difference, resulting in weaker mixing effects and less energy transfer. Therefore, the downstream main flow is unable to overcome an adverse pressure gradient and becomes separated. This highlights the importance of matching the geometry parameters with when determining CFJ parameters. As for the variation of , it is common that the static pressure of the leading edge decreases as the AoA grows, so the jet exit pressure is lower for the same at high AoAs, leading to lower energy consumption, which matches the results in Fig. 12(c). Moreover, rear injection locations cannot lead to higher stall AoA for having little influence on the flow of leading edge, while a front injection location with high may increase stall AoA and maximum lift.
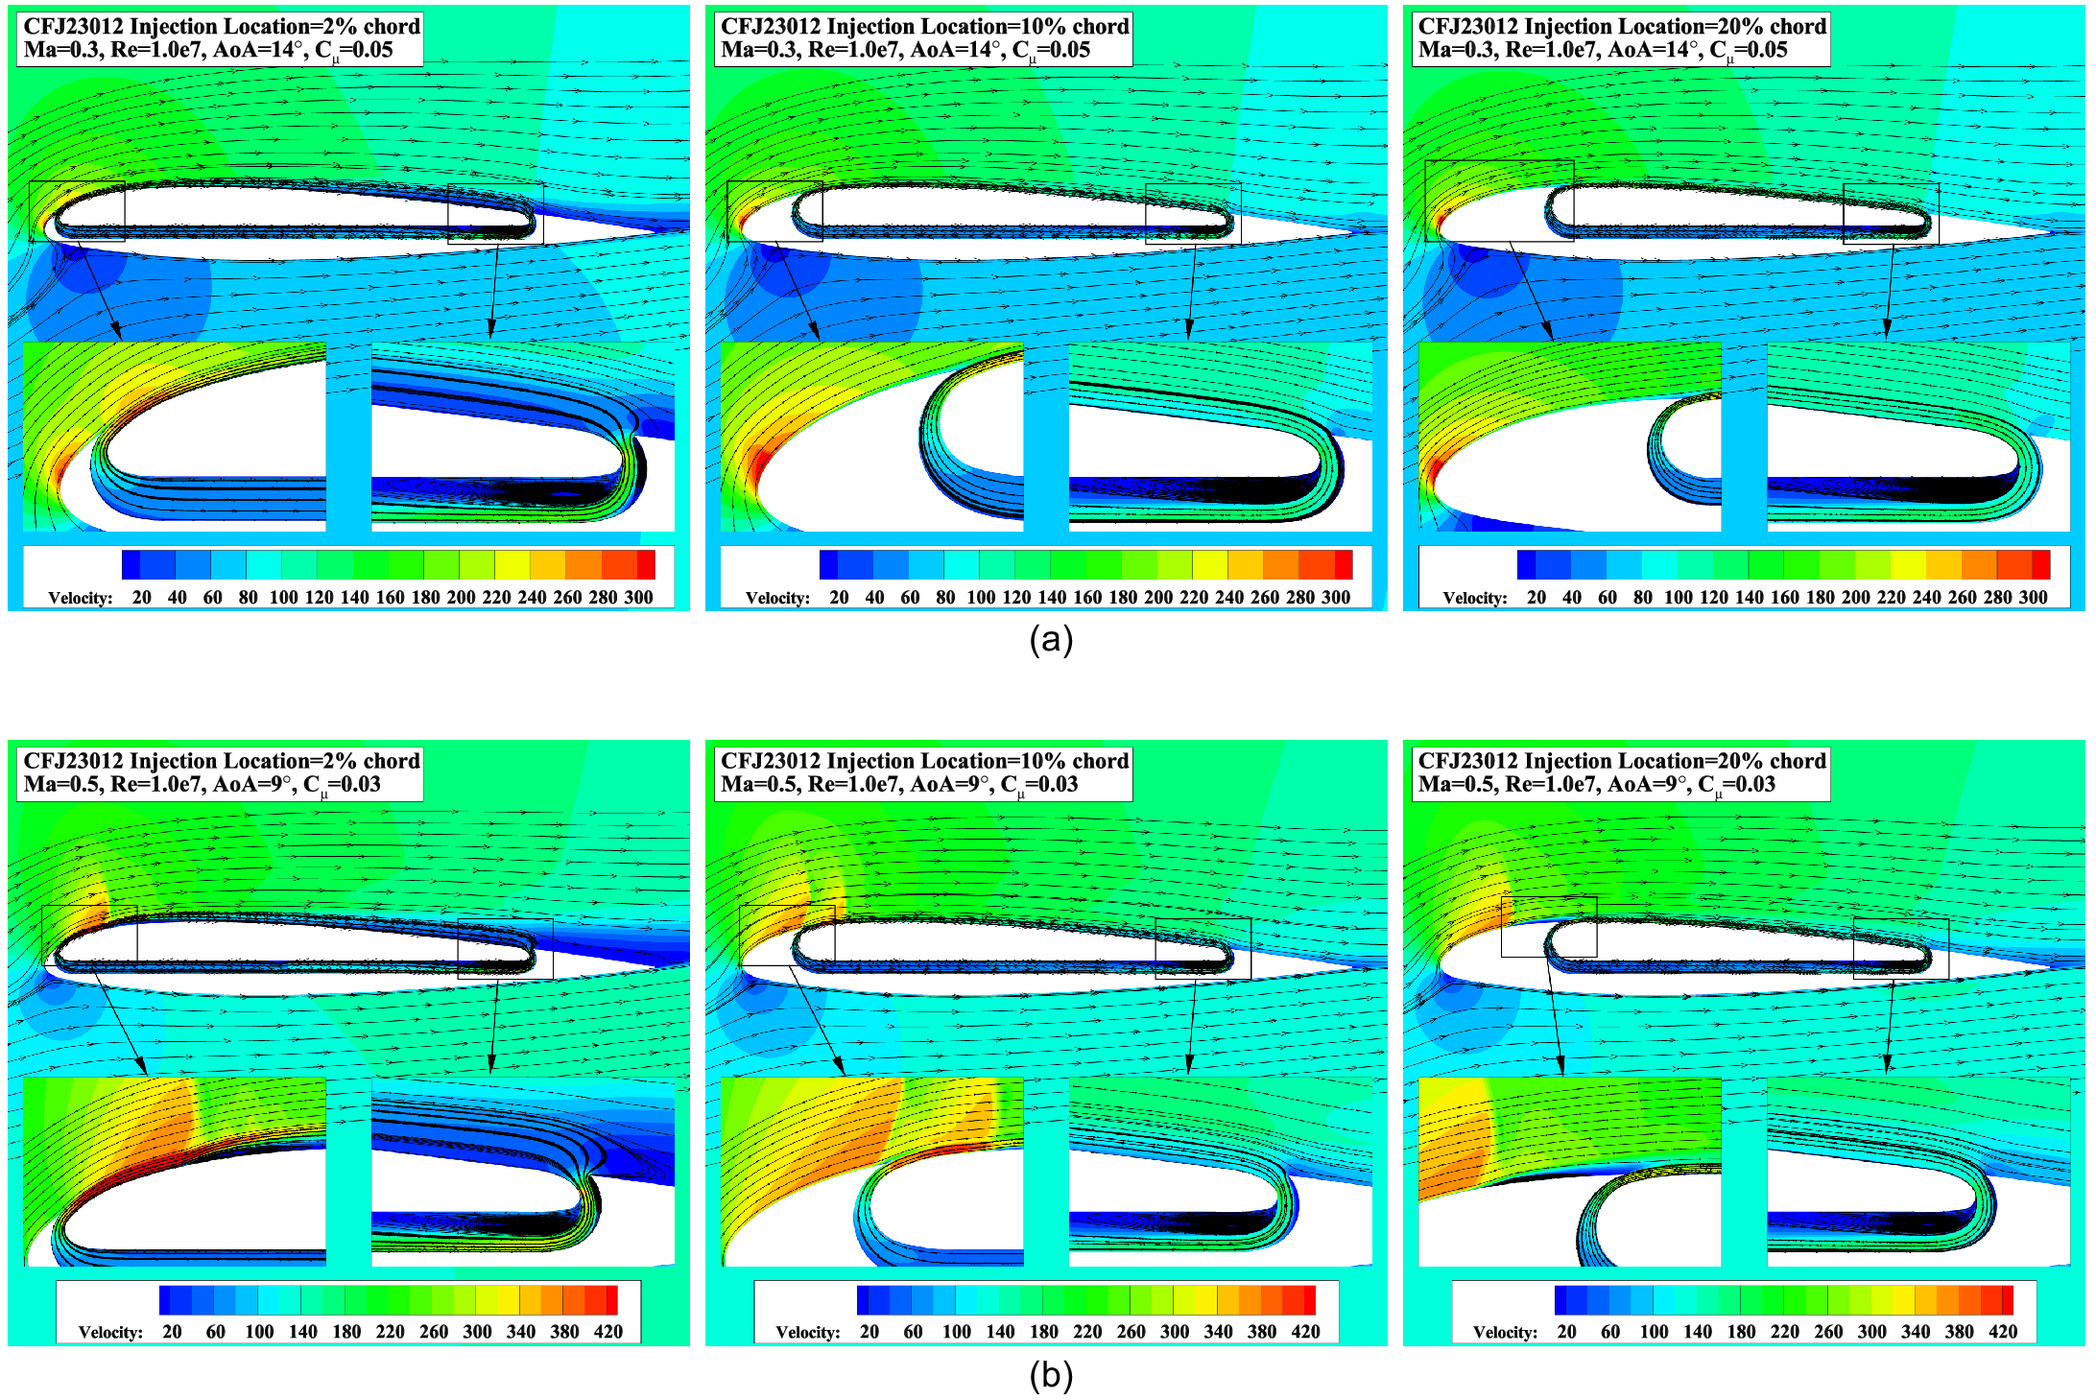
When the Mach number increases to 0.5, there are three kinds of typical phenomena due to different injection locations, as shown in Fig. 13(b). When the injection is located at 2% chordwise, the maximum velocity on the upper surface appears downstream of the injection orifice due to the velocity potential and inducement of the jet flow, causing a shock wave. The strong shock-wave/boundary-layer interaction then leads to flow separation and the lift decreases a lot, resulting in high and low . When the injection moves backward to 10% chordwise, the main flow has already accelerated to a high Mach number, and then an oblique shock wave occurs due to the upward deflection caused by jet flow. The velocity of the main flow is low after the oblique shock wave and continues to increase due to the inducement of the jet flow, causing the second shock wave. Since the flow after the first shock wave remains attached and with low static pressure, the is low as shown in Fig. 12(g). As the injection continues to move backward to 20%, it will no longer interact with the supersonic region. On the contrary, the jet flow suppresses the separation after the shock wave. But the effect may deteriorate when the injection moves backwards too far behind the shock wave.
Therefore, the injection location has serious influence on the performance of CFJ airfoils in subsonic flow. A front injection location provides a little higher lift at a low AoA, but causes the interaction between supersonic region and jet flow, resulting in high drag and more energy consumption. To avoid this scenario, it should be placed after the normal shock but not too far behind, so that it can simultaneously suppress the flow separation and achieve high aerodynamic efficiency.
Effect of Injection Orifice Size
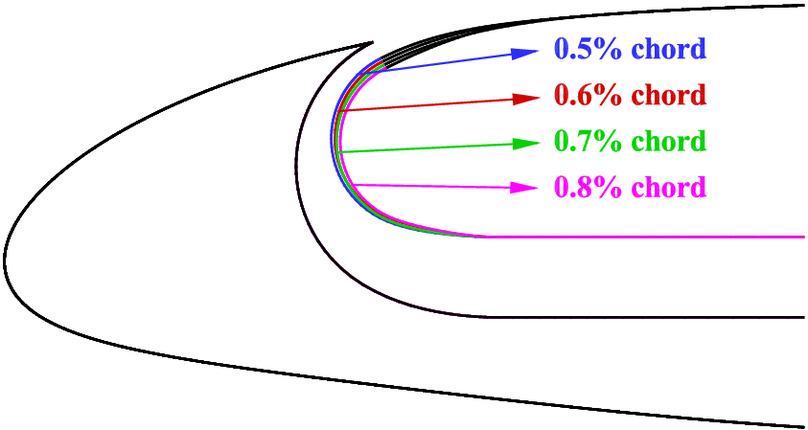
Based on the baseline CFJ 23012, four CFJ airfoils with injection orifice sizes of 0.5%, 0.6%, 0.7%, and 0.8% chord length were designed and are shown in Fig. 14. Fig. 15 compares the aerodynamic coefficients of CFJ 23012 airfoils with various injection orifice sizes. Table 7 shows the enhancements of maximum lift and stall AoAs of CFJ 23012 with various injection orifice sizes.
| Mach number | Aerodynamic characteristics | Improvement of CFJ 23012 with various injection orifice sizes | |||
|---|---|---|---|---|---|
| 0.5%c | 0.6%c | 0.7%c | 0.8%c | ||
| 0.3 | 20.0% | 18.1% | 15.9% | 14.2% | |
| 16° | 16° | 16° | 15° | ||
| 0.5 | 19.8% | 18.1% | 6.4% | ||
| 9° | 9° | 9° | 8° | ||
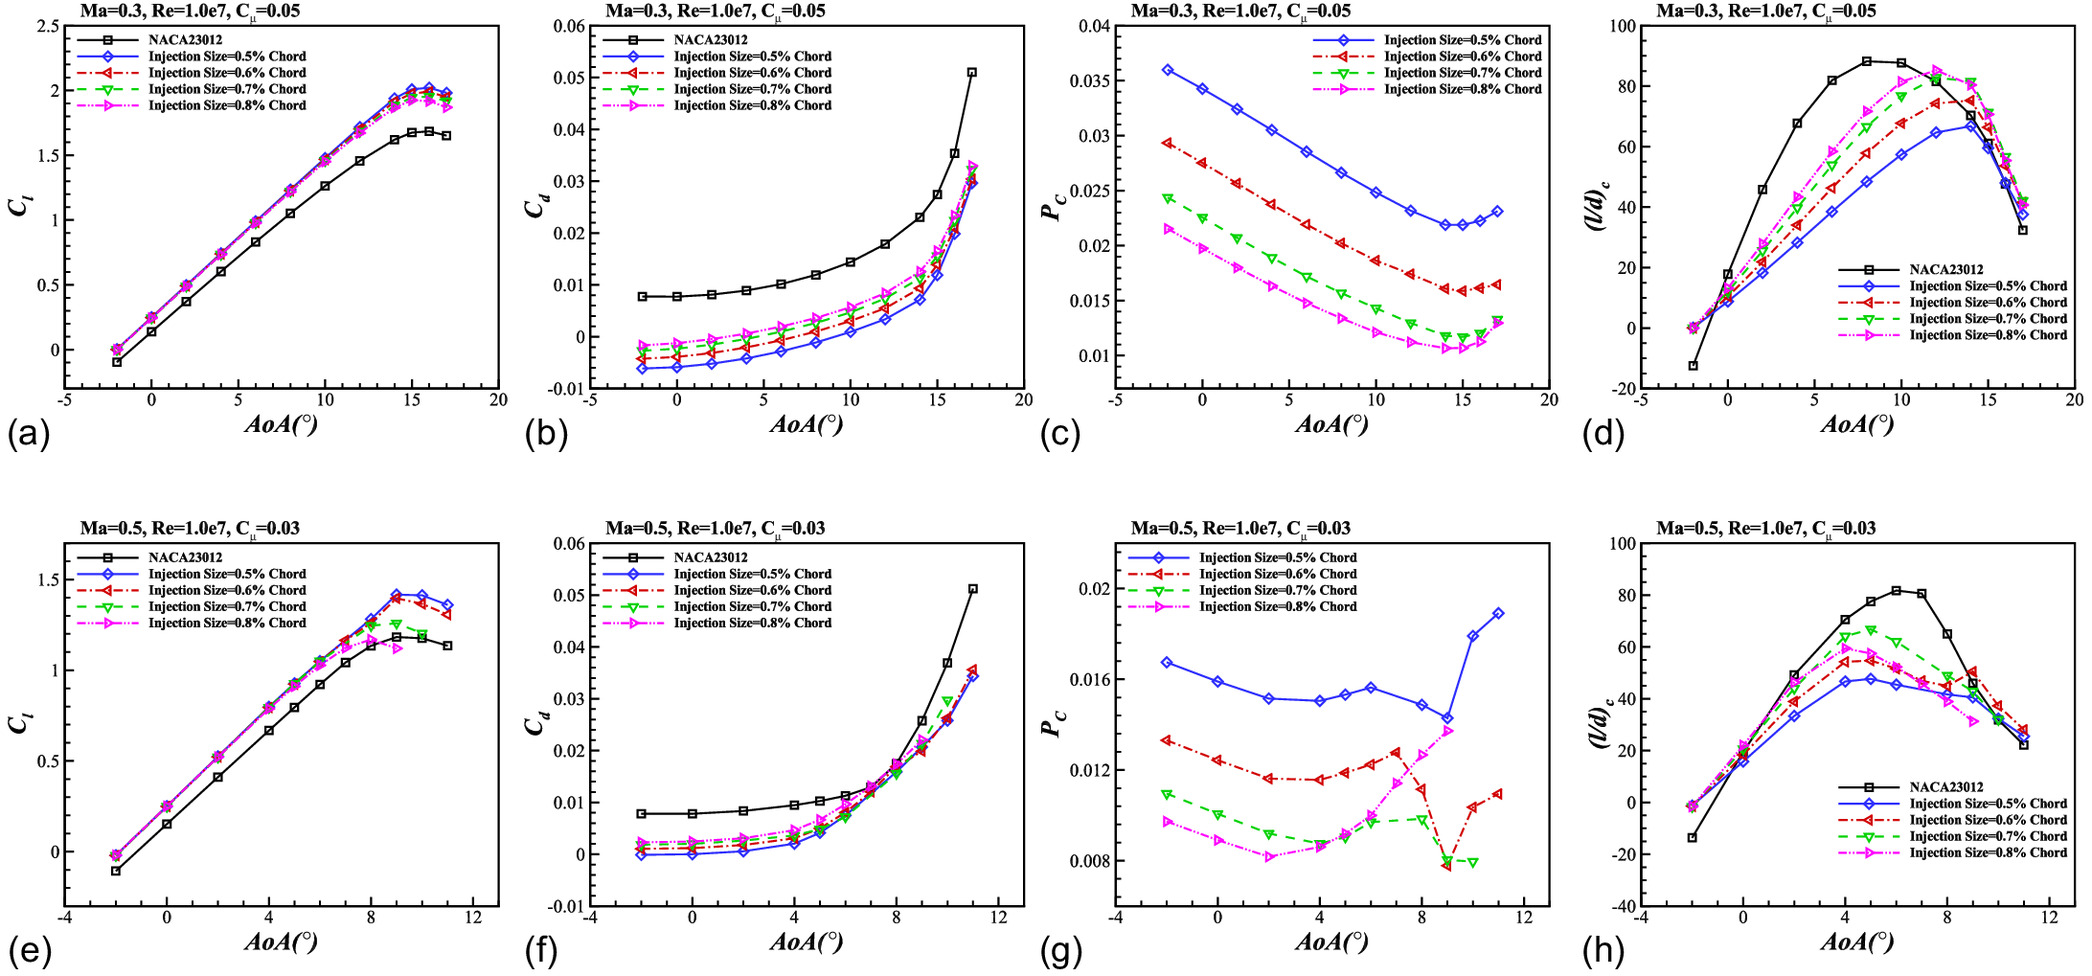
At Mach number 0.3, the lift increases as the injection orifice becomes smaller, especially at high AoAs. The enhancement of maximum lift increases from 14.2% to 20.0% as the injection orifice size varies from 0.8% to 0.5%, and the stall AoA increases from 15° to 16°. Smaller injection orifices also lead to lower drag, particularly at AoAs below 15°. However, the of airfoils with a small injection orifice is large, and it causes the to decrease a lot. When the Mach number increases to 0.5, the trends in the aerodynamic coefficients are similar to those at Mach number 0.3. As the injection orifice becomes smaller, the enhancement of maximum lift increases to 19.8%. Moreover, the drag reduction effect is more pronounced for smaller injection orifices at AoAs below 6°. However, the of a small injection orifice is also low because of high energy consumption. Therefore, balancing the advantage of lift enhancement and shortcomings of energy consumption is important for injection orifice size.
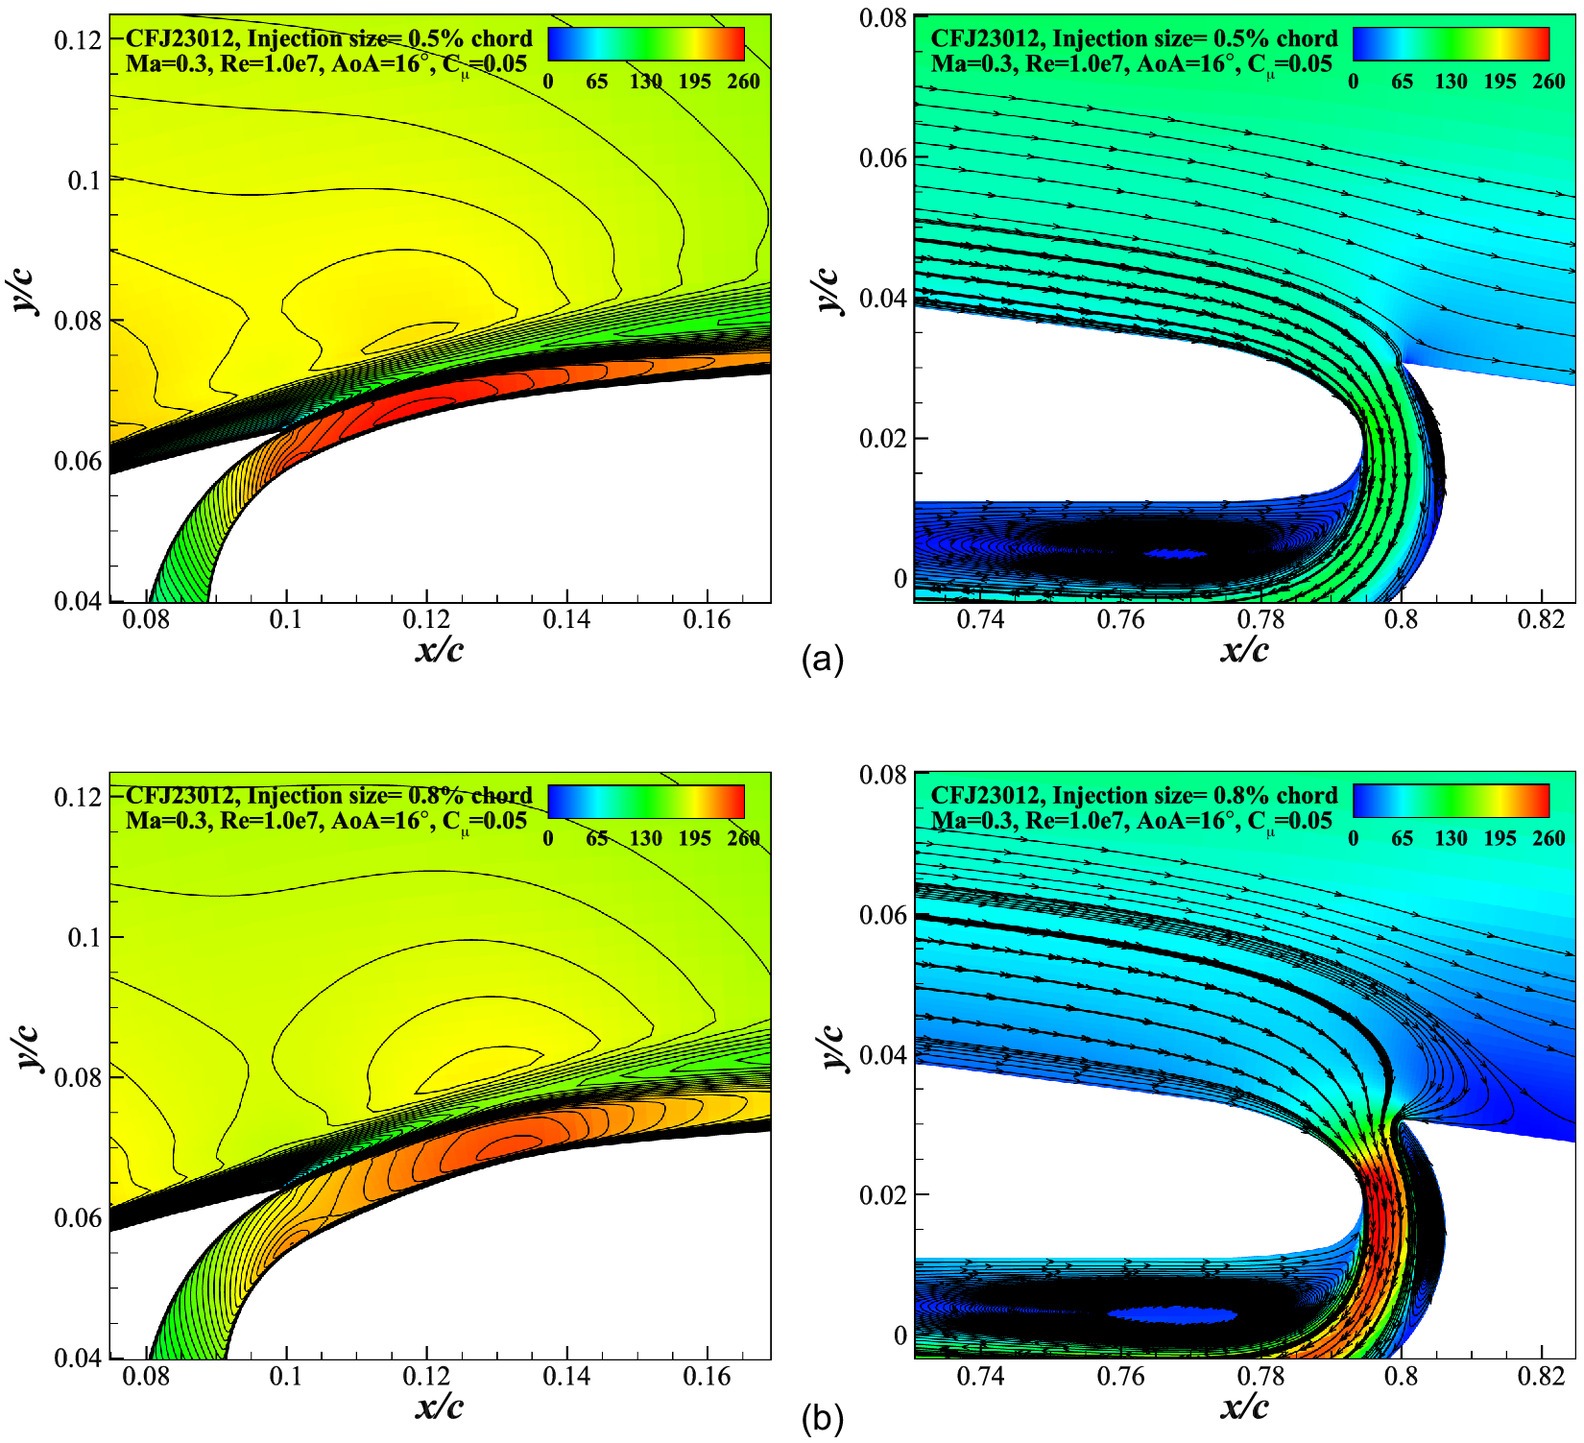
Fig. 16 depicts the velocity contour details of CFJ 23012 with different injection orifice sizes. It is evident that a smaller injection orifice results in a higher velocity of jet flow with the same , leading to more energy transfer to the main flow and higher lift enhancement. However, a higher velocity means more kinetic energy acquired from the pump, even though the is equal. Therefore, a small injection orifice leads to high , and it may decrease if the drag reduction is not able to offset the power increment. Additionally, for high AoAs, a large injection orifice can cost more energy in return for failing to maintain flow attachment. So the combination of a large injection orifice with a relatively large is worth trying at high AoAs, because if the flow remains attached, the may be lower and result in high .
Effect of Jet Momentum Coefficient
Based on the baseline CFJ 23012 airfoil, the effects of the jet momentum coefficient are investigated by adjusting the pressure jump of the actuator disk boundary. The aerodynamic coefficient comparisons of CFJ 23012 with various jet momentum coefficients are shown in Fig. 17, and the enhancement of maximum lift and stall AoA are shown in Table 8.
| Mach number | Aerodynamic characteristics | Improvement of CFJ 23012 with various jet momentum coefficient | ||||
|---|---|---|---|---|---|---|
| 0.02 | 0.03 | 0.04 | 0.05 | 0.06 | ||
| 0.3 | — | 3.2% | 13.9% | 18.1% | 21.3% | |
| — | 14° | 15° | 16° | 16° | ||
| 0.5 | 0.5% | 18.1% | 26.2% | — | — | |
| 8° | 9° | 10° | — | — | ||
It is evident that a higher jet momentum coefficient provides better lift enhancement for the CFJ airfoil at all AoAs for both Mach numbers, while a low jet momentum coefficient reduces the stall AoA. When the jet momentum coefficient increases, the enhancement of maximum lift increases from 3.2% to 21.3% for Mach number 0.3, and from 0.5% to 26.2% for Mach number 0.5, respectively. The stall is also delayed at the same time. However, the stall AoA at remains the same when is larger than 0.4. On the other hand, higher leads to more energy consumption and lower than the baseline CFJ airfoil. It is apparent that the increases disproportionately as the increases. Therefore, even though higher reduces the drag a lot, it is worse for . However, if the is too low, the CFJ airfoil may deteriorate at high AoAs because the jet flow fails to suppress the separation. Therefore, at high AoAs, a higher corrected lift-to-drag ratio can be achieved by reducing the as much as possible while ensuring flow attachment. Moreover, it is a better control strategy that varies the for different AoAs, so that high aerodynamic efficiency can be achieved at most conditions.
Fig. 18 compares the pressure coefficient distributions of CFJ 23012 airfoils with different at Mach number 0.3. It shows that a higher results in a larger negative pressure on the upper surface, which leads to a higher lift coefficient. On the other hand, this tendency can also be explained in Fig. 18(b) using the circulation theorem, which shows that a higher moves the stagnation location downstream, leading to higher circulation around the airfoil and better lift enhancement.
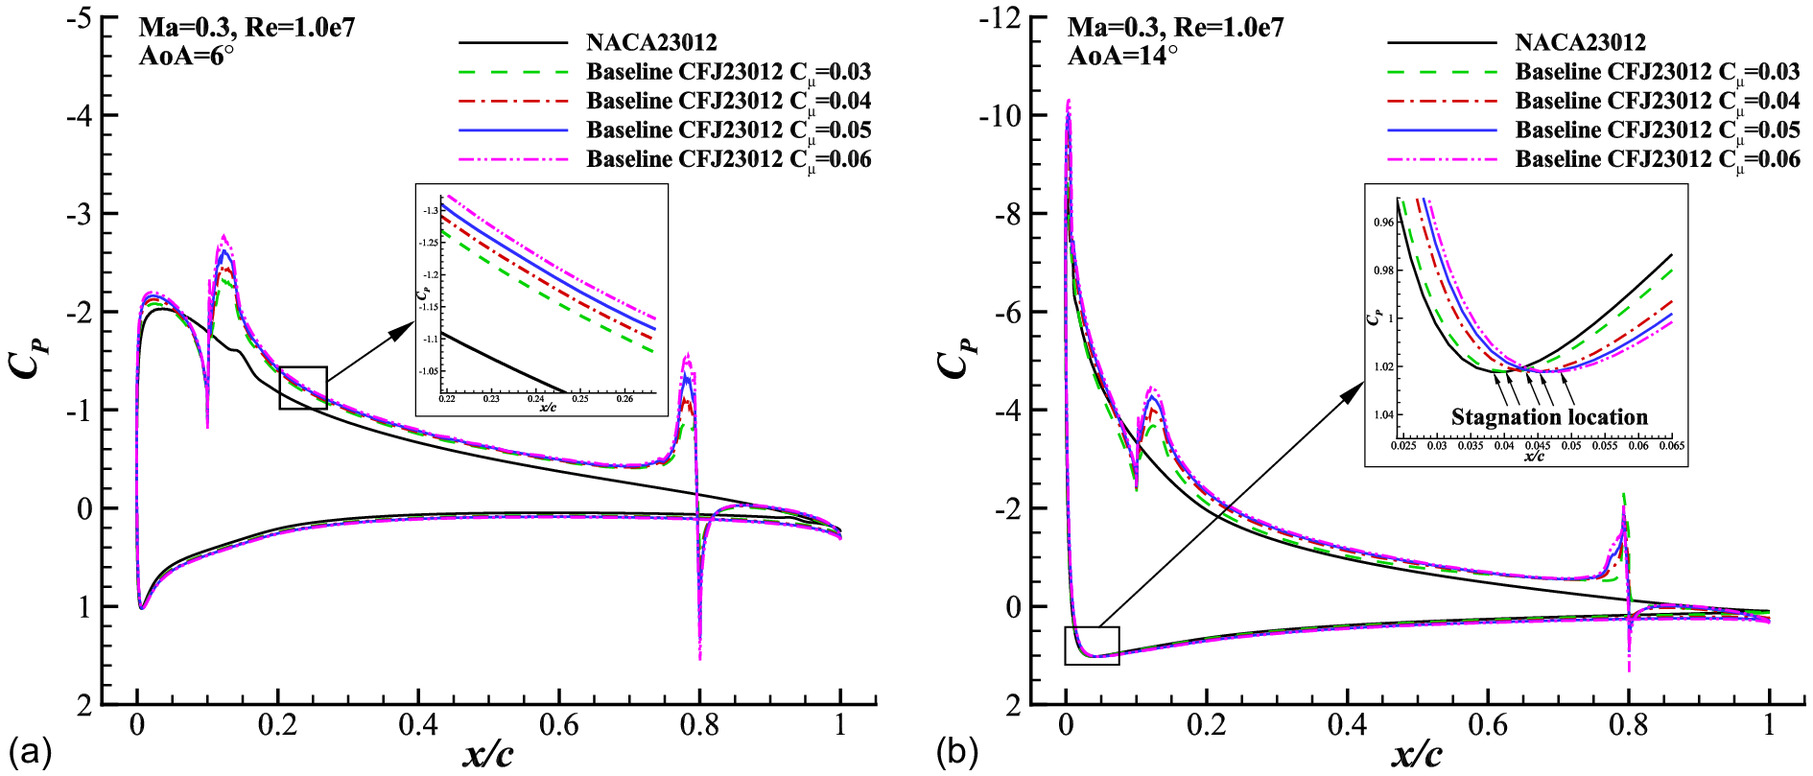
Fig. 19 compares the velocity contours and streamlines of CFJ 23012 airfoil with different . As mentioned previously, when at Mach number 0.3, increasing does not seem to delay the stall or largely reduce drag at high AoAs. To further investigate the reason, an additional condition of is simulated. According to the contours, the stall at Mach number 0.3 is mainly determined by the separation developing at leading edge. However, the injection location of the current CFJ airfoil is too far from the separation point to further improve the flow field, and the separated flow weakens the effect of jet flow. Therefore, although the flow near suction orifice is still attached at , the stall AoA remains the same. This suggests that CFJ airfoils with a front injection location can immediately remove the separation near the leading edge, and a combination with high may delay the stall at Mach number 0.3.
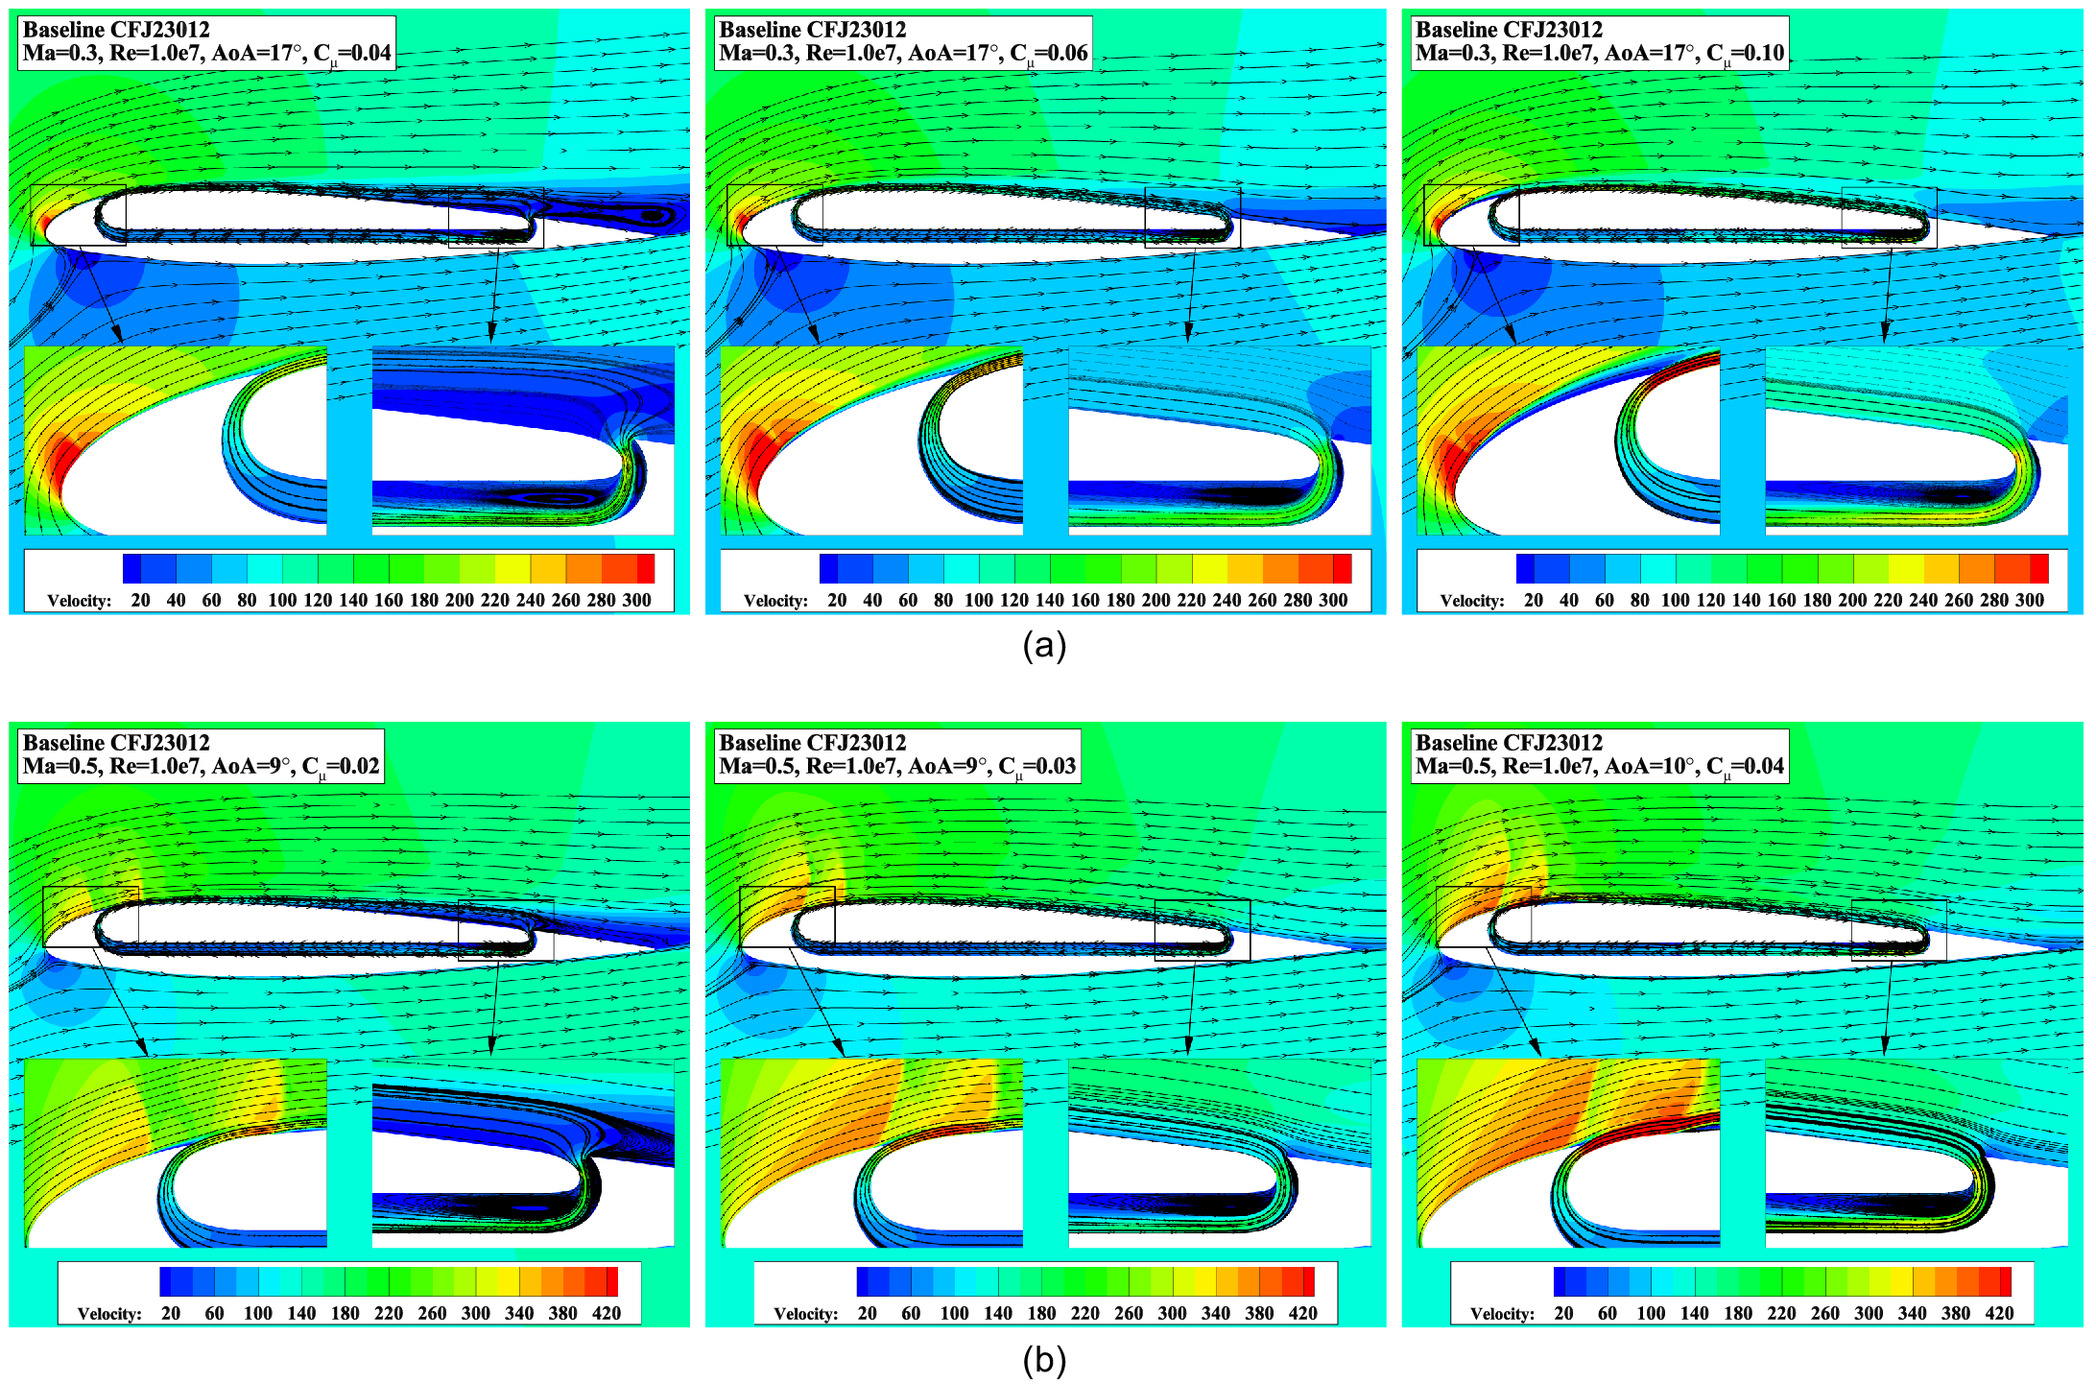
For conditions of Mach number 0.5 at AoA of 9°, it is evident that the flow around the suction orifice is close to separation when , reducing the lift and stall AoA. But as the increases, the flow remains attached near the trailing edge. So, the stall AoA of baseline CFJ airfoil is increased to 10°, and the maximum lift increases. However, increasing the indefinitely can lead to other problems. When AoA is 10° with , a strong shock-wave/boundary-layer interaction after the second shock wave has triggered flow separation, and led to lower along with high .
In summary, as a controllable parameter, appropriate jet momentum coefficient can achieve delayed stall, increased maximum lift, and high aerodynamic efficiency at the same time. Furthermore, the control strategy that varies the for different AoAs may achieve high aerodynamic efficiency as much as possible at most conditions.
Effect of Suction Location
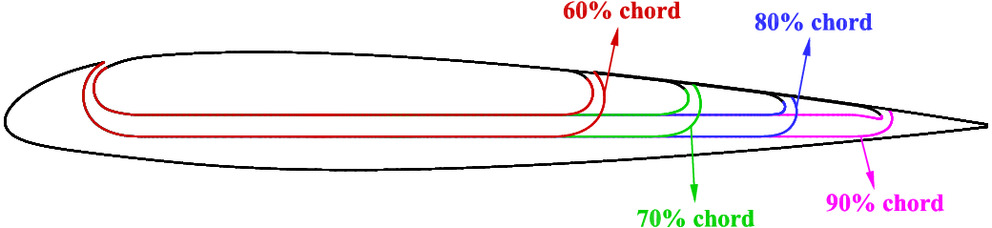
Based on the baseline CFJ 23012 airfoil, four CFJ airfoils with different suction locations of 60%, 70%, 80%, and 90% chord-wise are designed (Fig. 20) to investigate their influence on aerodynamic performance.
Fig. 21 shows the comparison of the aerodynamic characteristics of CFJ 23012 airfoils with different suction locations. It is evident that the rear suction location leads to better lift performance at most AoAs, but stall AoA remains the same. For Mach number 0.3, the enhancement of maximum lift increases from 16.1% to 19.1% as the suction location moves backward, but the CFJ airfoil with front suction has better stall characteristics with a smooth lift curve drop or higher lift after stall. Moving the suction orifice backwards reduces the drag but results in more energy consumption, which makes the only a little bit better than airfoils with a front suction location. Therefore, considering that the separation of baseline airfoil usually starts from upstream flow, a front suction location is better because of more efficient suppression toward separation.
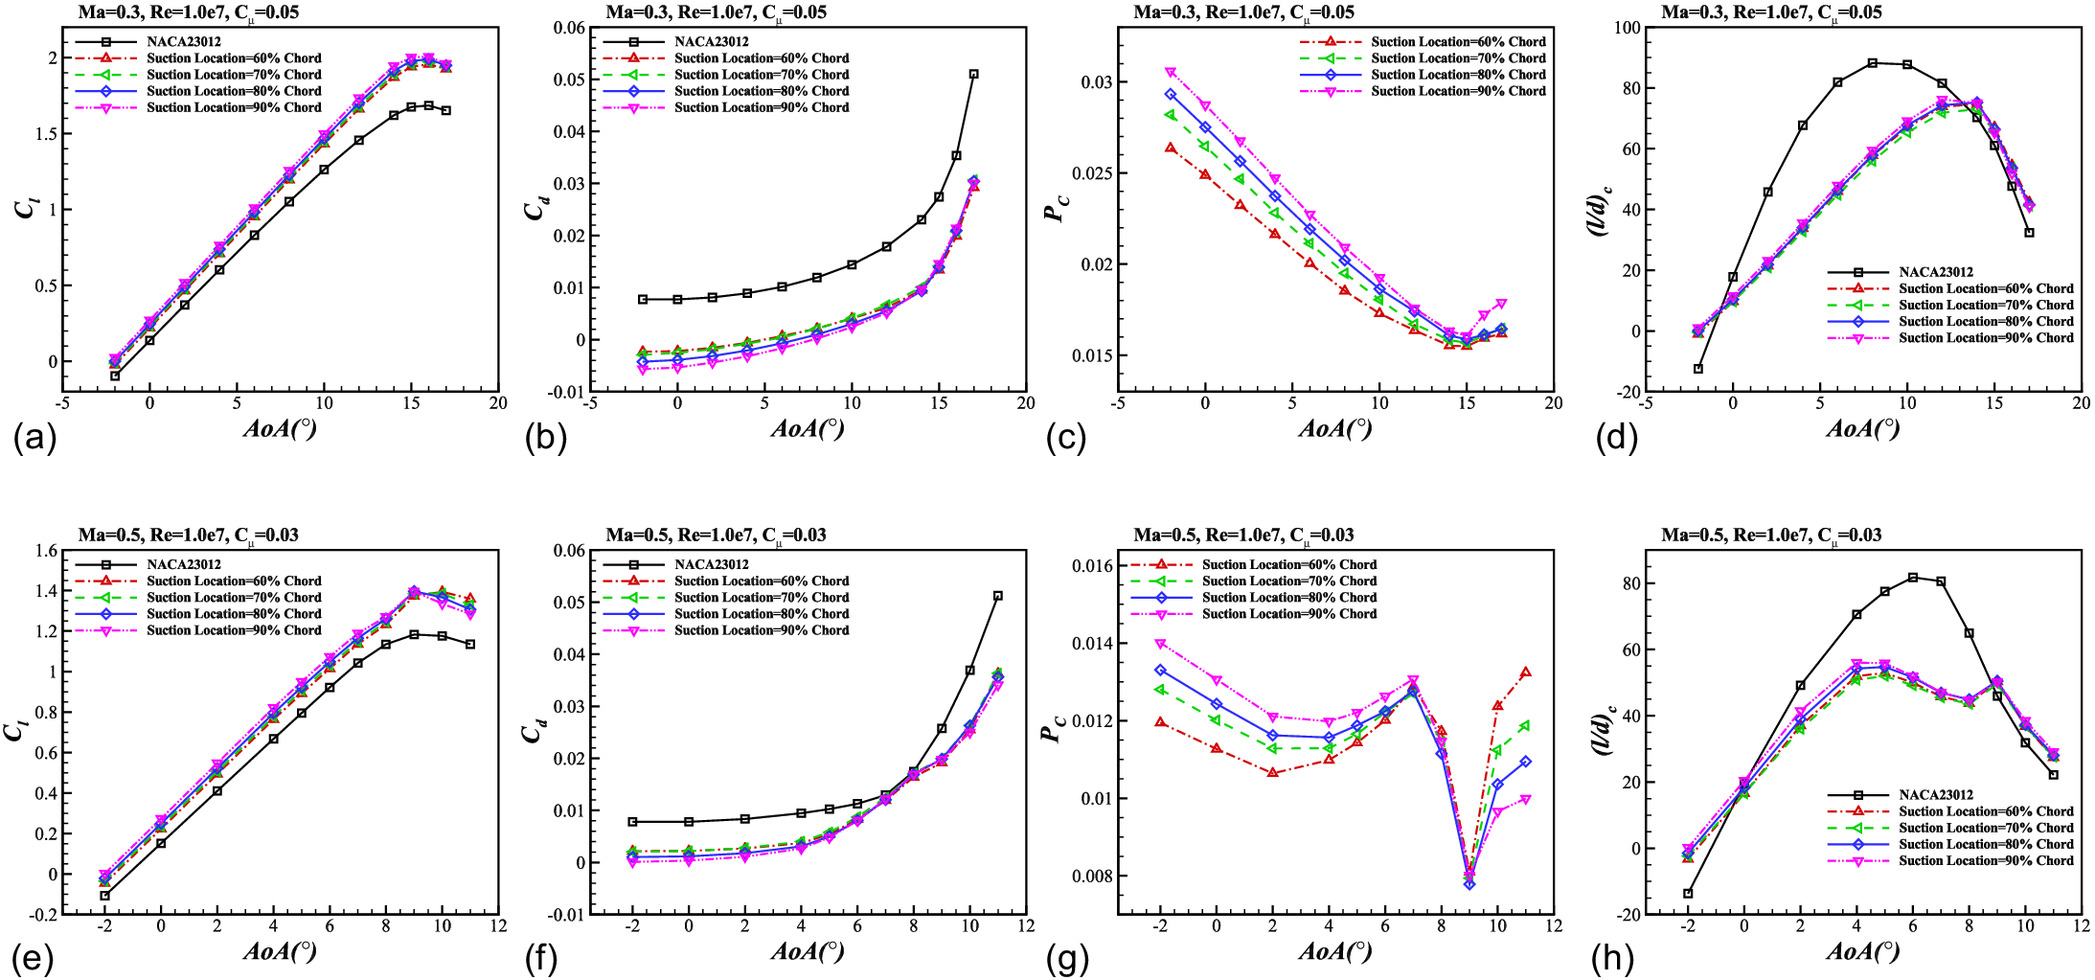
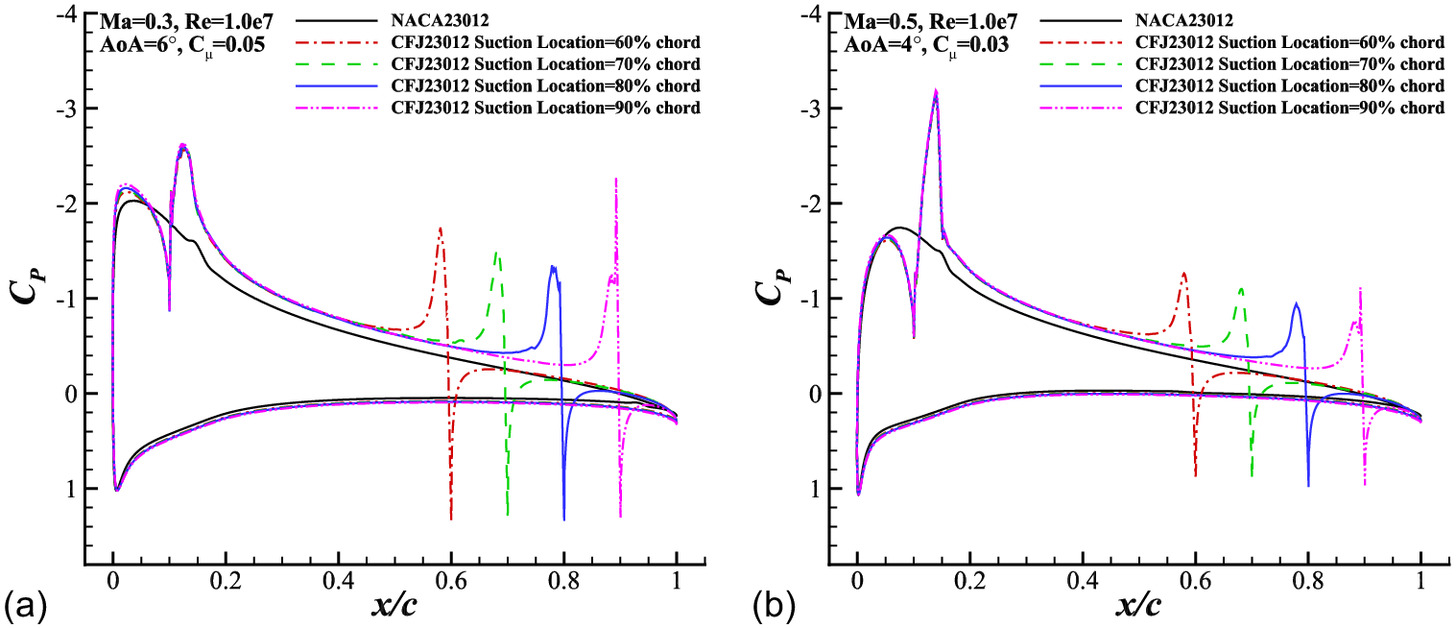
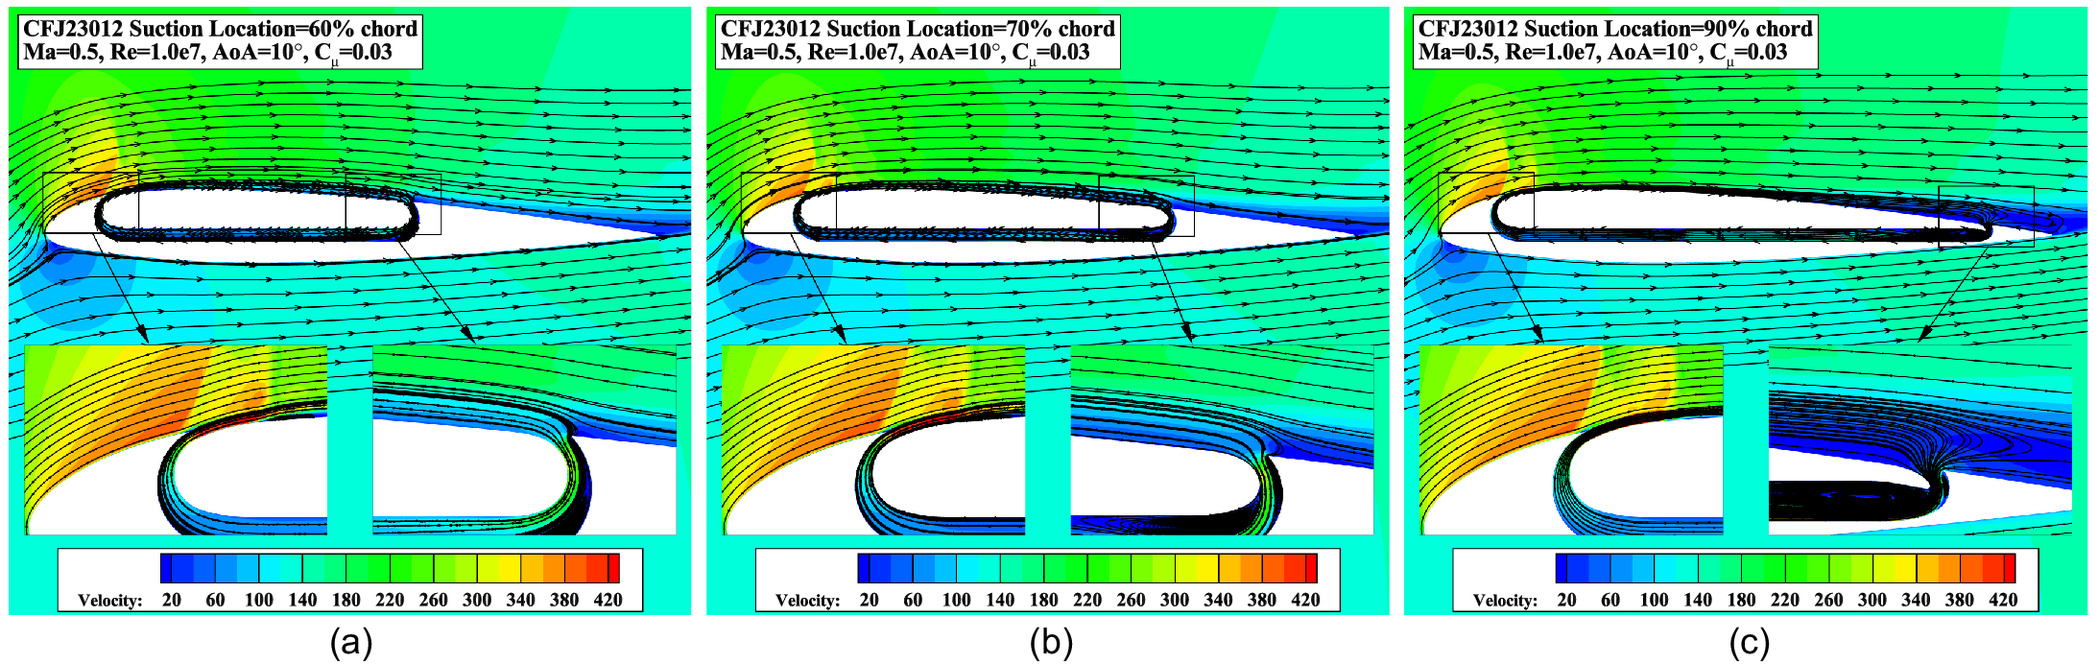
Pressure coefficient distribution comparisons of CFJ 23012 with different suction locations are shown in Fig. 22. It is apparent that a rear suction location results in a larger high negative pressure region on the upper surface for both Mach numbers, which is the reason why a CFJ airfoil with the suction location of 90% has the highest lift enhancement at low AoAs. Fig. 23 shows the velocity contour and streamline comparisons of CFJ 23012 airfoil with different suction locations at high AoAs. It is obvious that there is little difference around the injection orifice, and separation caused by shock-wave/boundary-layer interaction occurs. But as the suction orifice moves backwards, the CFJ fails to remove the flow separation. This phenomenon indicates that a front suction location is more efficient for flow separation control, because a front suction location can remove the separation before it becomes severe.
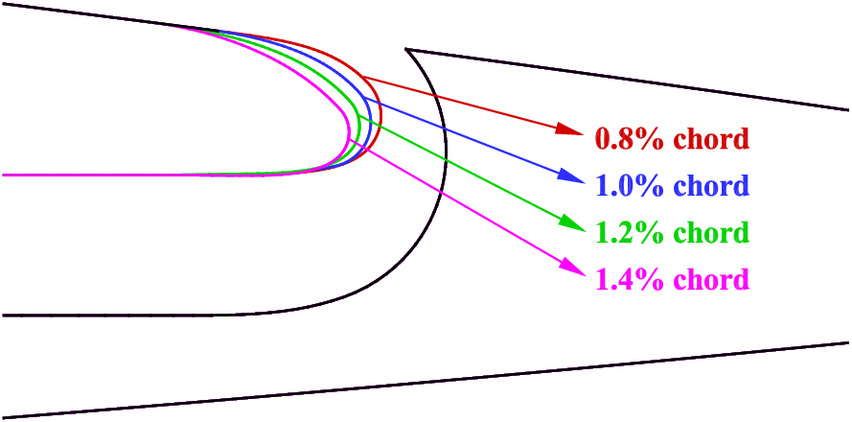
Effect of Suction Orifice Size
Four CFJ airfoils with different suction orifice sizes were designed based on the baseline CFJ 23012, with sizes of 0.8%, 1.0%, 1.2%, and 1.4% chord length, respectively (Fig. 24). Fig. 25 shows a comparison of the aerodynamic coefficients of CFJ 23012 with different suction orifice sizes. Except for high AoA conditions at Mach number 0.5, suction orifice size has a negligible impact on the aerodynamic performance of the CFJ airfoil. However, differences brought by suction orifice size are mainly shown at the power coefficient and corrected lift-to-drag coefficient. As the suction orifice become larger, decreases, resulting in higher . But the may be almost the same when the suction orifice is large enough. Therefore, larger suction orifice should be chosen with no doubt.
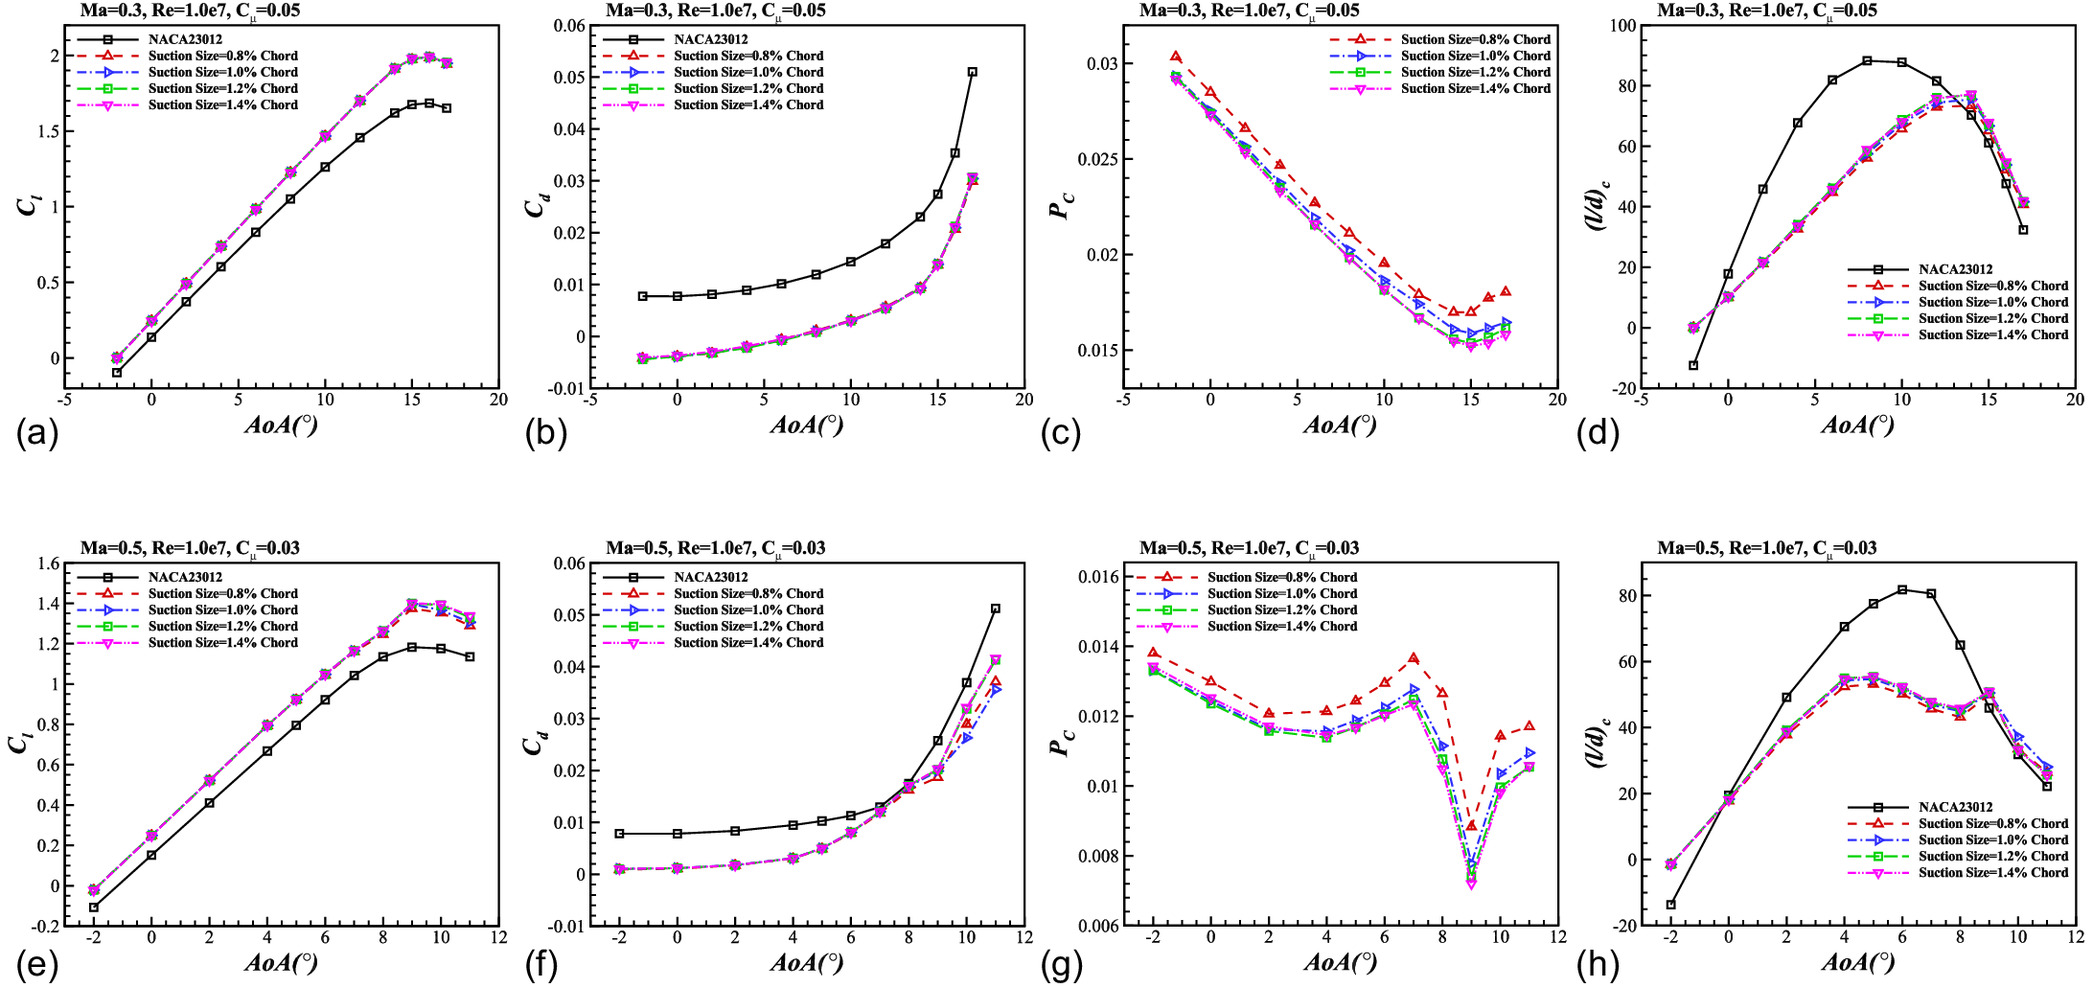
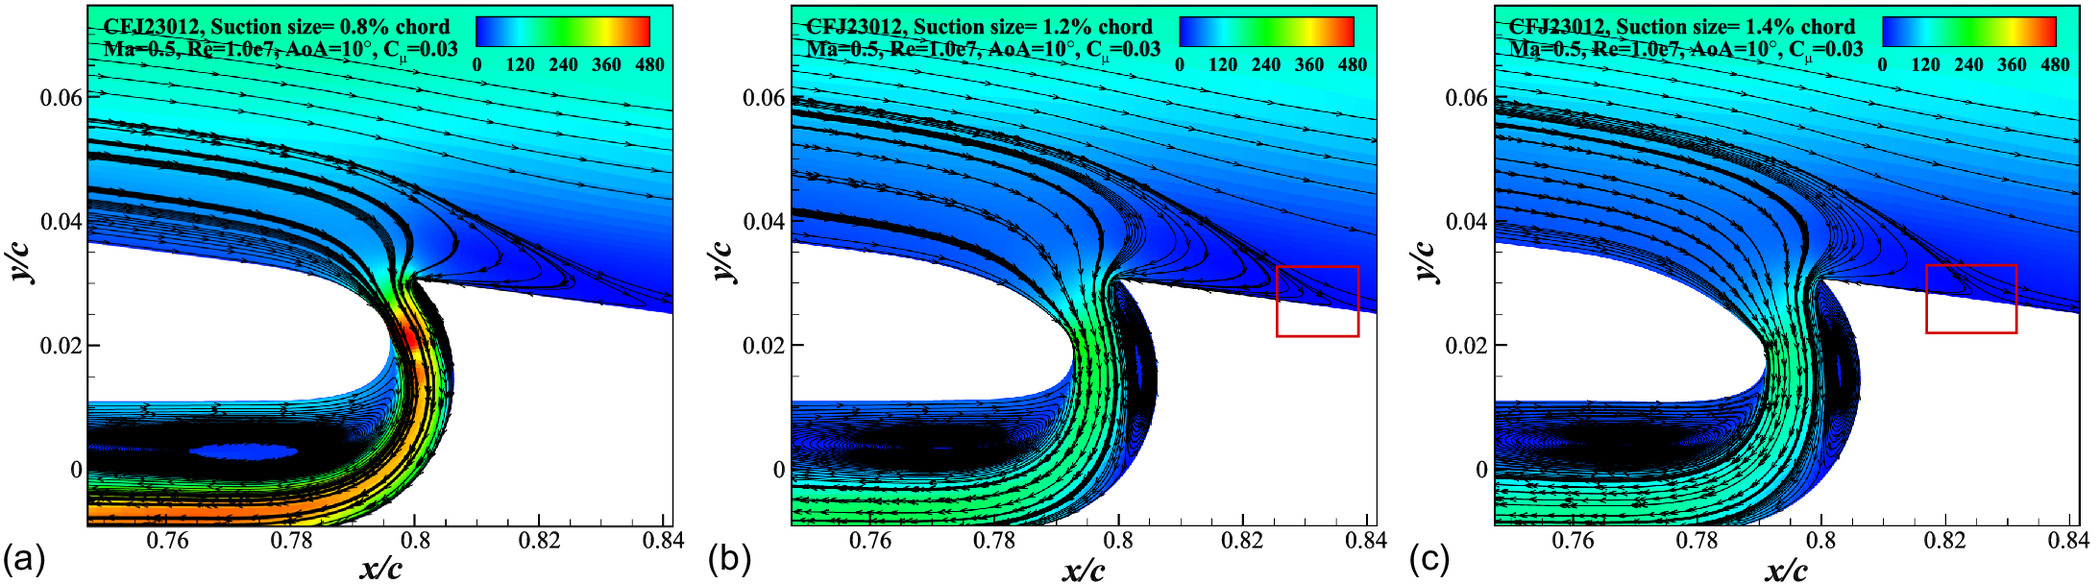
Fig. 26 illustrates the details of velocity contours around the suction orifice of CFJ 23012 at a high AoA of Mach number 0.5. The lower velocity of suction flow when the suction orifice size is 1.4% chord length demonstrates that a larger suction orifice makes the flow easier to be sucked in, which reduces the . It is also evident that there is a region of reverse flow after the suction because the airflow is insufficient to satisfy the determined mass flow, and the reverse flow region becomes smaller as the suction orifice size increases, which leads to better lift performance after stall at Mach number 0.5.
Summary of Parameter Study for CFJ Airfoil
Based on the parameter study previously described, the influence, tendency, and mechanism of injection location, suction location, injection orifice size, suction orifice size, and jet momentum coefficient have been investigated. Some parameters have significant effects on aerodynamic performance improvement, while others may only have a little influence in certain circumstances.
The injection location is the most important geometric parameter for CFJ airfoils in subsonic flow. As the Mach number and AoA increase, interactions between the supersonic region and jet flow are the most prominent factor for performance improvement. The proper location of injection is just downstream of the supersonic region and shock wave, which can prevent severe increases of drag and energy consumption, and suppresses the separation caused by shock-wave/boundary-layer interaction.
The injection orifice size and jet momentum coefficient are related and influential parameters. A small injection orifice improves the lift and drag performance with high and low , but a large injection orifice leads to separation under constant . So a moderate injection orifice size is needed. The jet momentum coefficient faces a similar situation, but as a controllable parameter, the strategy of varying for different AoAs can achieve high at most conditions. Furthermore, to keep sufficient energy transfer at high AoA from jet flow to main flow, the should increase for CFJ airfoil with a large injection orifice.
Moving the suction location has some influence on the lift, drag, and energy consumption, but when these changes are reflected in the , they offset each other. But a front suction location has advantages in removing separation before it develops at a high AoA. The suction orifice size is the least influential parameter, but a larger suction orifice can alleviate a lack of mass flow, suppress separation, and reduce energy consumption to some extent at high AoA.
Comparison between Baseline CFJ 23012 and Optimized CFJ 23012
In reference to the results of the parameter study, two optimized CFJ 23012 airfoils are designed for Mach numbers 0.3 and 0.5, respectively, to achieve better aerodynamic efficiency, which means lower energy consumption and higher corrected lift-to-drag ratio. Numerical simulations are performed to validate some of the assumptions proposed in previous sections. Table 9 shows the detailed geometric parameters.
| CFJ parameters | Detail value | |
|---|---|---|
| Injection location | 2% chordwise | 15% chordwise |
| Injection orifice size | 0.8% chord length | 0.7% chord length |
| Suction location | 70% chordwise | 70% chordwise |
| Suction orifice size | 1.6% chord length | 1.6% chord length |
| Jet momentum coefficient | 0.06, 0.07, 0.08 | 0.03, 0.04, 0.05 |
As summarized previously, in order to prevent severe drag increase, excessive energy consumption, and flow separation caused by shock-wave/boundary-layer interaction, the proper injection location should be directly downstream of the supersonic region and shock wave. Therefore, the injection location for Mach numbers 0.3 and 0.5 are set to 2% and 15% chordwise, respectively, which are in reference to the shock wave location of baseline NACA23012 airfoil. Moderate injection orifice size should be chosen to balance flow separation control and energy consumption at the same time, so 0.8% and 0.7% chord length injection orifice sizes are selected for Mach number 0.3 and 0.5 conditions, respectively, which are concluded from the discussion of injection orifice size in the parameter study section. Combined with the larger injection orifice size, higher jet momentum coefficients are chosen for both optimized CFJ airfoils to maintain a velocity difference between jet flow and main flow. As for suction orifice, a 70% chordwise location is set to efficiently suppress the separation downstream of the upper surface, and 1.6% chord length suction orifice size is selected to reduce power consumption.
Comparisons of aerodynamic performance between the NACA 23012, baseline CFJ 23012, and optimized CFJ 23012 are shown in Fig. 27.
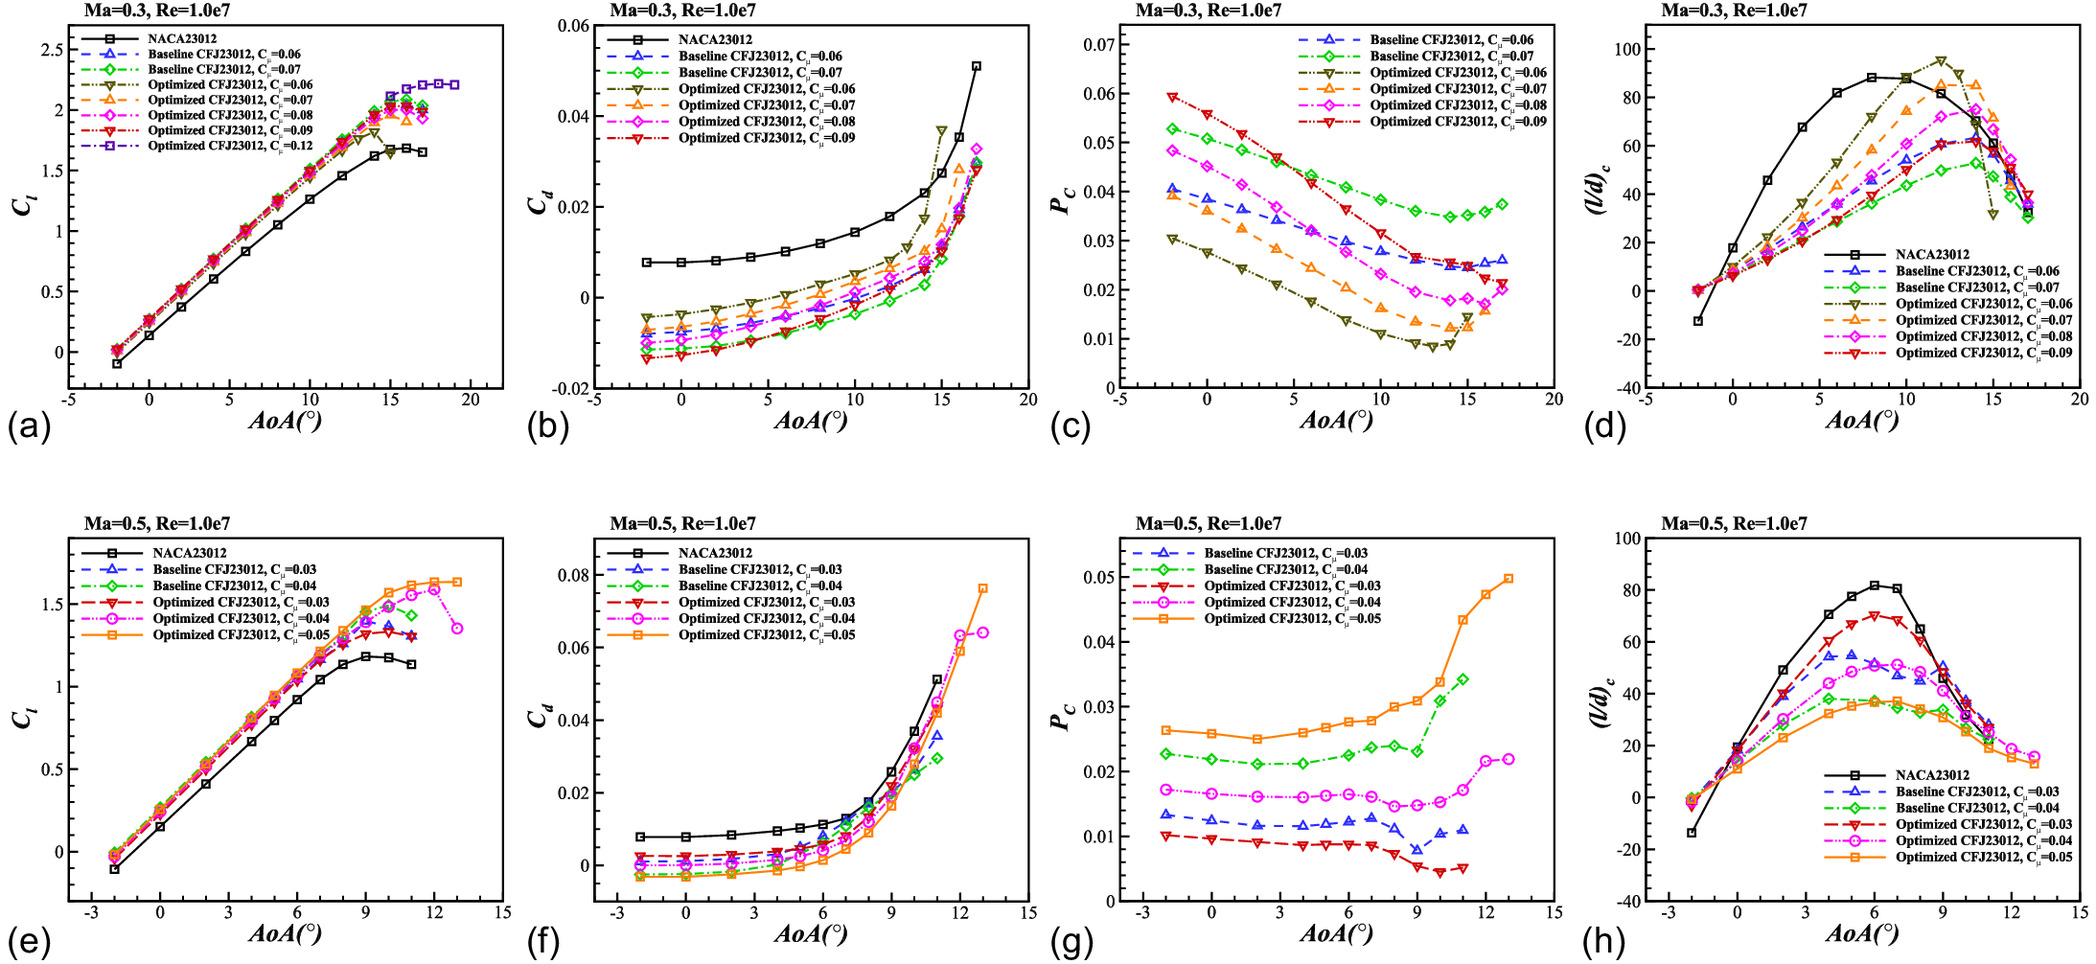
When the Mach number is 0.3, it is obvious that the lift enhancement and drag reduction effects of optimized CFJ airfoil are a little lower than the baseline with the same , resulting from the large injection orifice. However, the decreases a lot, especially at high AoAs, leading to a much higher than the baseline one. The maximum of optimized airfoil increases by 51% and 61% at of 0.06 and 0.07, respectively. The most exciting result is that the of optimized CFJ airfoil exceeds the NACA 23012 airfoil with a certain at high AoAs, which means that the CFJ airfoil can provide higher lift when the overall aerodynamic efficiency is the same. Limited by the range of studied , the optimized CFJ airfoil may have better aerodynamic efficiency at low AoAs with lower . On the other hand, to figure out whether the stall AoA of CFJ 23012 can further increase, some conditions of high AoAs at are simulated, and the results indicate that the stall AoA increases to 18°, validating the assumption proposed in previous section.
The optimized CFJ airfoil for Mach number 0.5 also achieves significant improvement. The lift enhancement of optimized CFJ 23012 is less than the baseline one with the same at low AoAs, but the maximum lift increases and the stall is delayed significantly. The enhancements of maximum lift significantly increase from 26.2% and 30.7% to 34.3% and 38.1% when are 0.04 and 0.05, respectively, and the stall AoA increases from 10° to 12° and 13°, respectively, demonstrating the advantage of optimized CFJ parameters. The drag also reduces when the AoA is between 4° and 9°. The most remarkable improvement also comes from power coefficient and corrected lift-to-drag ratio. The decreases a lot due to larger injection and suction orifices, so the optimized CFJ airfoil has higher , even at high AoAs. The maximum when increases by 28% compared to the baseline one. However, the at high AoA does not exceed the NACA 23012 like Mach number 0.3, because the increases fast after 9° when are 0.04 and 0.05.
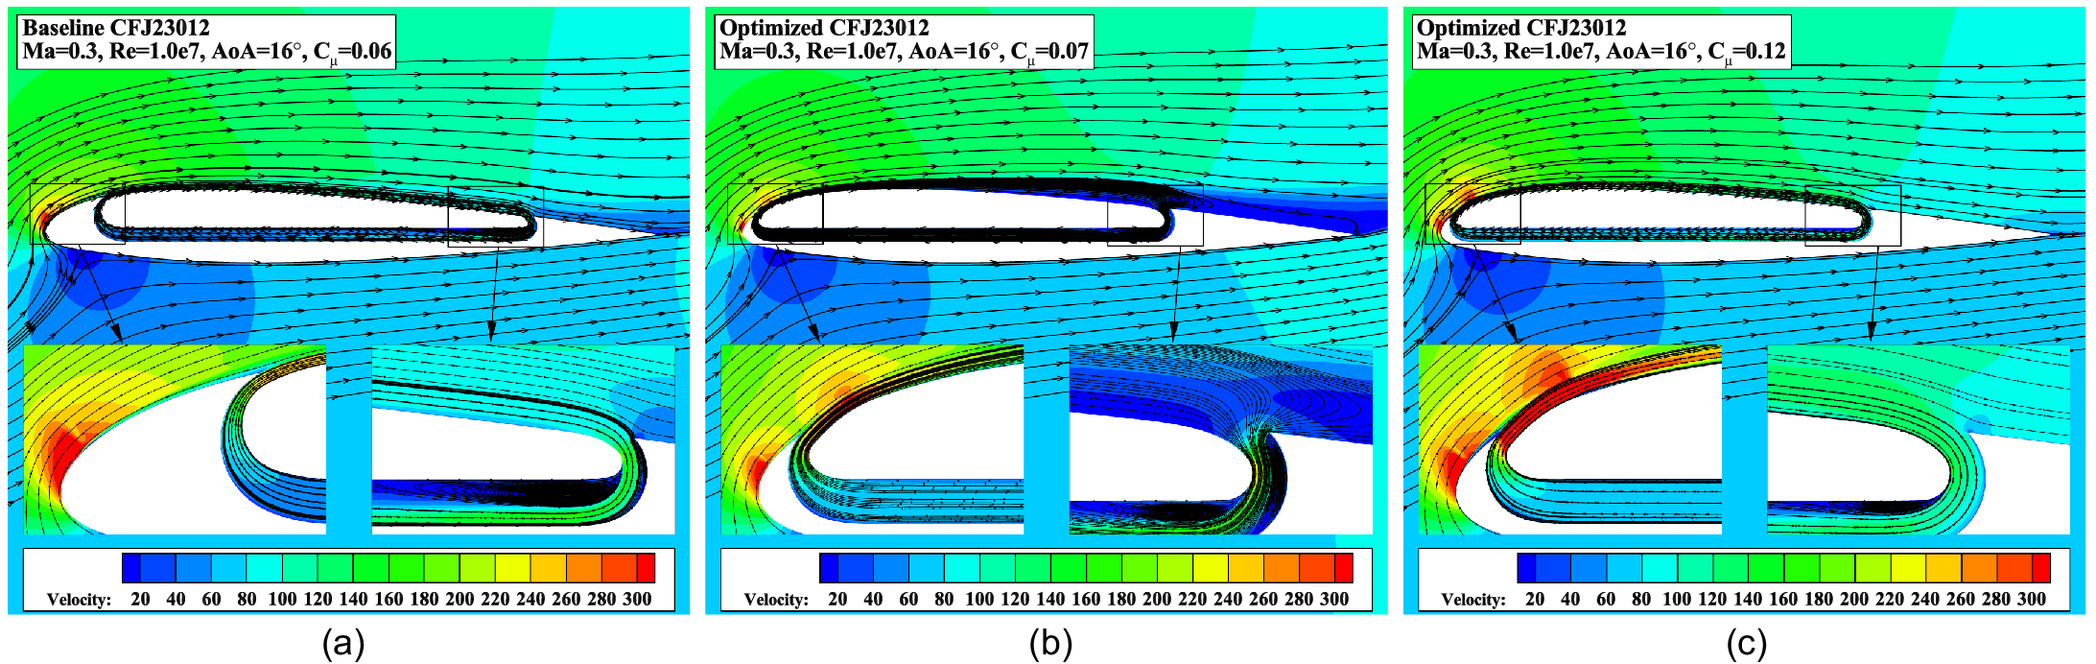
Fig. 28 depicts the velocity contour and streamline comparisons between the baseline and optimized CFJ 23012 at Mach number 0.3. It is obvious that the jet flow velocity of optimized CFJ airfoil is lower than the baseline one even with and the optimized CFJ 23012 is separated, but the flow becomes attached when increases to 0.12. The results prove that a large injection orifice should cooperate with high to keep flow attachment. Moreover, the jet flow of optimized CFJ airfoil for Mach number 0.3 is closer to the leading edge than the baseline one, and efficiently removes flow separation at high AoAs, resulting in the delay of stall.
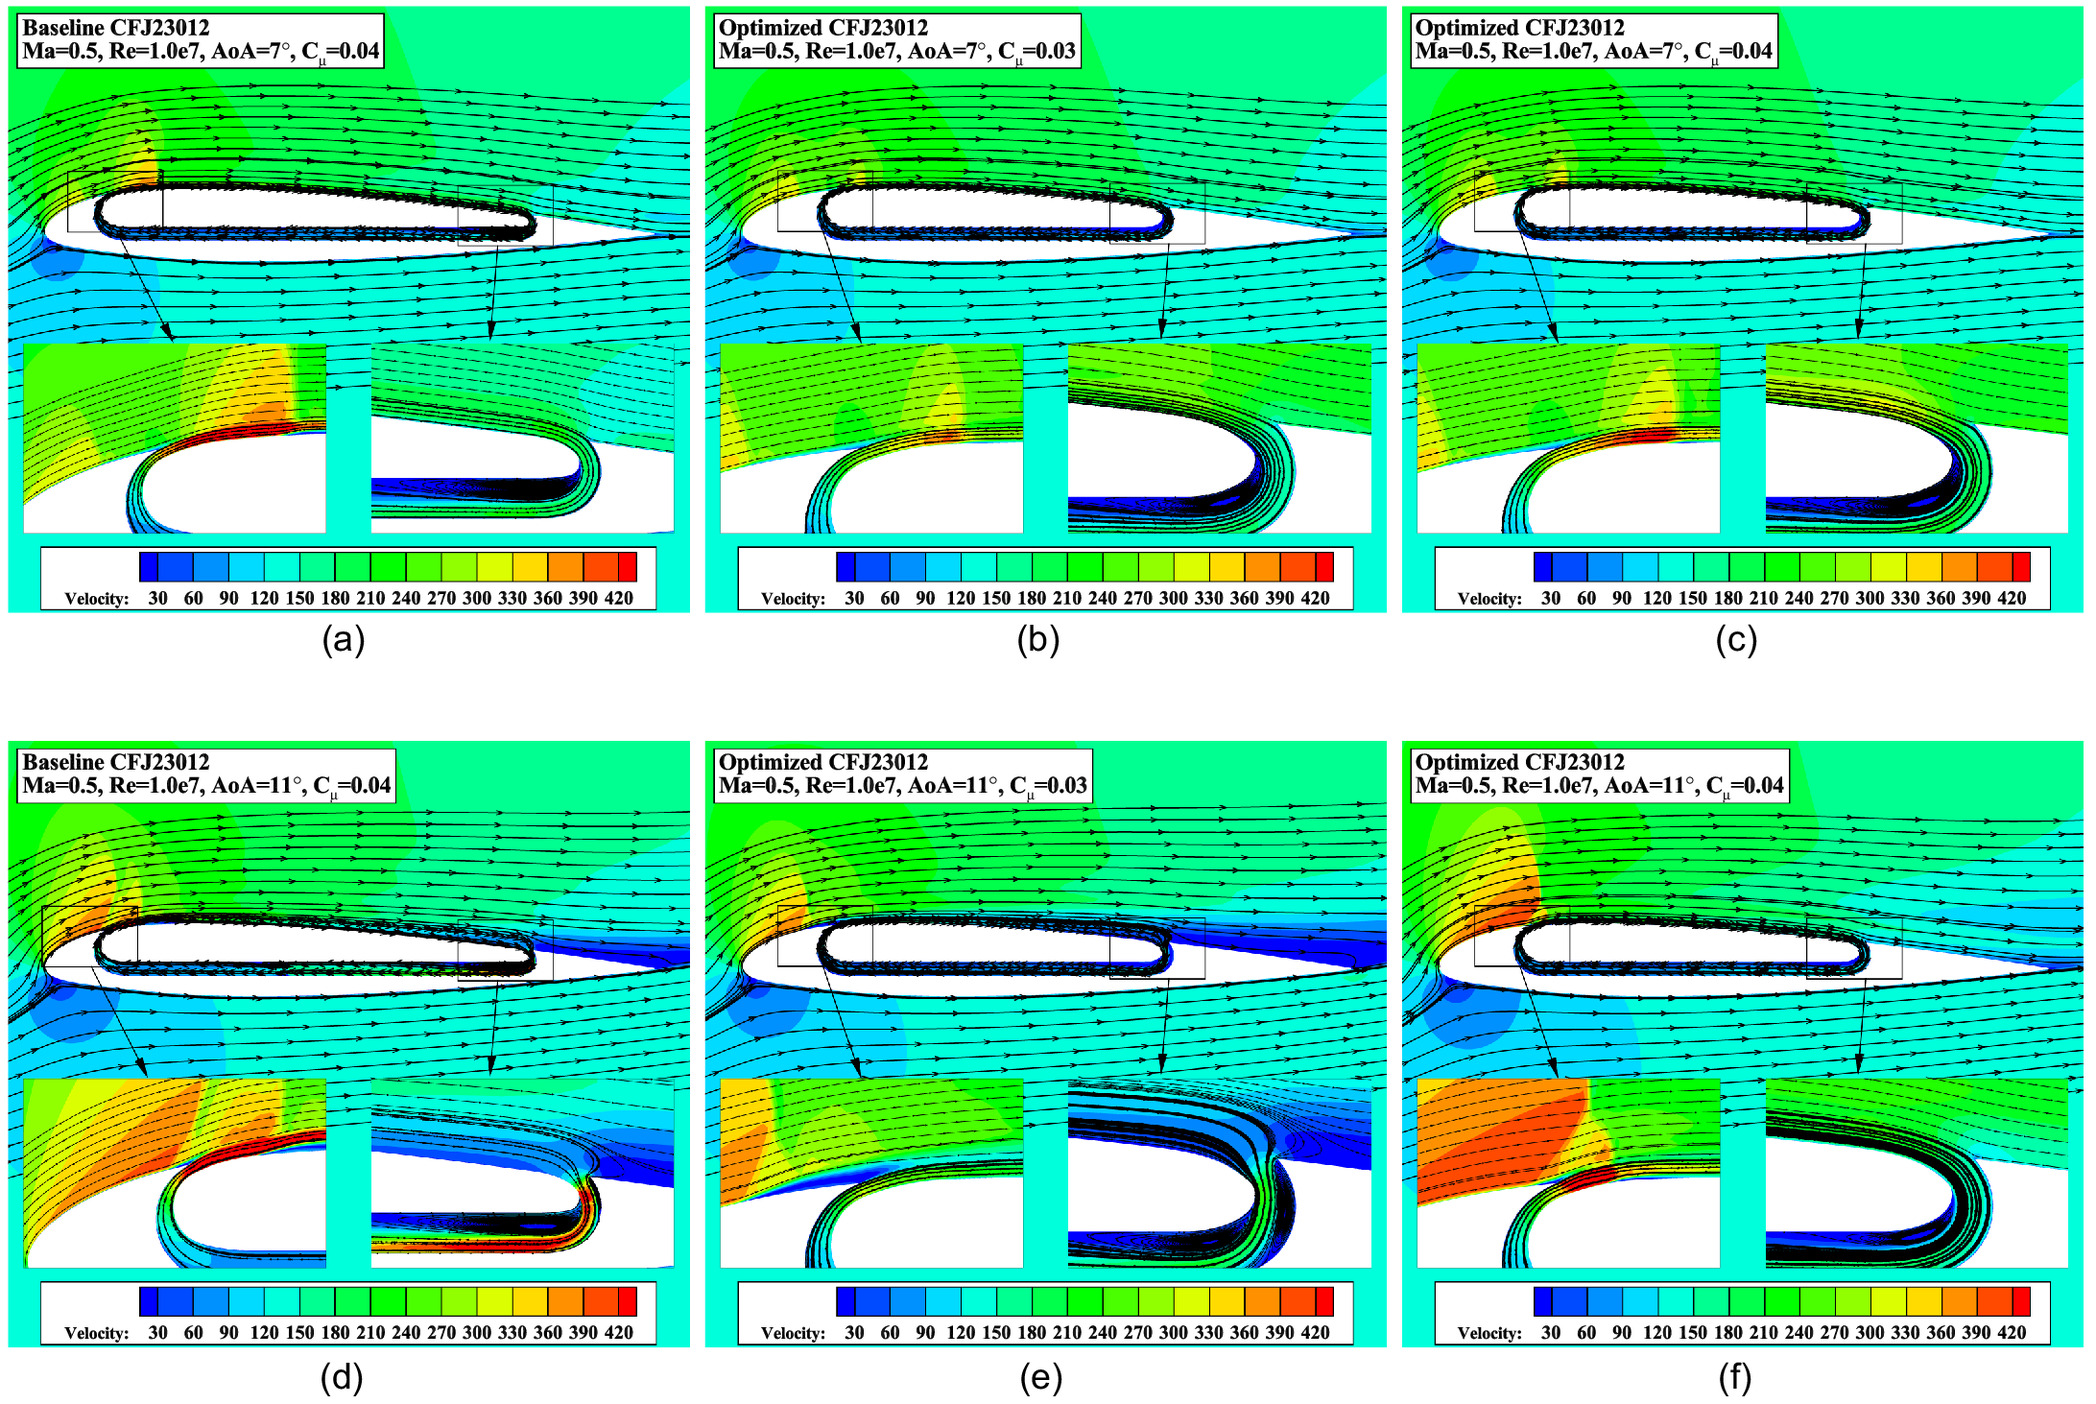
Velocity contour and streamline comparisons are shown in Fig. 29 for Mach number 0.5. When the AoA is medium as 7°, there are two shock waves for both CFJ airfoils, but it is obvious that the shock waves of the optimized one are of low intensity and there is no separation after the second shock wave. This may be the reason that the optimized CFJ airfoil has lower drag between 4° and 9°. As the AoA increases to 11°, the velocity of jet flow is low when is 0.03, which is caused by the large injection orifice, leading to separation downstream of the upper surface. But when , the jet flow removes the separation developed from shock-wave/boundary-layer interaction at the leading edge, which is the reason that an optimized CFJ airfoil has higher stall AoA than the baseline one.
Conclusions
In the present research, five major CFJ airfoil parameters are investigated at Mach numbers 0.3 and 0.5 using an improved computational model that adopts actuator disk boundary. The influence and mechanism are analyzed from the view of lift enhancement, flow separation control, and aerodynamic efficiency. Then, two optimized CFJ airfoils are designed based on the parameter study to obtain better aerodynamic efficiency and are investigated in comparison with the baseline CFJ airfoil, which validates some results of the parameter study. Some major conclusions can be summarized as follows:
•
The improved computational model using actuator disk boundary can accurately predict the aerodynamic characteristics of a CFJ airfoil.
•
The interaction between the supersonic region and jet flow is the main characteristic of CFJ airfoil in subsonic flow. Therefore, injection location is the most important geometric parameter, and placing it behind the normal shock wave can prevent the interaction, increase maximum lift, and delay stall.
•
Moderate injection orifice size is recommended to balance the energy consumption and aerodynamic performance at high AoAs. The jet momentum coefficient should cooperate with injection orifice size to achieve better improvement. Moreover, the control strategy that varies the jet momentum coefficient for different AoAs may achieve high aerodynamic efficiency as much as possible. A relatively front suction location can suppress separation efficiently, and a large suction orifice is recommended to reduce the energy consumption.
•
The overall performance of optimized CFJ airfoils is better than the baseline ones. The enhancement of maximum lift increases to more than 30% and the stall can be delayed by 3° with higher jet momentum coefficients. The corrected lift-to-drag ratios achieve remarkable improvement compared with baseline CFJ airfoils that increase by 61% and 28% at Mach numbers 0.3 and 0.5, respectively. The aerodynamic efficiency of the optimized CFJ airfoil reaches a maximum at higher AoA and even exceeds the NACA 23012 when , which means that the CFJ airfoil can provide higher lift when the overall aerodynamic efficiency is the same.
Data Availability Statement
The data that support the findings of this study are available from the corresponding author upon reasonable request.
Acknowledgments
The authors are thankful for the support from National Natural Science Foundation of China.
References
ANSYS Inc. 2009. “Ansys fluent 12.0.” In Theory guide, 67. Canonsburg, PA: ANSYS Inc.
Bragg, M., and G. Gregorek. 1987. “Experimental study of airfoil performance with vortex generators.” J. Aircr. 24 (5): 305–309. https://doi.org/10.2514/3.45445.
Dano, B., D. Kirk, and G. Zha. 2010. “Experimental investigation of jet mixing mechanism of co-flow jet airfoil.” In Proc., 5th Flow Control Conf., 4421. Reston, VA: American Institute of Aeronautics and Astronautics.
Dhakal, S., Y. Yang, G. Zha, and J. Boling. 2017. “Numerical investigation of low speed performance of transonic coflow jet airfoil.” In Proc., 35th AIAA Applied Aerodynamics Conf., 3249. Reston, VA: American Institute of Aeronautics and Astronautics.
Friedman, C., R. Arieli, and Y. Levy. 2016. “Lift build-up on circulation control airfoils.” J. Aircr. 53 (1): 231–242. https://doi.org/10.2514/1.C033304.
Horlock, J. H. 1978. Actuator disk theory-discontinuities in thermo-fluid dynamics. New York: McGraw-Hill.
Jiang, H., M. Xu, and W. Yao. 2022. “Aerodynamic shape optimization of co-flow jet airfoil using a multi-island genetic algorithm.” Phys. Fluids 34 (12): 125120.
Kanistras, K., P. C. Saka, K. P. Valavanis, and M. J. Rutherford. 2018. “Wind tunnel investigation of a circulation control wing with dual-radius flaps.” J. Aircr. 55 (4): 1731–1741. https://doi.org/10.2514/1.C034208.
Lefebvre, A., B. Dano, W. Bartow, M. Difronzo, and G. Zha. 2016. “Performance and energy expenditure of coflow jet airfoil with variation of mach number.” J. Aircr. 53 (6): 1757–1767. https://doi.org/10.2514/1.C033113.
Lefebvre, A., B. Dano, M. Difronzo, W. Bartow, and G. Zha. 2013. “Performance of a co-flow jet airfoil with variation of mach number.” In Proc., 51st AIAA Aerospace Sciences Meeting including the New Horizons Forum and Aerospace Exposition, 490. Reston, VA: American Institute of Aeronautics and Astronautics.
Lefebvre, A., and G. Zha. 2014a. “Pitching airfoil performance enhancement using co-flow jet flow control at high Mach number.” In Proc., 52nd Aerospace Sciences Meeting, 0195. Reston, VA: American Institute of Aeronautics and Astronautics.
Lefebvre, A. M., and G. Zha. 2014b. “Co-flow jet airfoil trade study part I: Energy consumption and aerodynamic efficiency.” In Proc., 32nd AIAA Applied Aerodynamics Conf., 2682. Reston, VA: American Institute of Aeronautics and Astronautics.
Lefebvre, A. M., and G. Zha. 2014c. “Co-flow jet airfoil trade study part II: Moment and drag.” In Proc., 32nd AIAA Applied Aerodynamics Conf., 2683. Reston, VA: American Institute of Aeronautics and Astronautics.
Li, B., X. Meng, S. Yin, W. Hui, and H. Li. 2022. “Flow separation control over an airfoil using plasma co-flow jet.” AIAA J. 60 (4): 2195–2206. https://doi.org/10.2514/1.J060911.
Liebeck, R. H. 1978. “Design of subsonic airfoils for high lift.” J. Aircr. 15 (9): 547–561. https://doi.org/10.2514/3.58406.
Little, J., K. Takashima, M. Nishihara, I. Adamovich, and M. Samimy. 2012. “Separation control with nanosecond-pulse-driven dielectric barrier discharge plasma actuators.” AIAA J. 50 (2): 350–365. https://doi.org/10.2514/1.J051114.
Liu, J., R. Chen, Y. You, and Z. Shi. 2022. “Numerical investigation of dynamic stall suppression of rotor airfoil via improved co-flow jet.” Chin. J. Aeronaut. 35 (3): 169–184. https://doi.org/10.1016/j.cja.2021.07.041.
Liu, Z., and G. Zha. 2016. “Transonic airfoil performance enhancement using co-flow jet active flow control.” In Proc., 8th AIAA Flow Control Conf., 3472. Reston, VA: American Institute of Aeronautics and Astronautics.
McDonald, P. C. M., and M. Firmin. 1979. Airfoil RAE 2822-pressure distributions, and boundary layer wake measurements. AGARD AR-138. Washington, DC: National Aeronautics and Space Administration.
Meredith, P. 1993. “Viscous phenomena affecting high-life systems and suggestions for future CFD development.” In Proc., High-Lift System Aerodynamics, 515. Tokyo: Japan Science and Technology Agency.
Monastero, M. C., A. M. Lindstrom, and M. Amitay. 2019. “Effect of synthetic jets spacing on flow separation over swept, flapped airfoils.” AIAA J. 57 (11): 4670–4683. https://doi.org/10.2514/1.J058304.
Morgenstern, J., N. Norstrud, M. Stelmack, and P. Jha. 2010. “Advanced concept studies for supersonic commercial transports entering service in 2030-35 (n+ 3).” In Proc., 28th AIAA Applied Aerodynamics Conf., 5114. Reston, VA: American Institute of Aeronautics and Astronautics.
Noonan, K. 1991. Aerodynamic characteristics of a rotorcraft airfoil designed for the tip region of a main rotor blade, NASA TM-4264. Washington, DC: National Aeronautics and Space Administration.
Patel, M. P., Z. H. Sowle, T. C. Corke, and C. He. 2007. “Autonomous sensing and control of wing stall using a smart plasma slat.” J. Aircr. 44 (2): 516–527. https://doi.org/10.2514/1.24057.
Smith, B. L., and A. Glezer. 1998. “The formation and evolution of synthetic jets.” Phys. Fluids 10 (9): 2281–2297. https://doi.org/10.1063/1.869828.
Somers, D. M. 1981. Design and experimental results for a flapped natural-laminar-flow airfoil for general aviation applications. Washington, DC: National Aeronautics and Space Administration.
Sun, Z., Z. Shi, W. Zhang, Q. Sun, Q. Sun, and Z. Li. 2022. “Numerical investigation on flow control of a hypersonic airfoil by plasma synthetic jet.” J. Aerosp. Eng. 35 (5): 04022071. https://doi.org/10.1061/(ASCE)AS.1943-5525.0001467.
Vigneswaran, C., and G. VishnuKumar. 2023. “Computational analysis of influence of cfj components on aerodynamic performance.” Phys. Fluids 35 (9): 093619. https://doi.org/10.1063/5.0173427.
Wang, L., and L.-H. Feng. 2020. “The interactions of rectangular synthetic jets with a laminar cross-flow.” J. Fluid Mech. 899 (Dec): A32. https://doi.org/10.1017/jfm.2020.430.
Wang, Y., and G. Zha. 2019. “Study of mach number effect for 2D co-flow jet airfoil at cruise conditions.” In Proc., AIAA Aviation 2019 Forum, 3169. Reston, VA: American Institute of Aeronautics and Astronautics.
Wang, Y., and G. Zha. 2020. “Study of mach number effect for 3d co-flow jet wings at cruise conditions.” In Proc., AIAA Scitech 2020 Forum, 0045. Reston, VA: American Institute of Aeronautics and Astronautics.
Whitcomb, R. T. 1976. A design approach and selected wind tunnel results at high subsonic speeds for wing-tip mounted winglets. Washington, DC: National Aeronautics and Space Administration.
Xu, H.-Y., C.-L. Qiao, and Z.-Y. Ye. 2016. “Dynamic stall control on the wind turbine airfoil via a co-flow jet.” Energies 9 (6): 429. https://doi.org/10.3390/en9060429.
Xu, K., and G. Zha. 2020. “Investigation of coflow jet active flow control for wind turbine airfoil.” In Proc., AIAA Aviation 2020 Forum, 2942. Reston, VA: American Institute of Aeronautics and Astronautics.
Xu, K., and G. Zha. 2021. “High control authority three-dimensional aircraft control surfaces using coflow jet.” J. Aircr. 58 (1): 72–84. https://doi.org/10.2514/1.C035727.
Xu, K., and G. Zha. 2023. “Enhancing aircraft control surface effectiveness by co-flow jet flap at low energy expenditure.” Aerosp. Sci. Technol. 133 (May): 108145. https://doi.org/10.1016/j.ast.2023.108145.
Xu, K., J. Zhang, and G. Zha. 2019. “Drag minimization of co-flow jet control surfaces at cruise conditions.” In Proc., AIAA Scitech 2019 Forum, 1848. Reston, VA: American Institute of Aeronautics and Astronautics.
Zha, G., W. Gao, and C. Paxton. 2006. “Numerical simulation of co-flow jet airfoil flows.” In Proc., 44th AIAA Aerospace Sciences Meeting and Exhibit, 1060. Reston, VA: American Institute of Aeronautics and Astronautics.
Zha, G.-C., B. F. Carroll, C. D. Paxton, C. A. Conley, and A. Wells. 2007. “High-performance airfoil using coflow jet flow control.” AIAA J. 45 (8): 2087–2090. https://doi.org/10.2514/1.20926.
Zha, G.-C., and C. Paxton. 2004. “A novel airfoil circulation augment flow control method using co-flow jet.” In Proc., 2nd AIAA Flow Control Conf., 2208. Reston, VA: American Institute of Aeronautics and Astronautics.
Zhang, S., X. Yang, and B. Song. 2021a. “Numerical investigation of performance enhancement of the s809 airfoil and phase vi wind turbine blade using co-flow jet technology.” Energies 14 (21): 6933. https://doi.org/10.3390/en14216933.
Zhang, S., X. Yang, B. Song, Z. Li, and B. Wang. 2021b. “Experimental investigation of lift enhancement and drag reduction of discrete co-flow jet rotor airfoil.” Appl. Sci. 11 (20): 9561. https://doi.org/10.3390/app11209561.
Zhang, S., X. Yang, B. Song, B. Wang, and Z. Li. 2021c. “Experimental investigation of lift enhancement and drag reduction of rotor airfoil using co-flow jet concept.” Adv. Aeronaut. Sci. Eng. 12 (4): 44–51.
Zhu, Z., T. Xiao, H. Zhi, S. Deng, and Yu. Lu. 2022. “Aerodynamic characteristics of co-flow jet wing with simple high-lift devices.” Chin. J. Aeronaut. 35 (10): 67–83. https://doi.org/10.1016/j.cja.2022.03.008.
Information & Authors
Information
Published In

Journal of Aerospace Engineering
Volume 38 • Issue 1 • January 2025
Copyright
This work is made available under the terms of the Creative Commons Attribution 4.0 International license, https://creativecommons.org/licenses/by/4.0/.
History
Received: Aug 20, 2023
Accepted: Apr 23, 2024
Published online: Sep 23, 2024
Published in print: Jan 1, 2025
Discussion open until: Feb 23, 2025
Authors
Metrics & Citations
Metrics
Citations
Download citation
If you have the appropriate software installed, you can download article citation data to the citation manager of your choice. Simply select your manager software from the list below and click Download.