Aeroelastic Design-Space Exploration for Gust-Energy Harvesting
Publication: Journal of Aerospace Engineering
Volume 36, Issue 5
Abstract
Research into gust interactions has shown significant potential for extracting energy from the atmosphere. Notably, improvements to gust-energy extractions have been shown to be possible through aeroelastic tailoring. The present work uses a design-space exploration to quantify specific structural parameters that provide the greatest energy gains from discrete and continuous gust fields. Using a genetic algorithm and full-factorial parametric sweep, wing configurations that are stiff in bending but flexible in torsion were identified to provide the best energy gains for sinusoidal and 1-cosine gusts. These designs were also subjected to a continuous von Kármán gust field, showing the same trends as the discrete profiles. The influence of the elastic and mass axis locations was shown to be much weaker on the energy gain than the stiffness parameters. Overall, energy gains relative to the steady-gliding flight performance of the aircraft of 15% were shown to be achievable through aeroelastic tailoring.
Introduction
Smaller aircraft such as general aviation aircraft, sailplanes and many small uncrewed aerial vehicles (sUAVs) typically operate in the gusty environments of the lower atmosphere. Gusts have been shown to provide noticeable benefits to the aircraft performance, as evidenced in early work from Phillips (1975) and Mai (1985). The impact of gusts on the aircraft performance must, thus, be carefully considered in all aspects of the design process. Understanding the mechanisms for gust-energy extractions and how they can be exploited to improve aerodynamic performance is important to advance the best practices for aircraft design.
Gust-Energy Extraction
Atmospheric gusts themselves have energy, which can be characterized by both their kinetic and potential energies. Considering a small altitude band of the atmosphere where gusts exist, the potential energy changes within the airmass are negligible; the total energy of a moving airmass is thus only described by its kinetic energy. Consider an aircraft traversing through a vertical atmospheric gust, the gust transfers energy to the aircraft, visible in two forms: the aircraft’s potential and kinetic energy changes. Potential energy changes occur due to the increase in altitude the aircraft experiences; an example of potential energy changes is a sailplane encountering an atmospheric updraft known as a thermal. Other potential energy changes in the aircraft occur through changes in its elastic energy, which are, however, negligible in comparison with other energy changes. Kinetic energy changes manifest themselves as velocity changes as the aircraft proceeds through the length of the gust.
The magnitude of the energy change a gust creates is related to the work done by the gust on the aircraft. An upward gust tilts the lift vector forward, as pictured in Fig. 1, creating a component of the lift vector that acts parallel to the flight direction. This lift component performs positive work on the aircraft, adding to the overall energy state of the aircraft. For a downward gust, the lift vector is tilted backward, pictured in Fig. 2, creating negative work on the aircraft, in addition to the negative work from drag.
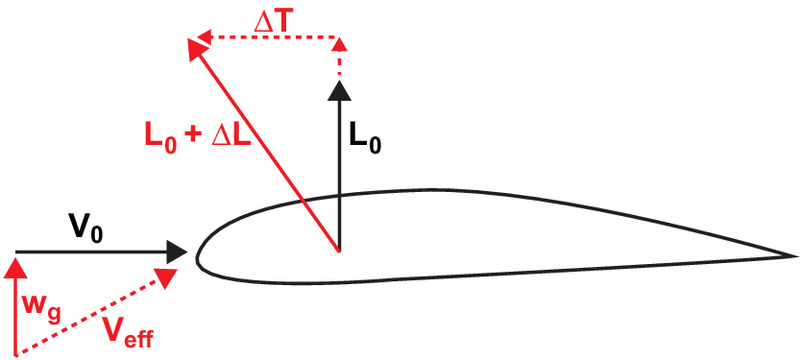
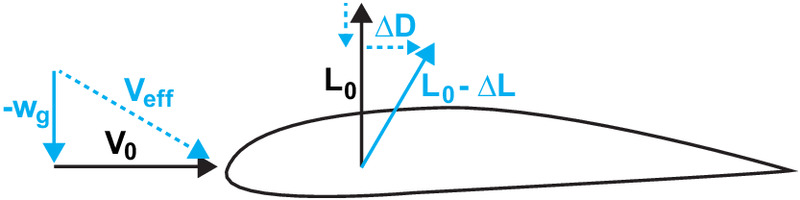
Katzmayr (1922) and Jones et al. (1998) performed experimental analysis of the thrust production mechanisms illustrated in Figs. 1 and 2. Although these analyses were limited to two dimensions, similar principles apply to wings of finite span. For an entire aircraft, the thrust that results from encountering a gust appears as a reduction in induced drag on the wing (Melville et al. 2020).
Methods of Energy Extraction
The means through which energy is extracted from a gust is broadly broken up into two approaches: active control methods and passive design methods. Active control methods are implemented through structural means or flight control systems to tailor the dynamic response of the aircraft to a given disturbance. Abdulrahim et al. (2018) utilized several instruments across the wingspan to measure structural deflections; these sensors were combined with a series of actuators to control the structural response. The advantage of active methods is that the control systems use the appropriate actuator or control surface deflection regardless of the gust profile encountered. Thus, the aircraft will always be maximizing the energy gains from a given gust. However, with the addition of several components, the energy gains from active systems come at the cost of additional weight penalties, added complexity, and increased power requirements from onboard systems.
Dynamic soaring is a subset of active energy extraction methods where careful flight path planning is used to extract energy from the atmosphere. Sachs et al. (1991), Depenbusch et al. (2018), Lissaman (2007), and Patel et al. (2009) have shown the benefits of dynamic soaring to extract energy from horizontal wind shears in the lower atmosphere. Patel et al. (2009) outlined control laws to optimize the energy extracted from atmospheric turbulence. The control laws provided an active way for the aircraft to adjust its flight dynamic response in real time to gusts or other forms of turbulence. In experiments, energy gains on the order of 30%–40% were observed using basic feedback control schemes to dictate the aircraft response to atmospheric turbulence. Additional research has been performed for energy extractions of miniaerial and microaerial vehicles, where control laws were established that provide the greatest instantaneous energy gains from a gust (Langelaan and Bramesfeld 2008; Langelaan 2009, 2011).
In addition to active methods for gust-energy exploitation, passive methods inherent to the vehicle design provide considerable advantages. Aeroelastic tailoring is a structural design method that can be used for passive energy extractions. Aeroelastic tailoring uses the directional stiffness of an aircraft structural design to control aeroelastic deformations, static or dynamic, to improve the aerodynamic and structural performance of that aircraft (Shirk et al. 1986).
Aeroelastic tailoring provides several means to achieve a desired structural response. This is relatively easily implemented with anisotropic materials, such as composites, using zone-based laminates and ply orientations. A tailoring process organizes composite laminates into regions of constant thickness and are stacked in such a way to optimize for specific criteria such as strength and buckling or to act as reinforcement for access holes to prevent local stress concentrations (Henson 2017). However, aeroelastic tailoring in the most general sense is still possible with isotropic materials by altering internal structural member positions and orientations. Francois et al. (2015) explored aeroelastic tailoring with a three-dimensional (3D) printed wing structure. The rib and spar orientations of the main wing box structure were varied, and wing deformations were recorded in wind tunnel testing. By varying the rib and spar angles in the wing structure relative to the airflow direction, those authors were able to identify rib and spar orientations that produced both twist-up and twist-down responses, as well as configurations with increased or decreased tip displacements.
Changing structural member orientations is perhaps the most simplistic approach to aeroelastic tailoring. When applying aeroelastic tailoring to a complex design problem, aerodynamic performance improvements are possible. Weisshaar et al. (1998) used aeroelastic tailoring as a means to increase the control reversal speed and reduce induced drag for UAVs. However, those authors noted the benefits of tailoring were not as evident at large structural aspect ratios. Lupp and Cesnik (2015) performed an aeroelastic optimization to maximize the average cross-country speed of a sailplane. Using a simplified ARW-1 wing for the optimization baseline, those authors found the aeroelastically tailored structure provided a nearly 10% increase in the average cross-country speed over the rigid configuration and 3% improvement over the baseline configuration. Mai (1985) and Lupp and Cesnik (2015) highlighted the importance of structural properties in the energy extraction process. Thus, one can argue that aeroelastic tailoring should be considered essential for favorable gust performance, and the effects of aeroelasticity should be considered at the earliest design stages.
Flight Dynamics and Aeroelastic Modeling of Flexible Aircraft
As aircraft designs have become more flexible with composite materials, increased research efforts have been made in incorporating aeroelastic models into existing flight dynamics models. Aerodynamic modeling for aircraft flight dynamics ranges from the use of lower-order methods such as those employing aerodynamic strip theory (Houbolt 1951; Shearer and Cesnik 2007), medium-fidelity methods such as doublet-lattice (Saltari et al. 2017) and vortex-lattice methods (Murua et al. 2012), to high-fidelity computational fluid dynamics models (Raveh 2011).
Aeroelastic models coupled with flight dynamics predictions often use nonlinear beam solvers such as those from Murua et al. (2012), Lasauskas (2016), and Otsuka et al. (2021). Nonlinear beam models provide a robust approach for modeling a wide variety of structural configurations with minimal computational effort compared with a complete computational structural dynamics model. The applications of flexible aircraft modeling has, however, often been limited to identifying and investigating the effects of aeroelastic instabilities, such as in the works of Murua et al. (2012), Dessi and Mastroddi (2008), and Munteanu et al. (2005). Although the impacts of aeroelastic instabilities are important in the aircraft design process, the current literature is lacking in providing insight into how the aircraft structure may be designed to maximize passive energy gains from gusts.
This paper presents a design-space exploration for a flexible aircraft geometry to quantify structural design trends that lead to improved gust-energy harvesting. An in-house coupled aeroelastic and flight dynamics model is used to investigate the performance of a flexible aircraft encountering atmospheric gusts via a full-factorial parametric sweep and genetic optimization. The design space is segmented into four structural parameters of interest that vary across the wingspan, namely the bending and torsional stiffness of the main wing, and its elastic and mass axis locations. The energy altitude change of the aircraft after traversing the gust and the efficiency with which the energy from the gust is harvested are used to differentiate each design configuration of interest and identify structural design characteristics that provide the greatest energy gains. Further insight is provided into how the aircraft dynamics contribute to the energy-harvesting process and key considerations that should be made to maximize the energy gains from a gust.
Methodology
The in-house model used in the present study couples a flight dynamics model with an unsteady potential flow method to capture the aerodynamic characteristics of the aircraft and a finite-difference structural model to capture the aircraft-structural dynamics. The energy extracted from an atmospheric gust is quantified using an energy metric based on the total work performed on the aircraft by the gust.
Metric for Gust-Energy Extraction Efficiency
The efficiency with which an aircraft is able to harvest energy from a specific gust field can be found knowing the actual energy-altitude change, , relative to an idealized energy-altitude gain,
(1)
The actual energy-altitude gain of the aircraft is directly related to the total energy state of the aircraft per unit weight, which includes its kinetic and potential energy:where the subscripts 0 and = conditions at the beginning and end of the gust, respectively; = aircraft velocity; = aircraft altitude; and = gravitational acceleration. The first term of Eq. (2) captures the kinetic energy change, and the second term represents the altitude change between the beginning and end of the gust. Eq. (2) can be evaluated using flight data or numerical predictions and includes the losses due to nonconservative forces.
(2)
An idealized energy transfer from gust to aircraft can be formulated assuming a rigid aircraft that traverses through a gust on a linear flight trajectory. The subsequent energy altitude gained is given as follows (Cole et al. 2022):
(3)
In essence, Eq. (3) shows the net thrust over the distance of the gust in comparison with the no-gust case. Net thrust is the difference of the lift vector tilting fore and aft, as shown in Figs. 1 and 2, and changes in induced drag as the lift vector changes in magnitude. The magnitude of the lift vector is based on the overall angle of attack, that is the steady-state and the gust-related angle of attack perturbation, and , respectively. Wing lift-curve slope, , aspect ratio (AR), and span efficiency, , account for the properties of the wing with a finite wingspan. Eq. (3) assumes 100% of the work done by the thrust component from the gust is transferred to the overall energy state of the aircraft. The energy gain computed in Eq. (3) assumes the effects of viscous drag are negligible throughout the gust (Melville et al. 2020).
Eq. (1) provides a measure to compare the effectiveness of gust-energy extractions for differing aircraft geometries or structural configurations. For example, when comparing two aircraft with different aspect ratios but otherwise identical properties that are traversing the same gust field, one would expect the higher-aspect-ratio aircraft to perform better in terms of energy altitude. The higher energy-altitude gain does, however, not necessarily mean that the higher-aspect-ratio aircraft exploits the present gust-energy potential better than the lower aspect-ratio aircraft. In contrast to the energy-altitude of Eq. (2), the gust-energy factor of Eq. (1) takes into account what the energy-transfer potential is and how much actually is transferred.
Aeroelastic Model
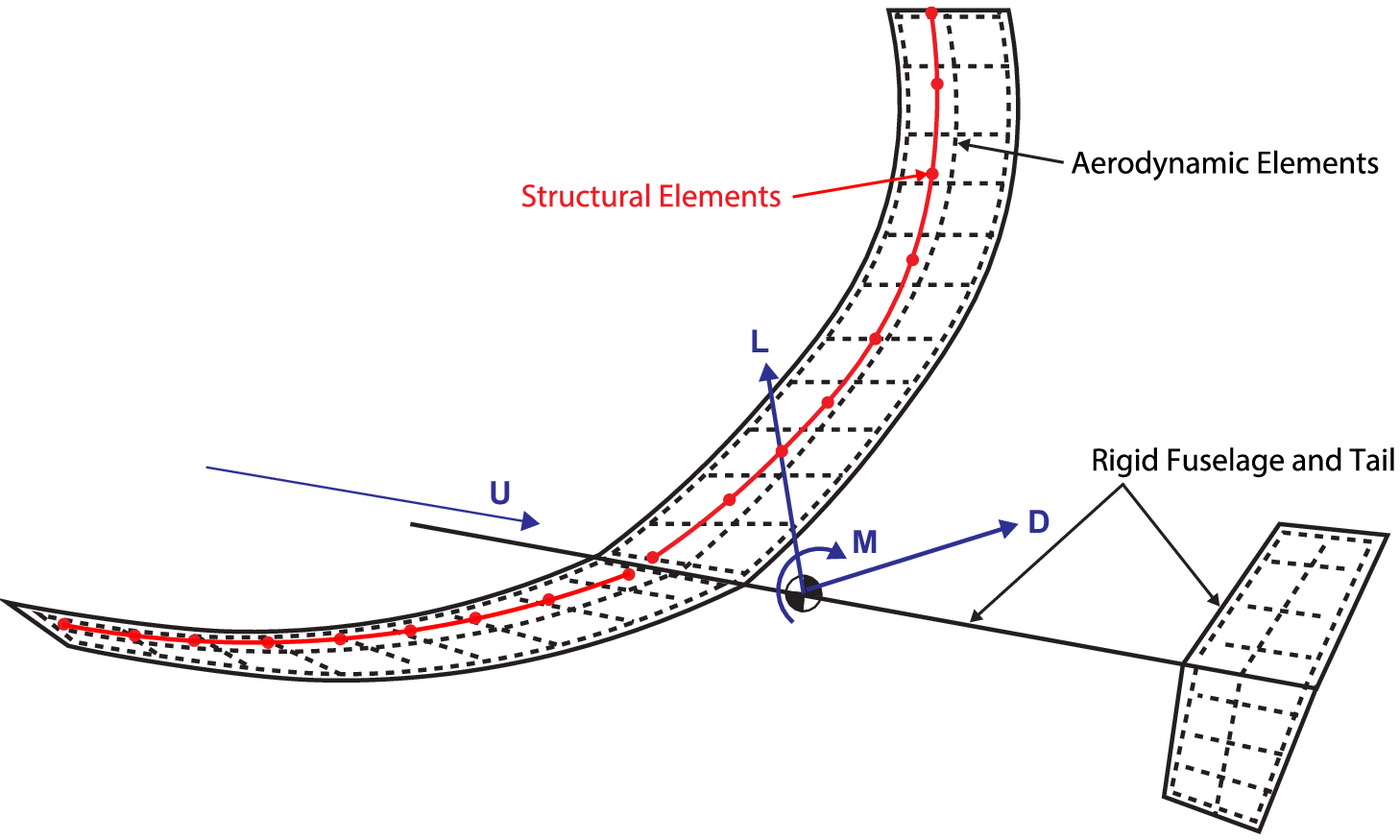
The aeroelastic model used in the current study consists of a higher-order potential flow method coupled with a finite-difference structural model. The higher-order potential flow model was first developed by Bramesfeld and Maughmer (2008) and further expanded for use in unsteady (Cole 2016) and aeroelastic applications (Melville et al. 2020). Full details about the potential flow model and its validation have been given by Bramesfeld and Maughmer (2008), Bramesfeld (2006), and Cole et al. (2020); nevertheless, a brief overview is provided here. The potential-flow solution solves the unsteady aerodynamic response of complex wing and wake geometries predicting lift and induced drag, using several spanwise and chordwise elements as pictured by the dashed lines in Fig. 3.
The unsteady lift predictions apply the unsteady Kutta-Joukowsky theorem, accounting for the effects of shed circulation and apparent mass (Cole 2016; Cole et al. 2020). The wake is modeled using a continuous vortex sheet, resulting in finite induced velocity predictions everywhere (Cole et al. 2019) and providing a robust method for induced drag predictions that agree well with Euler results (Schirra et al. 2014) and Trefftz-plane analyses (Bramesfeld and Maughmer 2008). The aerodynamic solution uses a strip method to capture aerodynamic pitching moment and profile drag based on the local airfoil geometry and Reynolds number.
The structural dynamics of the wing are approximated as a thin cantilevered Euler-Bernoulli beam, shown in Fig. 3, that undergoes coupled bending and torsion (Ironside et al. 2010), which can be modeled by several discrete spanwise nodes at which the bending and torsional stiffness and the elastic and mass axis locations are defined. Between each node, structural dynamic properties are varied using a second-order function. The thin-beam approximation holds true for most moderate- to large-aspect-ratio wings and thus is appropriate for use in the current study. The coupled response of the Euler-Bernoulli beam is numerically solved using a forward in time, centered in space (FTCS) discretization scheme. The complete details of the solution methodology have been given by Melville et al. (2020). The structural dynamics model provides a strong coupling with the aerodynamics model and has been showing to provide time-accurate bending and torsion predictions when compared with similar fidelity methods (Melville et al. 2020; Melville 2017).
Flight Dynamics
The aircraft flight dynamics are captured using the longitudinal equations of motion, following the same form to those found in Etkin and Reid (1996). The lateral equations of motion were ignored because only gusts that are symmetric about the aircraft’s longitudinal axis were considered for the present work. For each gust simulation, the flexible aircraft is trimmed to a static aeroelastic solution before traversing through the gust. The time-dependent simulation tightly couples the flight dynamics model with the aeroelastic model. At each time step, new aerodynamic forces are computed and used to update the aircraft elastic deformations. Based on the newly deformed aircraft, the new flight dynamics response is computed based on the total aerodynamic forces and moments. The flexible aircraft model provides a robust tool for predicting the dynamic motion and structural response of a flexible aircraft. Combining the aeroelastic and flight dynamic models allows one to capture the coupled bending and torsion of a flexible wing along with the vertical and pitching motion of the fuselage. Subsequently, in a gust analysis, the effects of flexibility on the flight dynamic behavior and overall aircraft performance can be quantified.
Verification
For code verification purposes, the motion of a simple aircraft geometry (Murua et al. 2012) was predicted using the in-house method and ASWing (Drela 1999). The properties of the aircraft that had a total mass of 78.25 kg are summarized in Table 1.
| Aircraft component | Property | Value |
|---|---|---|
| Main wing | Span (m) | 32 |
| Chord (m) | 1 | |
| Bending stiffness () | ||
| Torsional stiffness () | ||
| Elastic axis location () | 0.25 | |
| Mass axis location () | 0.25 | |
| Linear mass () | 0.75 | |
| Mass moment of inertia () | 0.075 | |
| Tail | Span (m) | 5 |
| Chord (m) | 0.5 | |
| X offset (m) | 10 | |
| Z offset (m) | 2.5 | |
| Bending stiffness () | ||
| Torsional stiffness () | ||
| Linear mass () | 0.45 | |
| Mass axis location () | 0.25 | |
| Fuselage | Length (m) | 10 |
| Linear mass () | 0.2 | |
| Payload mass (kg) | 50 | |
| Payload location () | 0.25 |
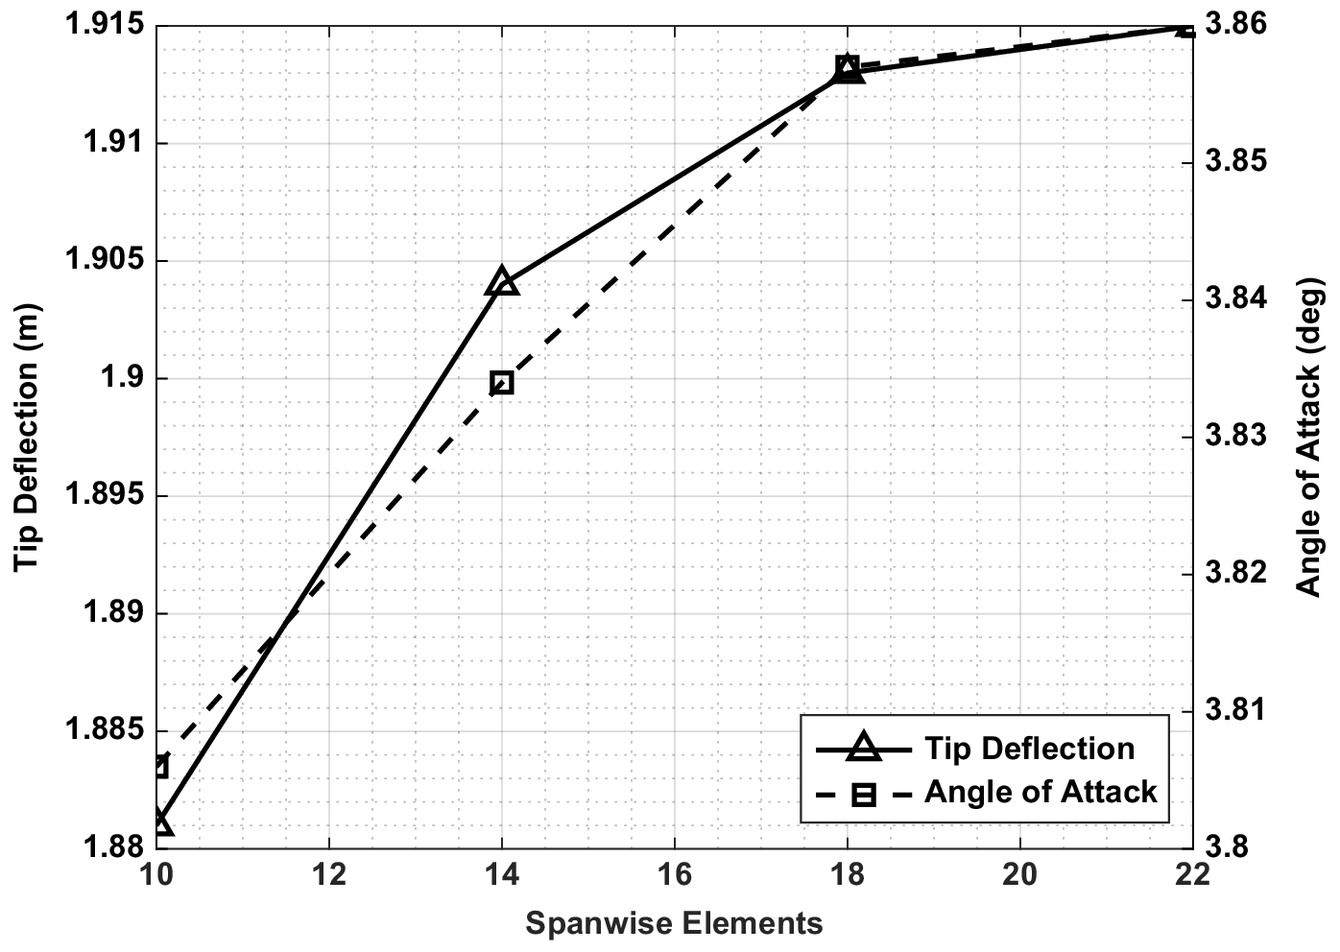
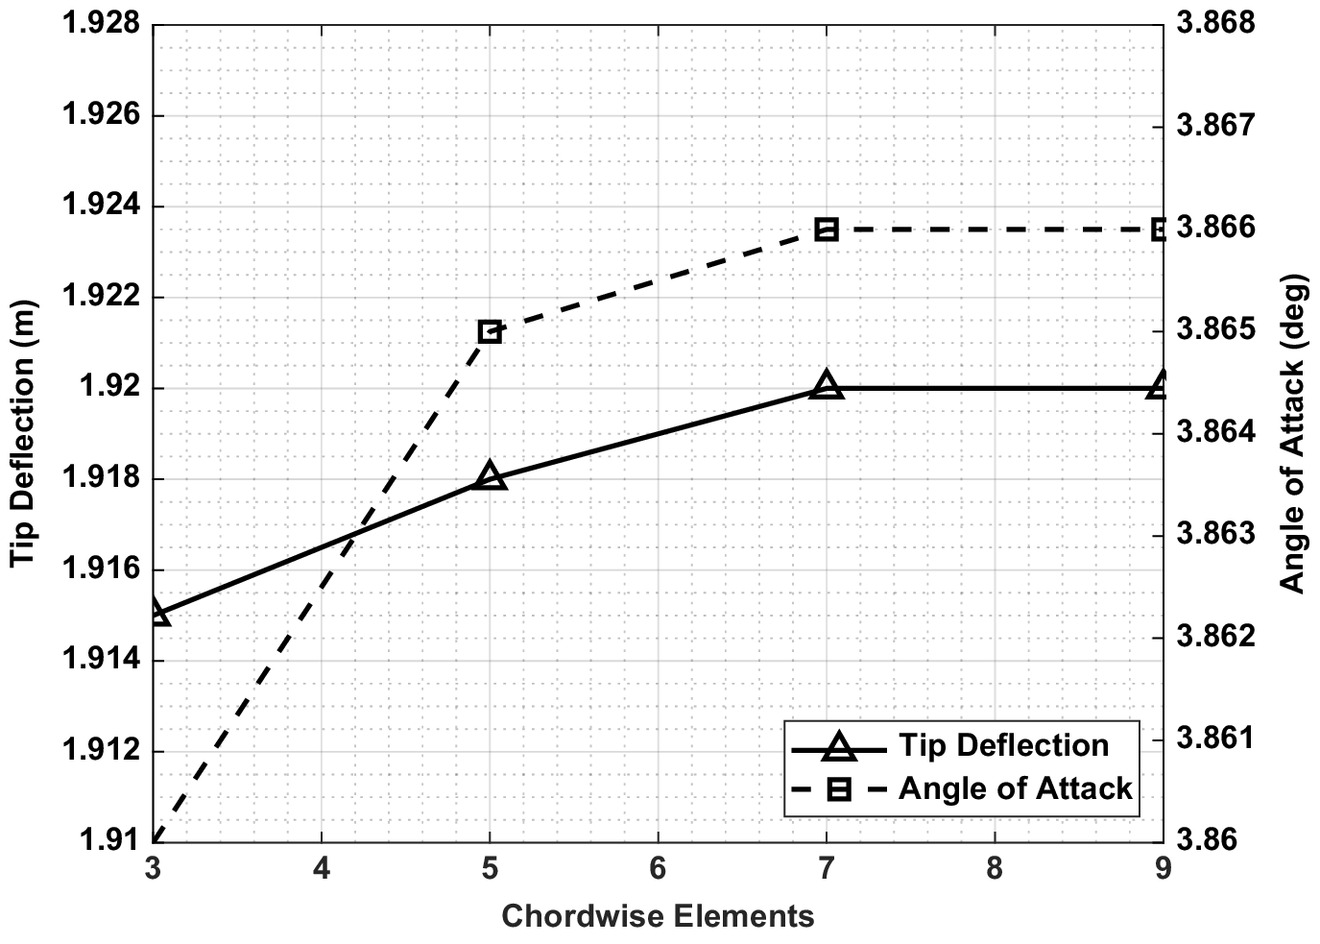
The trim conditions at a velocity of and several different wing flexibilities were compared with ASWing by varying the stiffness scaling factor, . Using a sensitivity study summarized in Figs. 4 and 5, it was thought that 22 spanwise elements (i.e., 23 structural elements) and three chordwise elements were sufficient to find acceptable convergence in trim angle of attack and wingtip deflection for .
Figs. 6–8 show a comparison between the trim states of the aircraft predicted using the present methodology and ASWing for six different wing stiffnesses. The trim angle of attack, elevator deflection, and tip deflection are plotted against ; thus, the wing flexibility increases moving from left to right across the -axis. The trim angle of attack shows excellent agreement across the entire range of wing stiffness values investigated.
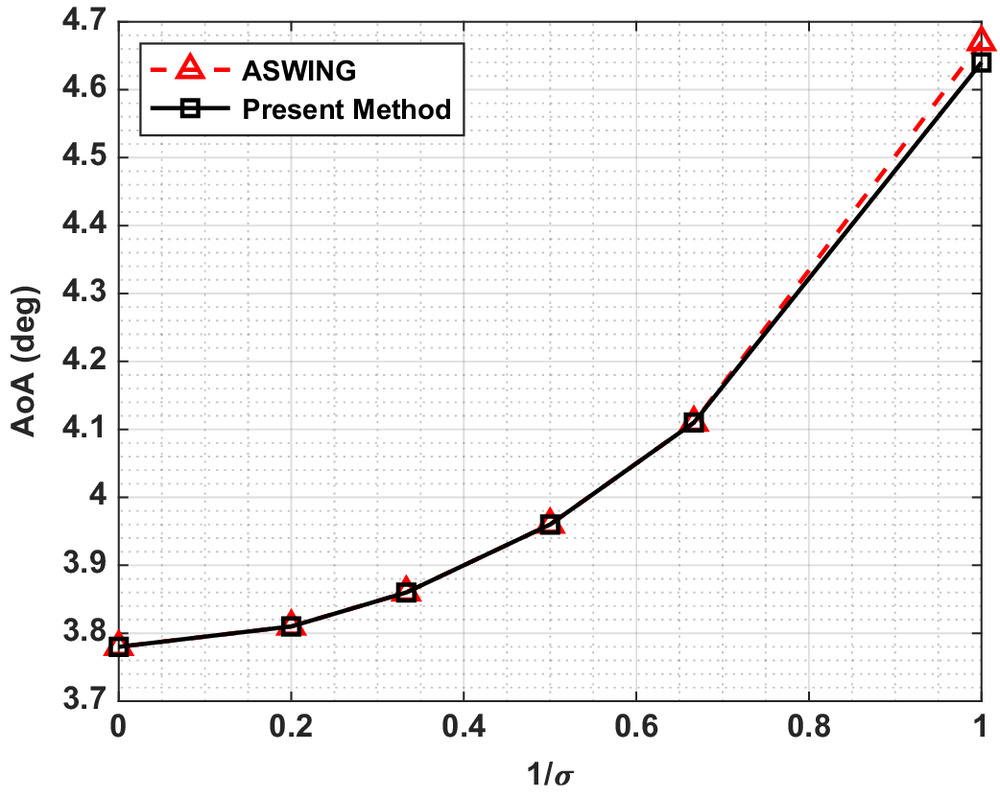
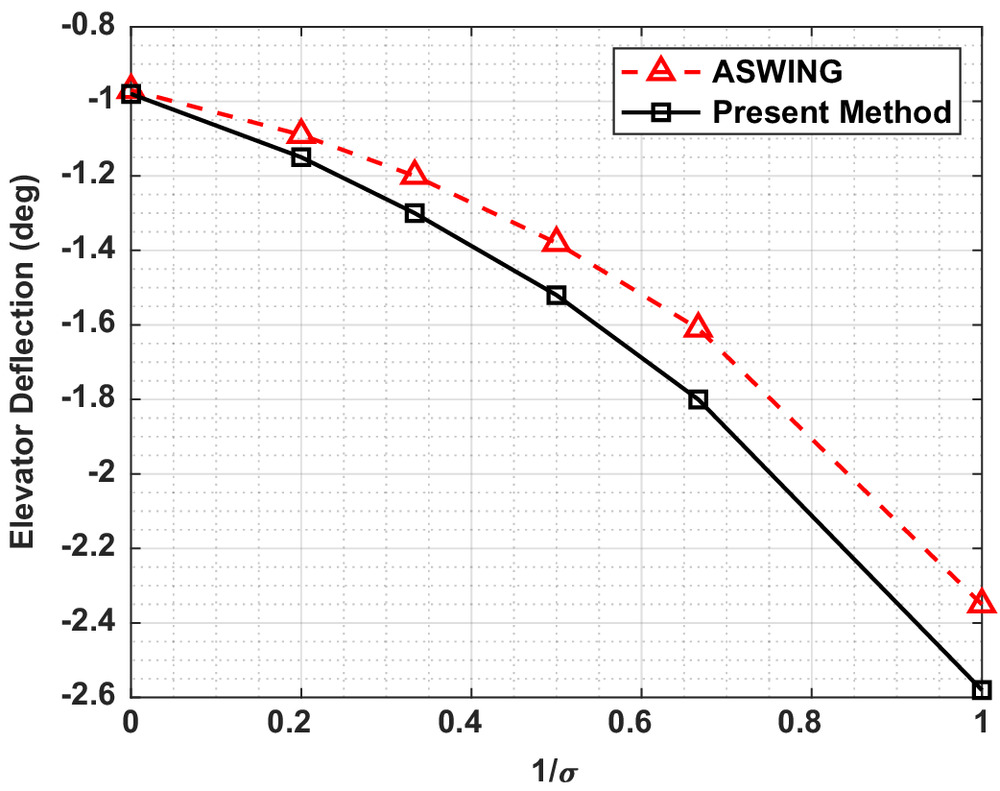
A maximum difference of 0.03° was noted in the most flexible case. The elevator angle required for trim showed good agreement, with the same trends exhibited across the entire flexibility range. An offset was observed as the wing became more flexible, with a maximum difference at the most flexible case of 0.2°. This offset is attributed to the different wake models between the present method and ASWing. ASWing uses a vortex lattice method to model the wake, with the wake aligned with the instantaneous velocity vector, whereas the wake of the present method was modeled as a continuous vortex sheet.
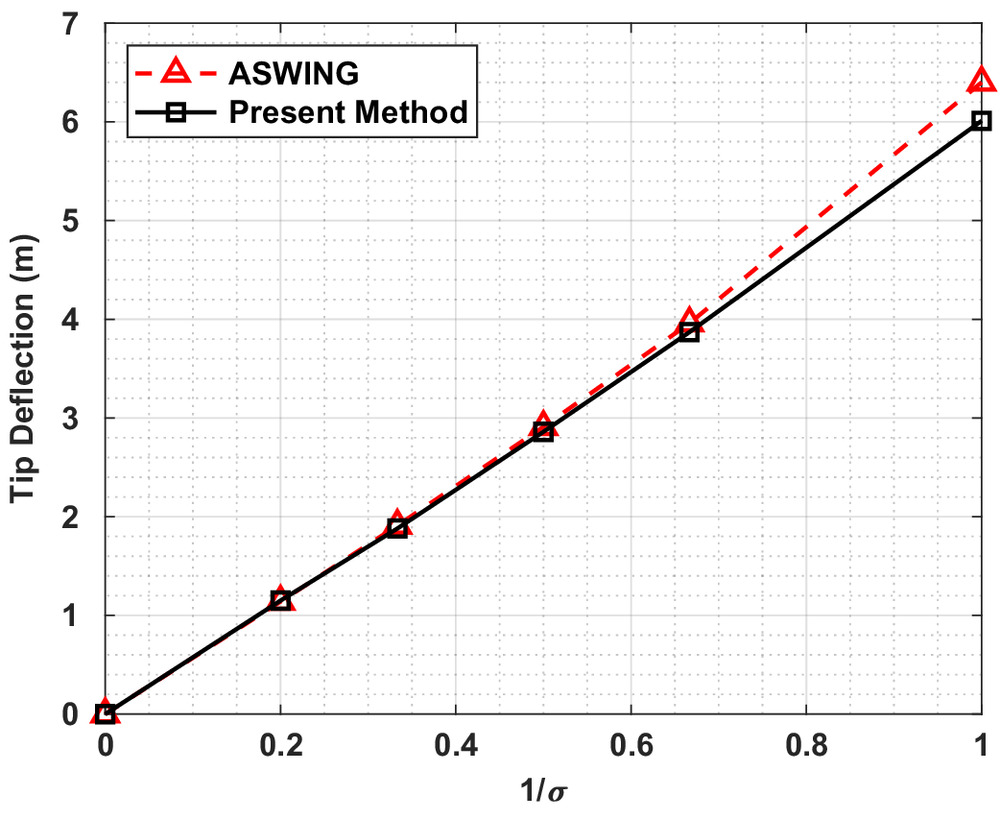
As the wing flexibility increased, the wake from the main wing increased in curvature, changing the influence of the main wing wake on the tail compared with a planar wake. Differences in the wake-induced velocities on the tail due to the different wake models likely contributed to the differing trim conditions. Nevertheless, the magnitude of these differences is small. The predicted trim tip deflection of the wing, shown in Fig. 8, agrees well with ASWing, with the largest differences seen again in the most flexible case, with a relative difference of less than 5%. The remaining range of wing stiffnesses showed minimal differences that are less than 2%.
Further verification of the flight dynamics model of the present method was performed through a gust analysis. The same aircraft described in Table 1 was used, with , and elastic axis located at . The aircraft was trimmed at an airspeed of and allowed to traverse through a 1-cosine gust. The gust has a length of 75 m and a magnitude of .
The results of the gust case are presented in Fig. 9 and show good agreement between the present method and ASWing. Slight differences were observed in the lift coefficient and tip deflection responses. The differences seen in the lift coefficient response, specifically at the peak around 6 s, can be attributed to the differences seen in the velocity response and tip deflection response in Fig. 9. Because ASWing predicts a slightly lower peak velocity as the aircraft is traversing through the gust, a larger effective angle of attack due to the gust is created, thus increasing the overall lift coefficient.
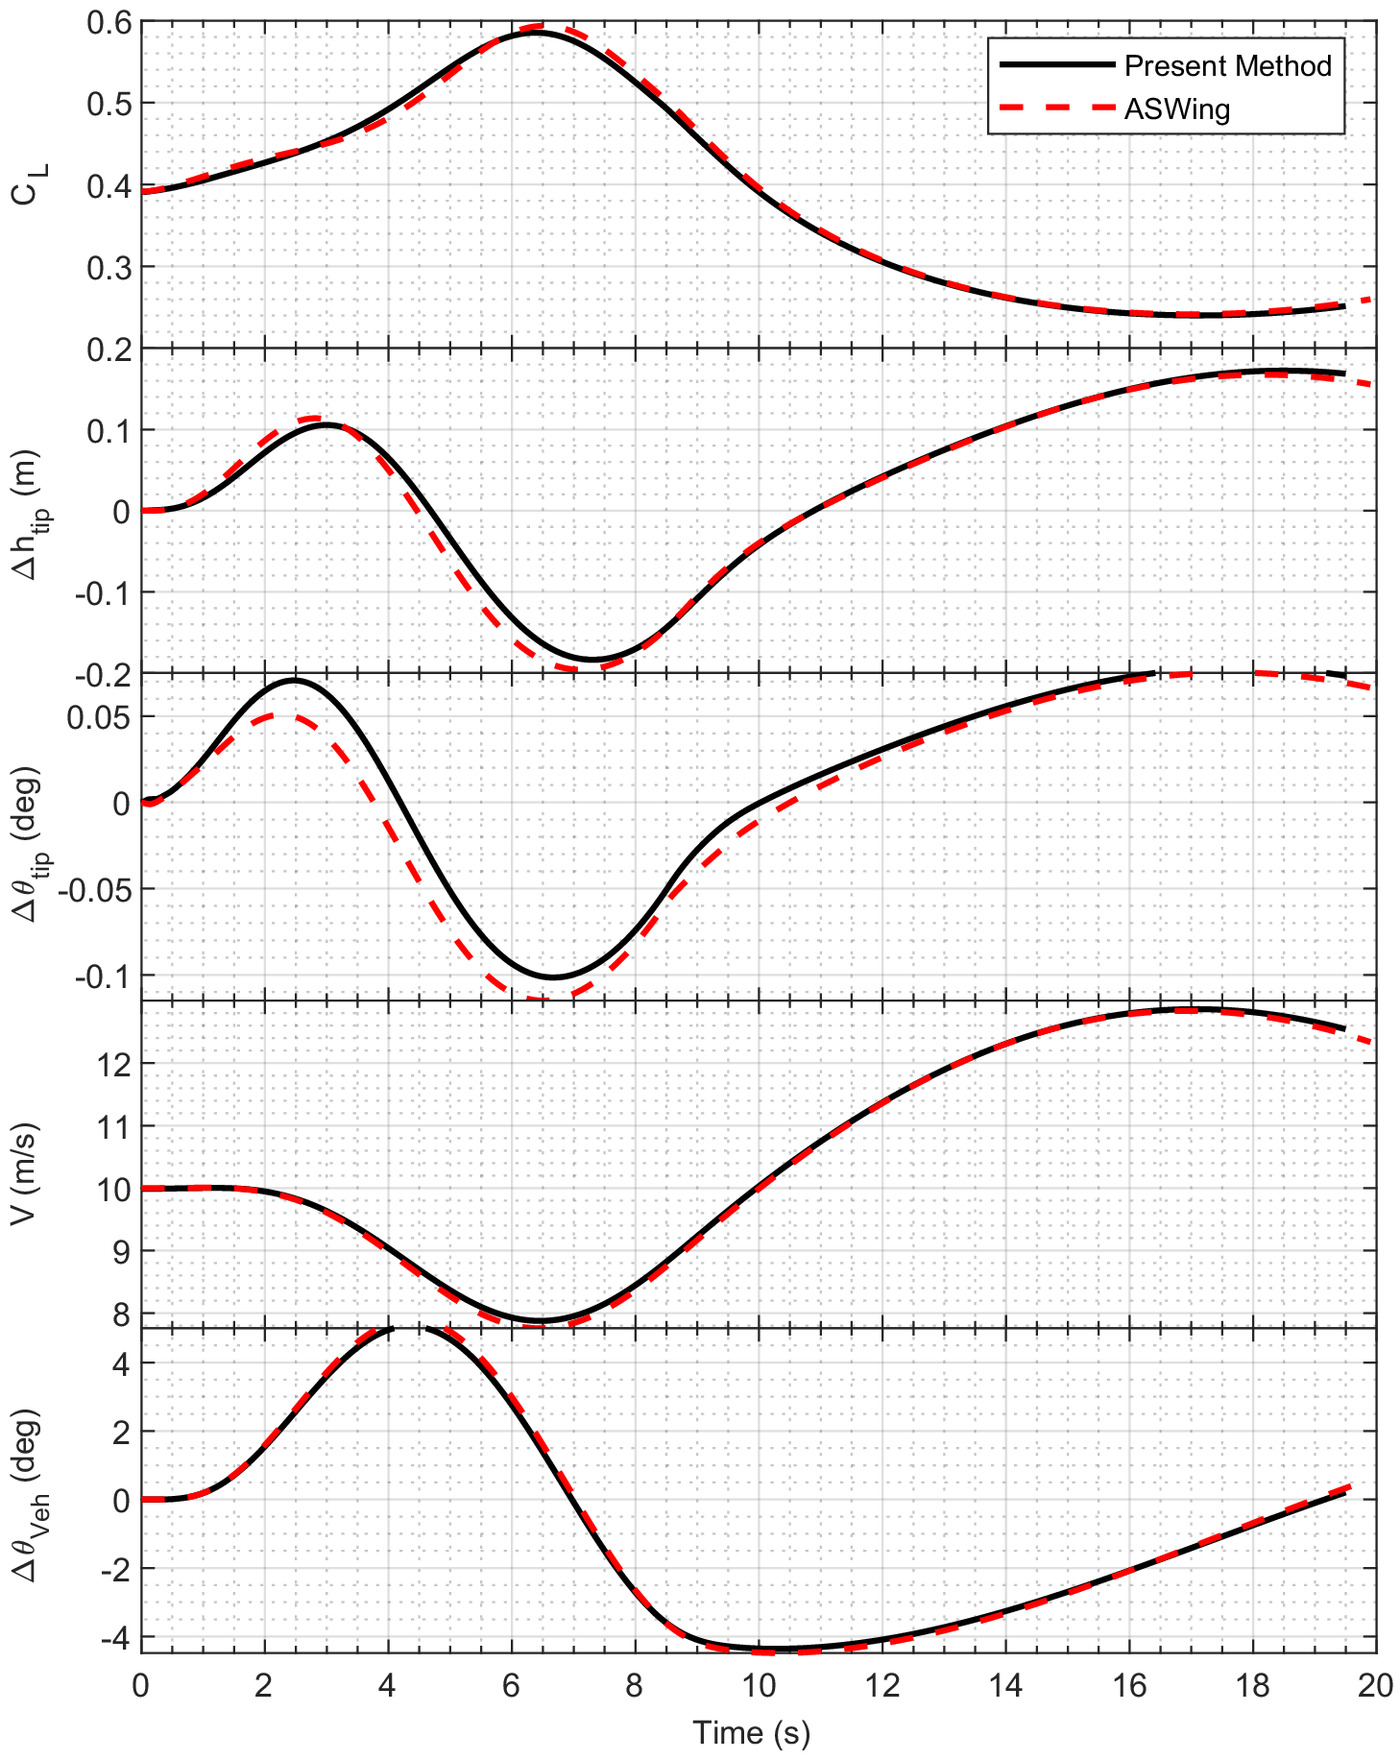
Additionally, a slightly larger tip deflection change below the equilibrium point was observed; the resulting velocity experienced by the wing due to this downward kinematic motion was increased, creating an increased effective angle of attack and, thus, an increase in overall lift. The tip twist comparison in Fig. 9 shows a maximum deviation of 0.02° from ASWing. Overall, the magnitude of the offset between the ASWing results and the present method was small, and the general trend in the dynamic twist response was well captured. In general, the longitudinal response of the theoretical HALE aircraft was predicted quite well compared with a similar fidelity method in ASWing.
The test cases of this section were based on an aircraft configuration listed by Murua et al. (2012). However, the predictions of the Murua et al. (2012) method were less concerned about drag and the subsequent aircraft velocity changes through the gust, which is why those results are not included in the discussion. The velocity changes of the aircraft are an important characteristic to the energy altitude calculation, and thus an important element of verification for this study.
Design Study
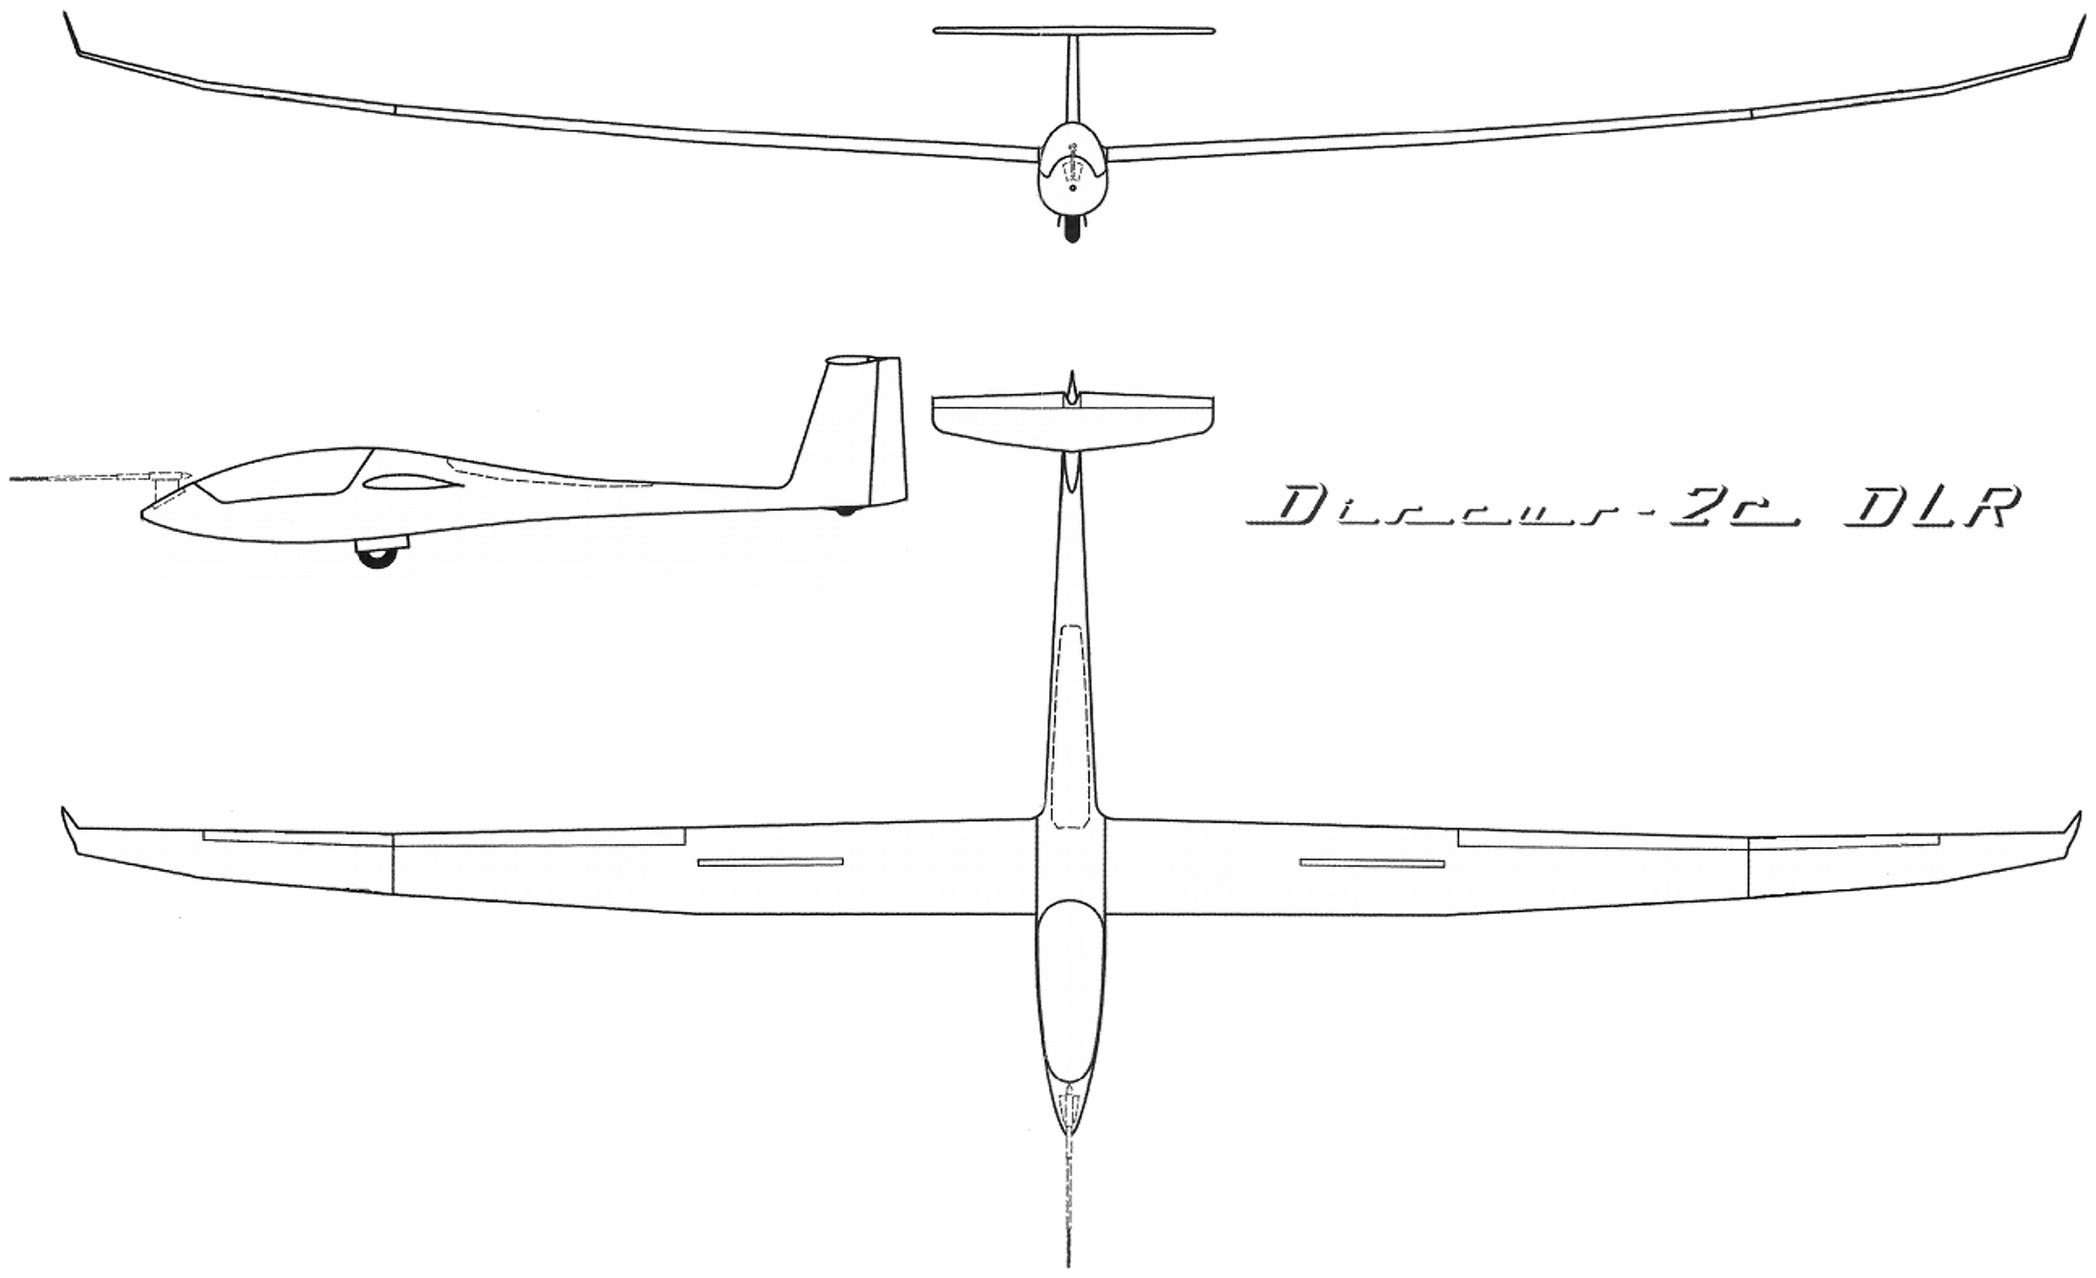
A design study on the effects of aeroelastic tailoring on the gust-energy-harvesting capabilities of a high-performance sailplane is presented in this section. The aircraft of interest for the subsequent analyses is the Discus-2c, whose geometry is shown in Fig. 10 and key parameters provided in Table 2.
| Aircraft parameters | Value |
|---|---|
| Wingspan (m) | 18 |
| Wing area () | 11.36 |
| Total mass (kg) | 440 |
| Wing mass (kg) | 160 |
The Discus-2c was selected for the design study to provide design insight on a known aircraft geometry rather than the theoretical aircraft used for verification. The aircraft was modeled using 18 spanwise elements (19 structural nodes) and three chordwise elements, determined from a similar sensitivity study to that performed in Figs. 4 and 5.
A detailed design-space exploration was performed using a full-factorial parametric sweep and genetic algorithm to quantify the impact of structural design variables on the gust-energy gains. The main goal of the design study is to provide trends of specific design variables and quantify the significance of their impact on the energy altitude gain.
Parametric Sweep
The parametric sweep investigated four structural properties, namely, bending stiffness, torsional stiffness, elastic axis location, and mass axis location. These properties were held constant across the span, thus resulting in four design variables. The ranges of the design variable values are listed in Table 3.
| Parameter | Low value | High value | Distribution |
|---|---|---|---|
| Bending stiffness () | 100,000 | 1,500,000 | Parabolic |
| Torsional stiffness () | 100,000 | 1,500,000 | Parabolic |
| Elastic axis location () | 0.2 | 0.6 | Linear |
| Mass axis location () | 0.2 | 0.6 | Linear |
Four values within the ranges listed in Table 3 were investigated for each design variable, with no restriction placed on the relative location of the elastic and mass axes. A full-factorial discretization of the design space with the aforementioned design variables resulted in 625 cases. The parametric sweep was performed for both a sinusoidal and 1-cosine gust profile using a freestream velocity of , gust magnitude of , and gust length of 50 m. The aircraft center of gravity was fixed to 0.4 m behind the wing root leading edge. This ensured the findings of the design-space exploration were solely driven by the structural parameter variation rather than differing static margins of the aircraft. For this purpose, it was assumed that the center of gravity location can be achieved by moving ballast in the aircraft fuselage to the appropriate location for each set of design variables.
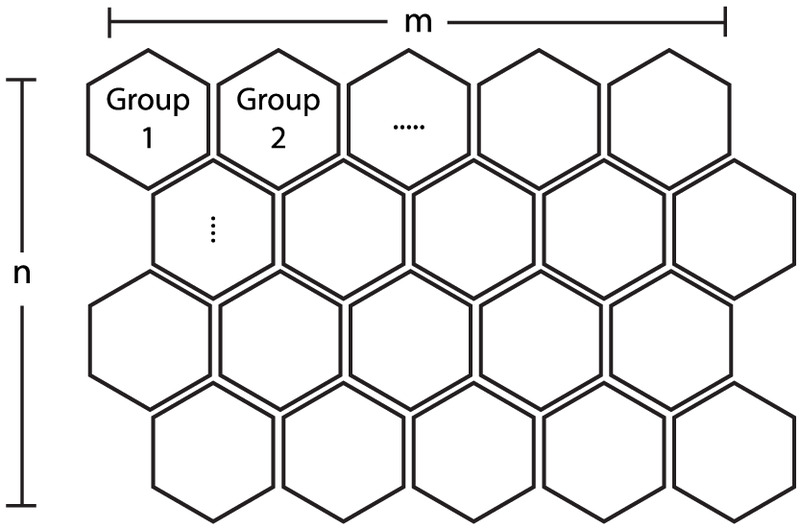
The results of the design study are presented in self-organizing maps (SOMs) (Kohonen 1982, 2013; Kohonen et al. 1996) that provide a gradient visualization of the design variables and associated objective function magnitude. Self-organizing maps are a type of unsupervised machine learning technique that generates lower-dimensional representation of the design space while preserving the underlying topological structure of the data. The results of training the self-organizing map provide a clustering concept by grouping similar designs together into neighborhoods, forming an n × m grid as shown in Fig. 11. These neighborhoods have similar attributes that allow designers to identify high-performing design parameter combinations and the distance between high- and low-performing designs by labeling the neighbors with performance metrics. These maps give a designer a visual context to the engineering decision trade-offs and allow for quickly identifying high-performing designs. The complete diversity of the results within a design space may be reduced with the self-organizing map; however, with an adequately sized grid, the self-organizing map provides an efficient way of relating a design variable value and its expected objective function output.
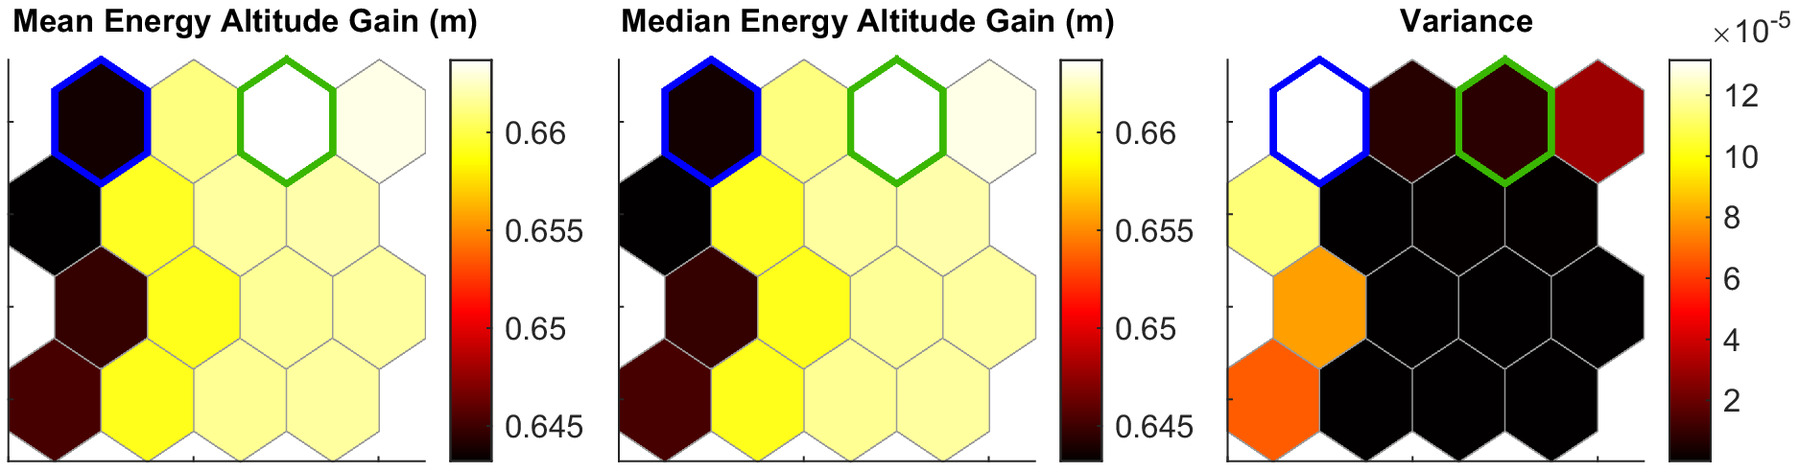
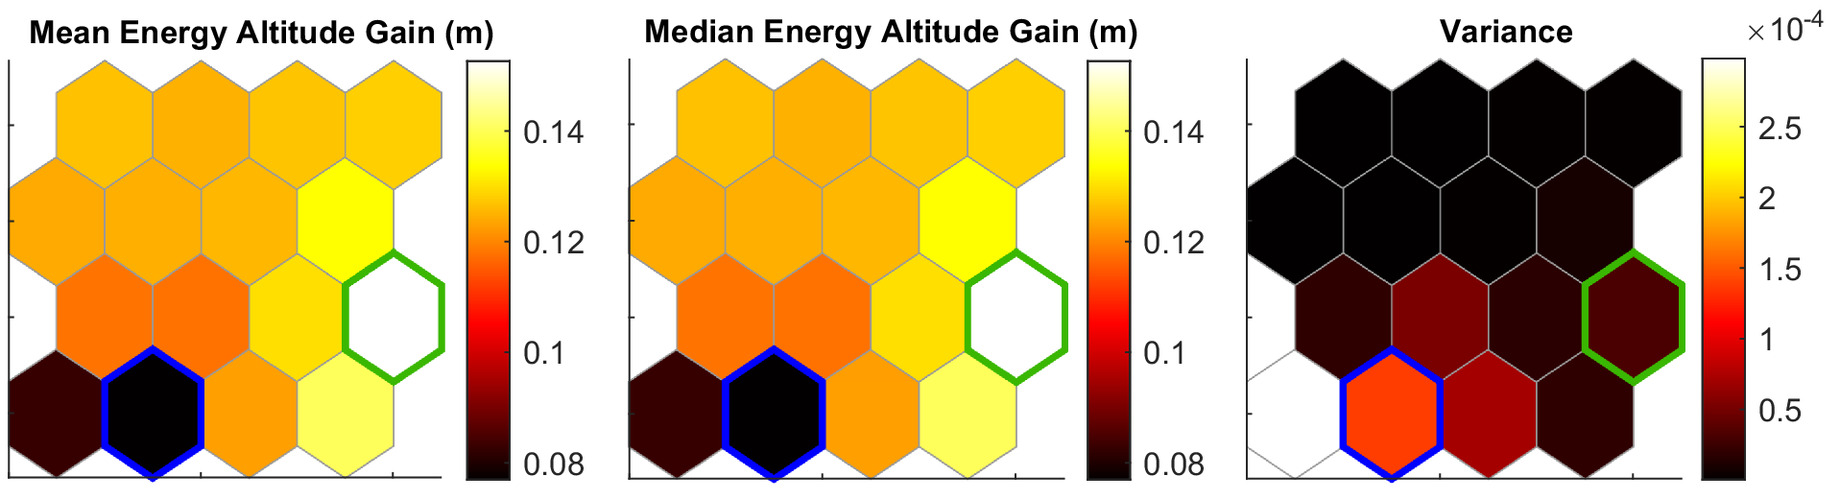
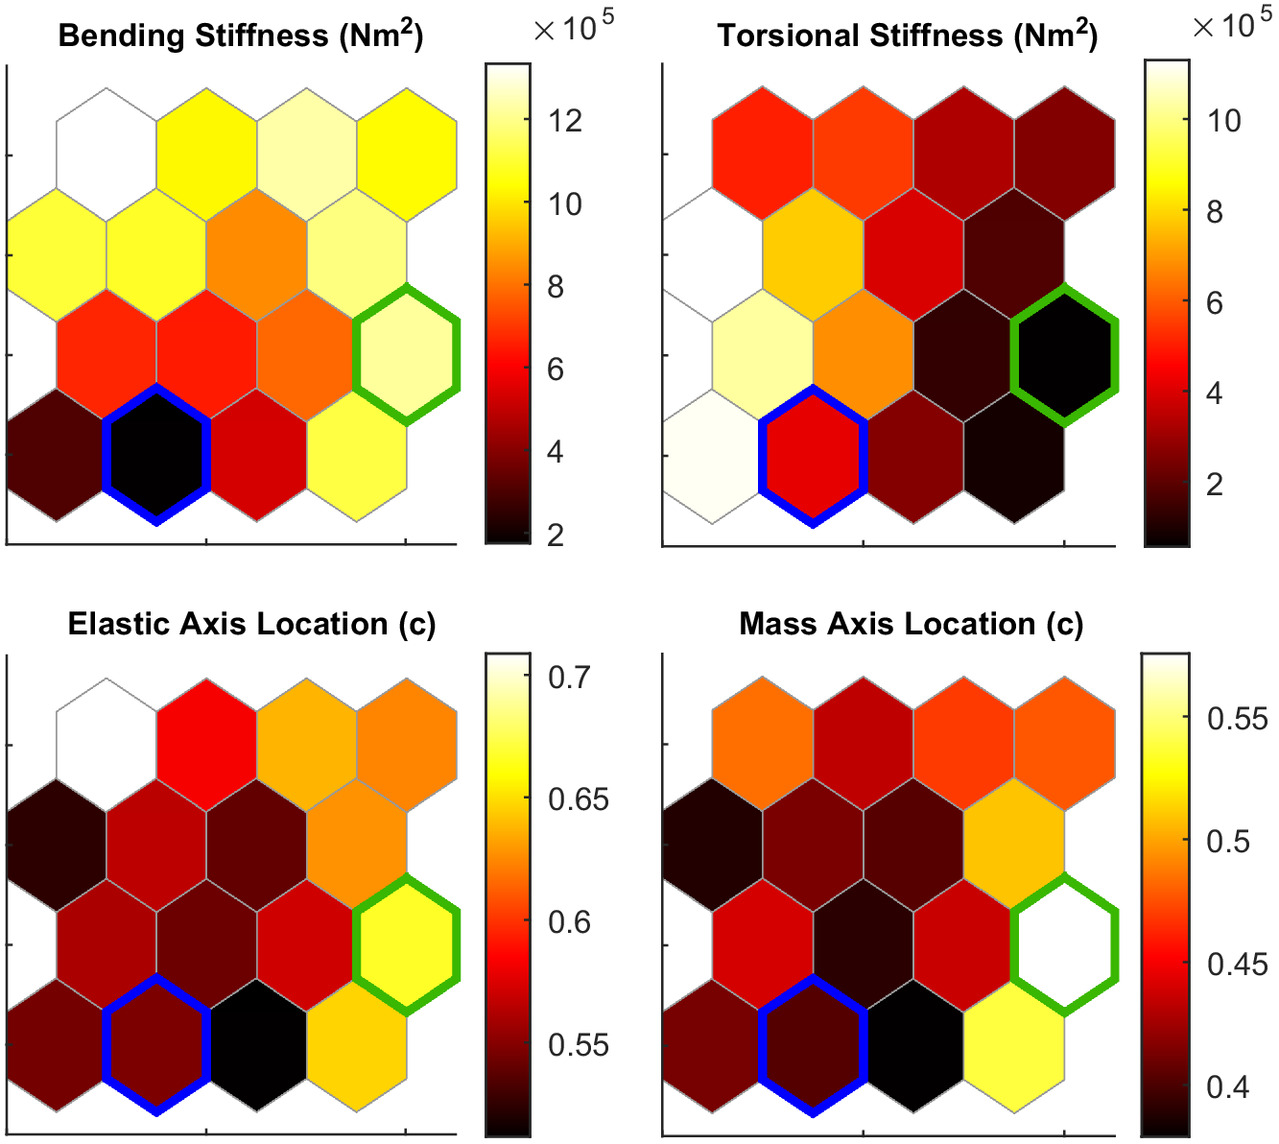
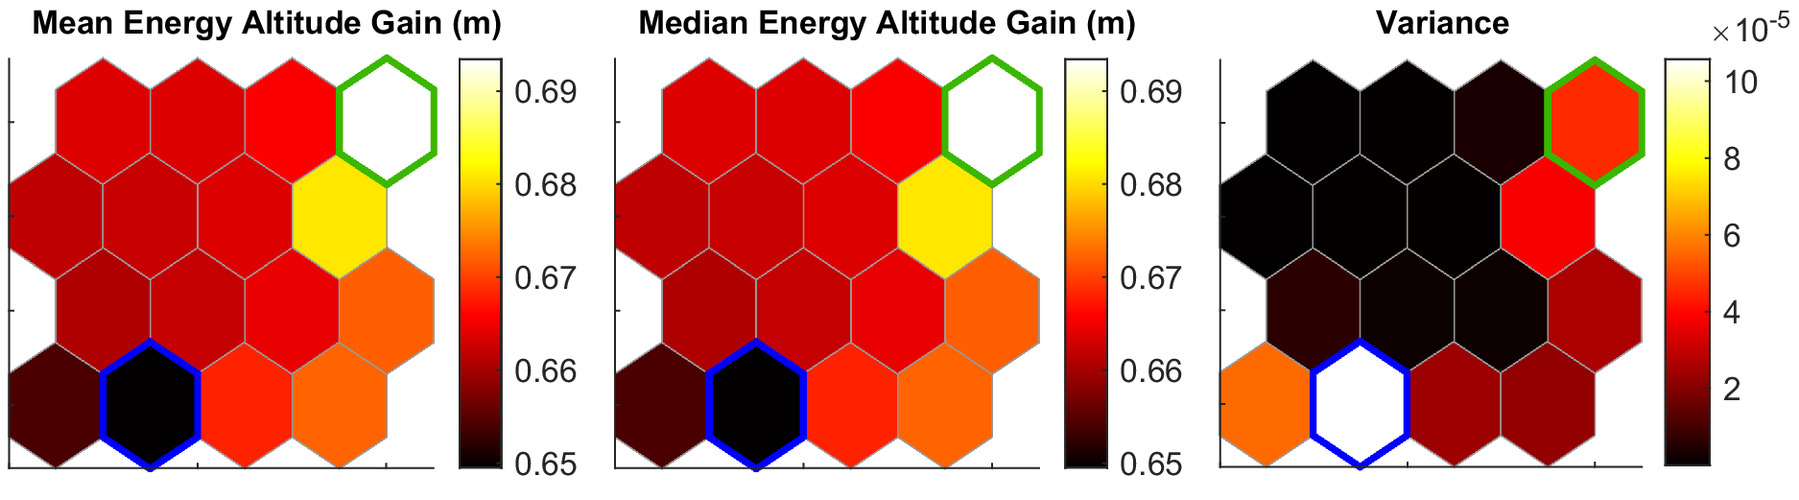
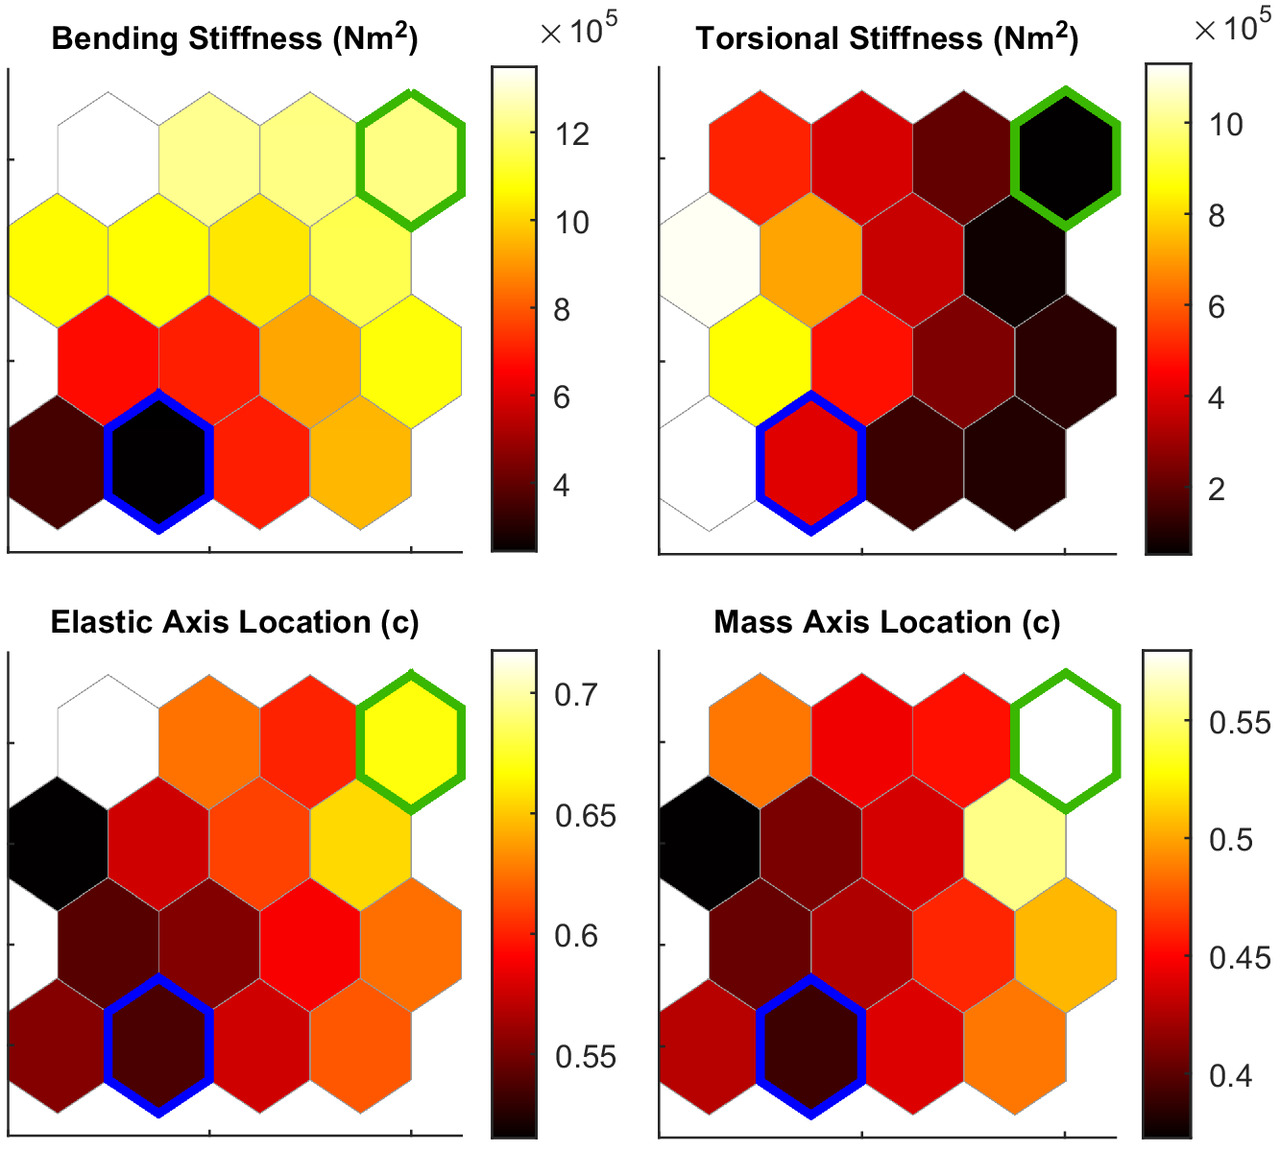
Figs. 12 and 13 show the self-organizing maps for the sinusoidal gust parametric sweep. The results of the sinusoidal gust profile parametric sweep are organized into 16 neighborhoods. Fig. 12 shows the self-organizing maps for the energy altitude gain. It shows the mean, median, and variance of the energy altitude gain.
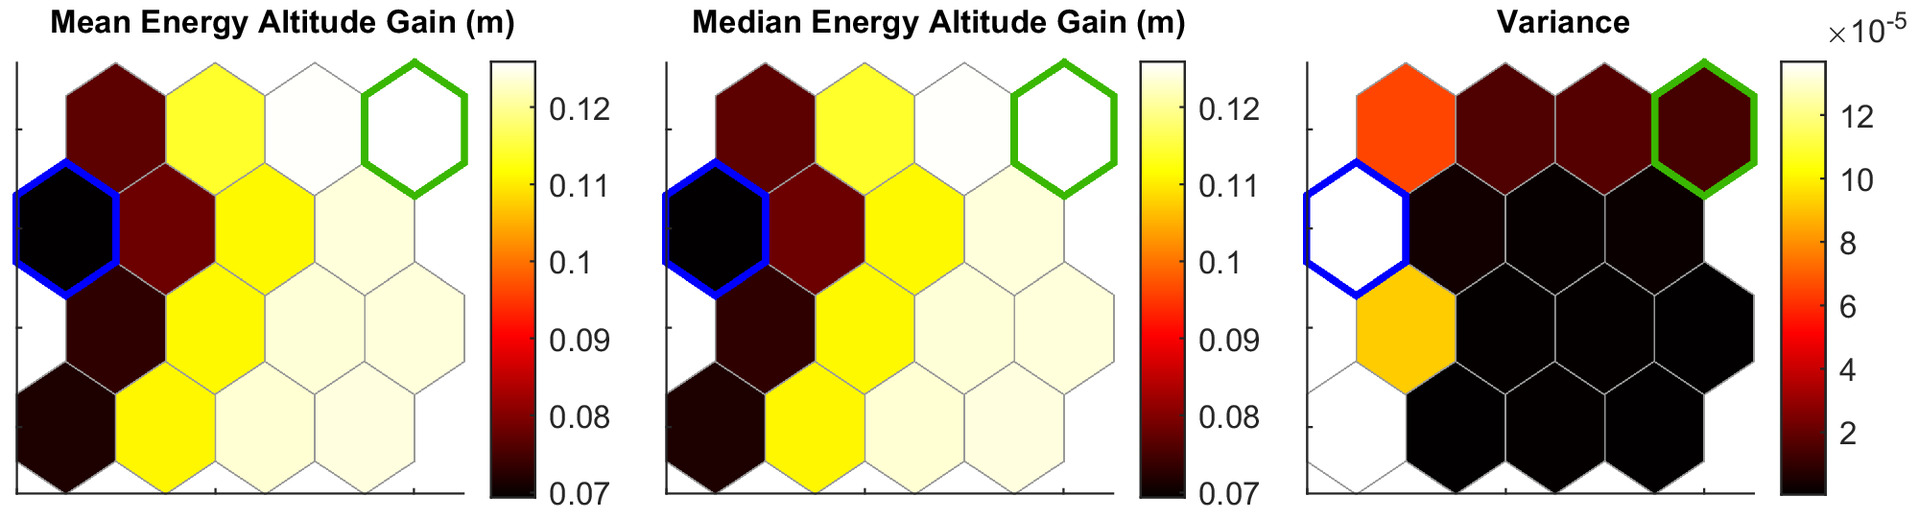
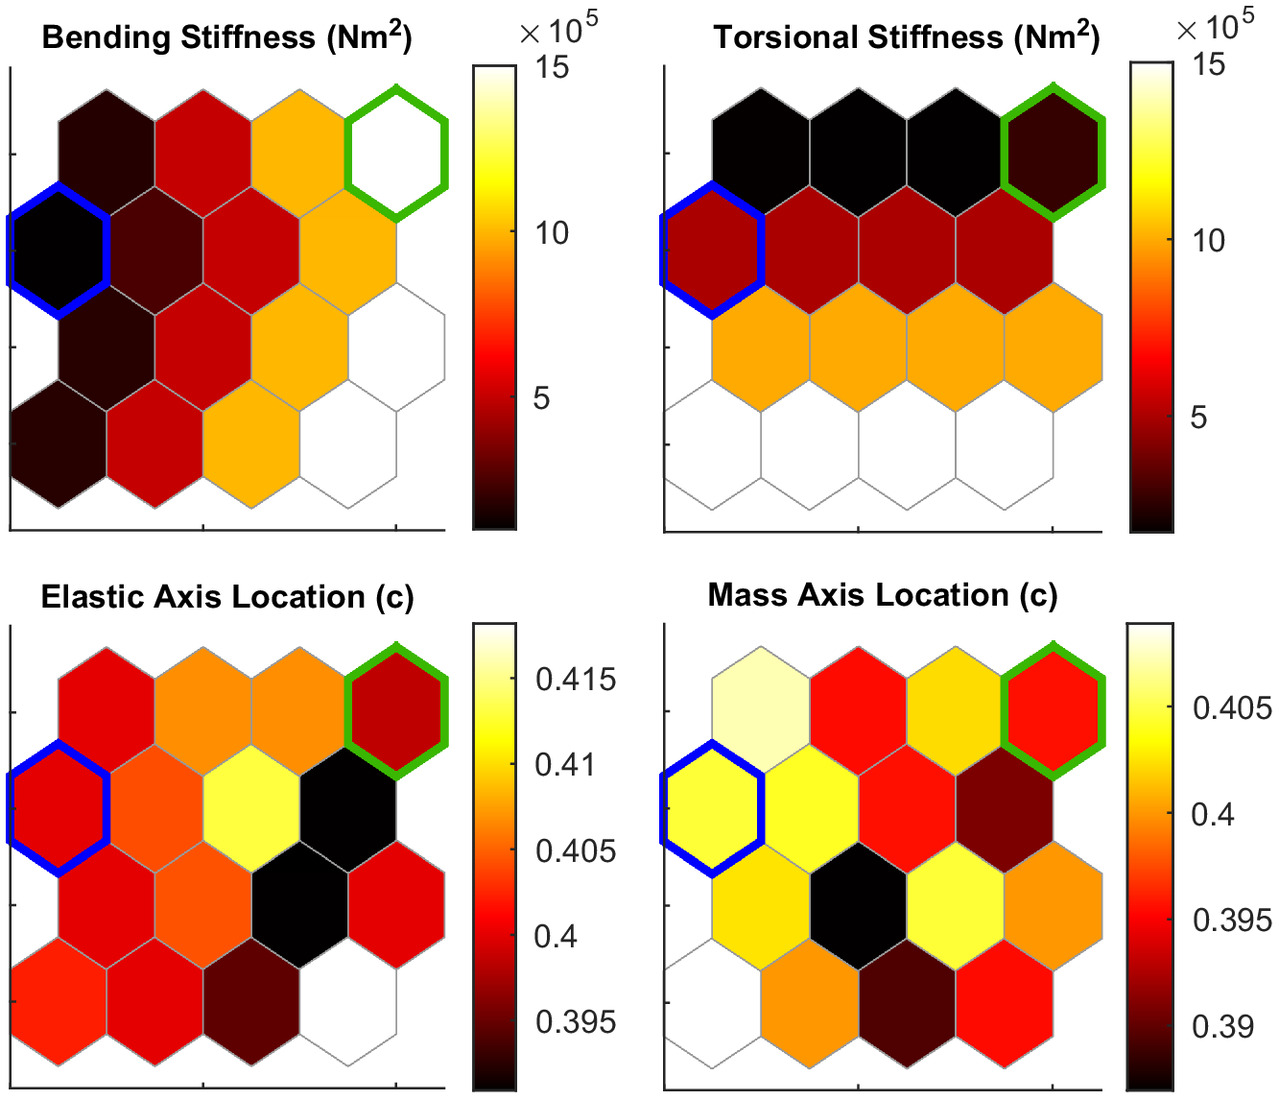
The groups from Fig. 12 are directly related to those in Fig. 13. For example, from Fig. 12, one observes that the largest energy gain exists in the top right of the self-organizing map. Translating this group location to Fig. 13, one observes that the best cases are wings with a high bending stiffness (), low torsional stiffness (), and elastic and mass axis locations at 40% and 39.5% chord. Conversely, the worst energy altitude gains are observed with a flexible wing in bending, stiff in torsion, while having similar elastic and mass axis locations as the best-performing cases. However, these axes locations are approximately equal to the average value of all axis locations investigated, indicating that the energy gain has a weak dependence on the mass and elastic axis locations.
The sinusoidal gust showed significant relative differences between the best- and worst-performing cases, with the best cases having an energy gain nearly double that of the worst case. Using the ideal energy gain described in Eq. (3), the maximum energy altitude gain from the sinusoidal gust for the Discus-2c is 0.2213 m. This translates to an efficiency, based on Eq. (1), of 57% for the best-performing cases and 32% for the worst-performing cases. Thus, through aeroelastic tailoring, improvements to the energy-harvesting efficiency of 25% are possible.
The results of the 1-cosine gust parametric sweep in Figs. 14 and 15 followed a similar trend to the sinusoidal parametric sweep results. The same structural parameter trends were observed, with a wing that is stiff in bending and flexible in torsion being preferable, and similar differences in the energy altitude gain between the best- and worst-performing cases were observed. The differences between the best and worst cases were not nearly as significant for the 1-cosine case as they were for the sinusoidal gust; only a relative difference of 5% was seen in the energy gain between the best and worst cases of the 1-cosine gust, although the deltas were similar to the sinusoidal gust of 0.05 m. The maximum energy altitude gain predicted using Eq. (3) was 0.709 m for the 1-cosine gust, resulting in similar gust efficiencies between the worst and best cases, ranging between 91% and 95%.
Design Point Investigation
Two specific design configurations from the parametric sweep were selected to investigate the driving mechanisms that differentiate the best- and worst-performing configurations for energy altitude gains. For that purpose, the best and worst cases established from the sinusoidal parametric sweep in Figs. 12 and 13 were selected, and these are compared in Figs. 16 and 17. The best-performing case corresponds to a wing that is relatively stiff in bending and relatively flexible in torsion, whereas the worst-performing configuration is relatively flexible in bending and relatively stiff in torsion. Fig. 16 shows changes in the vehicle dynamics through the gust, and Fig. 17 shows changes to the structural response and applied loads through the gust.
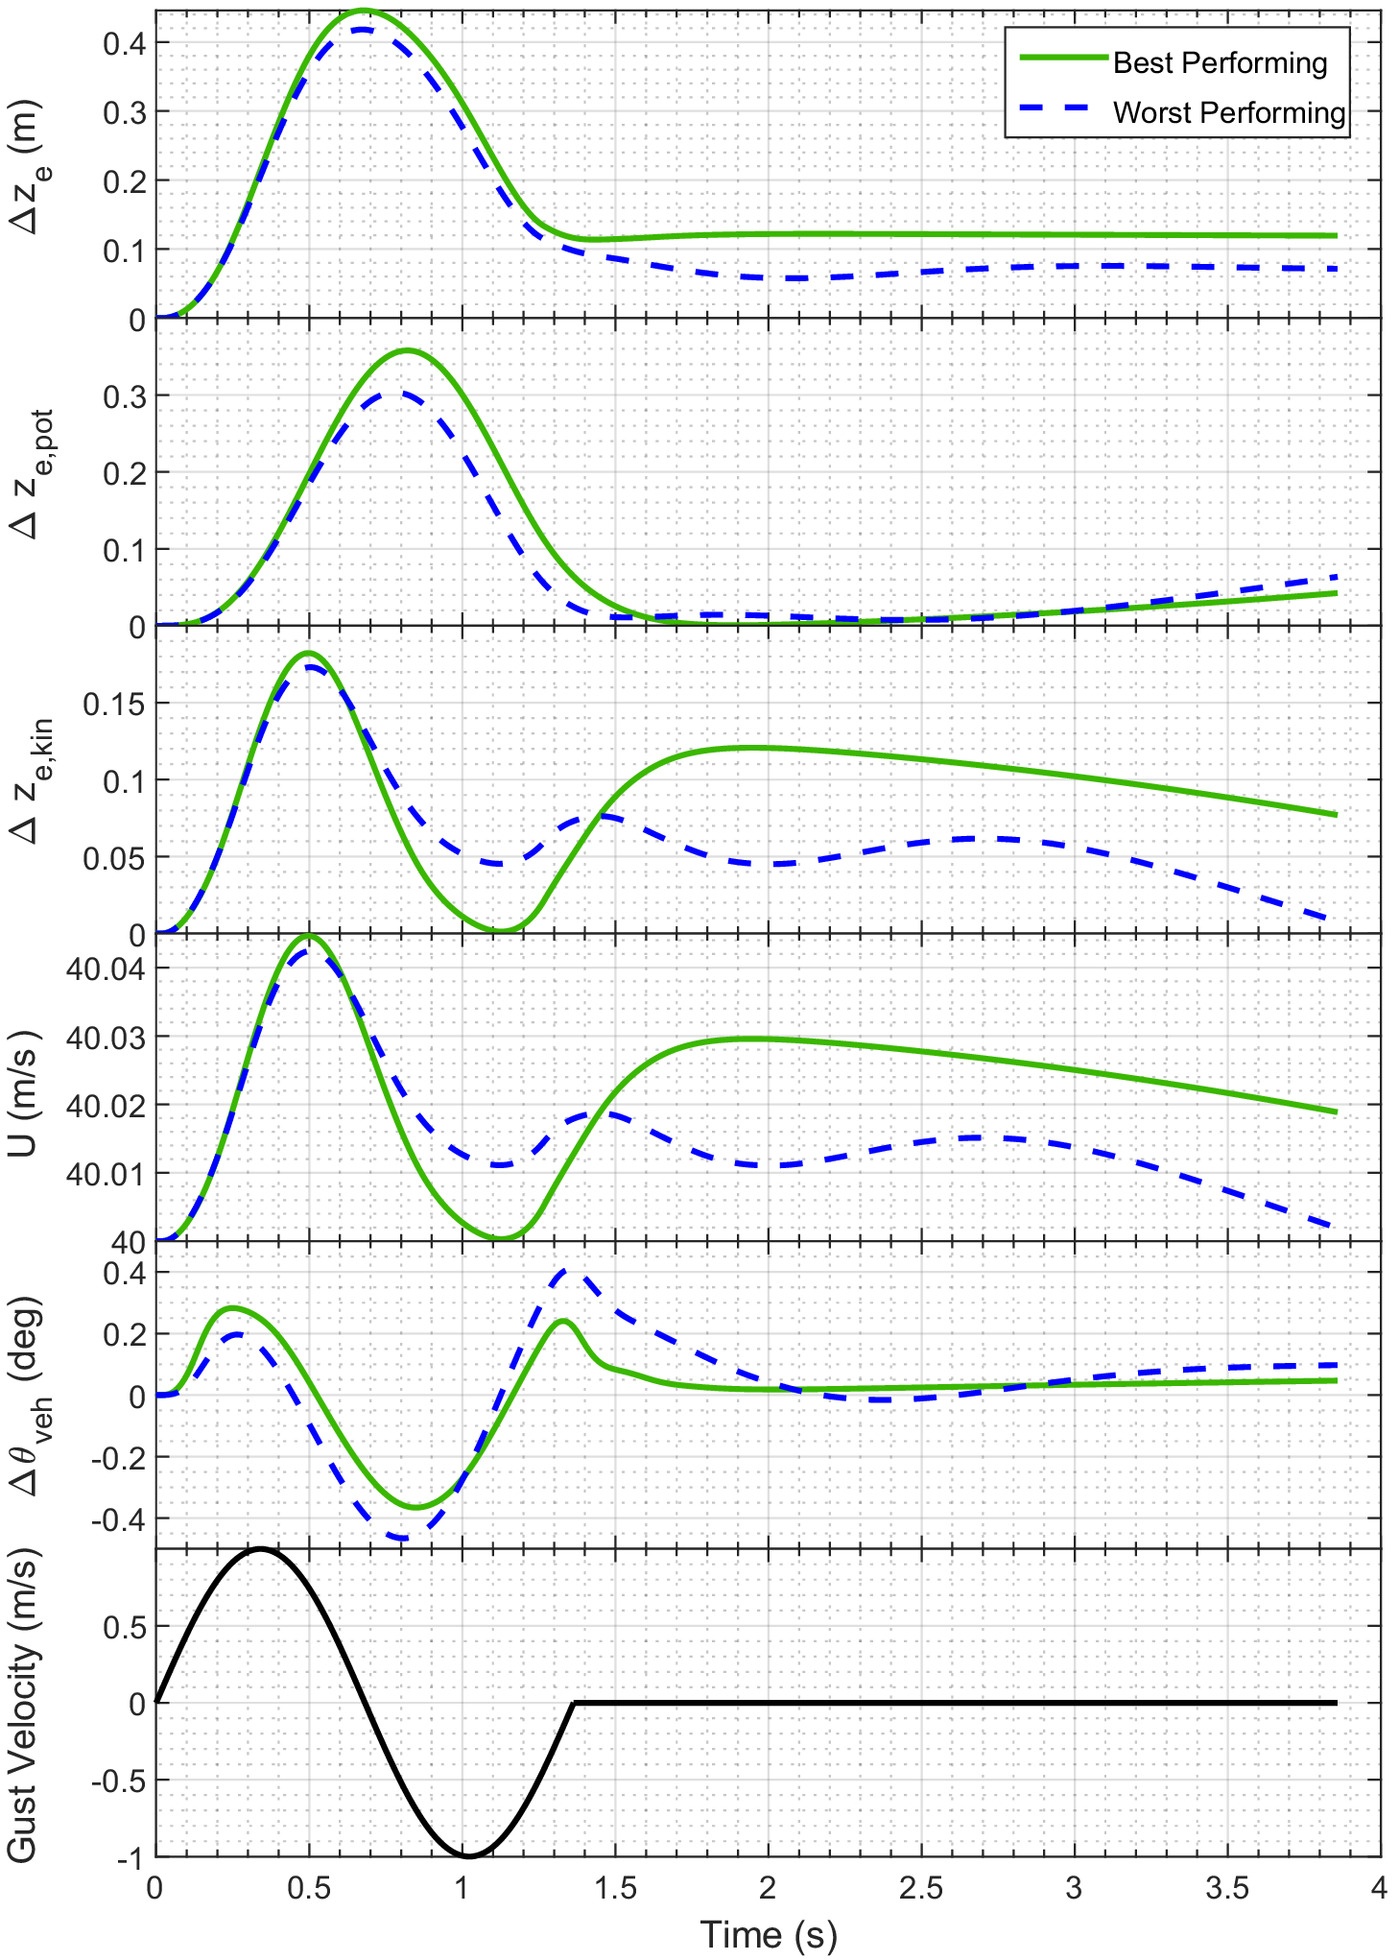
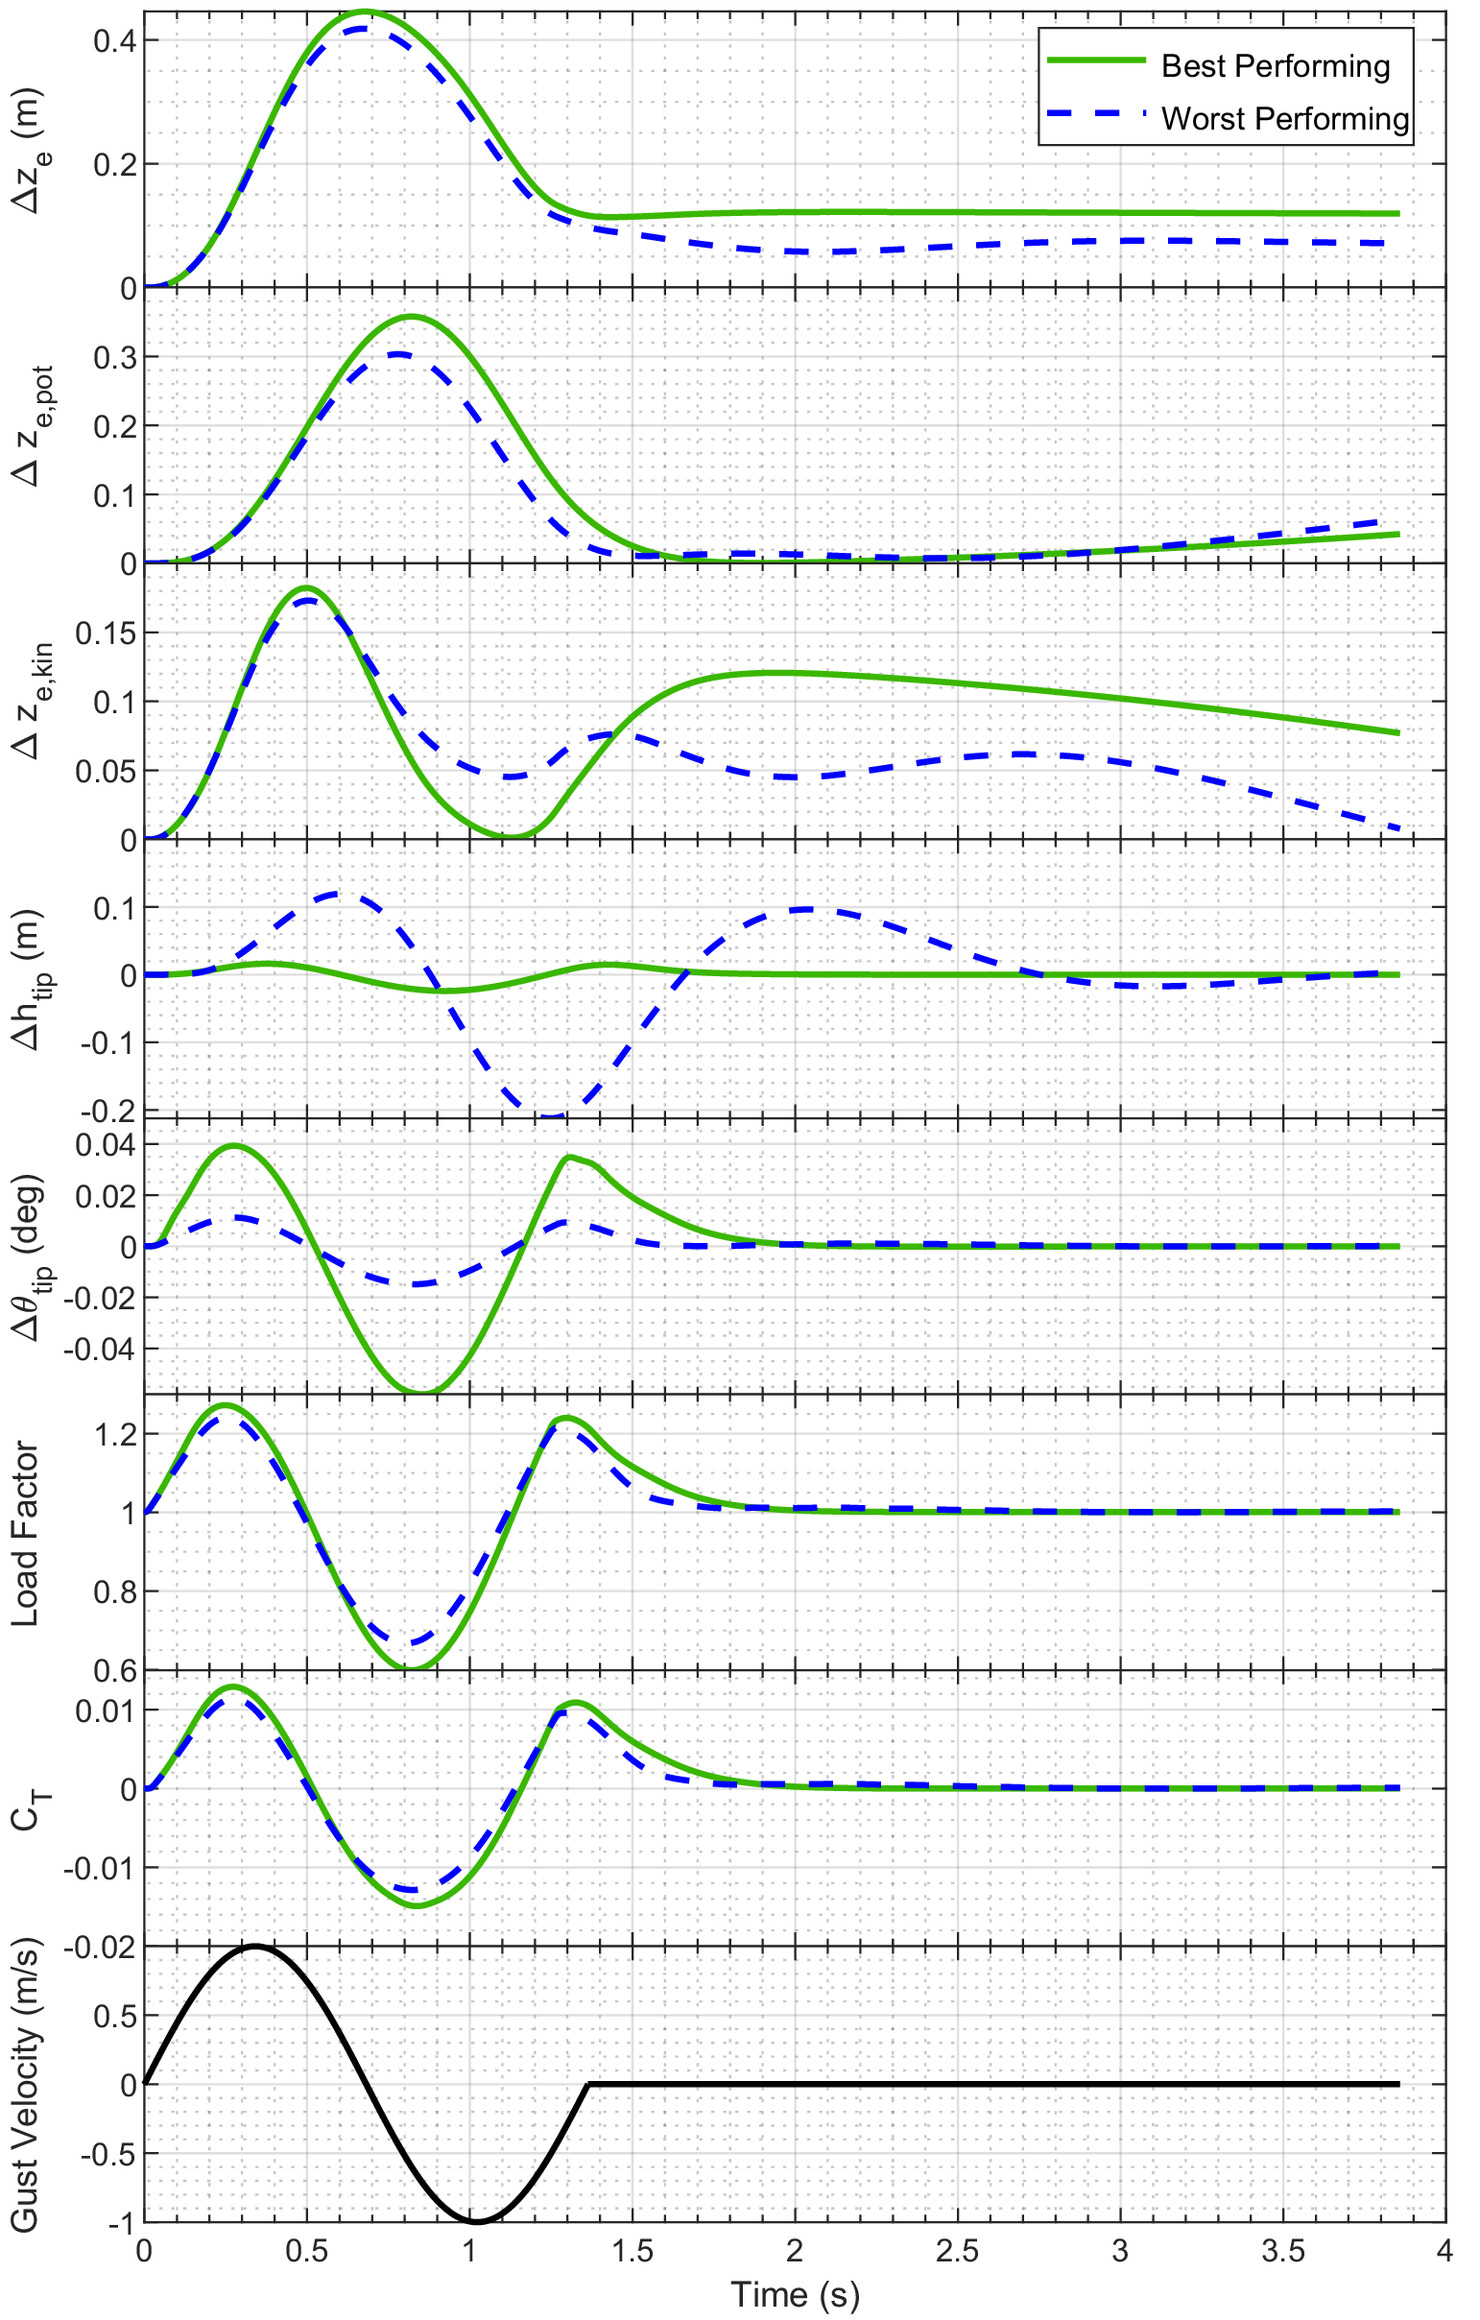
The difference in energy altitude gains between the two configurations is largely driven by the structural dynamic behavior of the aircraft. A wing structure that is stiffer in bending, such as in the case for the best-performing case, has reduced aerodynamic dampening as the kinematic velocity due to the elastic deformation was reduced compared with the more flexible structure. Additionally, a more torsionally flexible structure increased and decreased the lift vector magnitude during the upward and downward gust, respectively. The combined effect of minimizing the effect of aerodynamic dampening and maximizing/minimizing the lift vector magnitude through the gust improves the apparent thrust created from traversing through the gust, as discussed with Figs. 1 and 2 and shown by the thrust coefficient, , in Fig. 17.
The structural dynamic response of the best-performing case also translates into maximizing the load factor during the upward gust and minimizing it during the downward gust. This trend is consistent with the desirable behavior during dynamic soaring maneuvers (Lissaman and Patel 2007; Patel et al. 2009). In maximizing and minimizing the load factor and thrust contributions from the lift vector, the energy gains were manifested mainly in kinetic energy changes of the aircraft. Between the best- and worst-performing cases, both had similar potential energy changes after traversing the gust. However, the best-performing case had a kinetic energy change nearly an order of magnitude larger than the worst-performing case.
The results of Figs. 16 and 17 also show the importance of considering time scales longer than the gust length itself when evaluating the energy gain. Because the structural dynamic and flight dynamic responses do not immediately return to equilibrium after leaving the gust, exchanges in kinetic and potential energy may persist for several gust periods after the gust field has been left. After a single gust length, the best- and worst-performing cases showed similar energy altitude gains; however, after two or more gust lengths, the difference in the energy state of the aircraft due to the gust became significantly more pronounced.
Continuous Gust Analysis
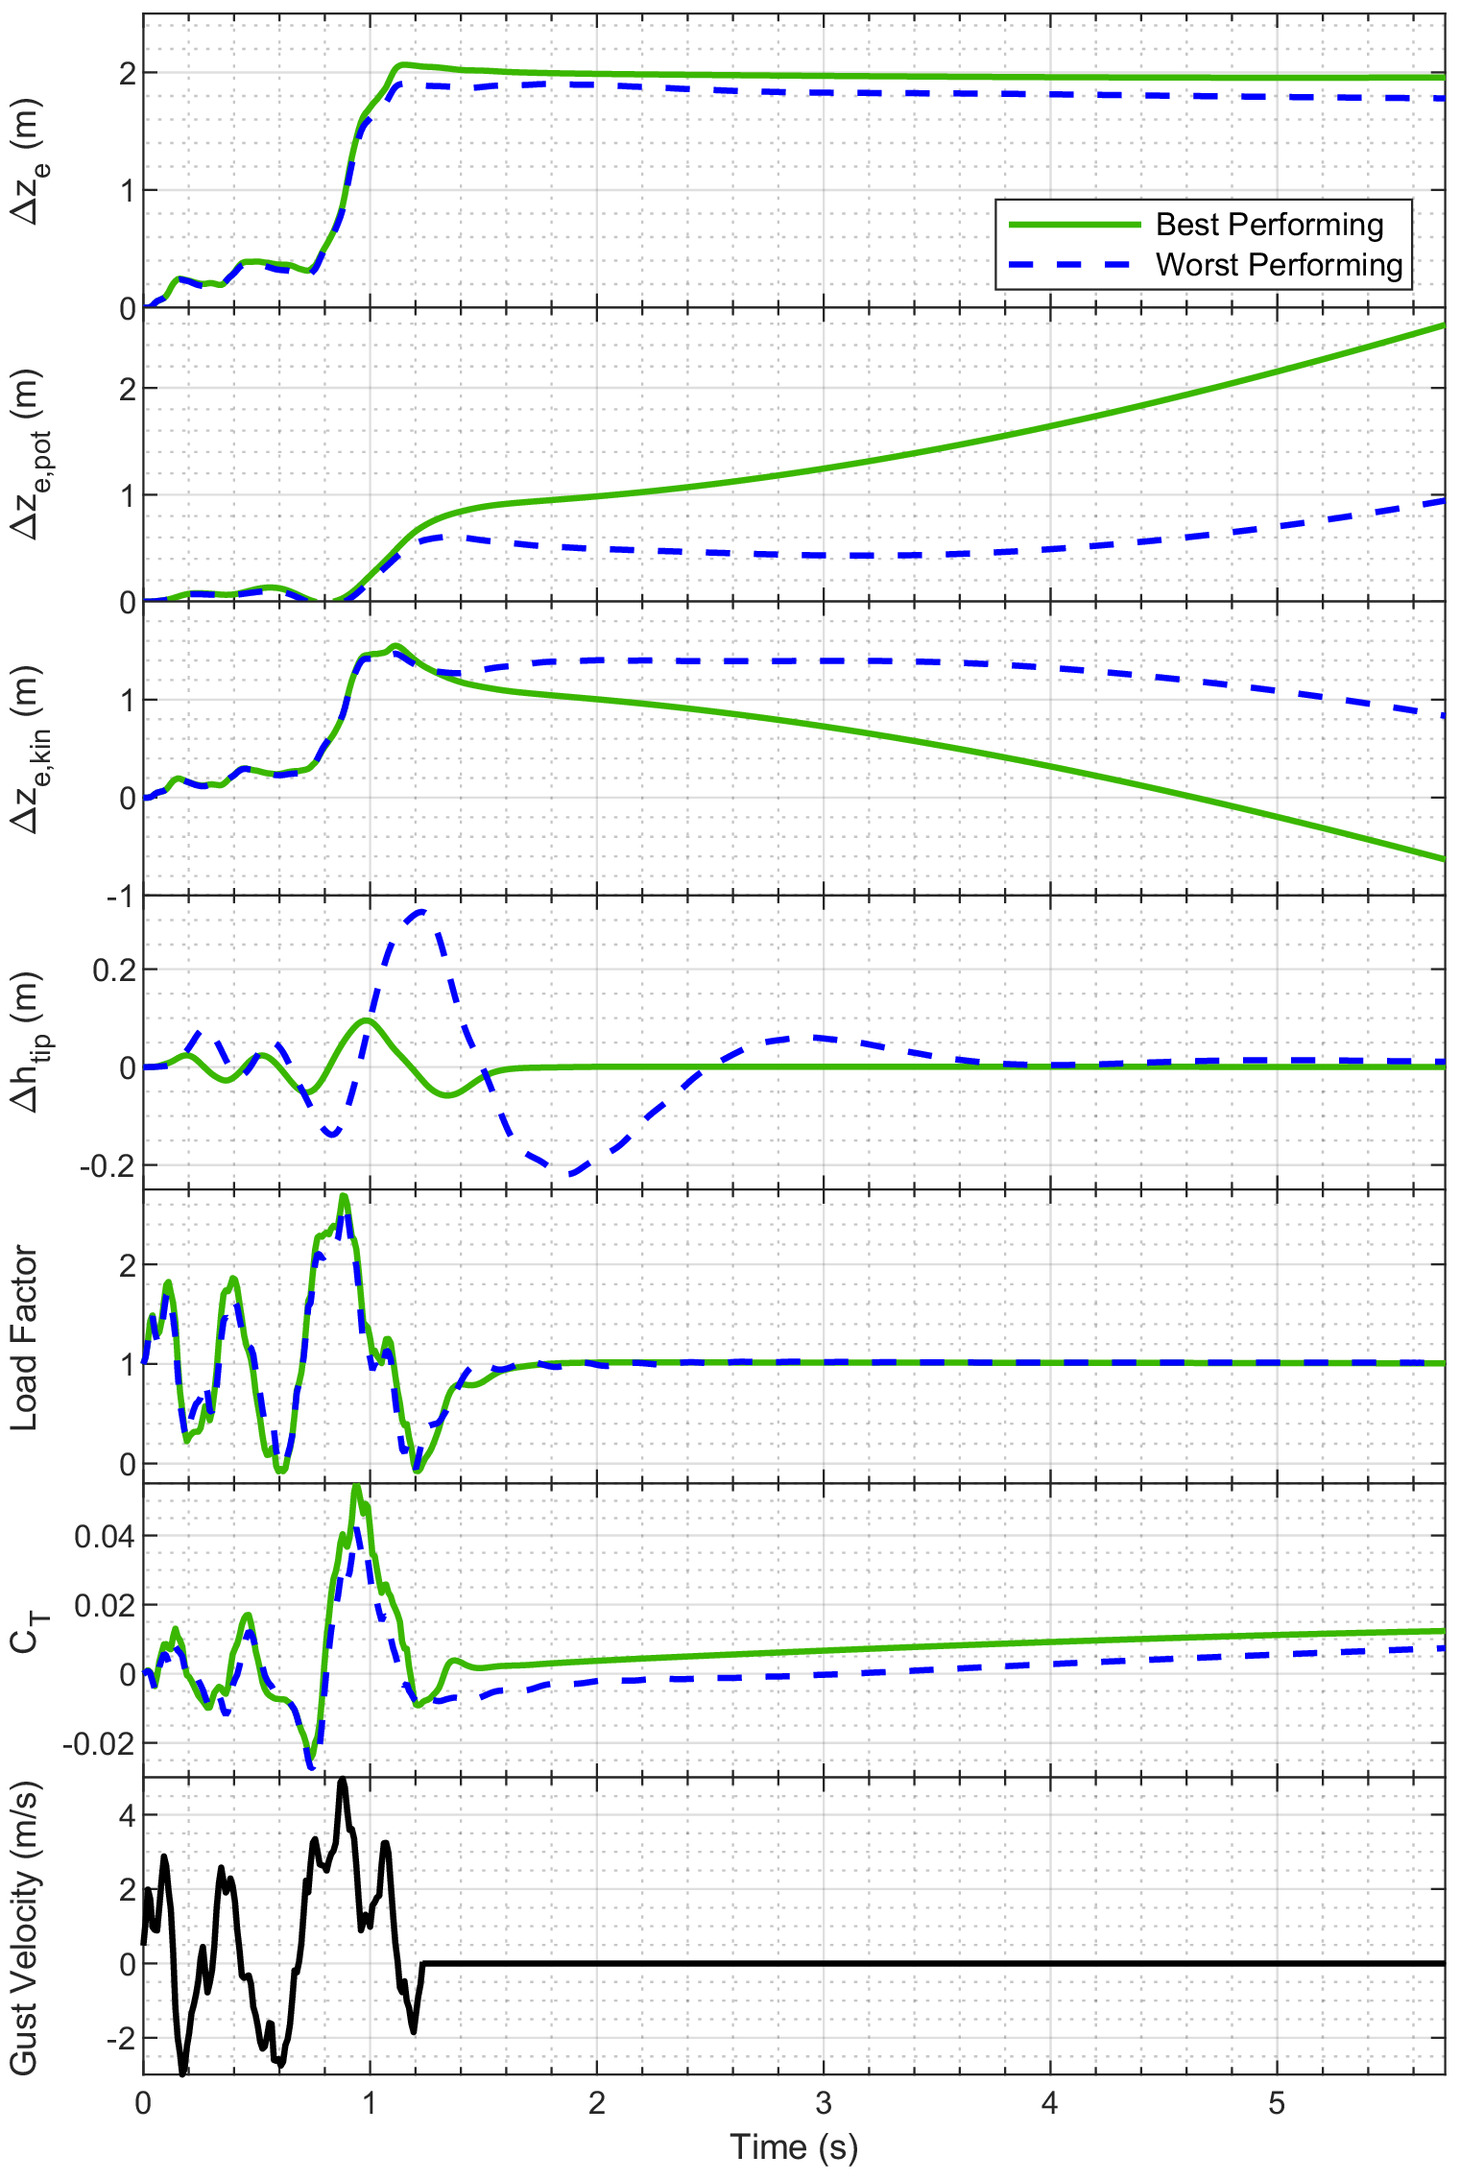
The best- and worst-performing configurations from the parametric sweep were subjected to a von Kármán gust profile (US Department of Defense 1997) to ensure the trends established from the discrete gust profile are true for a continuous gust. Typical length scales of vertical gusts at low altitude within the atmospheric boundary layer are in the range of 25–50 m (Yeung et al. 2018). In the interest of managing the computational effort while also creating a continuous gust field that is sufficiently different in shape from the discrete profile, a small length scale of 2.5 m was selected for the von Kármán turbulence model, with a turbulence intensity of .
The comparison of the energy altitude gain for the best- and worst-performing configurations is shown in Fig. 18. In traversing through a more realistic continuous gust field, the best-performing case from the parametric sweep still outperformed the worst case, with a nearly 10% improvement in the overall energy-altitude gain and 7% improvement in gust efficiency. The best-performing case had a gust efficiency of 75% whereas the worst-performing had a gust efficiency of 68%. The gust efficiency of the best-performing case was similar in magnitude to the sinusoidal profile, and the worst-performing case was about 30% more efficient than in the sinusoidal profile. This is due to the continuous gust profile investigated having larger regions of positive airmass motion than negative; like what was observed for the 1-cosine profile, for the structural configurations investigated, upward gusts exhibited higher efficiency magnitudes. Similar trends were observed in that for the best-performing case, the load factor was maximized and minimized at the positive and negative peaks of the gust. Upon leaving the gust field, the aircraft enters its phugoid mode, maintaining a constant total energy while exchanging kinetic and potential energies.
Genetic Algorithm Design Study
The full-factorial parametric sweep provides a broad insight into the structural design trends that maximize the gust-energy gains, encompassing a uniformly distributed design space. However, the parametric sweep does not directly quantify an optimum configuration. Thus, a genetic algorithm was used in a similar design-space exploration to refine the results of the parametric sweep and provide further design insights into an optimum configuration.
Design Variables
The same four structural properties were considered for the genetic algorithm as for the parametric sweep. The bending and torsional stiffness, as well as elastic and mass axis locations, were defined at each of the 19 structural nodes, totaling 76 design variables. Each design variable was constrained between upper and lower bounds and with a constraint limiting the relative change in the structural properties between neighboring nodes. The details of the constraints are outlined in Table 4.
| Design variable | Lower bound | Upper bound | Relative change constraint (%) |
|---|---|---|---|
| Bending stiffness, EI | |||
| Torsional stiffness, GJ | |||
| Elastic axis location | |||
| Mass axis location |
The maximum and minimum stiffness values were selected based on structural data available for a similar 18-m class sailplane, the Braunschweig SB14, which has a maximum stiffness of and minimum stiffness of . Extra margin was added to these values to define the limits to not constrain the design solely to the existing data and allow the optimizer the freedom to explore different configurations.
The relative change constraint ensured the design cases investigated remained feasible to construct in practice. The constraint aimed to avoid having sudden large changes in the design variable magnitudes between neighboring nodes. For example, having the relative change constraint avoids large changes in the chordwise location of the elastic axis from one spanwise location to the next, which is very difficult to achieve with standard manufacturing techniques. The mass axis was constrained to always remain in front of the elastic axis to alleviate the possibility of dynamic aeroelastic instabilities. The optimization process considered the effects of static aeroelastic stability when computing the design point trim conditions; if a converged static structural solution was not achievable due to divergence, it was discarded and not considered in the optimization. Thus, any results presented for the speed of interest are statically stable from aeroelastic and flight dynamics points of view. A constant wing linear mass and inertia of the different configurations was used to limit the size and complexity of the design space. Similar to the parametric sweep, the aircraft center of gravity was fixed to 0.4 m behind the leading edge.
Objective Function
To differentiate design cases, the energy altitude was used for a cost measure. The energy gained or lost was quantified by the work performed by the gust and aerodynamic drag on the aircraft, as outlined in Eq. (3). The aircraft energy altitude was used to quantify the energy change and capture the effects of the aircraft dynamics. The objective function used for this study iswhere is a vector of the 76 design variables; = energy altitude change due to the gust; and = energy altitude change in steady-level flight over the same length.
(4)
Design Study Results
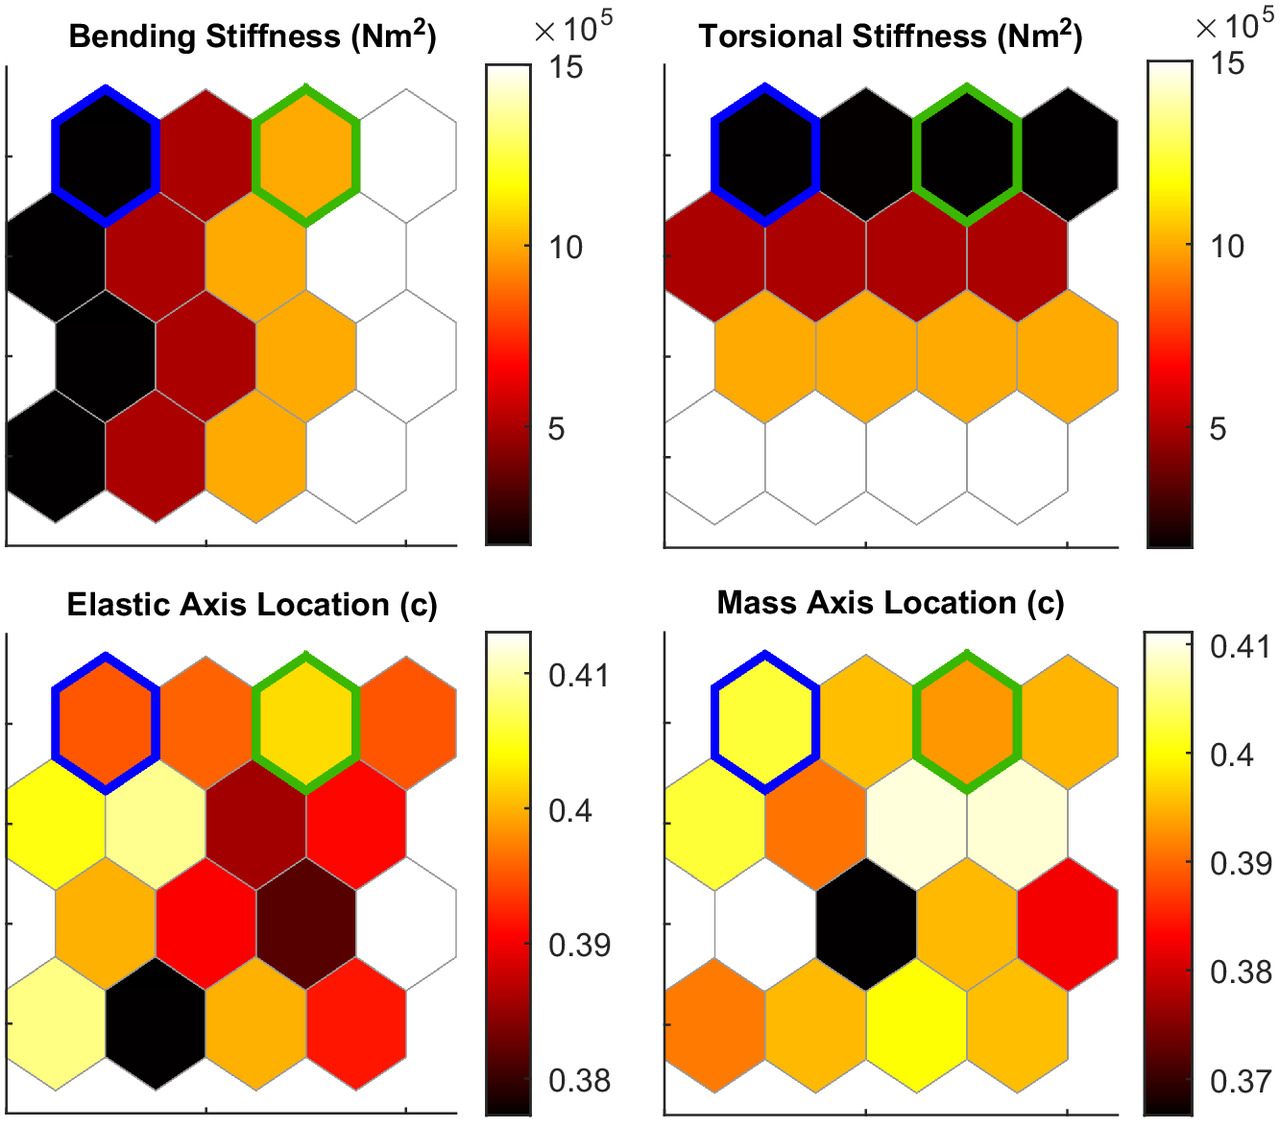
The genetic algorithm optimization results are separated into two gust shapes: a 1-cosine gust and a sinusoidal gust. Each gust profile optimization was performed with a gust 50 m in length with a magnitude of , and an aircraft freestream velocity of . The results of the sinusoidal gust profile optimization are organized in a similar fashion to the parametric sweep, shown in Figs. 19 and 20. Fig. 19 shows the self-organizing maps for the objective function value. The optimum cases are highlighted by the outlined hexagons in Figs. 19 and 20.
The optimum case found by the optimizer corresponds to an average bending stiffness of , an average torsional stiffness of , and average elastic and mass axis locations at 67.5% and 57.5% chord. The optimum case corresponds to a gust efficiency of 68%, an 11% improvement over the parametric sweep results. The optimum configuration exhibits the same design trends in the structural parameters as shown in Fig. 13, albeit with a slightly different magnitude. This is likely due to an increase in the number of cases around the optimum being grouped together in the SOM as the optimizer hones in on a solution, rather than the uniform distribution of cases across the design space in the parametric sweep. Similar to the parametric sweep, the worst energy altitude gains were observed with a wing that is flexible in bending and stiff in torsion, corresponding to gust efficiencies of approximately 36%.
The optimization results outlined in Fig. 19 highlight the advantages of tailoring the aircraft structure to maximize the energy gain. Between the optimum and least desirable cases, the energy gain of the optimum configuration was nearly double and accounted for nearly 15% of the Discus-2c sink rate [ at (DLR 2015)]. That is to say, the glide performance of the aircraft improved by 15% from encountering the sinusoidal gust with a tailored structure compared with its steady-level flight performance.
The self-organizing maps for the 1-cosine gust-profile case are shown in Figs. 21 and 22, with the optimum configuration outlined. The optimum configuration for the 1-cosine gust also corresponds to a wing structure that is stiff in bending and flexible in torsion, with the optimum configuration producing nearly identical bending and torsional stiffnesses. The elastic and mass axis locations were also nearly identical with the sinusoidal gust case.
Once again, as was seen in the parametric sweep, the relative difference between the energy gained of the best and worst cases was much smaller for the 1-cosine gust than in the sinusoidal gust case. A similar relative difference of 5% was observed between the best and worst cases, and similar gust efficiencies between 91% and 97% were seen. Compared with the sink rate of the Discus-2c, the 1-cosine gust provided a 65% improvement to the aircraft’s glide performance for a tailored structure.
Design Considerations
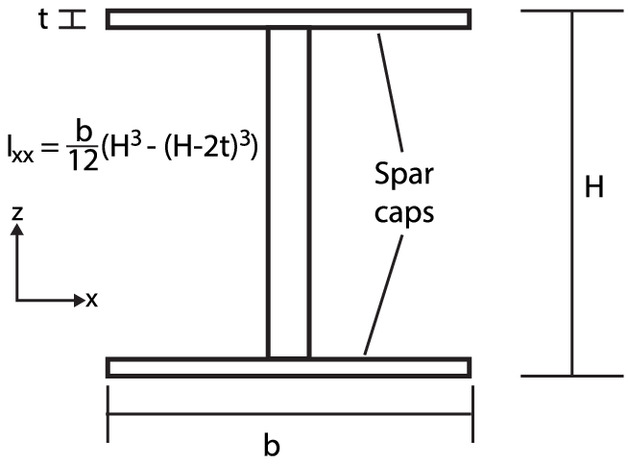
The genetic algorithm and parametric sweep results indicated that a stiff wing in bending and flexible in torsion provides the best energy gains from a gust. Thus, minimizing out-of-plane deformations seems to be the most beneficial design philosophy. In practice, additional weight penalties maybe be incurred to achieve a stiffer wing; however, the detailed design of the structure is beyond the scope of this work. Nevertheless, with current composite materials, it is possible to achieve different stiffness configurations using similar masses. For instance, between the worst-and best-performing cases of the optimization, the bending stiffness increased by a factor of 5.5 and torsional stiffness reduced by a factor of 5. Table 5 provides a summary of the design parameters needed at the wing root for the best- and worst-performing cases of the optimization using a simple I-beam spar, shown in Fig. 23, with unidirectional carbon fiber rovings as spar caps.
| Spar parameters | Worst performing | Best performing |
|---|---|---|
| Cap width, (mm) | 50 | 95 |
| Cap thickness, (mm) | 3 | 10 |
| Spar height, (mm) | 115 | 115 |
| Mass (kg) | 8.7 | 54.7 |
Only considering the spar caps’ contribution to the bending stiffness, the best performing case required an approximate additional 45 kg in mass (Newcomb 2016). This is certainly not an insignificant amount relative to the total aircraft mass of 440 kg; however, the aforementioned estimate is conservative because it only considers the geometry at the wing root and thus does not account for the changing structural requirements across the span.
The spar design, however, only captures half the structural contributions. The best-performing design also requires a structure that is five times more flexible in torsion, which is achieved through modifying the skin design. If the aircraft skin is constructed of carbon fiber, with a planform area of , each ply would contribute about 11 kg of mass (Newcomb 2016). Thus, half of the estimated mass penalty accrued from the spar cap design can be offset by removing only two plies of material. A more complex design in which fibers in the skin are oriented to support bending loads, thus reducing the torsional stiffness, may also be possible and provide a means to reduce the mass added to the spar caps.
A more detailed structural model is required to completely quantify the balance of weight changes when changing the skin and spar design to achieve the required structural stiffnesses. The preceding discussion suggests that it is possible to maintain a fairly constant structural mass. To minimize wingtip deflections without incurring weight penalties from increasing the structural stiffness, one can ensure an aircraft is designed to minimize the wing loading. Lower wing loadings have shown to be more beneficial for gust-energy extractions (Cole et al. 2022); however, this may come at the expense of reduced average cross-country speed. A lower wing loading can be achieved through a specific planform design or mass distribution of the aircraft.
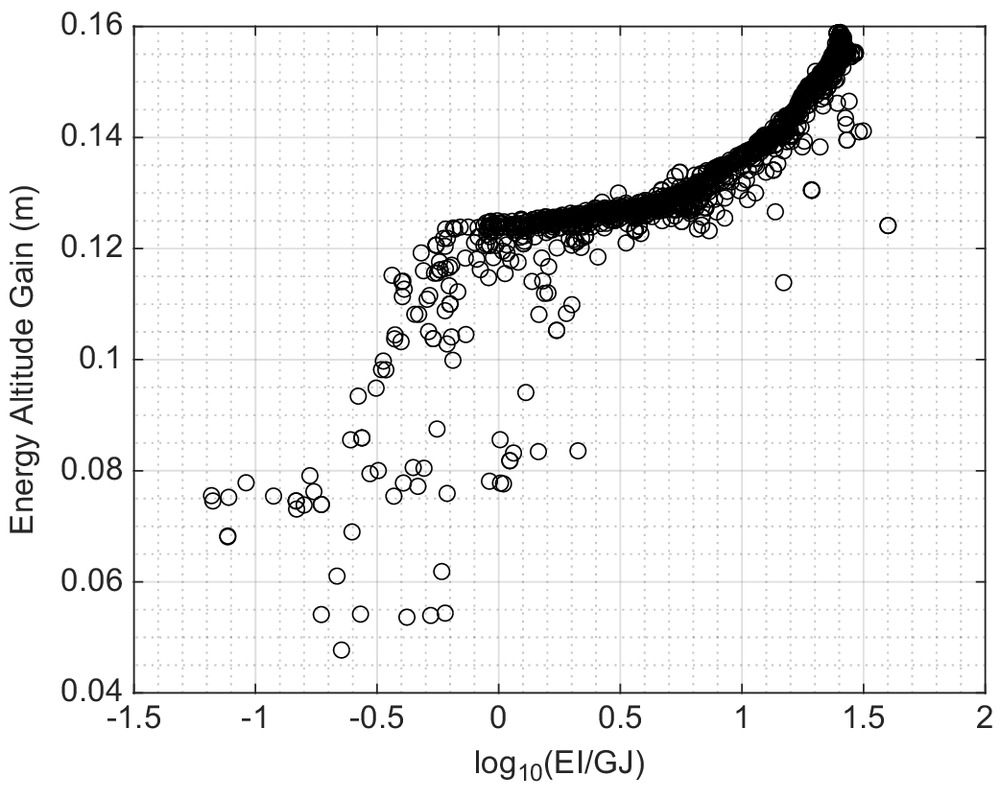
Further insight is provided into the relative ratios of the design variables and their impact on the energy altitude gain using the results from the genetic algorithm. From Fig. 24, it becomes clear that the larger the bending stiffness is in relation to the torsional stiffness, the higher the energy altitude gains. The relative locations of the elastic and mass axes showed a weaker correlation than the wing-stiffness ratios. This is evident from Fig. 25, which shows a relatively even distribution over the value range. As a result, the wing structure can be tailored to mitigate aeroelastic instabilities such as divergence or flutter without concern of impacting the overall energy-harvesting capabilities of the aircraft.
Gust Frequency Dependency
The parametric sweep and genetic algorithm provided insight into structural design trends leading to the best gust-energy gains; however, these studies were constrained to a single gust profile length and, by extension, gust frequency. The impact of the gust frequency and its relation to the structural modal frequencies on the energy extraction efficiency of the Discus-2c is shown in Figs. 26 and 27 for three different wing bending and torsional stiffnesses for a 1-cosine and a sinusoidal gust profile. The gust frequency was varied by changing the length of the gust between 25 and 100 m in increments of 25 m at a fixed aircraft velocity of . The design space was simplified by equating the wing bending and torsional stiffness and fixing the mass and elastic axis locations at , resulting in 12 design points for each gust profile.
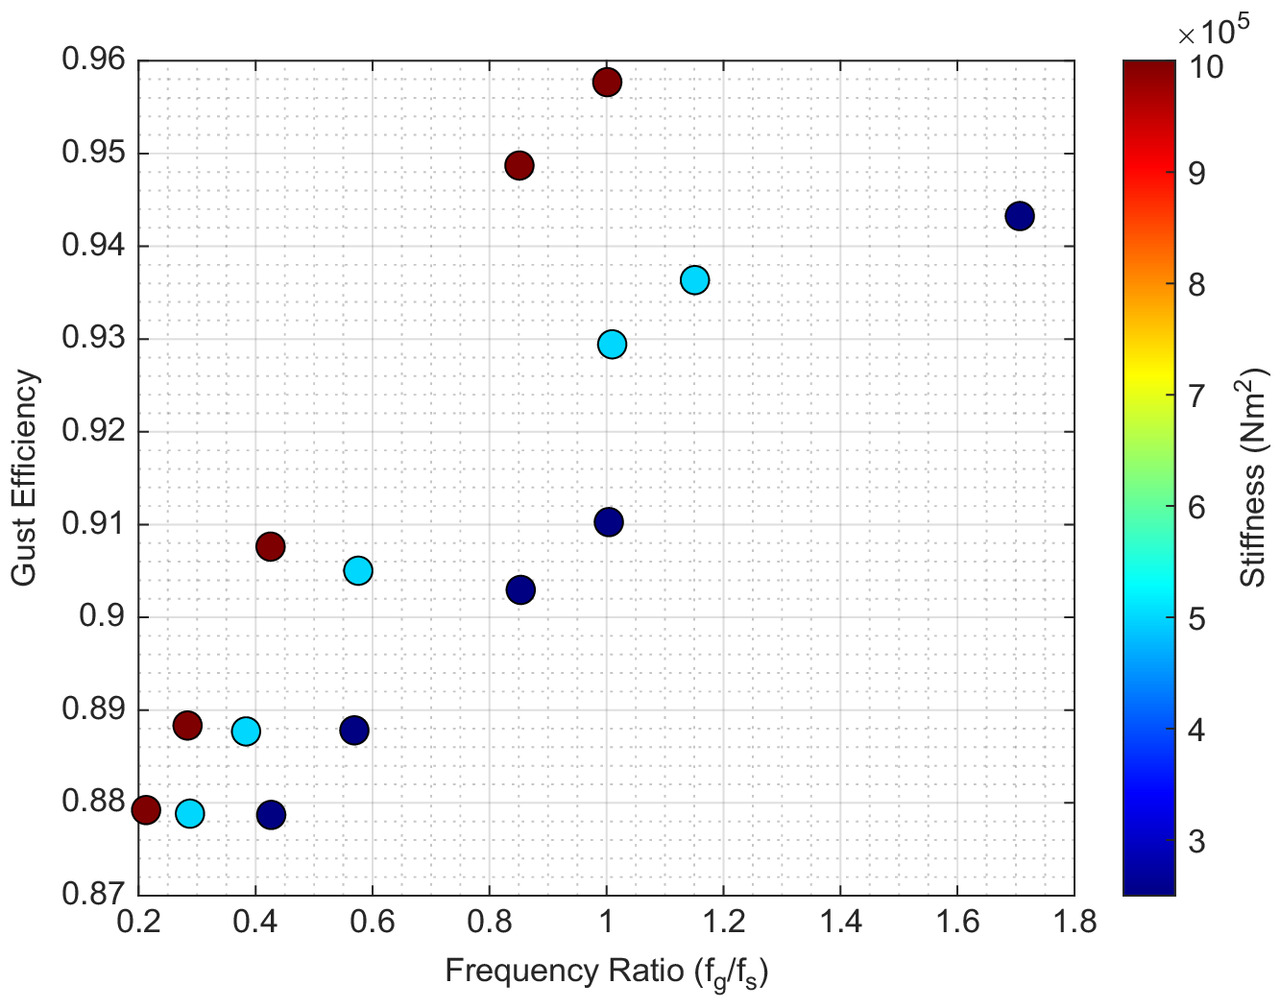
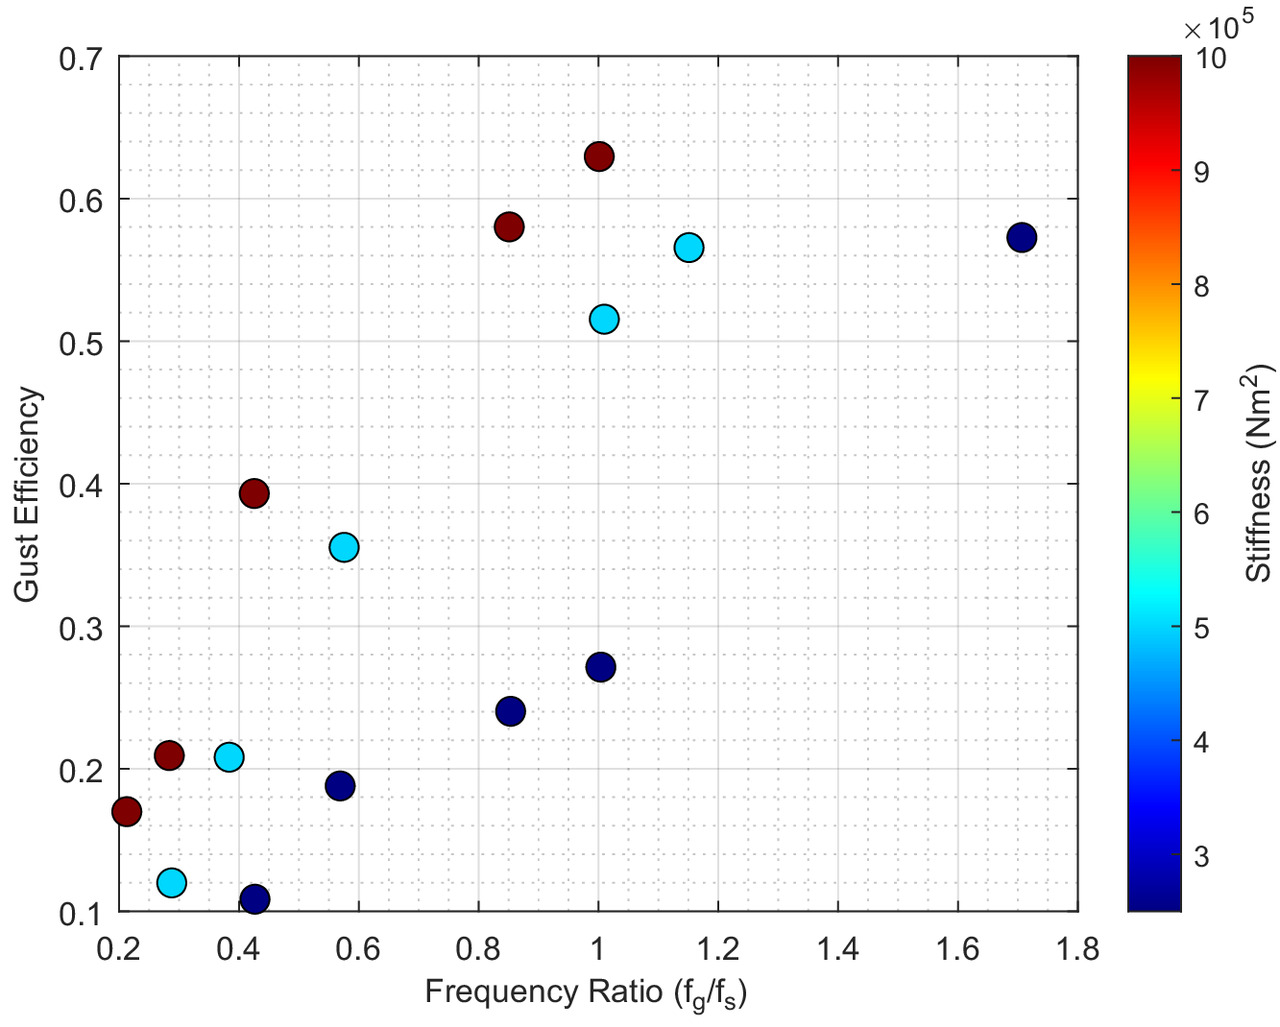
Figs. 26 and 27 show the relationship of the gust-energy extraction efficiency, calculated from Eq. (1), to the ratio of the gust frequency, , and the first structural natural frequency, , for 1-cosine and sinusoidal gust profiles. The scatter plots are overlaid with a gradient of the wing stiffness values associated with each design point. The results are stratified with their respective stiffness values, demonstrating a linear relationship between the gust efficiency and frequency ratio. The stiffer wing configurations showed a stronger influence of the frequency ratio on the gust efficiency compared with more flexible configurations, as demonstrated by the steeper slope of the gust efficiency results over the frequency ratio range investigated. The most efficient configurations investigated correspond to stiffer structures encountering sharper, shorter wavelength gusts, thus resulting in larger frequency ratios being more desirable. The linearly increasing behavior of the gust efficiency for each stiffness value suggests that the sharpness of the gust is the driving factor in improving the energy extraction efficiency. For the 1-cosine profile, the gust efficiency was reduced by 5%–7% when increasing the gust length and increasing the structural flexibility. A more dramatic difference was observed with the sinusoidal profile, with changes in efficiency of nearly 50% being observed.
Although longer gusts are preferable to maximize the magnitude of the energy gained, the efficiency through which the energy extracted was best for shorter gust lengths, as observed with Figs. 26 and 27. Stiffer configurations showed the best gust efficiency across various frequency ratios, a result in line with the trends established in the parametric sweep and genetic algorithm, which both preferred stiffer wing configurations, particularly in bending.
Conclusions
A design-space exploration was performed to quantify the impact of specific wing structural properties on the gust-energy-harvesting capabilities and identify the configurations that provide the best gust-energy gains. Performance improvements of 10%–15% with respect to the steady-state glide performance were observed for a sinusoidal gust profile, and improvements of 60%–65% were seen for a 1-cosine gust profile. Although performance improvements were expected with only upward airmass motions such as the 1-cosine gust, 10%–15% performance gains with a net-zero airmass motion demonstrated considerable benefits. These benefits were confirmed through consideration of a continuous von Kármán gust field.
For instance, in the 18-m class of the most recent world gliding championship, the total point difference between the winner and 27th place was less than 15%, and the average difference in average cross-country speed between the first and second place finishers across all tasks was only (WGC 2022). Thus, any marginal improvement to the glide performance, even on the order of a few percent, can translate into significant advantages in the competition space.
The benefits of aeroelastic tailoring were most evident for the sinusoidal profile, and the energy gained for the best- and worst-performing design points differed by nearly a factor of 2, citing gust efficiencies of 68% and 36%, respectively. Minimizing the vertical tip deflection and maximizing the twist angle to maximize the load factor and thrust due to the gust seems to be the driving cause in improving the energy-harvesting capabilities of the wing. The most beneficial designs used a wing structure that is stiff in bending but flexible in torsion. The residual aircraft response beyond the length of the gust showed the largest differences in the energy gain, demonstrating the importance to consider larger time scales when assessing the gust performance of an aircraft. The gust efficiency results demonstrate the importance of aeroelastic tailoring as a beneficial means of improving gust-energy extractions, allowing one to produce a design that more closely approaches the maximum idealized energy gain.
The design-space exploration was limited to investigating four structural dynamic properties while maintaining a constant wing mass and inertia. Although the wing stiffness and mass are closely related, the current design exploration provided good insight into the driving structural dynamic parameters for maximizing the gust-energy extractions.
Additionally, the effect of the mass and elastic axis locations on the aeroelastic stability margins requires further consideration when approaching a more detailed design. The current design study provided valuable insight into desirable structural configurations that may be used in the early conceptual design stage before moving to the detailed design phase with higher fidelity aeroelastic models.
Notation
The following symbols are used in this paper:
- three-dimensional lift curve slope;
- thrust coefficient;
- wing chord length (m);
- span efficiency;
- wing deflection (m);
- aircraft mass (kg);
- dynamic pressure (Pa);
- aircraft velocity ();
- total energy altitude (m);
- kinetic energy altitude (m);
- potential energy altitude (m);
- angle of attack (degrees);
- wingtip twist angle (degrees); and
- vehicle pitch (degrees).
Data Availability Statement
All data, models, or code generated or used during the study are available from the corresponding author by request.
Acknowledgments
This research was made possible through the support of the Natural Science and Engineering Research Council Discovery Grant “Flight Performance Enhancements using Atmospheric Gusts and Aeroelastic Effects” (funding Reference No. RGPIN-2016-03920).
References
Abdulrahim, M., N. Weibley, D. Lee, R. C. Lind, G. J. Armanious, and P. M. Suh. 2018. “Aeroservoelastic control of UAV wings using a distributed sensing, computing, and actuation architecture.” In Proc., 2018 AIAA Atmospheric Flight Mechanics Conf. Reston, VA: American Institute of Aeronautics and Astronautics.
Bramesfeld, G. 2006. “A higher order vortex-lattice method with a force-free wake.” Ph.D. thesis, Dept. of Aerospace Engineering, Pennsylvania State Univ.
Bramesfeld, G., and M. D. Maughmer. 2008. “Relaxed-wake vortex-lattice method using distributed vorticity elements.” J. Aircr. 45 (2): 560–568. https://doi.org/10.2514/1.31665.
Cole, J., M. Melville, and G. Bramesfeld. 2022. “A metric for determining the efficiency of gust energy extraction.” In Technical soaring. Samedan, Switzerland: Organisation Scientifique et Technique Internationale du Vol á Voile.
Cole, J. A. 2016. “A higher-order free-wake method for propeller-wing systems.” Ph.D. thesis, Dept. of Aerospace Engineering, Pennsylvania State Univ.
Cole, J. A., M. D. Maugher, M. Kinzel, and G. Bramesfeld. 2019. “Higher-order free-wake method for propeller–wing systems.” J. Aircr. 56 (1): 150–165. https://doi.org/10.2514/1.C034720.
Cole, J. A., M. D. Maughmer, G. Bramesfeld, M. Melville, and M. Kinzel. 2020. “Unsteady lift prediction with a higher-order potential flow method.” Aerospace 7 (5): 15–23. https://doi.org/10.3390/aerospace7050060.
Depenbusch, N. T., J. J. Bird, and J. W. Langelaan. 2018. “The Autosoar autonomous soaring aircraft, Part 1: Autonomy algorithms.” J. Field Rob. 35 (6): 868–889. https://doi.org/10.1002/rob.21782.
Dessi, D., and F. Mastroddi. 2008. “A nonlinear analysis of stability and gust response of aeroelastic systems.” J. Fluids Struct. 24 (3): 436–445. https://doi.org/10.1016/j.jfluidstructs.2007.09.003.
DLR (Deutches Zentrum für Luft- und Raumfahrt). 2015. Flugleistungsvermessung discus-2c dlr, d-9833. Braunschweig, Germany: DLR.
Drela, M. 1999. “Integrated simulation model for preliminary aerodynamic, structural, and control-law design of aircraft.” In Proc., 40th Structures, Structural Dynamics, and Materials Conf. and Exhibit. Reston, VA: American Institute of Aeronautics and Astronautics.
Etkin, B., and L. D. Reid. 1996. Dynamics of flight: Stability and control. New York: Wiley.
Francois, G., J. E. Cooper, and P. M. Weaver. 2015. “Aeroelastic tailoring using rib/spar orientations: Experimental investigation.” In Proc., 56th AIAA/ASME/ASCE/AHS/SC Structures, Structural Dynamics, and Material Conf. Reston, VA: American Institute of Aeronautics and Astronautics.
Henson, M. C. 2017. “Optimization of aircraft tow steered composite wing structures.” Ph.D. thesis, Dept. of Mechanical and Aerospace Engineering, Univ. of Texas at Arlington.
Houbolt, J. C. 1951. A recurrence matrix solution for the dynamic response of elastic aircraft. Washington, DC: National Advisory Committee for Aeronautics.
Ironside, D., G. Bramesfeld, and J. Schwochow. 2010. “Modeling of wing drag reductions due to structural dynamics in atmospheric gusts.” In Proc., 28th AIAA Applied Aerodynamics Conf. Reston, VA: American Institute of Aeronautics and Astronautics.
Jones, K. D., C. M. Dohring, and M. F. Platzer. 1998. “Experimental and computational investigation of the Knoller-Betz effect.” AIAA J. 36 (7): 1240–1246. https://doi.org/10.2514/2.505.
Katzmayr, R. 1922. Effect of periodic changes of angle of attack on behavior of airfoils. Washington, DC: National Advisory Committee for Aeronautics.
Kohonen, T. 1982. “Self-organized formation of topologically correct feature maps.” Biol. Cybern. 43 (1): 59–69. https://doi.org/10.1007/BF00337288.
Kohonen, T. 2013. “Essentials of the self-organizing map.” Neural Networks 37 (Jun): 52–65. https://doi.org/10.1016/j.neunet.2012.09.018.
Kohonen, T., E. Oja, O. Simula, A. Visa, and J. Kangas. 1996. “Engineering applications of the self-organizing map.” Proc. IEEE 84 (10): 1358–1384.
Langelaan, J. W. 2009. “Gust energy extraction for mini and micro uninhabited aerial vehicles.” J. Guid. Control Dyn. 32 (2): 464–473. https://doi.org/10.2514/1.37735.
Langelaan, J. W. 2011. “A gust soaring controller for small uninhabited gliders.” Tech. Soaring 35 (2): 48–60.
Langelaan, J. W., and G. Bramesfeld. 2008. “Gust energy extraction for mini- and micro-uninhabited aerial vehicles.” In Proc., 46th Aerosciences Conf. Reston, VA: American Institute of Aeronautics and Astronautics.
Lasauskas, E. 2016. “Influence of sailplane wing-bending flexibility on ‘1-cosine’ gust loads.” Aeronaut. J. 120 (1234): 1943–1955. https://doi.org/10.1017/aer.2016.99.
Lissaman, P. 2007. “Wind energy extraction by birds and flight vehicles.” Tech. Soaring 31 (2): 52–60.
Lissaman, P. B. S., and C. K. Patel. 2007. “Neutral energy cycles for a vehicle in sinusoidal and turbulent vertical gusts.” In Proc., 45th AIAA Aerospace Sciences Meeting and Exhibit. Reston, VA: American Institute of Aeronautics and Astronautics.
Lupp, C. A., and C. E. Cesnik. 2015. “Aeroelastic tailoring for maximizing sailplane average cross-country speed.” In Proc., AIAA Atmospheric Flight Mechanics Conf. Reston, VA: American Institute of Aeronautics and Astronautics.
Mai, H. U. 1985. “The effect of aeroelasticity upon energy retrieval of a sailplane penetrating a gust.” In Proc., 19th Congress of OSTIV. Braunschweig, Germany: Organisation Scientifique et Technique Internationale du Vol a Voile.
Melville, M. 2017. “Modeling of gust energy extractions through aeroelastic tailoring.” Master’s thesis, Dept. of Aerospace Engineering, Ryerson Univ.
Melville, M., G. Bramesfeld, A. Kolaei, and H. Alighanbari. 2020. “Aeroelastic tailoring for gust-energy extraction.” J. Aerosp. Eng. 33 (4): 04020041. https://doi.org/10.1061/(ASCE)AS.1943-5525.0001158.
Munteanu, S. L., J. Rajadas, C. Nam, and A. Chattopadhyay. 2005. “Reduced-order-model approach for aeroelastic analysis involving aerodynamic and structural nonlinearities.” AIAA J. 43 (3): 560–571. https://doi.org/10.2514/1.10971.
Murua, J., R. Palacios, and J. M. R. Graham. 2012. “Applications of the unsteady vortex-lattice method in aircraft aeroelasticity and flight dynamics.” Prog. Aerosp. Sci. 55 (Jun): 46–72. https://doi.org/10.1016/j.paerosci.2012.06.001.
Newcomb, B. A. 2016. “Processing, structure, and properties of carbon fibers.” Composites, Part A 91 (Aug): 262–282. https://doi.org/10.1016/j.compositesa.2016.10.018.
Otsuka, K., A. del Carre, and R. Palacios. 2021. “Nonlinear aeroelastic analysis of high-aspect-ratio wings with a low-order propeller model.” J. Aircraft 59 (2): 293–306. https://doi.org/10.2514/1.C036285.
Patel, C. K., H.-T. Lee, and I. M. Kroo. 2009. “Extracting energy from atmospheric turbulence with flight tests.” Tech. Soaring 33 (4): 100–108.
Phillips, W. H. 1975. “Propulsive effects due to flight through turbulence.” J. Aircr. 12 (7): 624–626. https://doi.org/10.2514/3.44480.
Raveh, D. E. 2011. “Gust-response analysis of free elastic aircraft in the transonic flight regime.” In Proc., 51st AIAA/ASME/ASCE/AHS/ASC Structures, Structural Dynamics, and Materials Conf. Reston, VA: American Institute of Aeronautics and Astronautics.
Sachs, G., A. Knoll, and K. Lesch. 1991. “Optimal utilization of wind energy for dynamic soaring.” Tech. Soaring 15 (2): 48–55.
Saltari, F., C. Riso, G. D. Matteis, and F. Mastroddi. 2017. “Finite-element-based modeling for flight dynamics and aeroelasticity of flexible aircraft.” J. Aircr. 54 (6): 2350–2366. https://doi.org/10.2514/1.C034159.
Schempp-Hirth. 2022. “Discus-2c.” Accessed July 10, 2022. https://www.schempp-hirth.com/en/sailplanes/discus/discus-2c.
Schirra, J. C., J. H. Watmuff, and J. M. Bauschat. 2014. “Highly non-planar lifting systems: A relative assessment of existing potential-methodologies to accurately estimate the induced drag.” In Proc., 32nd AIAA Applied Aerodynamics Conf. Reston, VA: American Institute of Aeronautics and Astronautics.
Shearer, C. M., and C. E. Cesnik. 2007. “Nonlinear flight dynamics of very flexible aircraft.” J. Aircr. 44 (5): 1528–1545. https://doi.org/10.2514/1.27606.
Shirk, M. H., T. J. Hertz, and T. A. Weisshaar. 1986. “Aeroelastic tailoring—Theory, practice, and promise.” J. Aircr. 23 (1): 6–18. https://doi.org/10.2514/3.45260.
US Department of Defense. 1997. U.S. military handbook MIL-HDBK-1797. Washington, DC: US Department of Defense.
Weisshaar, T., C. Nam, and A. Batista-Rodriguez. 1998. “Aeroelastic tailoring for improved UAV performance.” In Proc., 39th AIAA/ASME/ASCE/AHS/ASC Structures, Structural Dynamics, and Materials Conf. and Exhibit. Reston, VA: American Institute of Aeronautics and Astronautics.
WGC (World Gliding Championship). 2022. “37th FAI world gliding championships 2022.” Accessed July 10, 2022. https://www.soaringspot.com/en_gb/37th-fai-world-gliding-championships-2022-szeged-2022/results/18m.
Yeung, A., G. Bramesfeld, J. Chung, and S. Foster. 2018. “Measuring low-altitude wind gusts using the unmanned aerial vehicle GustAV.” J. Unmanned Veh. Syst. 6 (4): 235–248. https://doi.org/10.1139/juvs-2017-0029.
Information & Authors
Information
Published In

Journal of Aerospace Engineering
Volume 36 • Issue 5 • September 2023
Copyright
This work is made available under the terms of the Creative Commons Attribution 4.0 International license, https://creativecommons.org/licenses/by/4.0/.
History
Received: Jul 16, 2022
Accepted: Mar 30, 2023
Published online: Jun 20, 2023
Published in print: Sep 1, 2023
Discussion open until: Nov 20, 2023
Authors
Metrics & Citations
Metrics
Citations
Download citation
If you have the appropriate software installed, you can download article citation data to the citation manager of your choice. Simply select your manager software from the list below and click Download.