Bayesian Methodology for Probabilistic Description of Mechanical Parameters of Masonry Walls
Publication: ASCE-ASME Journal of Risk and Uncertainty in Engineering Systems, Part A: Civil Engineering
Volume 7, Issue 2
Abstract
In consideration of the high vulnerability of the built environment, the assessment of seismic behavior of existing masonry buildings is a key topic in view of their retrofitting and reuse. Because masonry’s behavior depends on complex nonhomogeneous, anisotropic, asymmetric, and nonlinear properties, the definition of suitable mechanical models is still a critical issue, especially for stone masonry. Structural analyses of existing masonry buildings in seismic-prone areas are thus significantly influenced by the adopted mechanical models and assumptions about their relevant masonry properties, which are characterized by large uncertainty. In this study, a procedure for the definition of masonry classes and probability density functions of relevant mechanical parameters, such as elastic modulus and shear modulus, is proposed. The general procedure is illustrated referring to a significant number of in situ double-flat-jack test results on stone masonry obtained by the authors during an ad hoc experimental campaign. Finally, combining information on masonry quality obtained by visual inspection with results of in situ tests, a Bayesian methodology is proposed for the updating of masonry mechanical parameters, thereby providing the basis for a more refined probabilistic assessment of the seismic risk index.
Introduction
In the past, masonry was the most used building material; consequently, masonry buildings are a significant part of existing structures, especially in historical towns (Domański and Matysek 2018). Masonry structures, although mostly built according to empirical rules and architectural canon far away from modern design approaches, generally successfully perform their functions over time. Nevertheless, there is a strong need to measure their structural performance, especially in seismic-prone areas, mainly in view of prioritization strategies for planning of maintenance and strengthening interventions.
In the assessment of unreinforced masonry buildings’ behavior under vertical and horizontal loads, the proper definition of mechanical parameters of the masonry is still a crucial issue. Because a variety of masonry types characterizes existing buildings, depending on materials, block shape and texture, and workmanship, the relevant mechanical parameters can vary in a wide range. Obviously, their evaluation cannot overlook the assessment of the related uncertainty that should be appropriately expressed in probabilistic terms (Sykora et al. 2013; Sykora and Holicky 2010; Marsili et al. 2017a).
A sound definition of probability distribution functions requires a significant amount of material tests, which are not only expensive and time-consuming, but also often incompatible with the needs of preservation of existing structures. For that reason, modern structural codes often provide typical ranges of values for compression and shear strength as well as elastic and shear modulus of the most used masonry types. In this context, the Italian code (Italian Ministry of Infrastructure and Transport 2018; Italian Public Works Council 2019) identifies eight recurrent masonry typologies, also providing coefficients to adjust the values as a function of relevant information, like quality of mortar, thickness of mortar joints, existence of horizontal courses, efficiency of transverse connections, quality of inner core, presence of grout injection and reinforced concrete layers, and so on. Nonetheless, even if the masonry typology is well-defined, subjective judgements can notably influence the estimation of mechanical properties. In practical cases, a workaround could consist in supplementing the reference values of the mechanical properties pertaining to the identified masonry typology, with the results of limited semidestructive or nondestructive in situ tests.
Various studies often reported significantly scattered mechanical properties (Bosiljkov et al. 2005; Croce et al. 2018a), even regarding the same masonry typology, thus making difficult a proper identification of masonry classes and associated mechanical properties, especially when shear modulus and stiffness of masonry walls are involved. Because the intrinsic scattering of these parameters is not enough in itself to justify their huge variability, a critical discussion of the test results, as well as of the individual test arrangements, is always necessary to make the assessment more reliable. Moreover, because the number of in situ destructive or semidestructive tests is often necessarily limited, test results are generally not sufficient to derive the accurate statistics of the mechanical parameters needed for the reliability assessments. In fact, even in the most favorable cases, they may just allow one to evaluate the mean values of the relevant mechanical parameters or assess the material’s degree of homogeneity throughout the structure.
To overcome that lack of information about the masonry mechanical properties, a wide database of test results on masonry walls was collected (Croce et al. 2018a) in the framework of the in situ experimental campaign for the assessment of seismic vulnerability of masonry school buildings in the Municipality of Florence, Italy. Aiming to identify the masonry classes in terms of probability density functions (PDFs) and relevant statistical parameters, namely mean value and standard deviation, a robust methodology has thus been set up, starting from the analysis of a wide database of test results for stone masonry walls.
The proposed method relies on a more general original procedure for the identification of homogenous material classes in secondary databases of raw test results, illustrated by Croce et al. (2018b). The rationale of the procedure, already successfully implemented to identify concrete classes (Croce et al. 2018b) and reinforcing steel classes (Croce et al. 2020) used in Italy during the 1960s, is to partition, by means of a cluster analysis based on Gaussian mixture models (GMMs) (Mclachlan and Peel 2000), a database of mechanical test results to recognize homogenous statistical populations of relevant mechanical parameters. In the following, the focus is on the main mechanical parameters of stone masonry: compressive strength, , elastic modulus, , and shear modulus, , but the method can be easily extended to other relevant parameters and different masonry typologies provided that adequate data sets of experimental results are available.
Once masonry classes are identified, a Bayesian procedure is set up for the updating of PDFs of masonry mechanical parameters based on specific information collected for the structure under investigation. In recent years, Bayesian inference has become a popular approach to model and solve inverse problems in different areas (Dashti and Stuart 2017), but few applications can be found in the field of existing masonry structures. Bayesian model updating techniques have been applied by Bartoli et al. (2017, 2019) for the analysis of masonry towers, by Conde et al. (2018) and De Falco et al. (2018) for the parameter identification of existing masonry bridges, and by Beconcini et al. (2016) to establish PDFs for the variables involved in the probabilistic reliability assessment of heritage buildings, describing the case study of a masonry water work. However, the Bayesian approach is one of the most suitable way for defining probabilistic models for the assessment of existing buildings (Beconcini et al. 2016) due to the possibility to combine information coming from theoretical models, experts’ judgments, and databases of test results with a limited number of experimental test results obtained on the considered structure.
In this work, Bayesian updating is performed supplementing the information obtained by visual inspection, consisting on the masonry quality index (Borri et al. 2015, 2018), with semidestructive double-flat-jack in situ test results (ASTM 2014). Finally, the uncertainty associated with the definition of masonry walls capacity curves, based on the prior and posterior PDFs of mechanical parameters, is discussed, illustrating the suitability of the proposed procedure in the assessment of the seismic performance of masonry buildings for a relevant case study.
General Methodology for the Definition of Masonry Classes
The proposed procedure relies on a more general methodology defined by Croce et al. (2018b) for the evaluation of statistical parameters of existing concrete. The methodology, based on the identification of classes by means of a GMM, can be used to estimate mechanical properties and their statistical parameters on the condition that enough data are available. The method described in the following and summarized in the flowchart in Fig. 1 hypothesizes that the probability distribution of the considered mechanical property can be approximated by a normal distribution, but it could be easily extended and generalized to different PDFs.
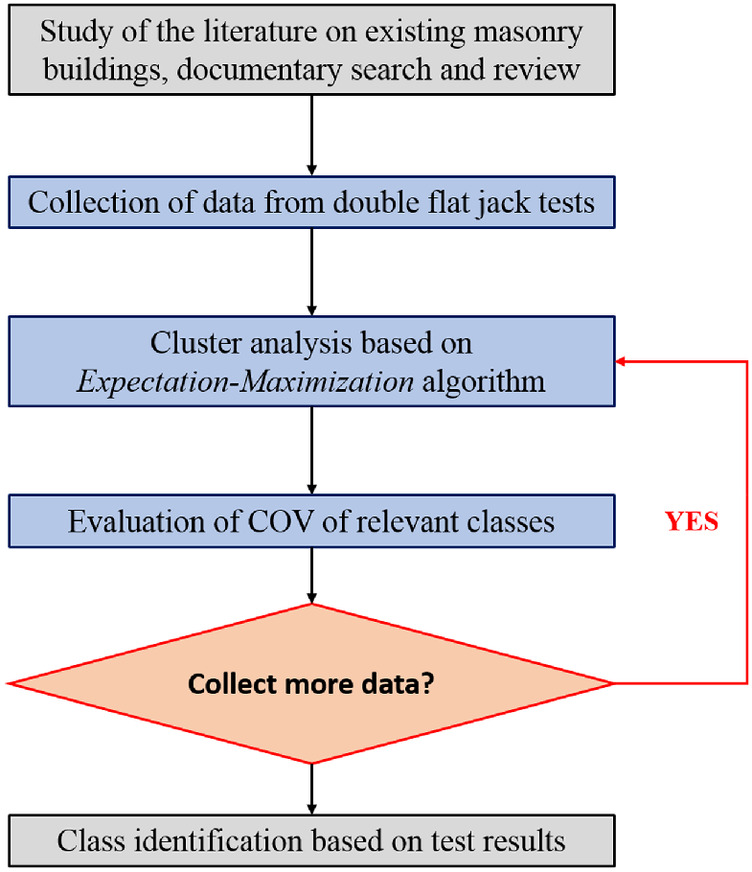
The procedure, starting from literature or archive test results obtained on similar masonry typologies, integrated, if necessary, with experimental in situ tests on masonry panels, allows one to recognize, by means of the cluster analysis, homogenous statistical populations of data and the associated masonry classes.
Database of Test Results
To identify the class of a given masonry type, valuable sources of preliminary information are, besides historical documentation and technical literature, knowledge about building practice at the time of the execution and, above all, analysis of reliable databases of test results. Even if they are generally not easily accessible, the availability of such databases is a necessary starting point for a reliable identification of masonry classes.
In the present study, reference is made to a wide database of compression test results, mainly obtained by the authors in the framework of seismic vulnerability assessments of school masonry buildings in Florence, Italy. That database currently contains the relevant results of 95 double-flat-jack in situ tests, carried out according to the ASTM standard (ASTM 2014). Among these tests, 67 concern irregular partially and fully dressed stone masonry walls, 25 relate to solid brick masonry walls, and the remaining three refer to other kinds of masonry walls. Some representative examples of the texture of the tested walls are shown in Fig. 2(a).
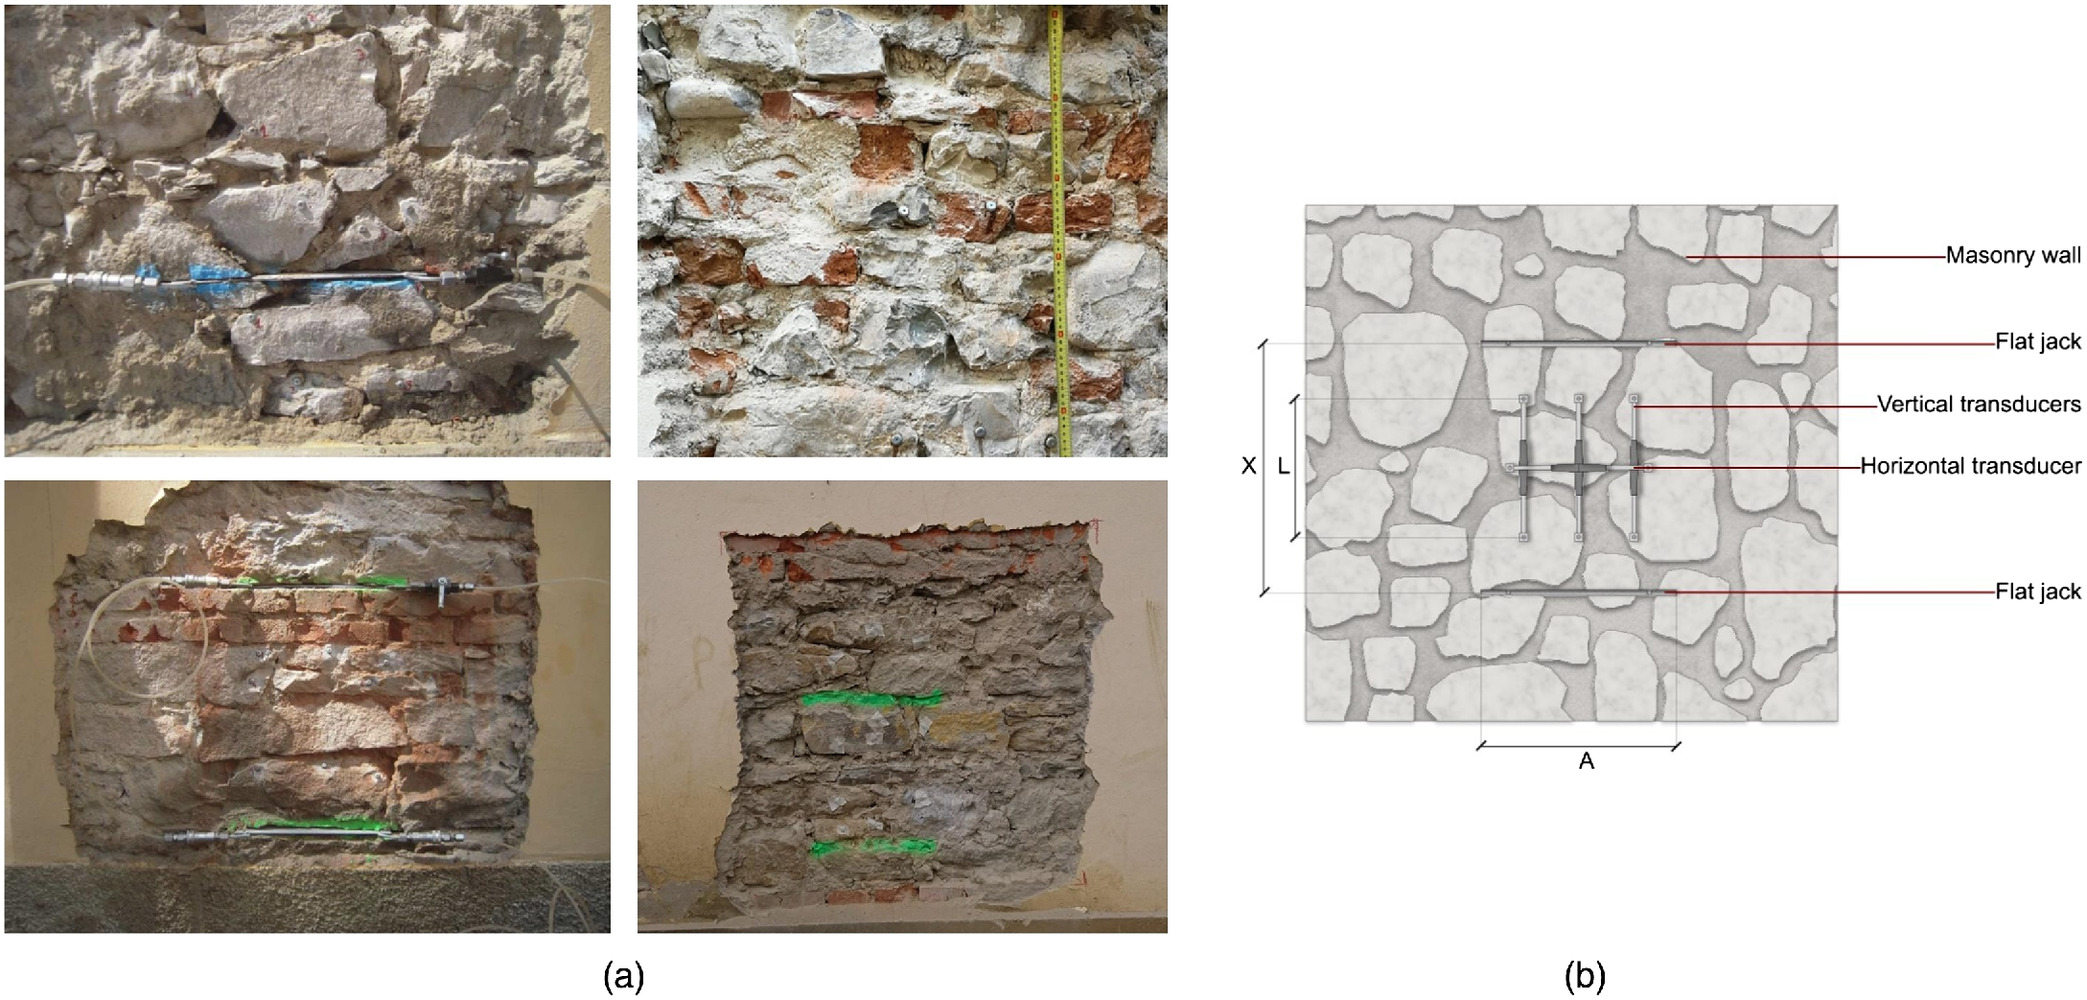
In situ double-flat-jack testing is a semidestructive compressive test method suitable to evaluate the elastic modulus () and compressive strength () of masonry walls. As described in ASTM C1197-91 (ASTM 2014), the basic idea of the test is to carry out a compressive test directly in situ. The load is applied onto the investigated masonry panel via two flat jacks, inserted in horizontal cuts, within the panel’s thickness. In Fig. 2(b), the test arrangement is illustrated, showing the four pairs of measurement bases, three longitudinal and one transversal, placed between the two jacks.
According to ASTM (2014), the height of the panel , which is the distance between the two flat jacks, should satisfywhere = diameter of the flat jack; and = average depth of the jack. The base length of the vertical transducers should be selected in the interval .
(1)
The maximum stress registered during the test, , corresponding to the first cracking load as deduced by visual inspection and by monitoring a sudden increase of the strain (Carpinteri et al. 2009), duly corrected as a function of the jack geometry, is used to estimate the compressive strength of masonry. The elastic modulus is evaluated as the ratio between applied stress and measured vertical strain in reference sections of the stress-strain, , diagram representing elastic and postelastic behavior. The apparent value of Poisson ratio, , is also determined from the measured horizontal displacements; because it is evaluated in a postcracking state, its value often falls outside the theoretical limits for isotropic and homogenous materials, . Finally, from the in situ compression tests, the apparent shear modulus of masonry can be also estimated through the usual relationship for isotropic and homogenous materials, again disregarding cracks
(2)
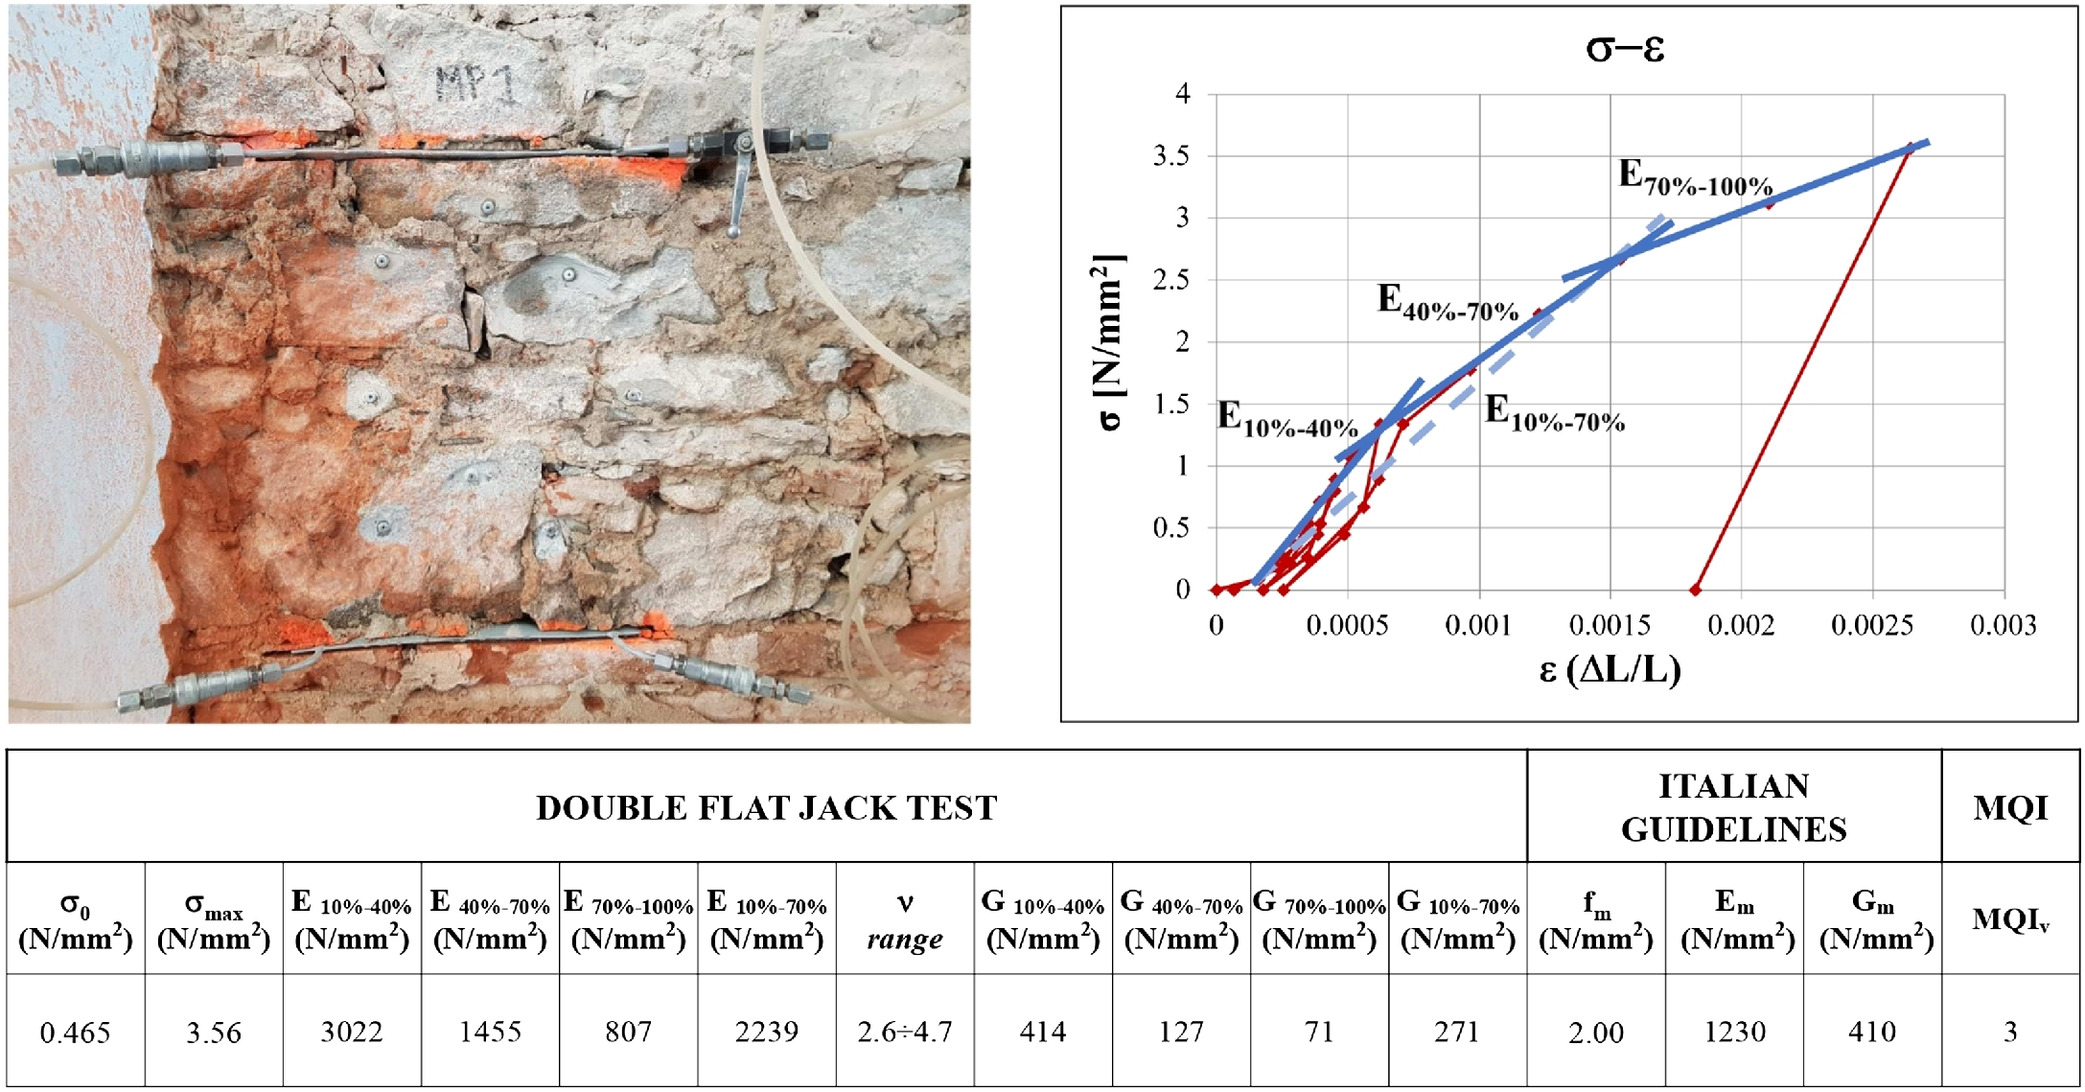
To evaluate the relevant mechanical parameters, test results were elaborated in a consistent way for the whole database. Because the main focus of the assessment is the evaluation of the seismic behavior of masonry walls, different sections of the stress-strain () diagram have been analyzed to estimate elastic and shear modulus. The masonry behavior has been thus approximated linearizing three different sections of the curve: (1) a first section ranging between and , which represents the quasi-elastic section of the diagram; (2) a second intermediate section ranging between and , representing the behavior in cracked conditions; and (3) a final section ranging between and 100%, reflecting the plastic section. In Fig. 3, as an example, the trilinear curve approximating the experimental curve is illustrated for one of the investigated walls.
The values collected in the database have thus been critically discussed, also referring to the recommended values in the guidelines for the application of the Italian building code (Italian Ministry of Infrastructure and Transport 2018; Italian Public Works Council 2019) for the relevant existing masonry typologies. In addition, the masonry quality index (MQI) (Borri et al. 2015, 2018) has been evaluated starting from the information on masonry quality obtained by visual inspection. As an example, the final synthesis report pertaining to an investigated stone masonry wall is also illustrated in Fig. 3. That report gives the actual normal stress in the masonry measured by single-flat-jack testing; the maximum registered stress , elastic moduli , and shear moduli in the different sections of the diagram; the range for the apparent Poisson ratios ; the recommended mean values for , , and provided by the Italian Public Works Council (2019); and the estimated value of MQI.
The database, which includes also in situ diagonal shear and shear compression tests available in the literature (Croce et al. 2018a), as well as shear tests carried out by the authors, is continuously updated once new in situ tests are carried out.
From the test results collected in the database, the statistical parameters, i.e., mean and coefficient of variation (COV), of the relevant masonry mechanical parameters have been derived.
Results in terms of compressive strength , elastic modulus , and shear modulus , are summarized in Table 1 considering stone masonry in different conditions.
| Variable | Mean () | COV | |
|---|---|---|---|
| 1.88 | 0.33 | ||
| 1,816 | 0.39 | ||
| 1,151 | 0.57 | ||
| 618 | 0.55 | ||
| 665 | 0.53 | ||
| 351 | 0.74 | ||
| 149 | 0.63 | ||
As expected, due to the wide variability of masonry properties, data are characterized by high COV, especially concerning elastic and shear moduli (Bosiljkov et al. 2005; Croce et al. 2018a). The phenomenon is evident even referring to the same masonry typology; in fact, the properties depend not only on the quality of the original raw materials, but also on the texture, workmanship, and degradation. Moreover, the quality of the mortar, the presence of irregular or dressed stones, and the different shape and size of the stones well justify the existence of different masonry classes within the same masonry typology.
Cluster Analysis
The basic idea of the method is to identify by means of a cluster analysis based on GMM homogenous statistical populations in the database of test results pertaining a given masonry typology.
Mixture models (MMs) approach the statistical modeling of heterogeneity in a cluster analysis on a mathematical basis. In fact, MMs are able to analyze quite complex distributions, composed of several homogenous populations belonging to the same distribution family, thus allowing different individual components to be recognized. Such kinds of complex distributions cannot be described by a single probability density function, which is unable to provide a satisfactory model for local variations in the observed data. In these cases, assuming the distribution is composed by one single homogenous population could lead to erroneous statistical information, e.g., an unrealistically high COV (Verderame et al. 2001), as well as an inaccurate estimation of the mean value.
Due to their flexibility, mixture models are applied for the statistical modeling of a wide variety of random phenomena. When all the distributions of the mixture belong to the normal family, the model is a GMM (Mclachlan and Peel 2000), but different distributions can be also adopted for the components of the mixture depending on the data. GMMs have been successfully used by Croce et al. (2018b, 2020) to identify coherent material resistance classes in a whole database of test results, even if the origin of individual data were unknown. GMMs will be also adopted in the following analyses for the investigated masonry parameters; in fact, statistical tests such as Kolmogorov-Smirnov carried out on the entire data set do not show a preference for distribution other than normal. However, if necessary, the MM can be easily modified to take into account different distribution family, e.g., lognormal.
In reliability assessment of existing buildings, preliminary manipulations of the collected data, like a priori assignment of some test result to a given class on the basis of information recorded on the test report or on the base of engineering judgments, can influence the results, so they should be avoided. The mixture model, in which each cluster is defined by an appropriate PDF, solves that issue, providing results that can be directly used for the reliability assessment of existing buildings.
Mixture models are methods of classification by unsupervised learning (Press et al. 2007), and they can be used for two purposes: modeling situations in which a single distribution is unable to provide a satisfactory model, and/or the existence of distinct groups for the investigated variable is known a priori in some physical sense.
Suppose that is a random sample of size , where represents the -dimensional random vector with PDF on . In practice includes the random variables corresponding to -measurements made on the th recording of some features on the phenomena under study: represents a n-tuple of points in , and is the observed random sample. A MM with components, whose densities are , , is the distribution characterized by the density (Mclachlan and Peel 2000)where () = mixing proportions or weights
(3)
(4)
Here, has the -component mixture form when it is drawn from a population , which consists of groups in proportion , and the density of in group is given by , .
A GMM can fit a group of data belonging to different populations normally distributed if the population to which each datum belongs is identified, or, equivalently, the statistical parameters of the probability distribution function of each population are known. Because these details are usually unknown, in order to fit the model, an iterative procedure that maximizes the log-likelihood of the data, called expectation-maximization (EM) algorithm, is applied. A detailed description of the EM algorithm has been given by Hastie et al. (2008).
The EM algorithm is a quick converging tool able to reach the maximum likelihood in two steps of iteration. In the first step (expectation phase), an initial assignment of each observation is done for each model, based on Euclidean distance [-means algorithm (Jin and Han 2011)]; in the second step (maximization phase), starting from the expectation-phase estimations, weights, variance, and mixing probability are evaluated. The two steps are iterated until convergence. In this way, clusters are identified with associated weights and statistical parameters and .
In the following, the results of the cluster analysis are reported and discussed for the compressive strength , elastic modulus , and shear modulus in three relevant sections of curve of stone masonry
(5)
The number of components, , has been considered, in turn as , . The reason for such a choice is that for the statistical treatment of this type of test results, notwithstanding that the number of available data can be considered significantly large, consideration of more than three classes could lead to classes including only few data, and therefore the results would scarcely be significant. Furthermore, from an engineering point of view, the simple classification into low-, medium-, and high-quality masonry, already applied by Marsili et al. (2017a), seems very effective for the structural assessment.
Identification of Masonry Classes
As anticipated, the aforementioned cluster analysis of test results allows one to derive the statistical parameters of compressive strength, elastic modulus, and shear modulus of each relevant masonry class.
Masonry Compressive Strength
The evaluation of the compressive strength of masonry walls and pillars is a fundamental step in structural assessment of existing masonry buildings. Despite relatively extensive research into masonry structures, the issue of a reliable determination of the load-bearing capacity of existing stone masonry structures, particularly if historical, is still waiting for a satisfactory solution.
A probabilistic description of compressive strength of regular masonry types has been given by Sykora et al. (2013) and Witzany et al. (2016), based on the EN1996-1-1 model (CEN 2005a), considering and combining test results and related probabilistic models for masonry units and mortar. But this approach can be seldom applied to irregular stone masonry, also because the extraction of an appropriate number of samples from the investigated walls is often impossible.
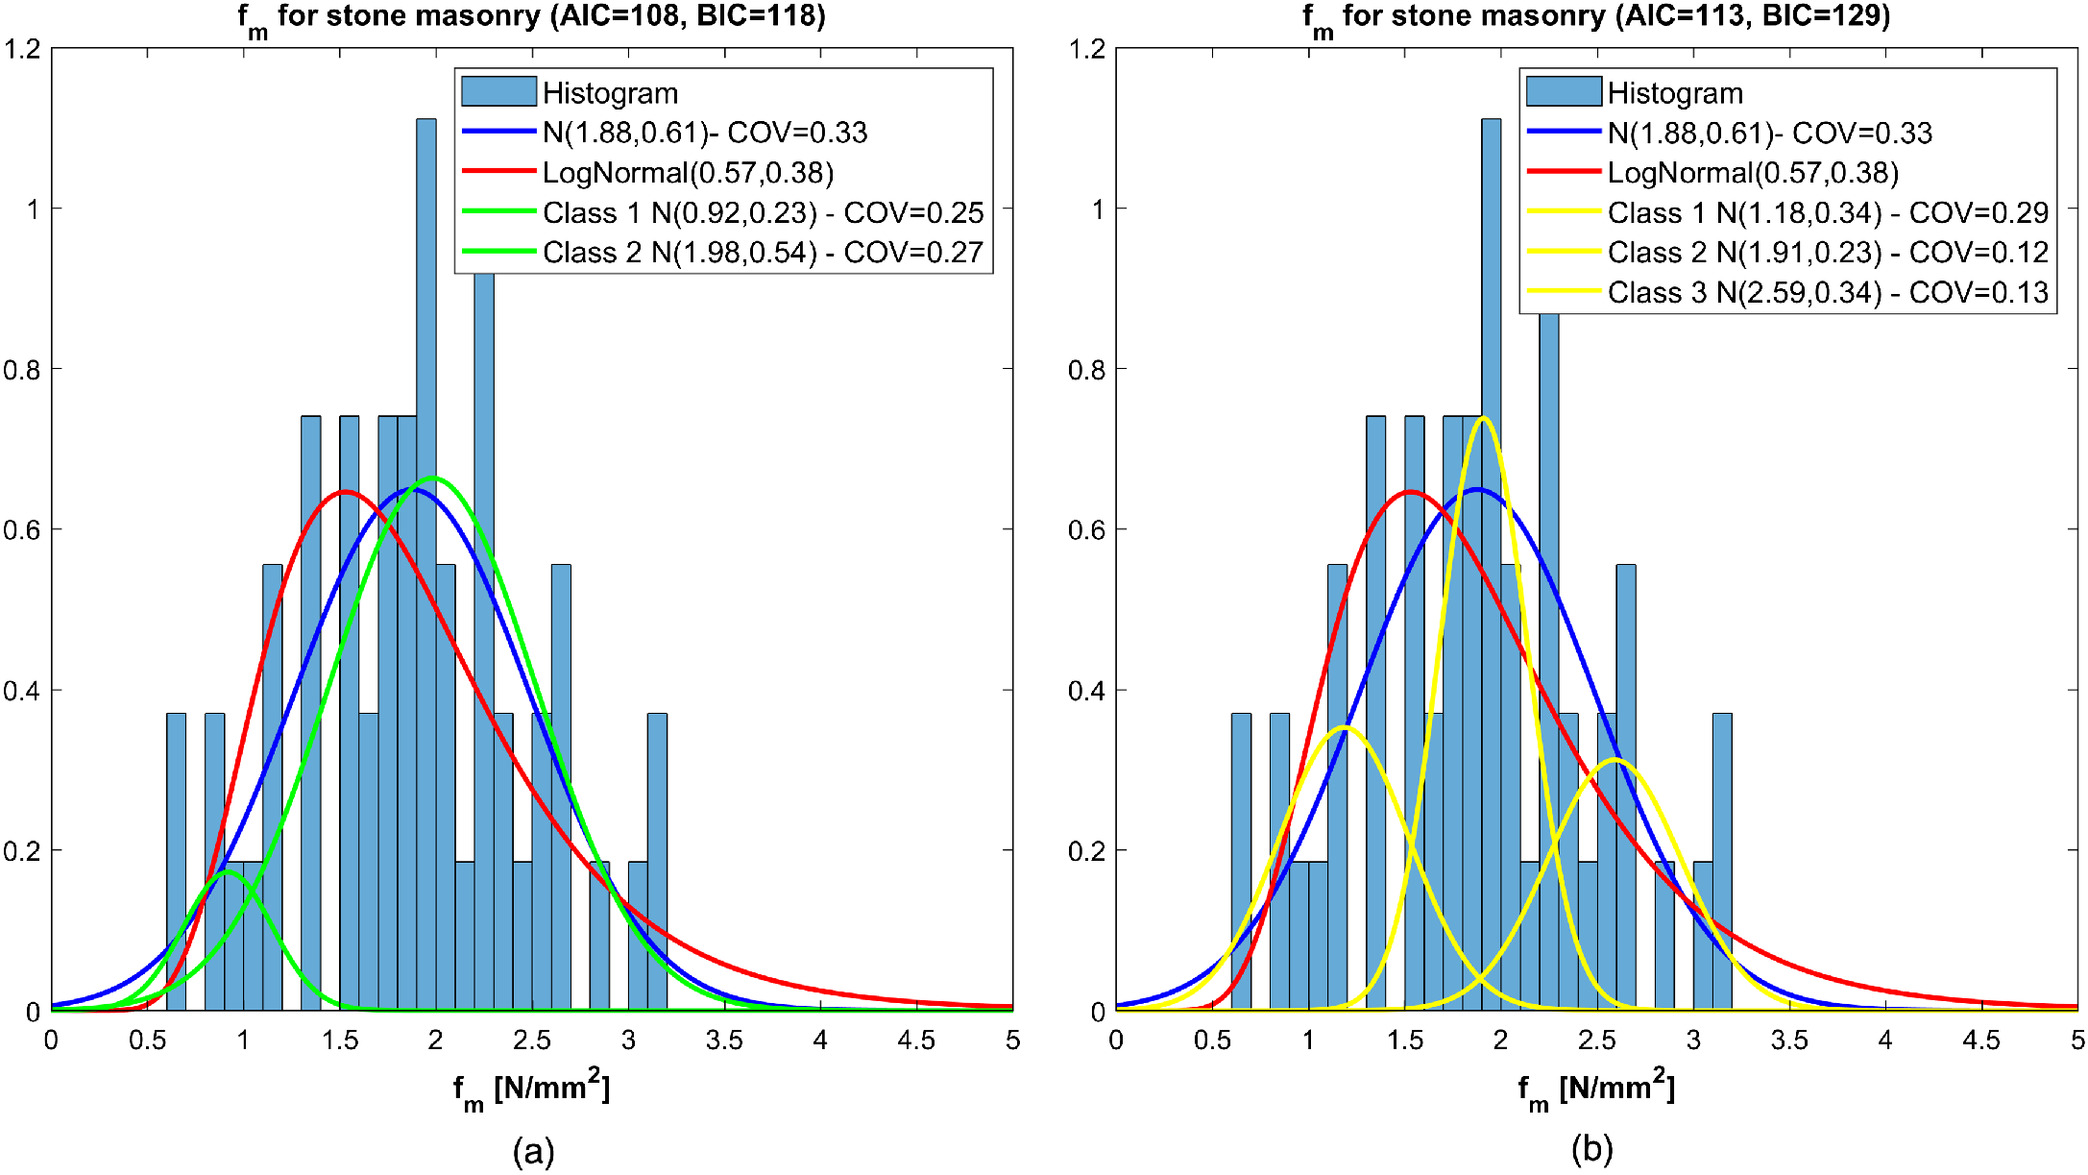
The frequency histogram and the distributions of compressive strength of stone masonry found with the proposed procedure are reported in Fig. 4. The diagram reports, together the probability density functions obtained by fitting the whole data set with a normal distribution and lognormal distribution, the GMMs obtained considering components [Fig. 4(a)] and components [Fig. 4(b)]. In the Figure for each curve relevant statistical parameters, mean value, standard deviation and COV, are given in the legend. The same information is provided also in the following Figs. 5–10. The resulting Akaike information criterion (AIC) and Bayesian information criterion (BIC) are also compared for the models with two and three components.
As already noted by Croce et al. (2018b, 2020), statistical parameters derived via cluster analysis are much more refined than those obtained analyzing the whole data set, and the estimate of the COV associated with each cluster is significantly improved. For example, in the case of , the COV of compressive strength, which is 33% for the whole data set, reduces to 28% for the lower class, 14% for the intermediate class, and 11% for the upper class.
Elastic and Shear Modulus of Masonry
The results obtained according to the proposed procedure for different stone masonry classes are reported in Fig. 5 for the secant elastic moduli, , , and in Fig. 6 for the secant elastic modulus , calculated considering the three previously mentioned intervals of masonry strength [Eq. (5)]. In each figure, the frequency histogram is reported, together with the probability density function obtained by fitting the whole data set with a normal distribution and a lognormal distribution, as well as the obtained GMMs ( components and components).
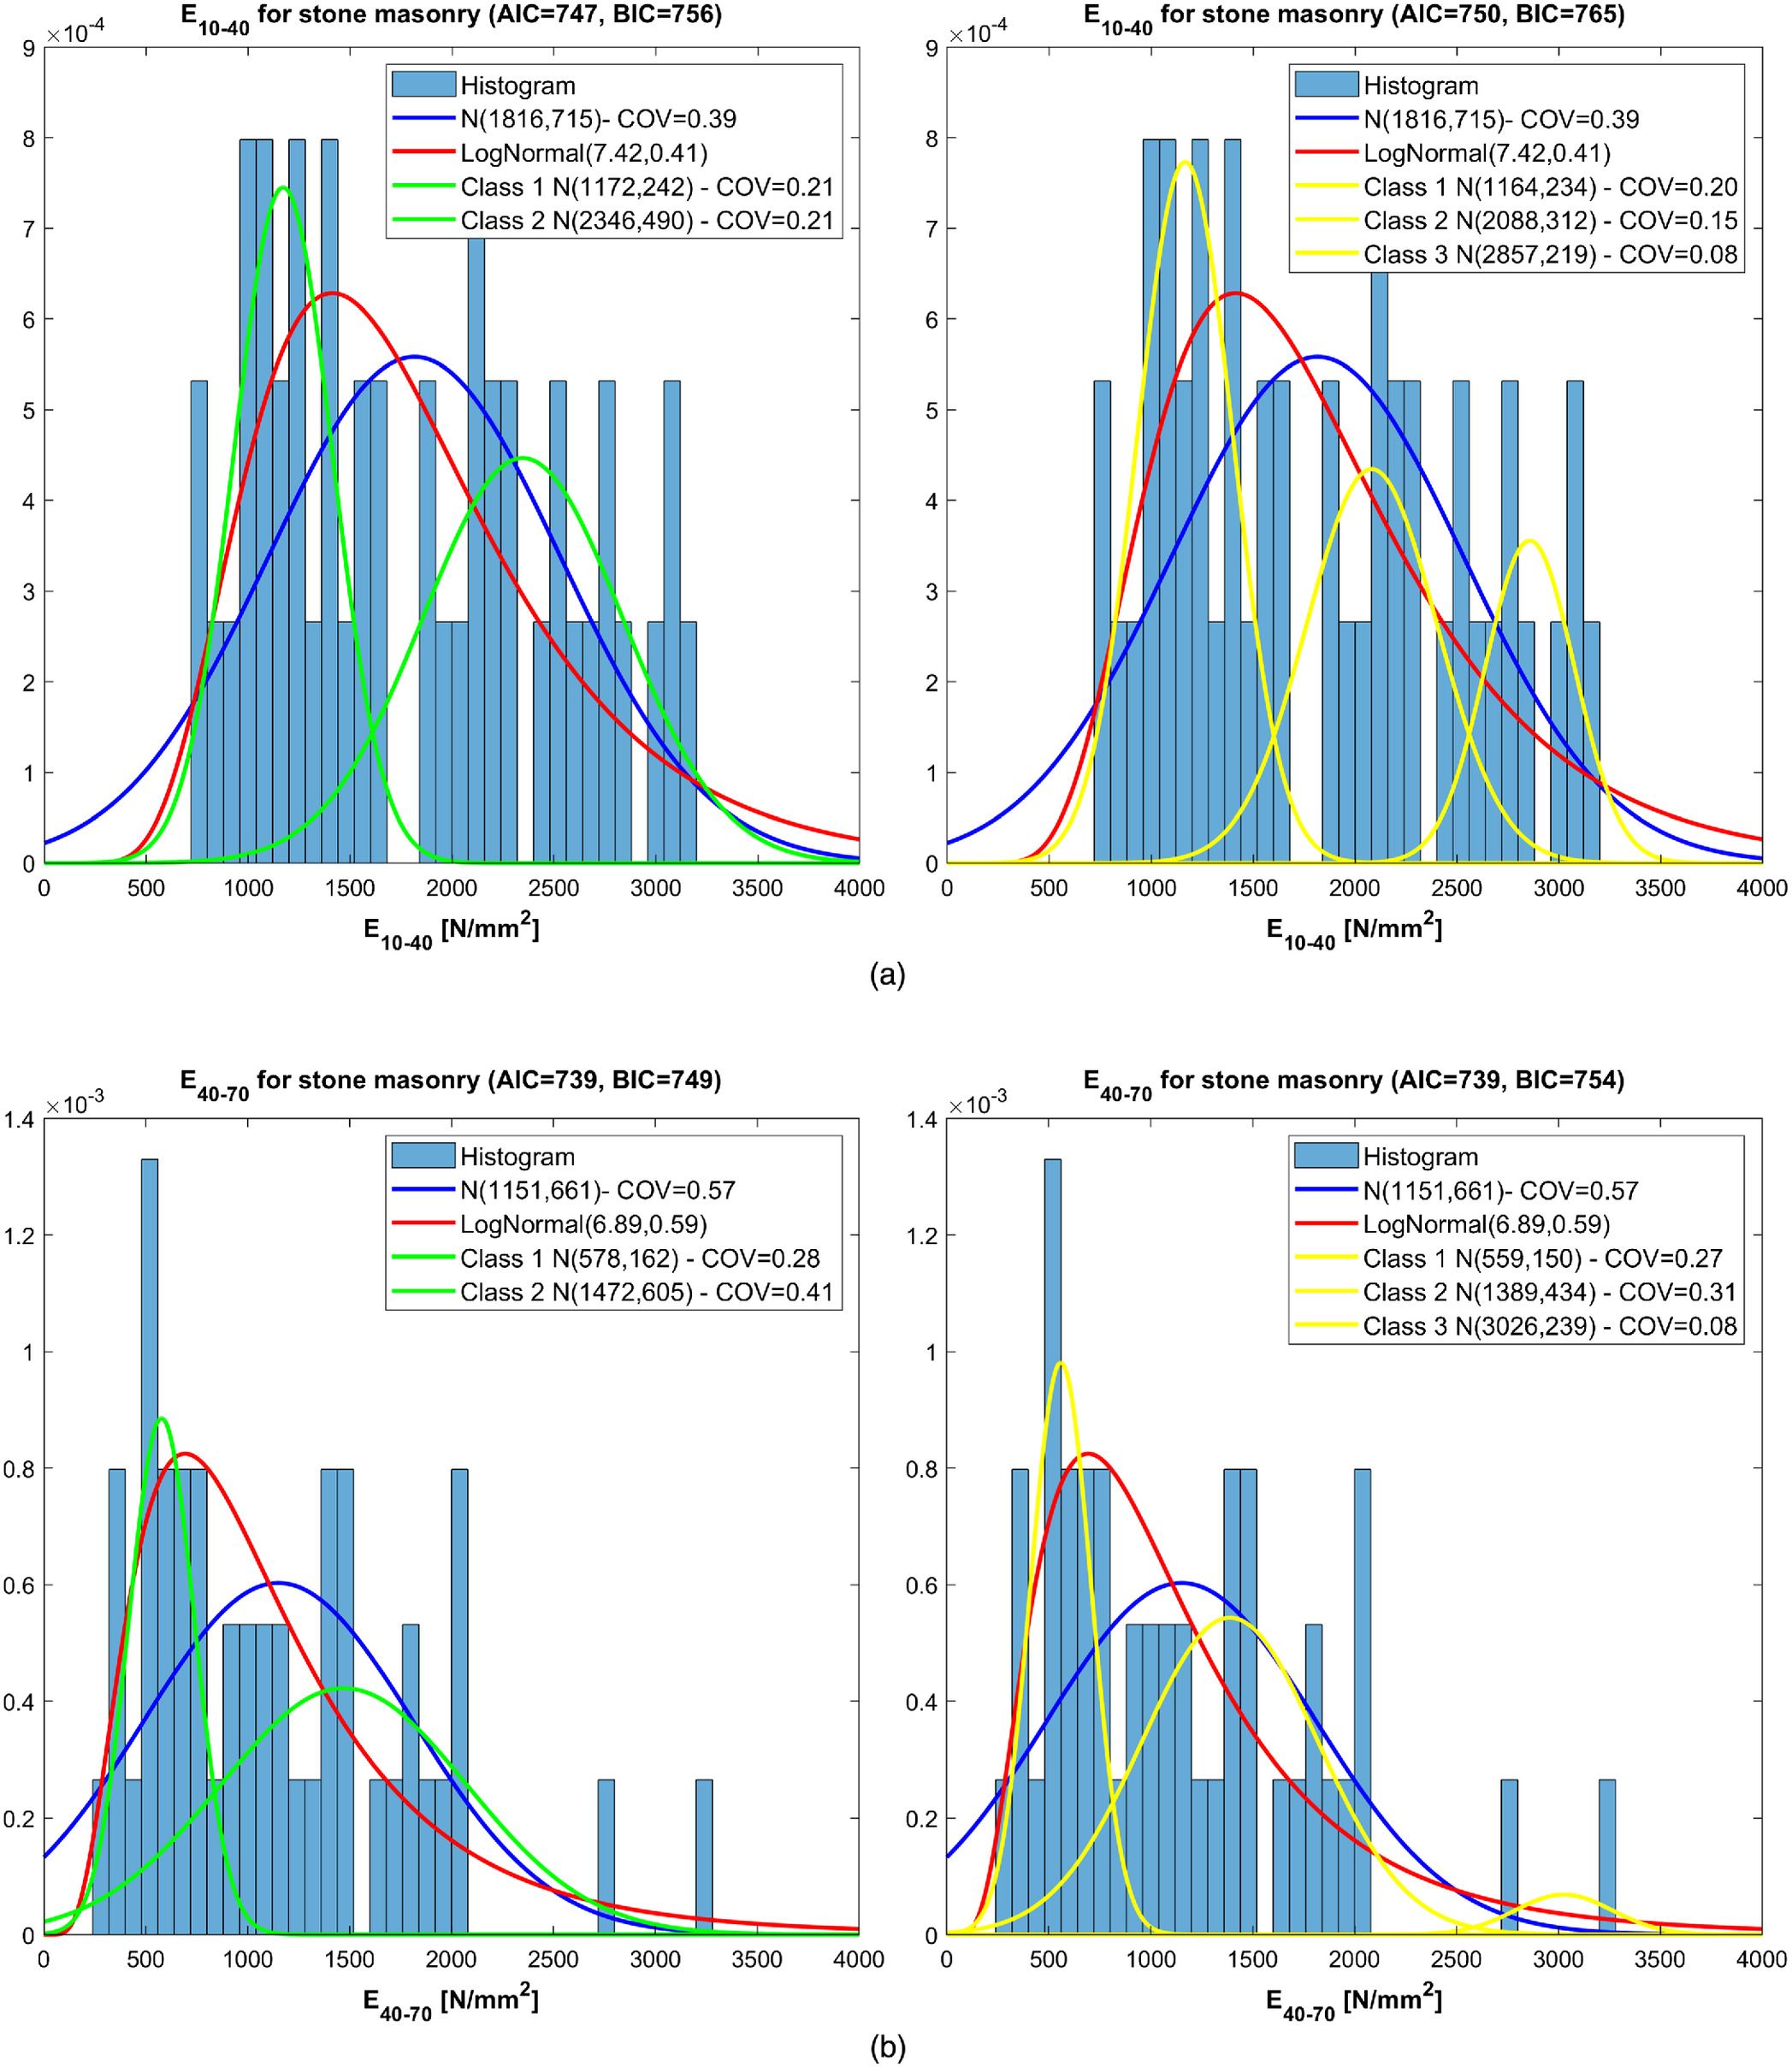
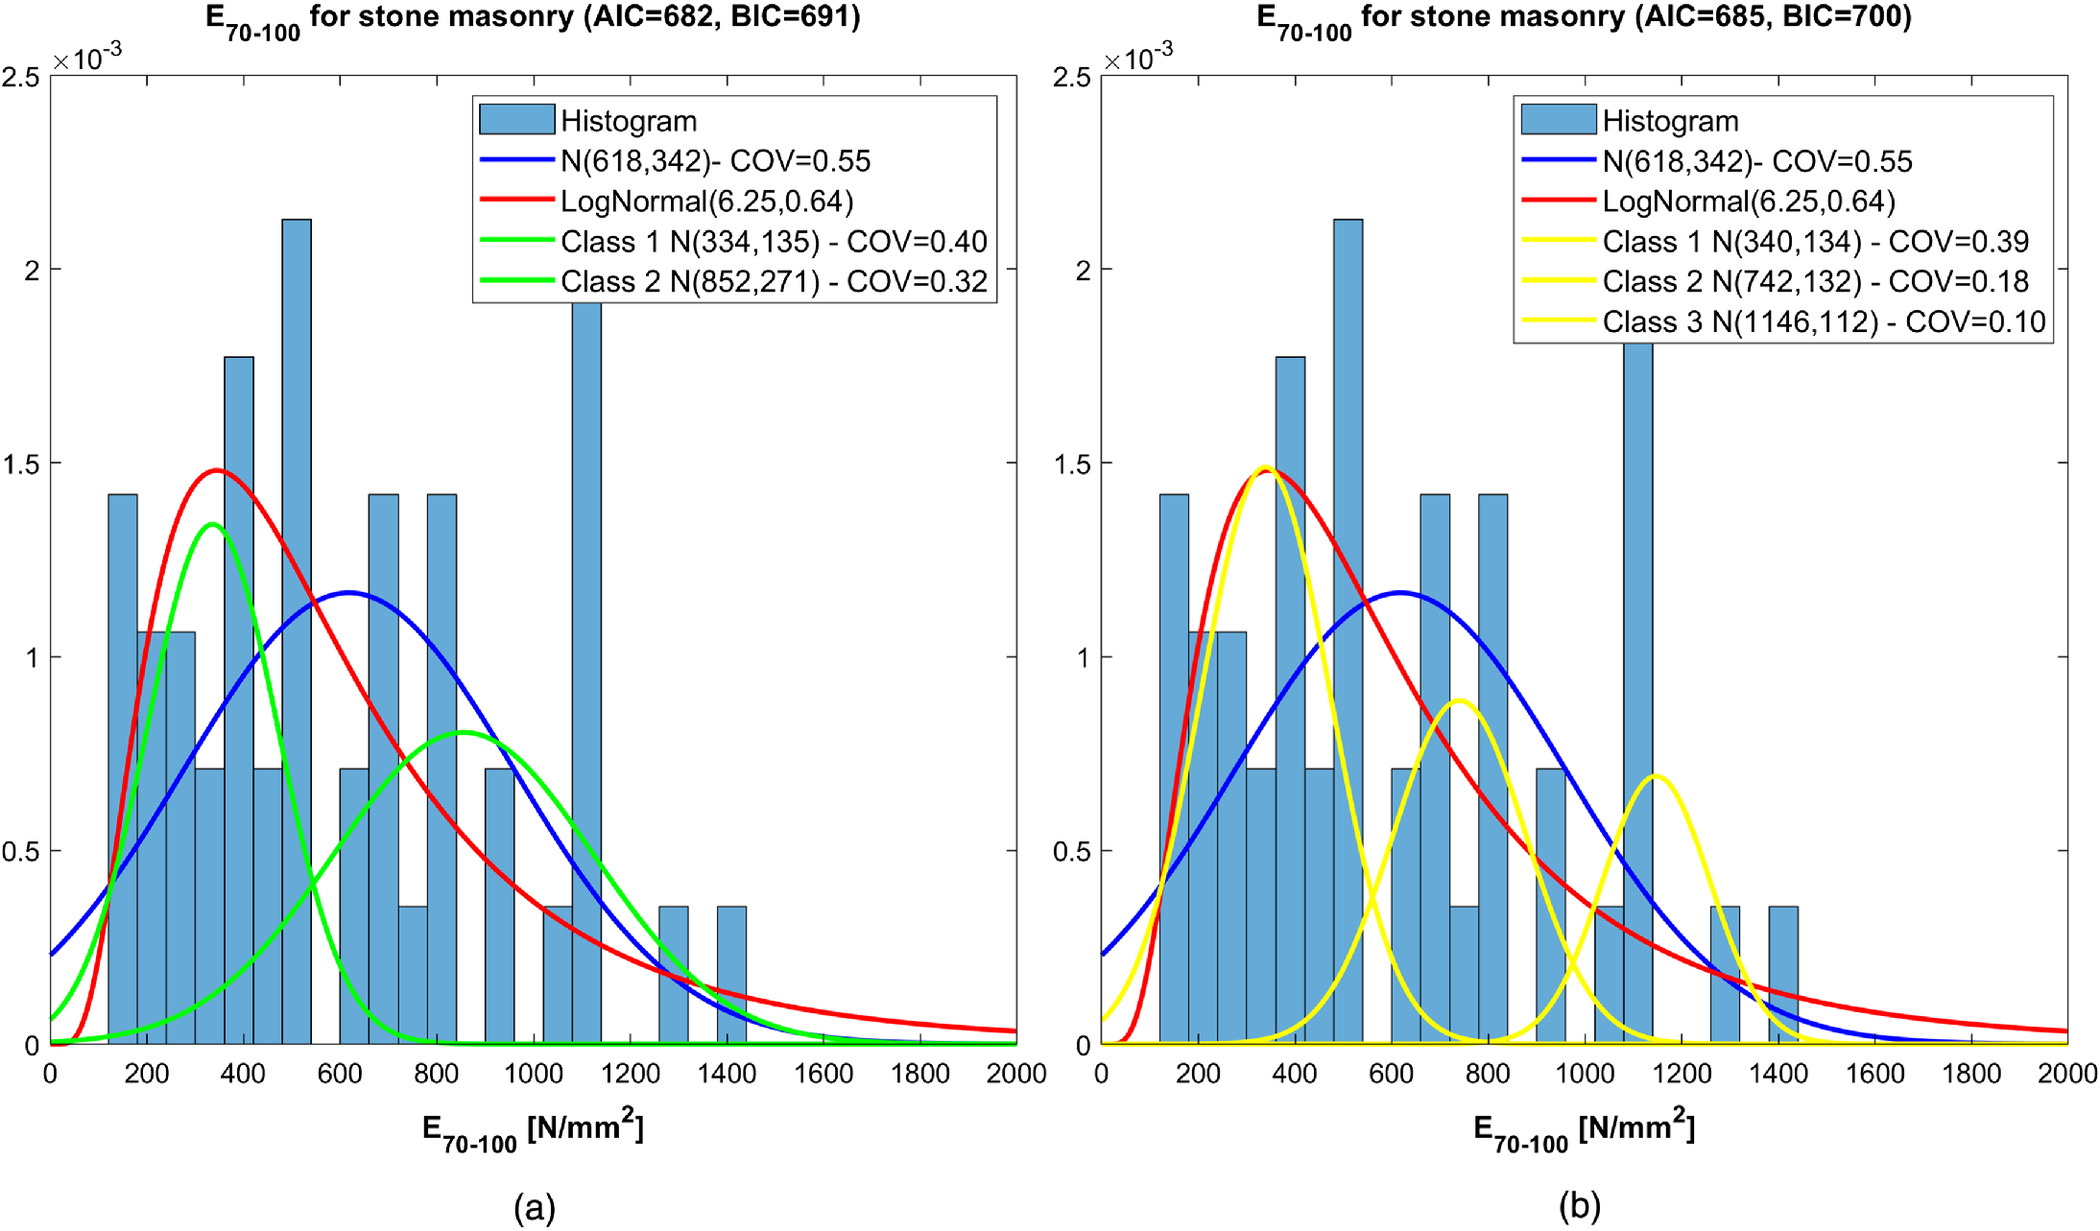
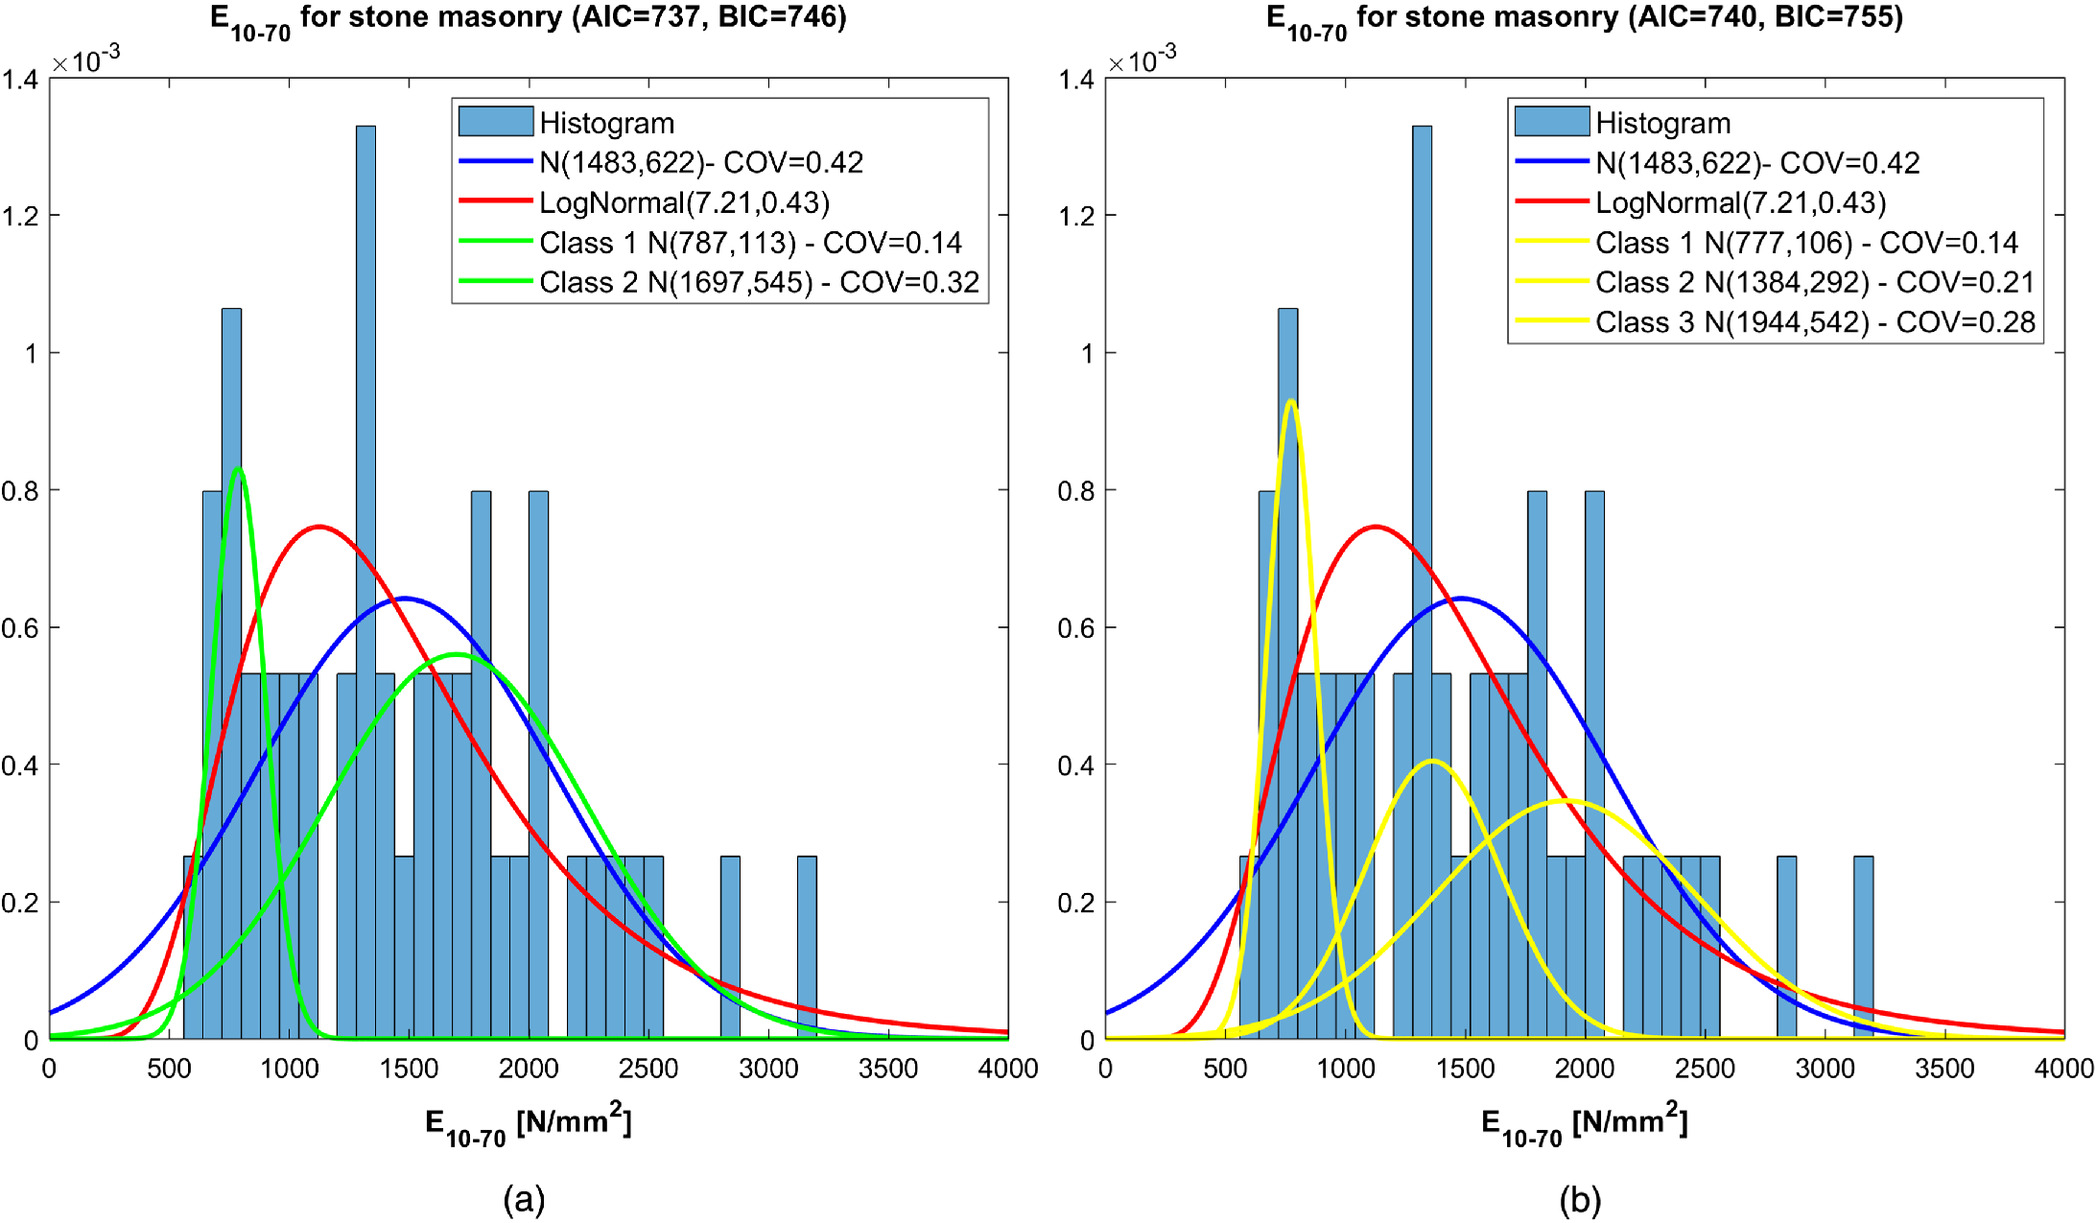
To supplement the results, Fig. 7 illustrates the secant elastic modulus curves . As already observed for masonry compressive strength, the proper identification of subclasses for masonry allows one to significantly improve the estimate of the COV to be associated with each class.
For example, the COVs of the modulus is 20% for the lower class, 15% for the intermediate class, and 8% for the upper class, significantly smaller than that resulting from the analysis of the whole data set, 39%. Meanwhile, the COVs of the modulus (plastic section) are 39% for the lower class, 18% for the intermediate class, and 10% for the upper class, again significantly smaller than that resulting from the analysis of the whole data set (55%).
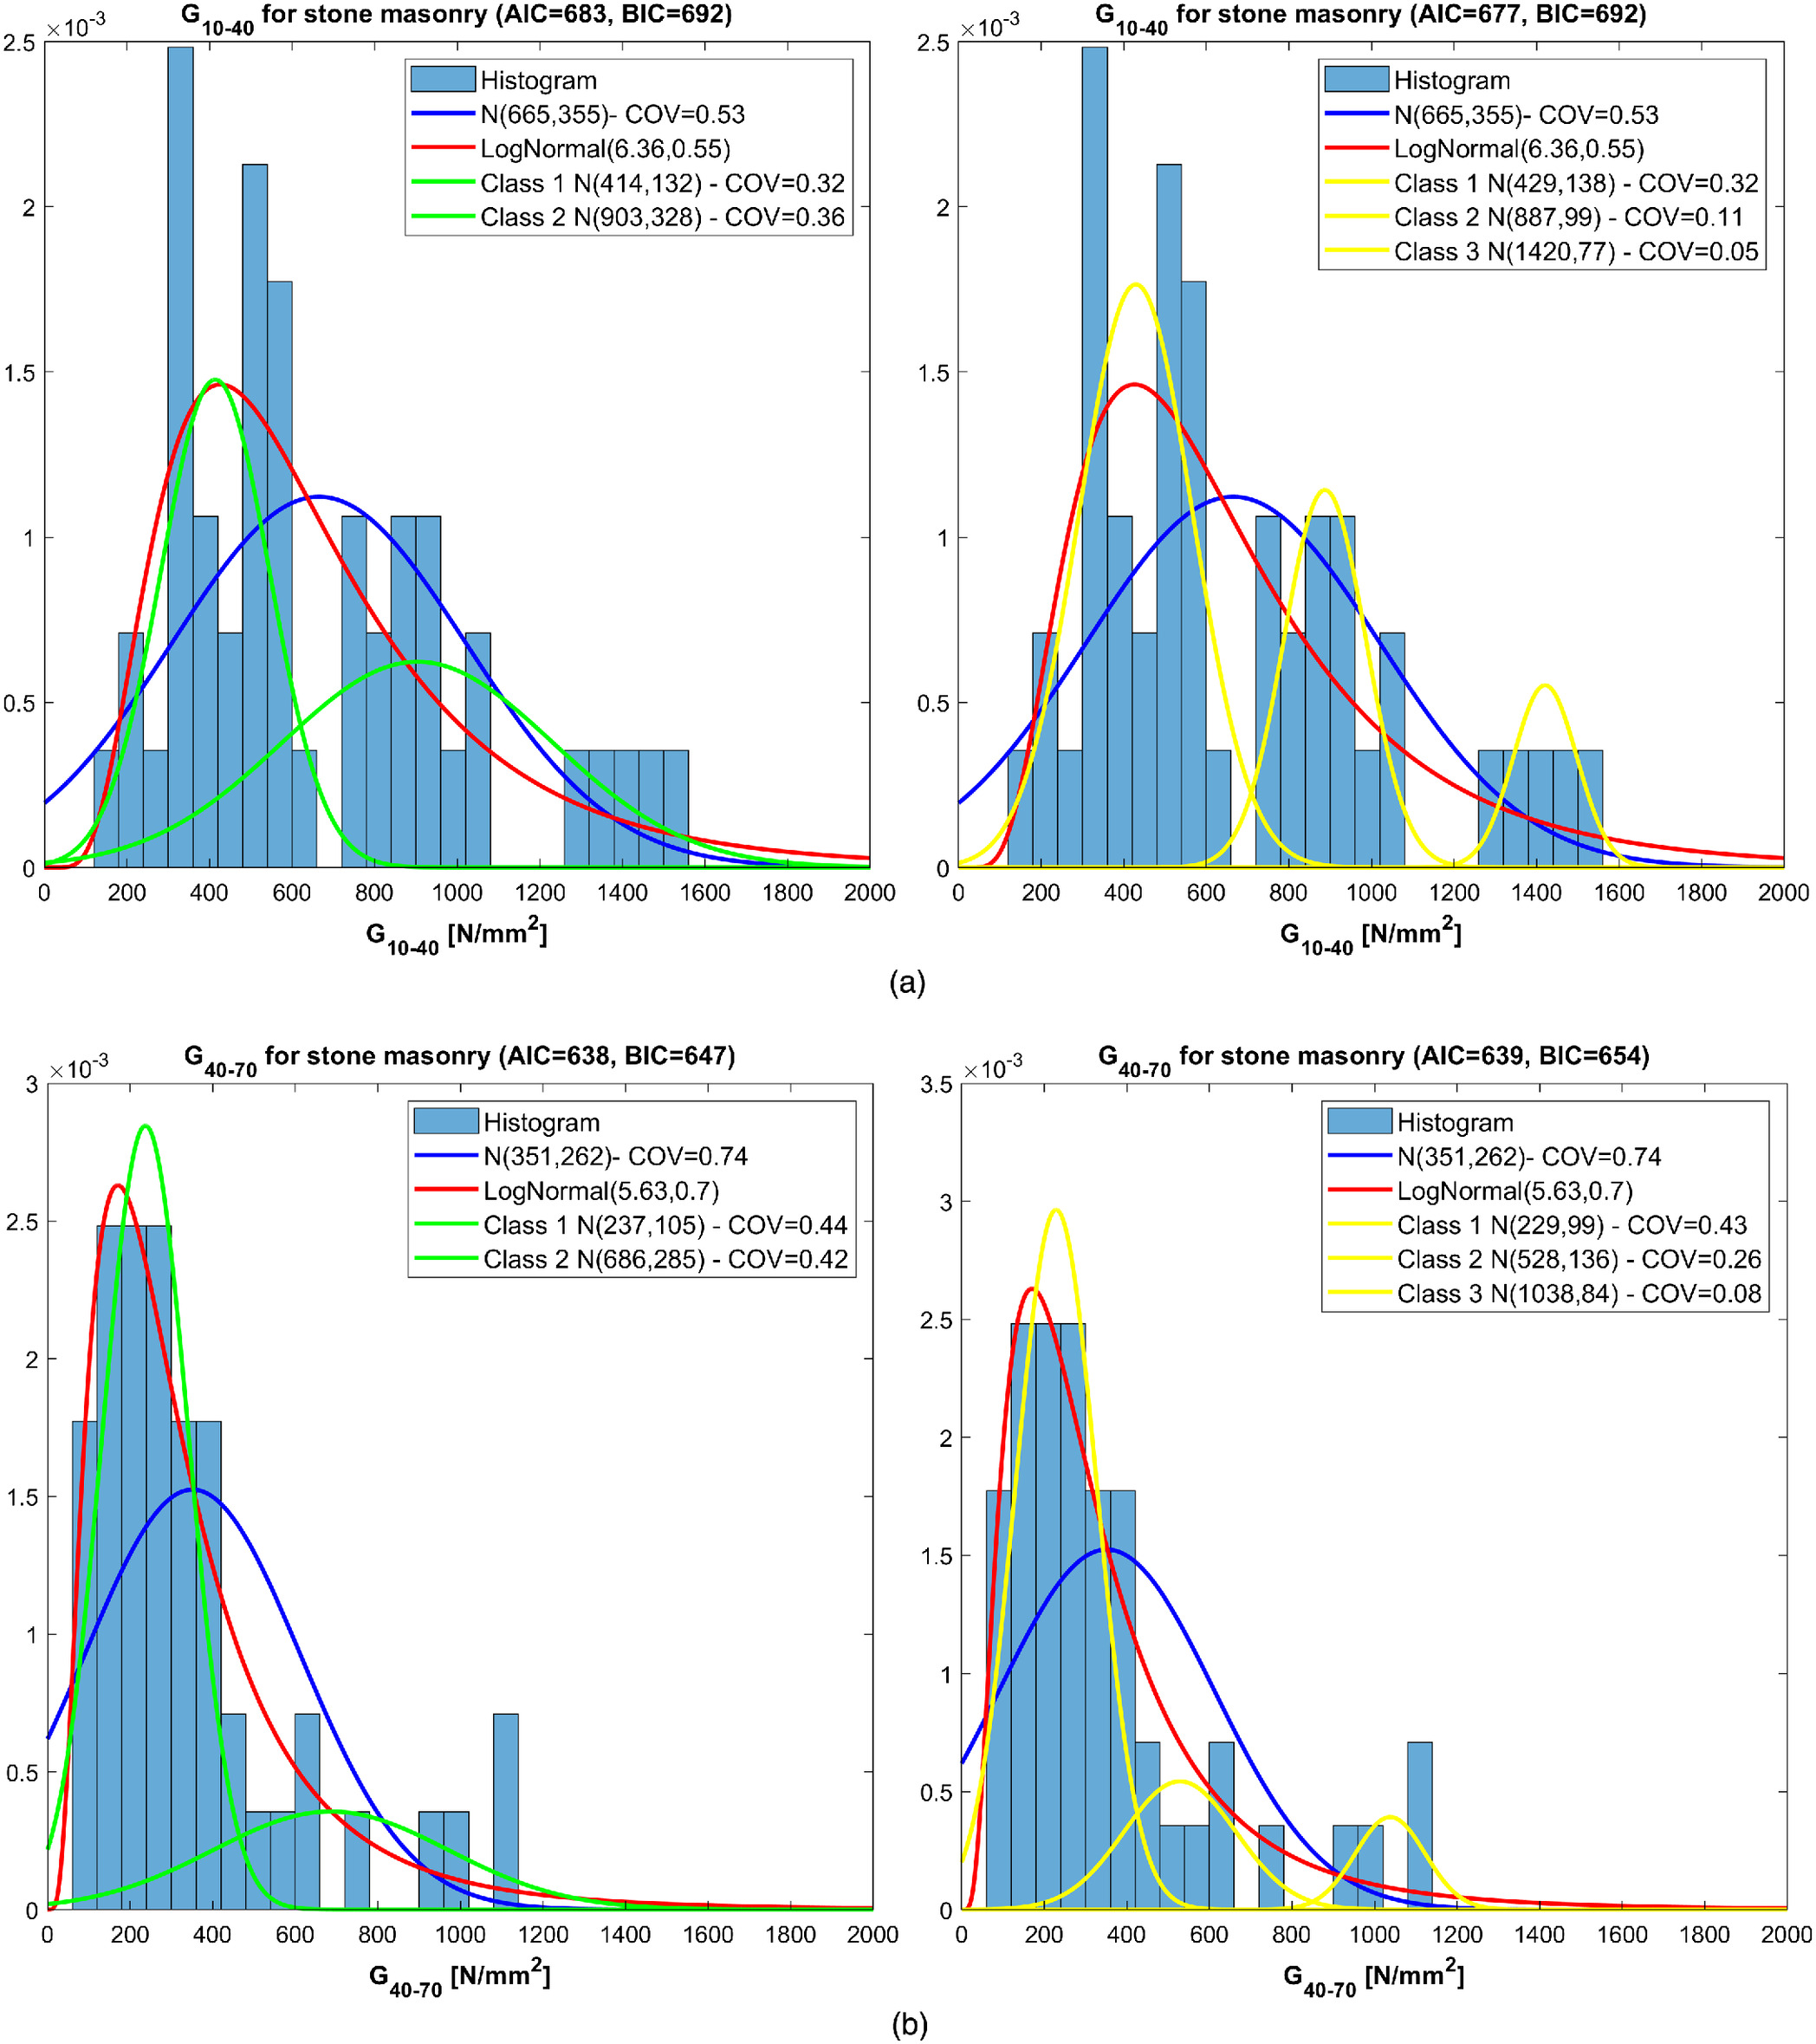
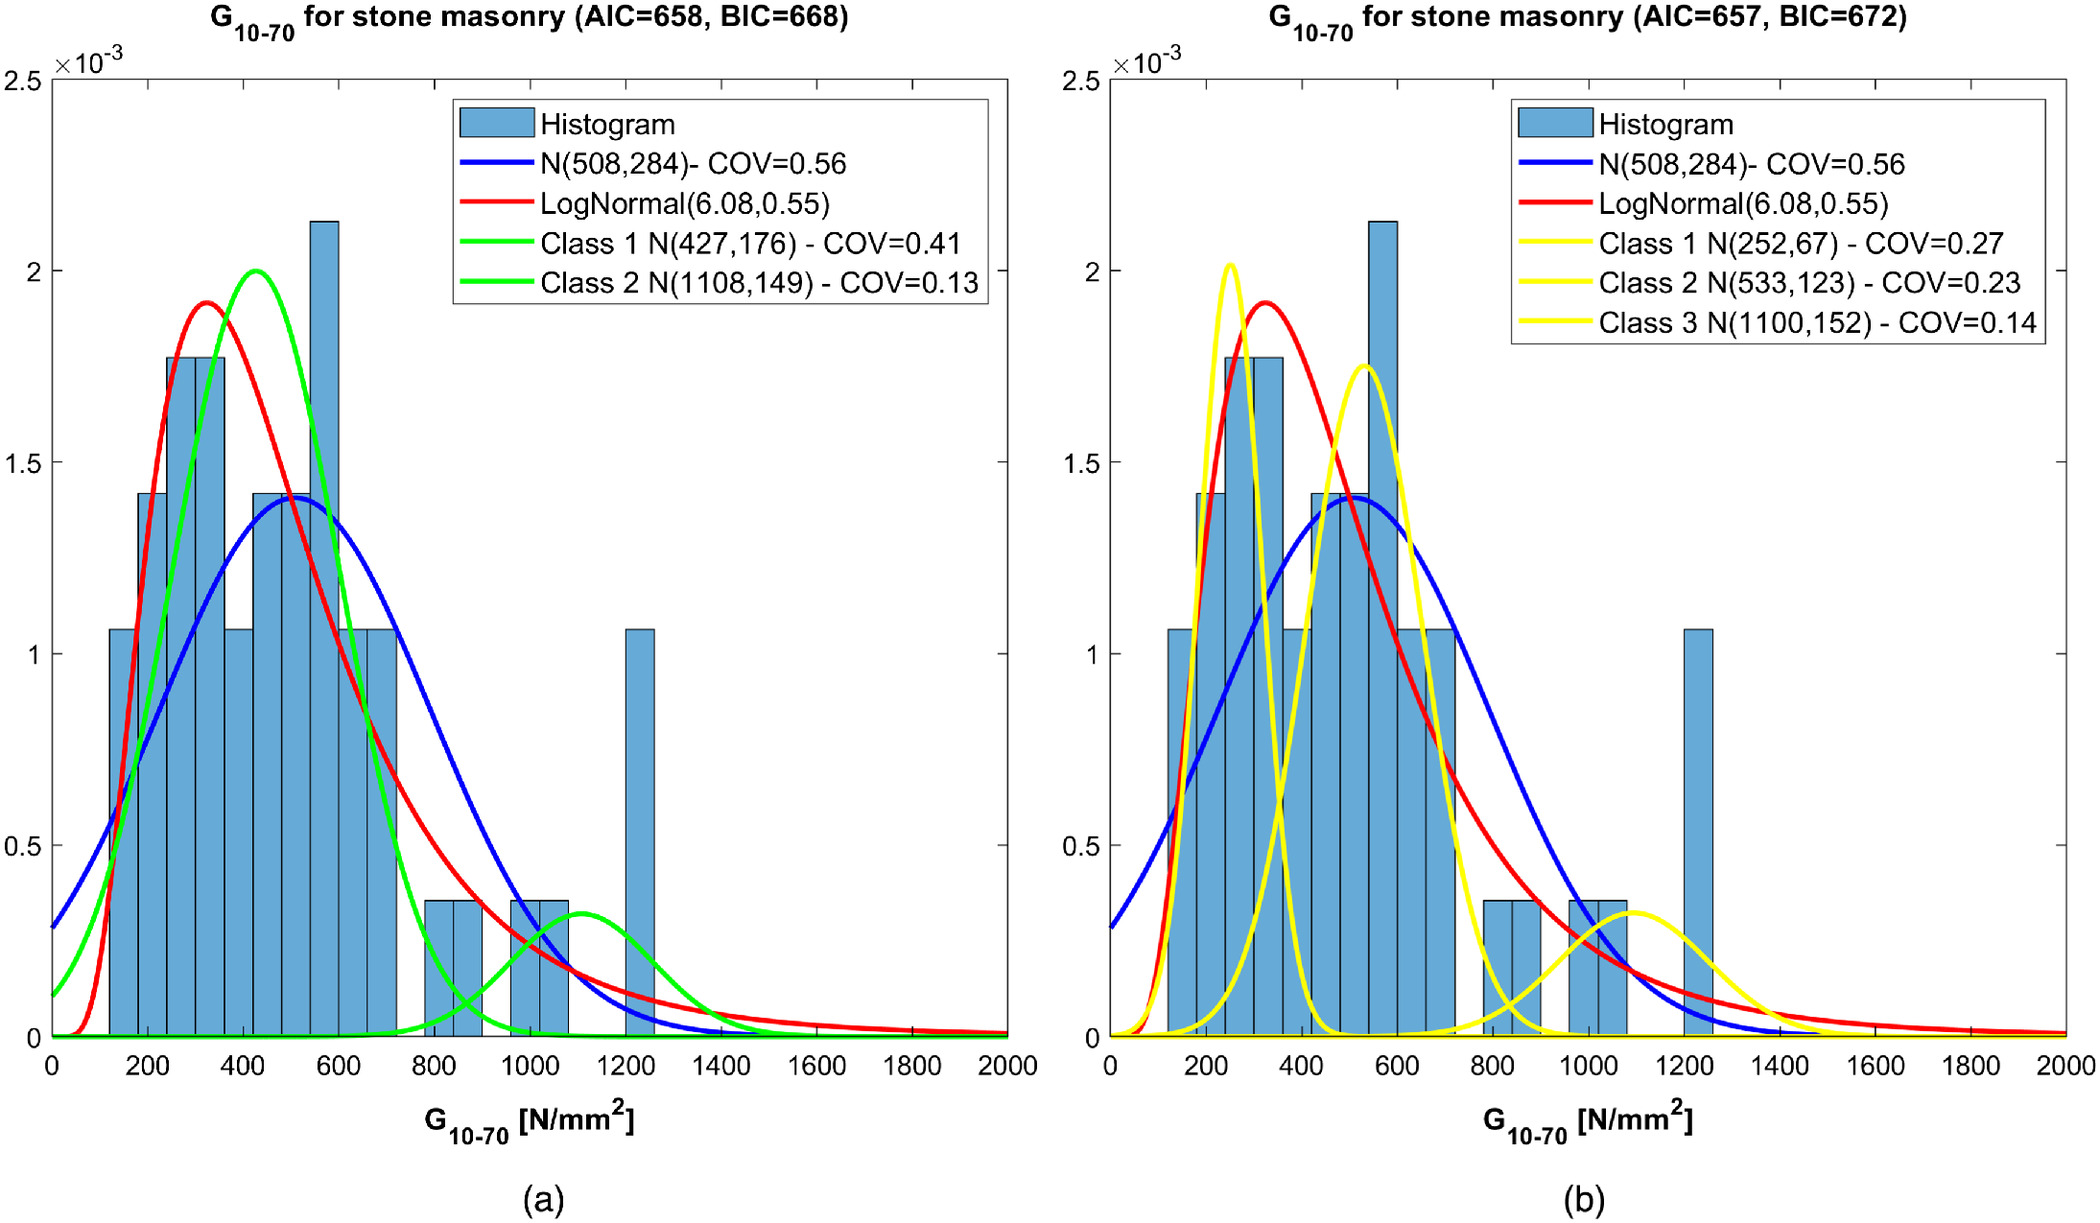
Similar results are derived for the shear moduli , , and , as shown in Figs. 8 and 9. The COVs of the shear modulus is 32% for the lower class, 11% for the intermediate class, and 5% for the upper class (even if containing only five items of data), again significantly smaller than that resulting from the analysis of the whole data set (). The COVs of are 34% for the lower class, 11% for the intermediate class, and 26% for the upper class, certainly sounder than that resulting from the whole data set (63%).
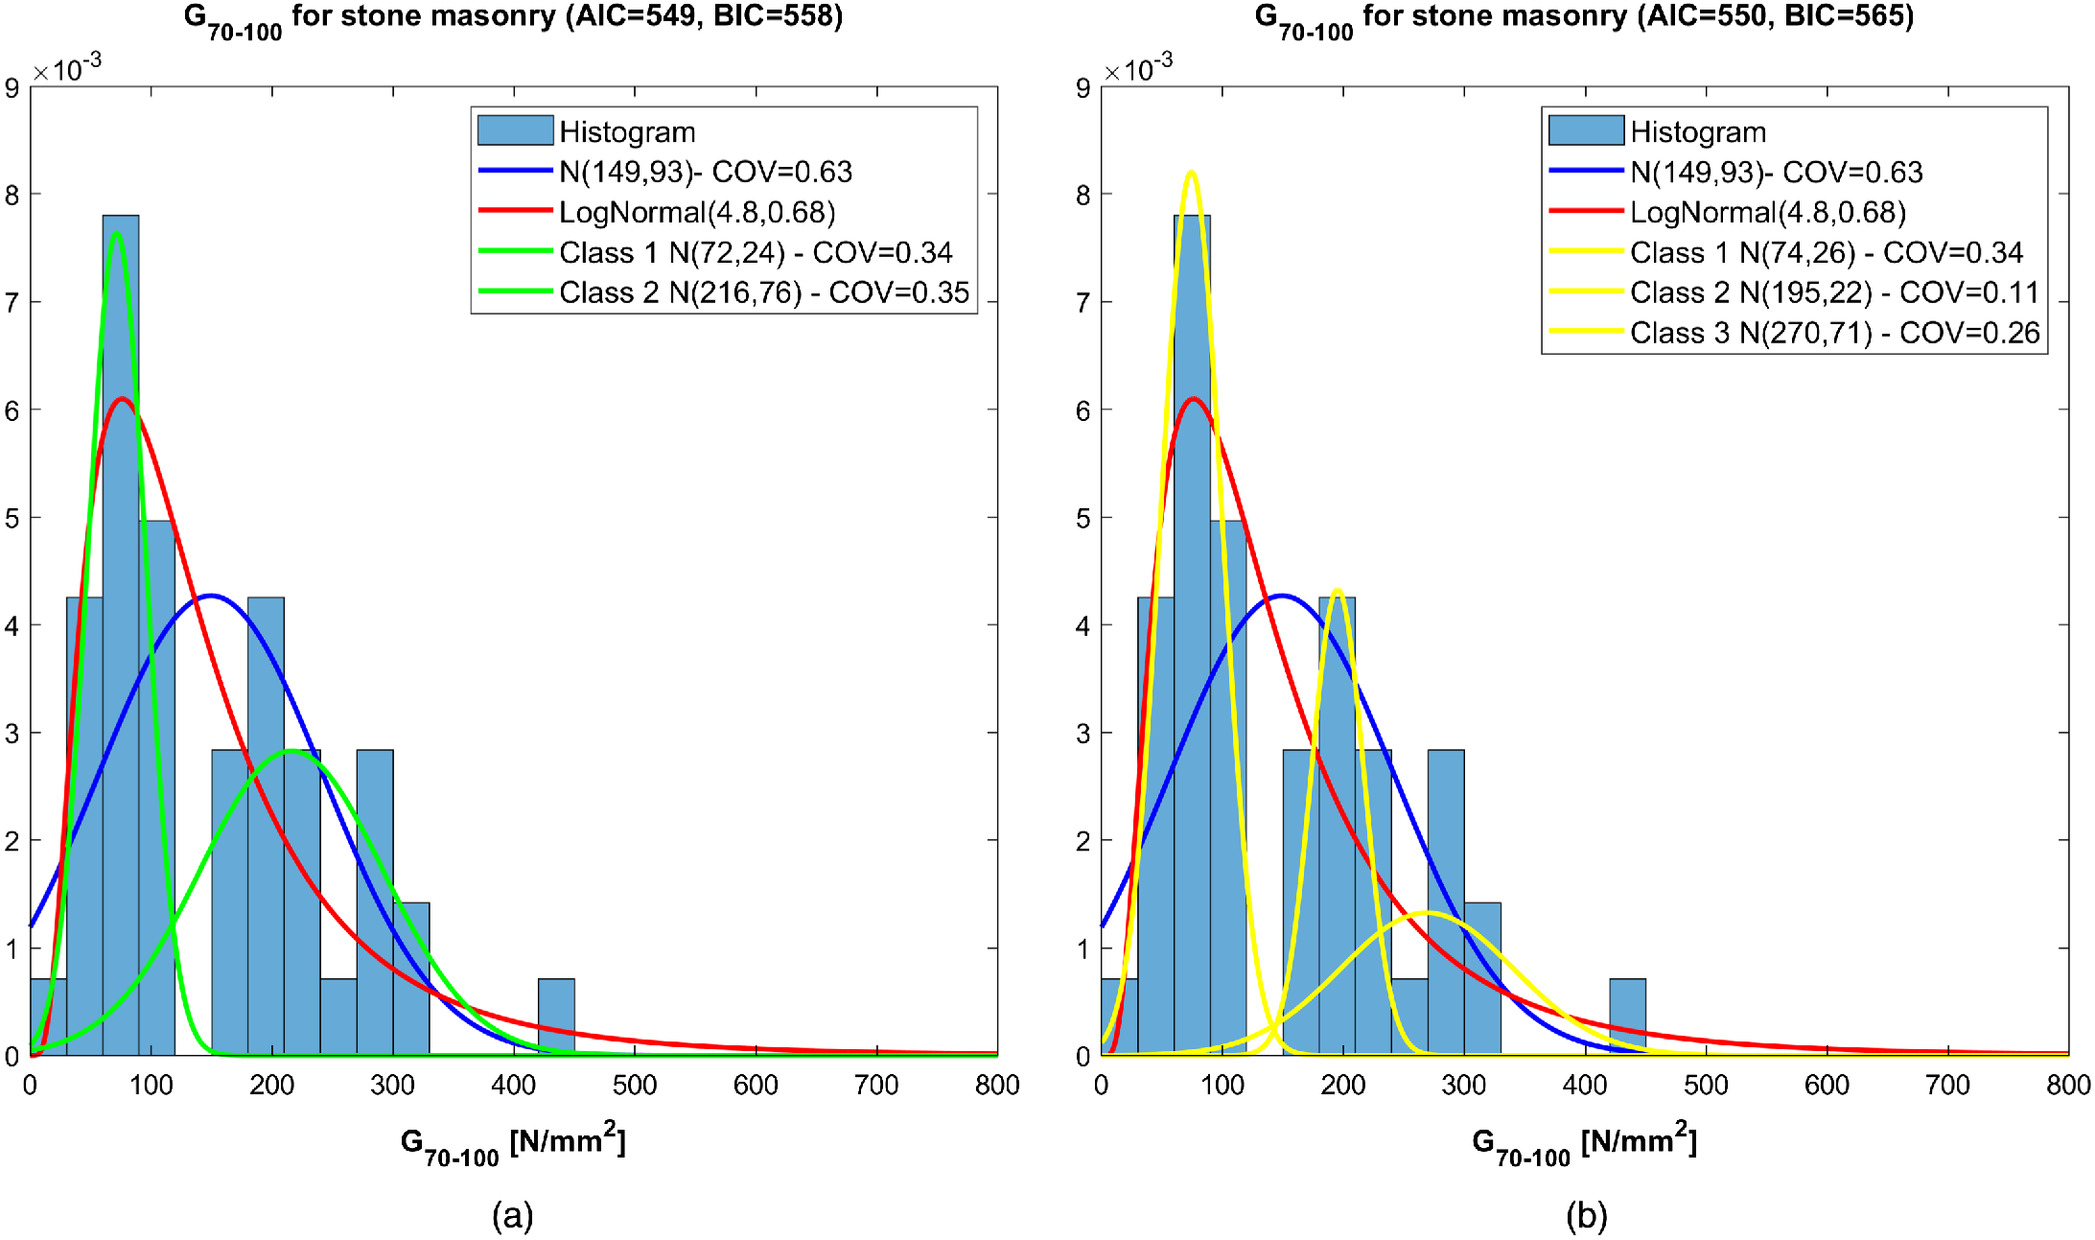
The study has been integrated with the secant shear modulus diagrams in this case as well (Fig. 10).
The implementation of the GMM models for the elastic modulus and the shear modulus, on the one hand, offers the opportunity to properly assess the statistical parameters, thus identifying homogenous populations. On the other hand, it improves the knowledge of the COVs associated to each distribution, avoiding unrealistically severe assumptions.
Identification of Masonry Classes based on MQI and In Situ Tests
Aiming to improve the identification of the masonry classes for the investigated structure, a Bayesian methodology is proposed combining the robust prior knowledge on the masonry parameters, provided by the GMM, with the observations on a specific masonry typology, which can be derived from qualitative assessment and in situ tests.
Indeed, as observed by Croce et al. (2018b) and Marsili et al. (2017b) for the assessment of concrete mechanical properties, the identification of material classes with a Gaussian mixture model automatically leads to the definition of a Bayesian network made up of two nodes: a discrete node, which represents the material class, and a continuous node corresponding to the investigated mechanical parameter.
For the direct link between the parent node , e.g., the material class, and the child node, e.g., the material property , a conditional probability is defined, and, provided that observations of are available, inference on the material class can be made according to the well-known Bayes rule
(6)
In the general case, when evidence of the observation is available, the posterior for a discrete variable is a probability , whereas the posterior for a continuous variable is a density function with mean and variance , derived from the components of the Gaussian mixture models
(7)
(8)
The proposed procedure then allows one to update the probability associated to each material class and, via Eqs. (7) and (8), to derive the updated statistical parameters of material properties, initially making inference on , on the basis of the observation of the masonry quality, and subsequently on the basis of results of in situ tests.
Considering information on masonry quality obtained by visual inspection, a masonry quality index can be defined (Borri et al. 2015, 2018). The MQI takes into account all the main parameters defining the workmanship skills for a masonry structure. In order to classify the masonry typology, MQI focuses on seven parameters:
•
conservation state and the mechanical properties of bricks or stones (SM),
•
stone/brick dimension properties (SD),
•
stone/brick shape (SS),
•
wall leaf connections (WC),
•
horizontal mortar joints characteristics (HJ),
•
vertical joints characteristics (VJ), and
•
mortar mechanical properties (MMP).
The MQI for the stone masonry is obtained combining the aforementioned parameters according to the following formula:and can be evaluated for vertical actions (), horizontal in-plane actions (), and horizontal orthogonal actions () as a function of the actions acting on the wall.
(9)
Each parameter influences the index according to its quality. In more detail, the method takes into account the level of fulfillment of the single parameter with respect to the ideal standard for that category, e.g., the brick shape (SM) can have different values depending on the level of accordance between the analyzed bricks with the best-performing standard shape. Therefore, each parameter corresponds a numerical value and a different weight.
Finally, by means of empirical relationships, a range of variation for mechanical parameters of masonry is obtained, i.e., compressive strength and modulus of elasticity depending on , and shear strength and shear modulus depending on .
Obviously, like every scoring system, MQI is extremely subjective, being strongly dependent on engineering judgement, i.e., on the inspector’s skills. One of objectives of the proposed procedure is to make it more objective. In the present study, and have been estimated through a refined evaluation of all needed parameters for relevant stone masonry panels for which the results of double-flat-jack tests were available.
For vertical actions
•
stone masonry associated with was assigned to the low-quality stone class (Class I),
•
those characterized by were assigned to the medium-quality stone class (Class II), and
•
those associated with were characterized as high-quality stone (Class III).
For horizontal actions
•
stone masonry associated with were assigned to the low-quality stone class (Class I),
•
those characterized by were assigned to the medium-quality stone class (Class II), and
•
those associated to were characterized as high-quality stone (Class III).
These results are subsequently compared with those obtained for the identified clusters as derived from compression tests. The combined probabilities associated to the two classification methods are summarized in Table 2 referring to and and in Table 3 referring to .
| MQI classification | Data analysis cluster | Data analysis cluster | ||||
|---|---|---|---|---|---|---|
| Class I | Class II | Class III | Class I | Class II | Class III | |
| MQI-Class I | 0.06 | 0 | 0 | 0.14 | 0 | 0 |
| MQI-Class II | 0.43 | 0.23 | 0.20 | 0.48 | 0.14 | 0.03 |
| MQI-Class III | 0 | 0.02 | 0.06 | 0.09 | 0.09 | 0.03 |
Note: Bold values are used for values in the diagonal of the matrix and correspond to the probability of having the same class identification with the two methods.
| MQI classification | Data analysis cluster | ||
|---|---|---|---|
| Class I | Class II | Class III | |
| MQI-Class I | 0.06 | 0.22 | 0 |
| MQI-Class II | 0.11 | 0.29 | 0.23 |
| MQI-Class III | 0 | 0.06 | 0.03 |
Note: Bold values are used for values in the diagonal of the matrix and correspond to the probability of having the same class identification with the two methods.
Combining the probabilities in Tables 2 and 3 by means of Eq. (6), it is then possible to evaluate the probability to correctly identify a masonry class, given its MQI, in short, p(Class I “OR” Class II “OR” Class III│MQI).
For example, the probability to have a masonry in Class I for the elastic modulus given a will be
(10)
Statistical parameters of the marginal distribution are finally derived from the updated probabilities via Eqs. (6) and (7). It is worth mentioning that the probability of a correct identification based only on MQI is generally very low. In fact, as said previously, the identification of masonry classes based only on visual inspection by means for example the masonry quality index (MQI) is not sufficient for a complete and reliable classification. Considering, for example, vertical actions, is a very useful tool to recognize high-quality masonry, , or low-quality masonry, , so avoiding expensive experimental in situ tests and preserving the structural integrity. However, for the majority of stone masonry, for which , experimental tests could be essential.
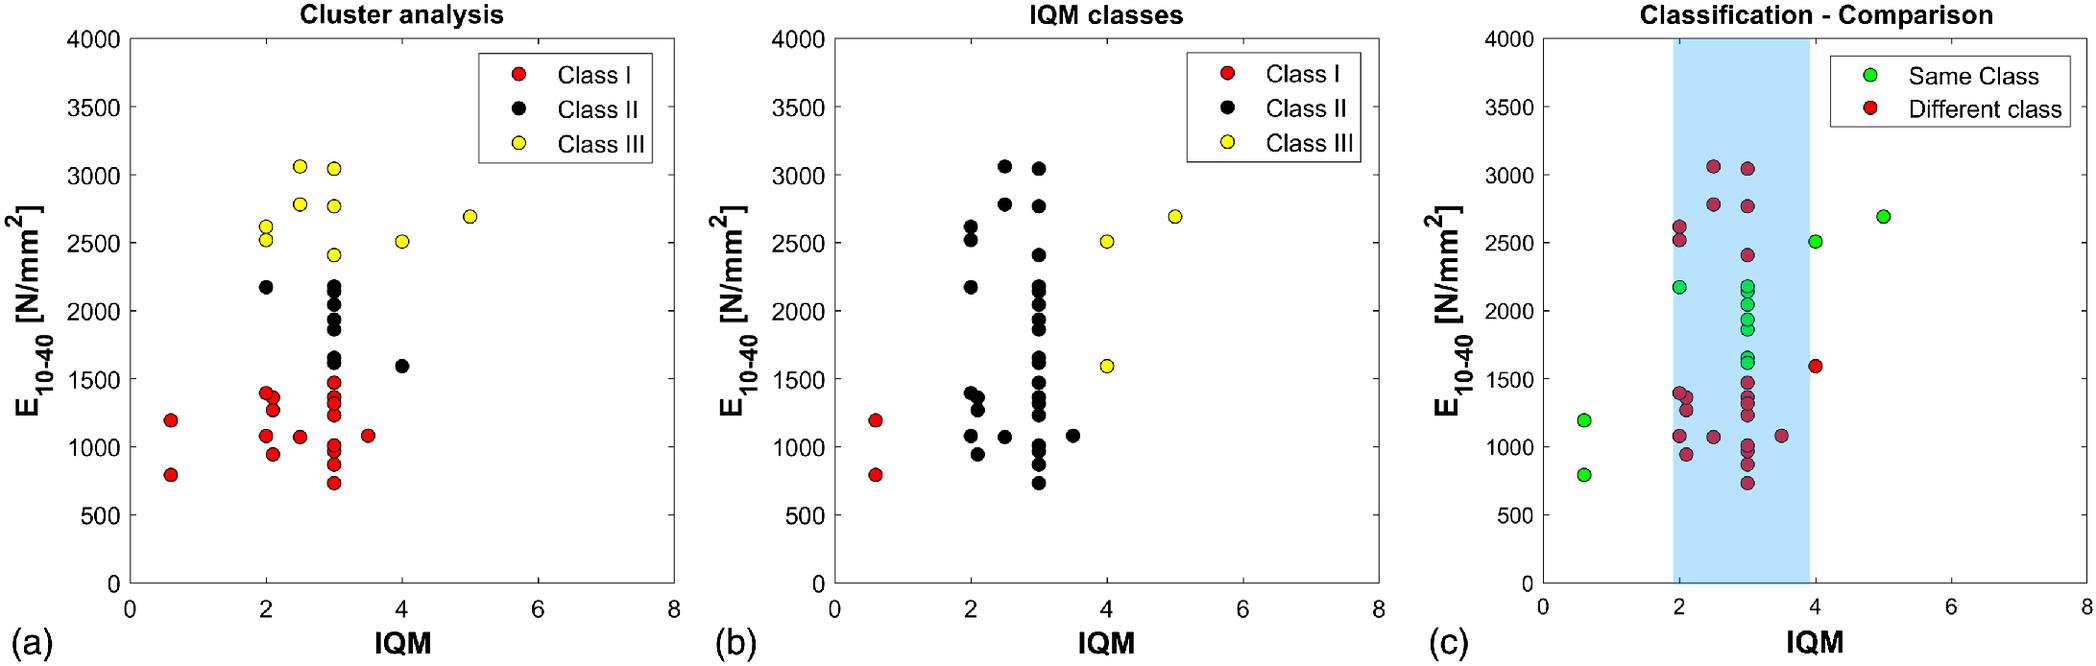
The latter remark is confirmed by comparing the estimated with experimental test results such as those referring to in Fig. 11. Examining the diagrams, it clearly emerges that reliably identifies low-quality masonry and reliably identifies high-quality masonry, but identifies masonry belonging to every experimental classes and so is not capable of classifying precisely the masonry itself.
The results of the inference procedure for based only on the MQI are reported in Table 4, confirming the capability of the method to reduce the uncertainty associated to the investigated parameter only for low-quality masonry () and high-quality masonry ().
| Statistical parameters | Prior (whole data set) | () | () | () |
|---|---|---|---|---|
| () | 1,815 | 1,131 | 1,803 | 2,395 |
| () | 715 | 322 | 681 | 688 |
| COV | 0.39 | 0.29 | 0.38 | 0.29 |
Of course, further sequential updates are possible as soon as new in situ measurements become available, leading to a more precise identification of material classes. Performing, for example, a double-flat-jack test on the investigated masonry wall, a more satisfactory update can thus be obtained.
The results of the inference procedure for are reported in Table 5 for a masonry wall of the primary school Giotto in Florence, Italy, which is the masonry school building further investigated in the following sections. In this case, the capability of the method to reduce the uncertainty associated to the investigated parameter is confirmed also for medium-quality masonry ( and ).
| Statistical parameters | Prior (whole data set) | (, ) | (, ) | |||
|---|---|---|---|---|---|---|
| () | 1,815 | 665 | 1,803 | 625 | 2,840 | 429 |
| () | 715 | 355 | 681 | 341 | 238 | 138 |
| COV | 0.39 | 0.53 | 0.38 | 0.54 | 0.09 | 0.32 |
Case Study
Updating the Capacity Curves of Masonry Walls
To obtain a proper evaluation of the vulnerability of existing masonry buildings and to design efficient strengthening interventions, not only are reliable analysis methods necessary, but also refined characterization of the seismic behavior of masonry walls is needed. In that perspective, accurate estimations of mechanical parameters are essential to obtain a consistent classification of seismic performance by means of a seismic risk index (Croce et al. 2018c; Beconcini et al. 2019).
In the previous sections, a procedure for the identification of masonry classes and their associated PDFs for material parameters has been illustrated. The assessment of material properties and their associated uncertainty in terms of PDFs provides the basis for a probabilistic description of the capacity curves of masonry walls to be used in nonlinear static analysis.
Nonlinear static analyses are commonly adopted for the evaluation of the seismic performance of masonry buildings because in many standards, such as Eurocode 8 Part 3 (CEN 2005b) or the Italian Building Code (Italian Ministry of Infrastructure and Transport 2018; Italian Public Works Council 2019), that technique is indirectly recommended.
Simplified elastoplastic bilinear curves with given displacement limits are used to model the actual hysteretic behavior of masonry walls subjected to vertical and horizontal loads. The bilinear curve is identified by an initial linear-elastic branch defined by the lateral stiffness , followed by a plastic plateau corresponding to the shear strength of the wall and limited by the interstory elastic drift and ultimate interstory drift, .
Assuming a diagonal tension-shear failure mode (Turnšek and Ⓒaⓒoviⓒ 1971) for the wall, according to the provision in the Eurocode 8 Part 3 (CEN 2005b), the following formulas apply:
(11)
(12)
(13)
Considering that the geometry of the wall is well defined and that the ultimate displacement can be generally represented as a function of the interstory height (Italian Public Works Council 2019; CEN 2005b; NZSEE 2006; ATC 1997), the shear behavior is mainly characterized by a significant inherent uncertainty in the identification of the effective stiffness through the moduli and and shear strength . Finally, the identification of masonry classes and the consequent update of the PDFs of masonry parameters obtained by means of the proposed methodology allow for a refined probabilistic description of the capacity curves.
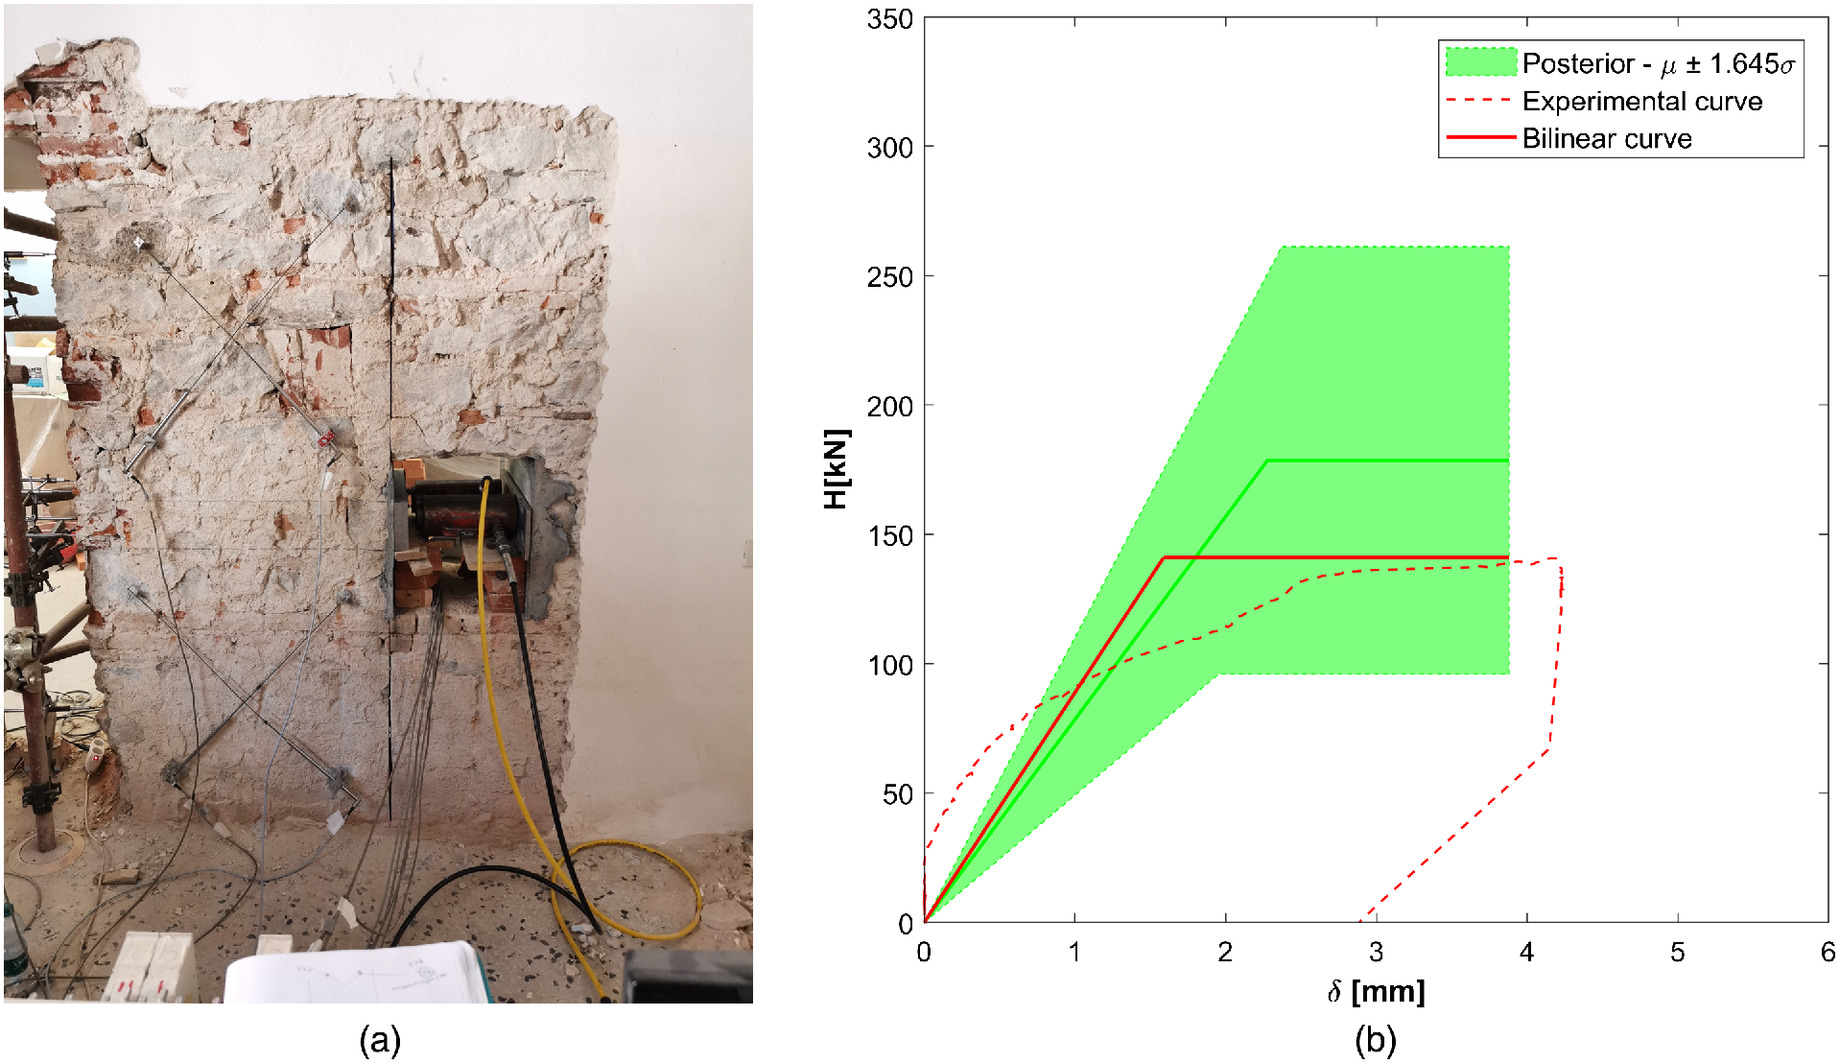
Illustrative results for a specific masonry panel characterized by , , , and , for which a shear compression test has been also carried out, are reported in Fig. 12. Because insufficient data are currently available in the database to perform the illustrated cluster analysis for the shear strength, the shear strength has been derived from the shear modulus according to the procedure suggested by Croce et al. (2018a, 2019a), assuming for the ratio a lognormal distribution with mean equal to 1,500 and .
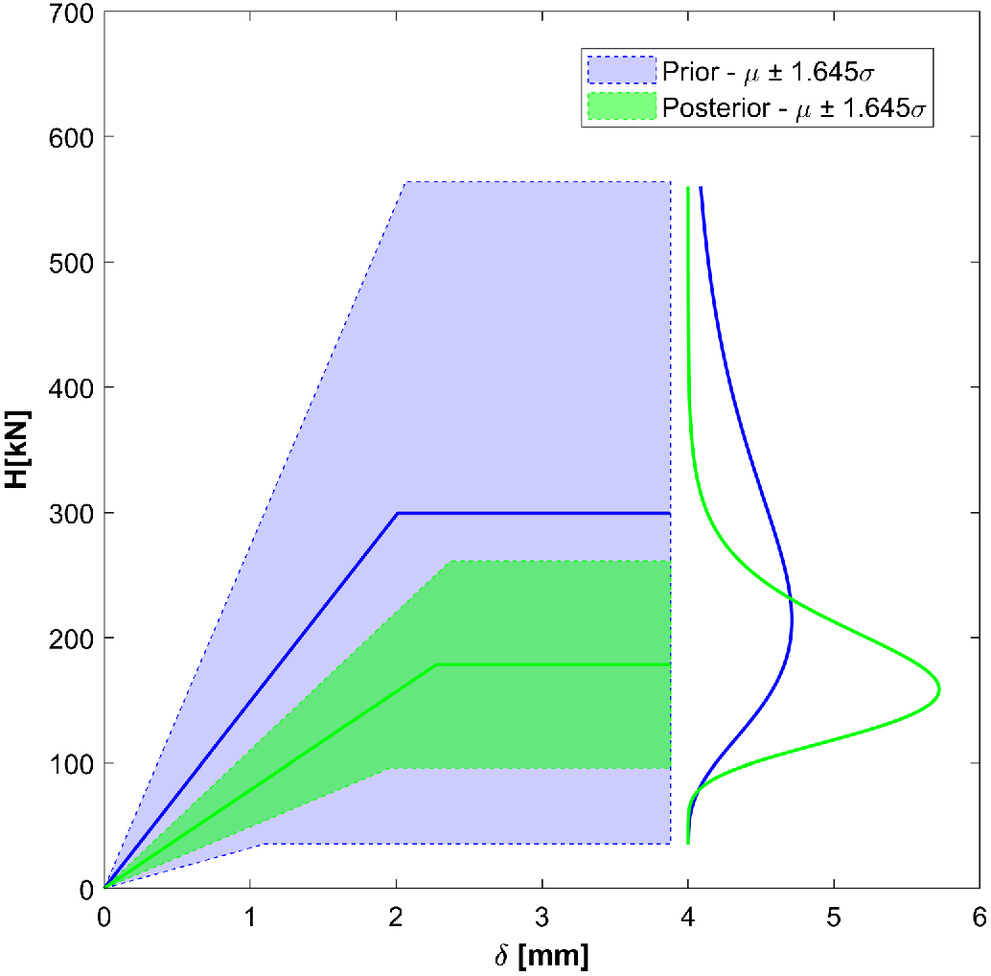
Fig. 12 shows the prior range of variation based on the lognormal fit of the whole data set of moduli and as well as the updated range obtained with the proposed procedure.
When shear compression in situ test results are also available, the obtained capacity curves can be further updated. Figs. 13(a and b) show the test arrangement on the stone masonry panel described previously, as well as the results of the tests carried out by the authors in terms of horizontal load-displacement curves.
Finally, the updated range of variation for the capacity curves can be used for a robust probabilistic assessment of the seismic risk index in nonlinear static analysis (Croce et al. 2019a). In the following section, a relevant case study concerning the assessment of the seismic performance of a 3-story existing masonry building is illustrated to highlight the capabilities of the proposed procedure.
Updating the Seismic Risk Index
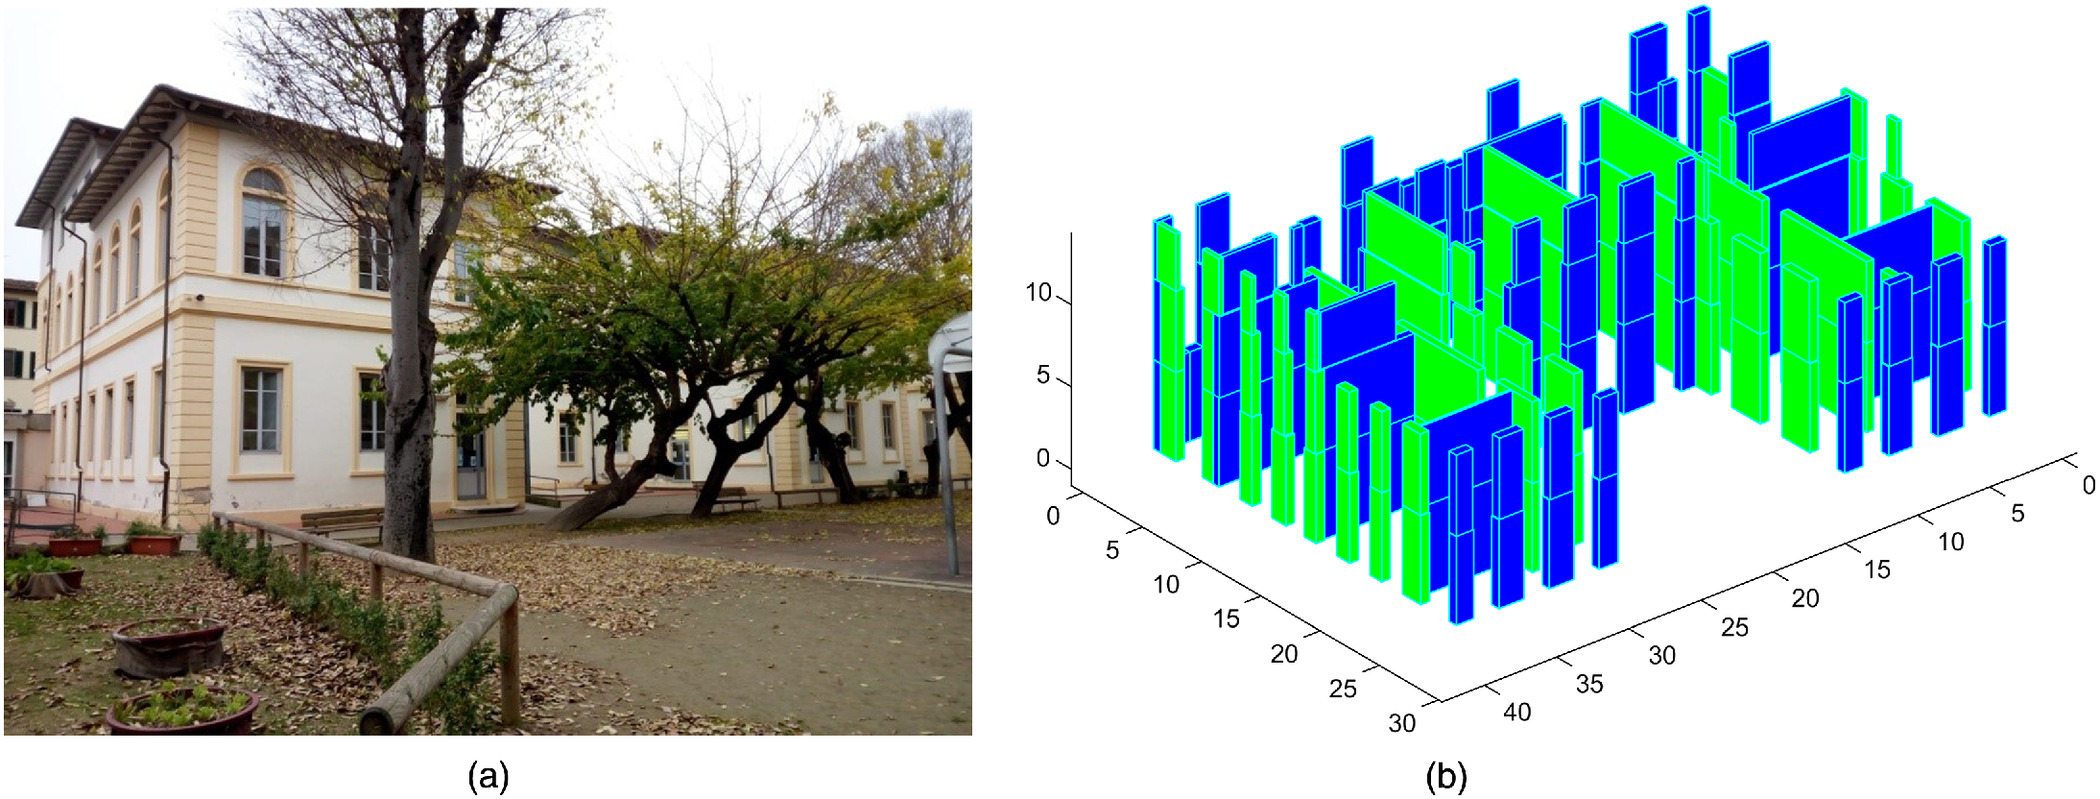
The case study refers to the already mentioned primary school Giotto in Florence, Italy. The school, built in 1907–1908 and partially raised by a floor in 1968, is a 3-story building with an overall height of and interstory height around .
The structure has a U-shaped layout for the first two stories, which have an area of around each, and the last floor presents a reduced rectangular area of .
The load-bearing structure is made of stone masonry with a thickness of for the perimeter walls and for the internal walls. These large volumes and the massive stone walls characterize the shape of the building, conferring a robust and compact appearance. The horizontal floors are characterized by the presence of horizontally rigid nondeformable slabs. Fig. 14 shows the investigated building together with a three-dimensional (3D) model of resistant walls.
In order to evaluate the seismic assessment of the structure, a global nonlinear static analysis (pushover analysis) has been carried out by means of the E-PUSH version 4.1. program (Croce et al. 2019a; Beconcini et al. 2018).
The global capacity curve of the structure is evaluated and compared with the displacement demand in the acceleration displacement response spectra (ADRS) plan. Comparing the displacement capacity and demand, the seismic risk index of the structure () is obtained. As known, is defined as the ratio between the maximum peak ground acceleration resisted by the structure and the design peak ground acceleration .
As discussed previously, because the results of nonlinear static analysis, in terms of seismic risk indexes, are highly influenced by the capacity curves adopted for the masonry walls, a probabilistic analysis should be carried out (Croce et al. 2019a, b), aiming to obtain a reliable assessment. With this objective, a wide Monte Carlo simulation has been carried out. In that simulation, nonlinear static analysis is performed, and the corresponding seismic risk index is thus computed for each individual experiment, whose parameters are obtained by suitable random sampling from the previously identified PDFs of the mechanical parameters.
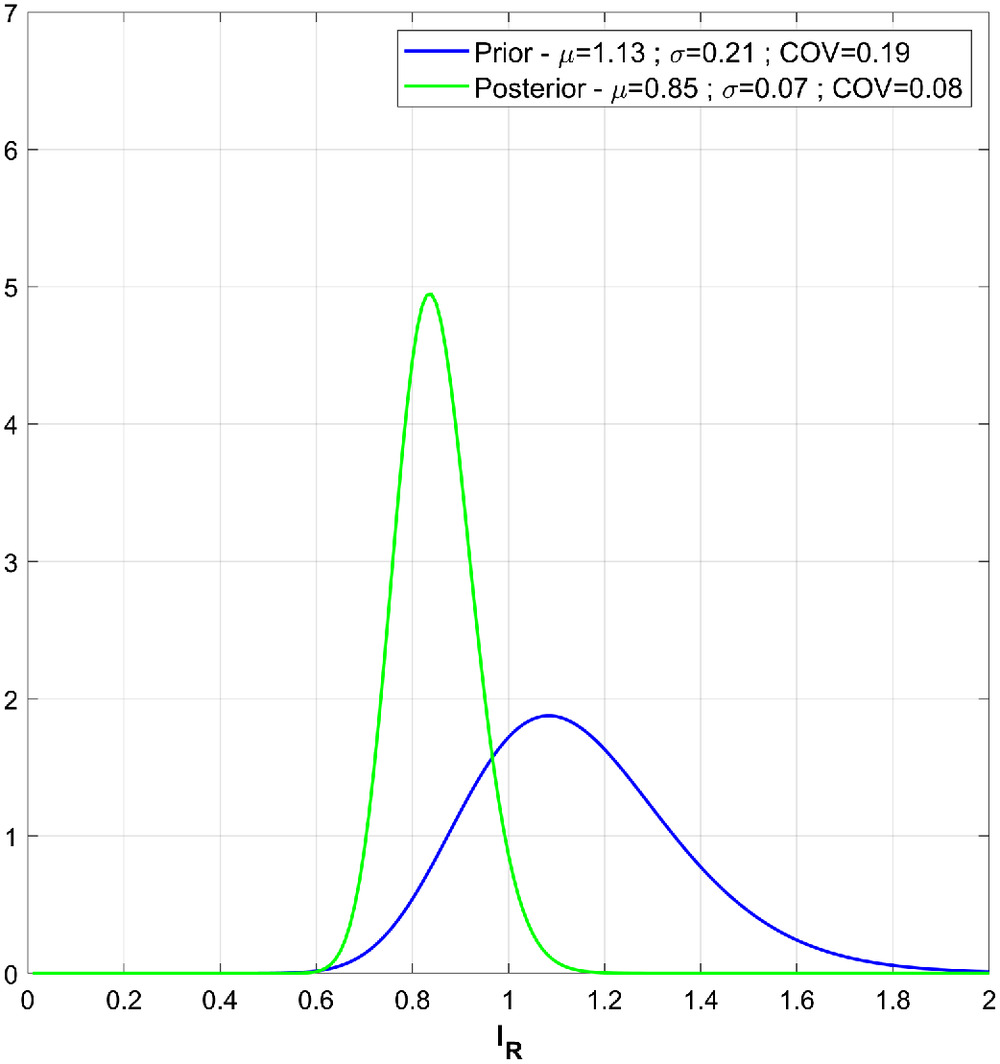
The probability density functions of the seismic risk index obtained considering the prior distributions for and and the updated PDFs are compared in Fig. 15. The results highlight that thanks to identification of masonry classes, the method contributes to reduce the uncertainty in the evaluation of seismic risk index. Evidently, the refined assessment of the seismic risk index, allowing a more reliable seismic performance classification, can help the owners to identify most vulnerable structures and thus better address maintenance and seismic retrofit strategies and give guidance about prioritization of the interventions as well.
Conclusions
A procedure for the identification of masonry classes and their mechanical parameters is presented, aiming to provide a refined probabilistic description of shear behavior of masonry walls to serve as a basis for seismic assessment of existing buildings. The focal point of the whole methodology is a cluster analysis of available data sets of mechanical parameters based on Gaussian mixture model allowing suitable classification of existing buildings in terms of masonry classes as well as definition of the PDFs of influencing mechanical parameters.
The Gaussian mixture model automatically leads to the definition of a Bayesian network composed by two nodes, namely the material class and the mechanical property, which can be used to infer the material class of an investigated structure provided that specific observations are available.
The a priori identification of masonry classes is assessed by means of a simplified method based on visual inspection of the masonry, whose outcome is the masonry quality index. Like other scoring systems, the MQI is extremely subjective and highly dependent on engineering judgment and skill of the inspector. In fact, it results are trustworthy only in recognizing low- or high-quality masonry, characterized by well-evident properties. Then, a further, more effective, update is performed relying on results of experimental semidestructive in situ tests.
The proposed method has been applied to some identification of masonry classes in a relevant case study. Starting from available results of standard in situ compression tests, in terms of the elastic modulus , shear modulus , and compressive strength obtained on similar structures supplemented by specific in situ tests, if any, the relevant homogenous populations have been identified by means of a cluster analysis based on a GMM. In this way the need to carry out expensive and often very invasive destructive tests is significantly limited. The procedure, leading to a significant reduction of the uncertainties in the characterization of masonry mechanical parameters and facilitating the appropriate identification of stone masonry classes, largely confirmed its potentialities.
The updated PDFs of masonry mechanical parameters obtained according the aforementioned procedure can be used to improve the evaluation of capacity curves of masonry walls, obtain a more refined probabilistic description of their shear behavior, and thus reduce the uncertainty in the assessment of seismic performance of existing buildings, as demonstrated by a relevant case study concerning the evaluation of the seismic risk index of a masonry building school in Florence, Italy.
Data Availability Statement
Some or all data, models, or code that support the findings of this study are available from the corresponding author upon reasonable request.
References
ASTM. 2014. Standard test method for in-situ measurement of masonry deformability properties using the flat jack method. West Conshohocken, PA: ASTM.
ATC (Applied Technology Council). 1997. NEHRP guidelines for the seismic rehabilitation of buildings. Washington, DC: ATC.
Bartoli, G., M. Betti, L. Facchini, A. M. Marra, and S. Monchetti. 2017. “Bayesian model updating of historic masonry towers through dynamic experimental data.” Procedia Eng. 199 (Jan): 1258–1263. https://doi.org/10.1016/j.proeng.2017.09.267.
Bartoli, G., M. Betti, A. M. Marra, and S. Monchetti. 2019. “A Bayesian model updating framework for robust seismic fragility analysis of non-isolated historic masonry towers.” Philos. Trans. R. Soc. A 377 (2155): 20190024. https://doi.org/10.1098/rsta.2019.0024.
Beconcini, M. L., P. Cioni, P. Croce, P. Formichi, F. Landi, and C. Mochi. 2018. “Non-linear static analysis of masonry buildings under seismic actions.” In Proc., IMSCI 2018-12th Int. Multi-Conf. on Society, Cybernetics and Informatics, 126–131. Winter Garden, FL: International Institute of Informatics and Systemics.
Beconcini, M. L., P. Cioni, P. Croce, P. Formichi, F. Landi, and C. Mochi. 2019. “Influence of shear modulus and drift capacity on non-linear static analysis of masonry buildings.” In Proc., IABSE Symp., Guimaraes 2019: Towards a resilient built environment risk and asset management, 876–883. Zürich, Switzerland: International Association for Bridge and Structural Engineering.
Beconcini, M. L., P. Croce, F. Marsili, M. Muzzi, and E. Rosso. 2016. “Probabilistic reliability assessment of a heritage structure under horizontal loads.” Probab. Eng. Mech. 45 (Jul): 198–211. https://doi.org/10.1016/j.probengmech.2016.01.001.
Borri, A., M. Corradi, G. Castori, and A. De Maria. 2015. “A method for the analysis and classification of historic masonry.” Bull. Earthquake Eng. 13 (9): 2647–2665. https://doi.org/10.1007/s10518-015-9731-4.
Borri, A., M. Corradi, A. De Maria, and R. Sisti. 2018. “Calibration of a visual method for the analysis of the mechanical properties of historic masonry.” Procedia Struct. Integr. 11 (Jan): 418–427. https://doi.org/10.1016/j.prostr.2018.11.054.
Bosiljkov, V., Y. Totoev, and J. Nichols. 2005. “Shear modulus and stiffness of brickwork masonry: An experimental perspective.” Struct. Eng. Mech. 20 (1): 21–43. https://doi.org/10.12989/sem.2005.20.1.021.
Carpinteri, A., S. Invernizzi, and G. Lacidogna. 2009. “Historical brick-masonry subjected to double flat-jack test: Acoustic emissions and scale effects on cracking density.” Constr. Build. Mater. 23 (8): 2813–2820. https://doi.org/10.1016/j.conbuildmat.2009.03.003.
CEN (European Committee for Standardization). 2005a. Design of masonry structures. Brussels, Belgium: CEN.
CEN (European Committee for Standardization). 2005b. Design of structures for earthquake resistance. Brussels, Belgium: CEN.
Conde, B., P. Eguía, G. E. Stavroulakis, and E. Granada. 2018. “Parameter identification for damaged condition investigation on masonry arch bridges using a Bayesian approach.” Eng. Struct. 172 (Oct): 275–284. https://doi.org/10.1016/j.engstruct.2018.06.040.
Croce, P., M. L. Beconcini, P. Formichi, P. Cioni, F. Landi, C. Mochi, F. De Lellis, E. Mariotti, and I. Serra. 2018a. “Shear modulus of masonry walls: A critical review.” Procedia Struct. Integr. 11 (Jan): 339–346. https://doi.org/10.1016/j.prostr.2018.11.044.
Croce, P., M. L. Beconcini, P. Formichi, P. Cioni, F. Landi, C. Mochi, and R. Giuri. 2018b. “Influence of mechanical parameters on non-linear static analysis of masonry walls: A relevant case study.” Procedia Struct. Integr. 11 (Jan): 331–338. https://doi.org/10.1016/j.prostr.2018.11.043.
Croce, P., M. L. Beconcini, P. Formichi, F. Landi, B. Puccini, and V. Zotti. 2019a. “Seismic risk evaluation of existing masonry buildings: Methods and uncertainties.” In Proc., IABSE Congress New York: The evolving metropolis, 2510–2515. Zürich, Switzerland: International Association for Bridge and Structural Engineering.
Croce, P., P. Formichi, and F. Landi. 2020. “Influence of reinforcing steel corrosion on life cycle reliability assessment of existing R.C. buildings.” Buildings 10 (6): 99. https://doi.org/10.3390/buildings10060099.
Croce, P., F. Landi, and P. Formichi. 2019b. “Probabilistic seismic assessment of masonry buildings.” Buildings 9 (12): 237. https://doi.org/10.3390/buildings9120237.
Croce, P., F. Marsili, F. Klawonn, P. Formichi, and F. Landi. 2018c. “Evaluation of statistical parameters of concrete strength from secondary experimental test data.” Constr. Build. Mater. 163 (Feb): 343–359. https://doi.org/10.1016/j.conbuildmat.2017.11.001.
Dashti, M., and A. M. Stuart. 2017. “The Bayesian approach to inverse problems.” In Handbook of uncertainty quantification, edited by R. Ghanem, D. Higdon, and H. Owhadi, 311–428. New York: Springer.
De Falco, A., M. Girardi, D. Pellegrini, L. Robol, and G. Sevieri. 2018. “Model parameter estimation using Bayesian and deterministic approaches: The case study of the Maddalena Bridge.” Procedia Struct. Integr. 11 (Jan): 210–217. https://doi.org/10.1016/j.prostr.2018.11.028.
Domański, T., and P. Matysek. 2018. “The reliability of masonry structures—Evaluation methods for historical buildings.” Tech. Trans. 11 (9): 91–108. https://doi.org/10.4467/2353737XCT.18.134.8973.
Hastie, T., R. Tibshirani, and J. Friedman. 2008. The elements of statistical learning, data mining, inference, and prediction. 2nd ed. New York: Springer.
Italian Ministry of Infrastructure and Transport. 2018. NTC 2018—Italian building code. [In Italian.] Rome: Istituto Poligrafico e Zecca dello Stato.
Italian Public Works Council. 2019. Application document of Italian building code. [In Italian.] Rome: Istituto Poligrafico e Zecca dello Stato.
Jin, X., and J. Han. 2011. “K-means clustering.” In Encyclopedia of machine learning, edited by C. Sammut and G. I. Webb, 561–570. New York: Springer.
Marsili, F., P. Croce, F. Klawonn, and F. Landi. 2017a. “A procedure for the definition of material strength pdf based on limited NDT.” In Proc., 15th Int. Probabilistic Workshop, edited by M. Voigt, D. Proske, W. Graf, M. Beer, and P. Voigt, 185–196. New York: Springer.
Marsili, F., P. Croce, F. Klawonn, A. Vignoli, S. Boschi, and F. Landi. 2017b. “A Bayesian network for the definition of probability models for masonry mechanical parameters.” In Proc., 14th Int. Probabilistic Workshop, edited by R. Caspeele, L. Taerwe, and D. Proske, 253–268. New York: Springer.
Mclachlan, G., and D. Peel. 2000. Finite mixture models. New York: Wiley.
NZSEE (New Zealand Society of Earthquake Engineering). 2006. Assessment and improvement of the structural performance of buildings in earthquakes. Auckland, New Zealand: Univ. of Auckland.
Press, W., S. A. Teukolsky, W. T. Vetterling, and B. P. Flannery. 2007. Numerical recipes, the art of scientific computing. 3rd ed. Cambridge, UK: Cambridge University Press.
Sykora, M., T. Cejka, M. Holicky, and J. Witzan. 2013. “Probabilistic model for compressive strength of historic masonry.” In Proc., European Safety and Reliability Conf., edited R. D. J. M. Steenbergen, P. H. A. J. M. van Gelder, S. Miraglia, and A. C. W. M. Vrouwenvelder, 2645–2652. London: CRC Press.
Sykora, M., and M. Holicky. 2010. “Probabilistic model for masonry strength of existing structures.” Eng. Mech. 17 (1): 61–70.
Turnšek, V., and F. Ⓒaⓒoviⓒ. 1971. “Some experimental results on the strength of brick masonry walls.” In Proc., 2nd Int. Brick Masonry Conf., edited by H. W. H. West and K. H. Speed, 149–156. London: British Ceramic Research Association.
Verderame, G. M., G. Manfredi, and G. Frunzio. 2001. “Mechanical properties of concrete used in reinforced concrete structures in 1960s.” [In Italian.] In Proc., 10th Italian Congress on Seismic Engineering. Potenza, Italy: Lamisco.
Witzany, J., T. Čejka, M. Sykora, and M. Holický. 2016. “Strength assessment of historic brick masonry.” J. Civ. Eng. Manage. 22 (2): 224–233. https://doi.org/10.3846/13923730.2014.914087.
Information & Authors
Information
Published In

ASCE-ASME Journal of Risk and Uncertainty in Engineering Systems, Part A: Civil Engineering
Volume 7 • Issue 2 • June 2021
Copyright
This work is made available under the terms of the Creative Commons Attribution 4.0 International license, https://creativecommons.org/licenses/by/4.0/.
History
Received: Jul 14, 2020
Accepted: Sep 24, 2020
Published online: Feb 10, 2021
Published in print: Jun 1, 2021
Discussion open until: Jul 10, 2021
Authors
Metrics & Citations
Metrics
Citations
Download citation
If you have the appropriate software installed, you can download article citation data to the citation manager of your choice. Simply select your manager software from the list below and click Download.