Discharge through Open Offset Joints and Cracks in Spillway Chutes
Publication: Journal of Hydraulic Engineering
Volume 150, Issue 5
Abstract
Spillway chutes containing offsets into the flow at joints or cracks are susceptible to hydraulic jacking from injected high pressures and erosion of foundation materials caused by flow through the openings. Consequently, drainage systems are often provided below the chute floor, but there is a lack of reliable experimental data on expected flow rates. To address this need, uplift pressure and joint discharge tests were performed in a supercritical flume equipped with a model joint whose gap width and offset height into the flow were adjusted over a range of aspect ratios. A previous article gives relations for computing the uplift pressure generated in undrained foundation conditions. This article provides relations for computing discharge through a joint or crack acting as an orifice when the foundation is partially or fully drained. When drainage is unable to fully vent the foundation, these relations can also be used to estimate the residual pressure obtained from partial drainage. Application to the 2017 spillway failure at Oroville Dam shows that open joints can admit much larger flows than previously estimated. This emphasizes the importance of preventive measures such as joint details that prevent the development of offsets into the flow, maintenance to remediate existing offsets, and waterstops to prevent water intrusion.
Practical Applications
Aging spillway chutes often exhibit cracks or displaced joints that create offsets into the flow. Water entering these areas can cause erosion of the foundation leading to failures such as the one experienced at Guajataca Dam in Puerto Rico in 2017. Drainage systems beneath a slab are one method for addressing such problems. Testing performed in a high-velocity laboratory flume was used to develop equations for calculating the flow rate into open offsets. The equations can also be used to estimate the residual pressure remaining in the foundation as a result of partial drainage. An example application to the 2017 spillway failure at Oroville Dam shows that open joints can admit much more flow than previously estimated. The most effective methods for preventing such failures in the future are the design of joints with details that prevent the development of offsets into the flow, grinding down displaced joints or cracks in existing spillways to eliminate offsets into the flow, and the use of waterstops in original construction to prevent water intrusion.
Introduction
The Oroville Dam spillway failure in 2017 highlighted the importance of hydraulic jacking as a potential failure mode of concrete spillway chutes. The presumed failure mechanism in such failures is the jacking of the slab into the flow, initiated by the uplift pressures created at an existing offset into the flow on either the floor or walls of the chute. Offsets in this context are misalignments of the flow surface that result from differential movement of the slab or damage to the surface on either side of a joint or crack. The role of flow through the joint or crack is less apparent, but clearly some flow is needed to transmit pressure into the joint. If the foundation has sufficient porosity or if a drainage system is able to collect and convey the flow out of the foundation, pressure buildup may be limited. However, if drainage capacity is insufficient, the foundation is impermeable, or there is no drainage system, the drain system and/or foundation may pressurize and flow not contained within drain conduits may erode the foundation, creating or enlarging voids. This creates the potential for uplift pressures to be applied to larger areas, increasing the potential for jacking movement of the slab. Voids also create the possibility for slab collapse, especially after high flows subside and pressure within the foundation dissipates. Detailed descriptions of various failure modes related to hydraulic jacking are provided by Trojanowski (2004). The spillways at Hyrum Dam in Utah (Trojanowski 2008) and Fairbairn Dam in Australia (Foster et al. 2016) were severely damaged but had not yet failed when large voids were detected during postoperation inspections. The failure of the Guajataca Dam spillway in Puerto Rico in 2017 has been partially attributed to large flows through cracks, open joints, and gaps between spillway slabs in the lower portion of the chute (Hutsell et al., n.d.).
Estimates of the discharge through offset joints and cracks are needed to design drainage systems and to evaluate risks associated with drainage systems beneath existing spillway slabs. When a drainage system cannot convey all expected flow out of the foundation and the foundation pressurizes, a head-discharge relation for the opening is needed to estimate the head loss and the resulting pressure in the foundation.
Literature Review
Wahl and Heiner (2024) and Wahl et al. (2019) provide detailed reviews of literature relevant to hydraulic jacking associated with unidirectional flow over offset joints and cracks and due to highly turbulent flows associated with hydraulic jumps in stilling basins. This paper addresses flow through joints and cracks affected by unidirectional flow in the supercritical portion of a spillway chute.
Wahl and Heiner (2024) provide experimentally based equations for estimating the pressure head created at square-edged offsets into a spillway flow, which drives flow through a joint or crack. Uplift pressure measured in sealed (nonvented) joints is shown to vary as a function of the velocity head of the boundary layer flow intercepted by the joint (), the gap width to offset height ratio (), and the ratio of flow depth to offset height () where is the flow depth, is the gap width, and is the offset height (Fig. 1).
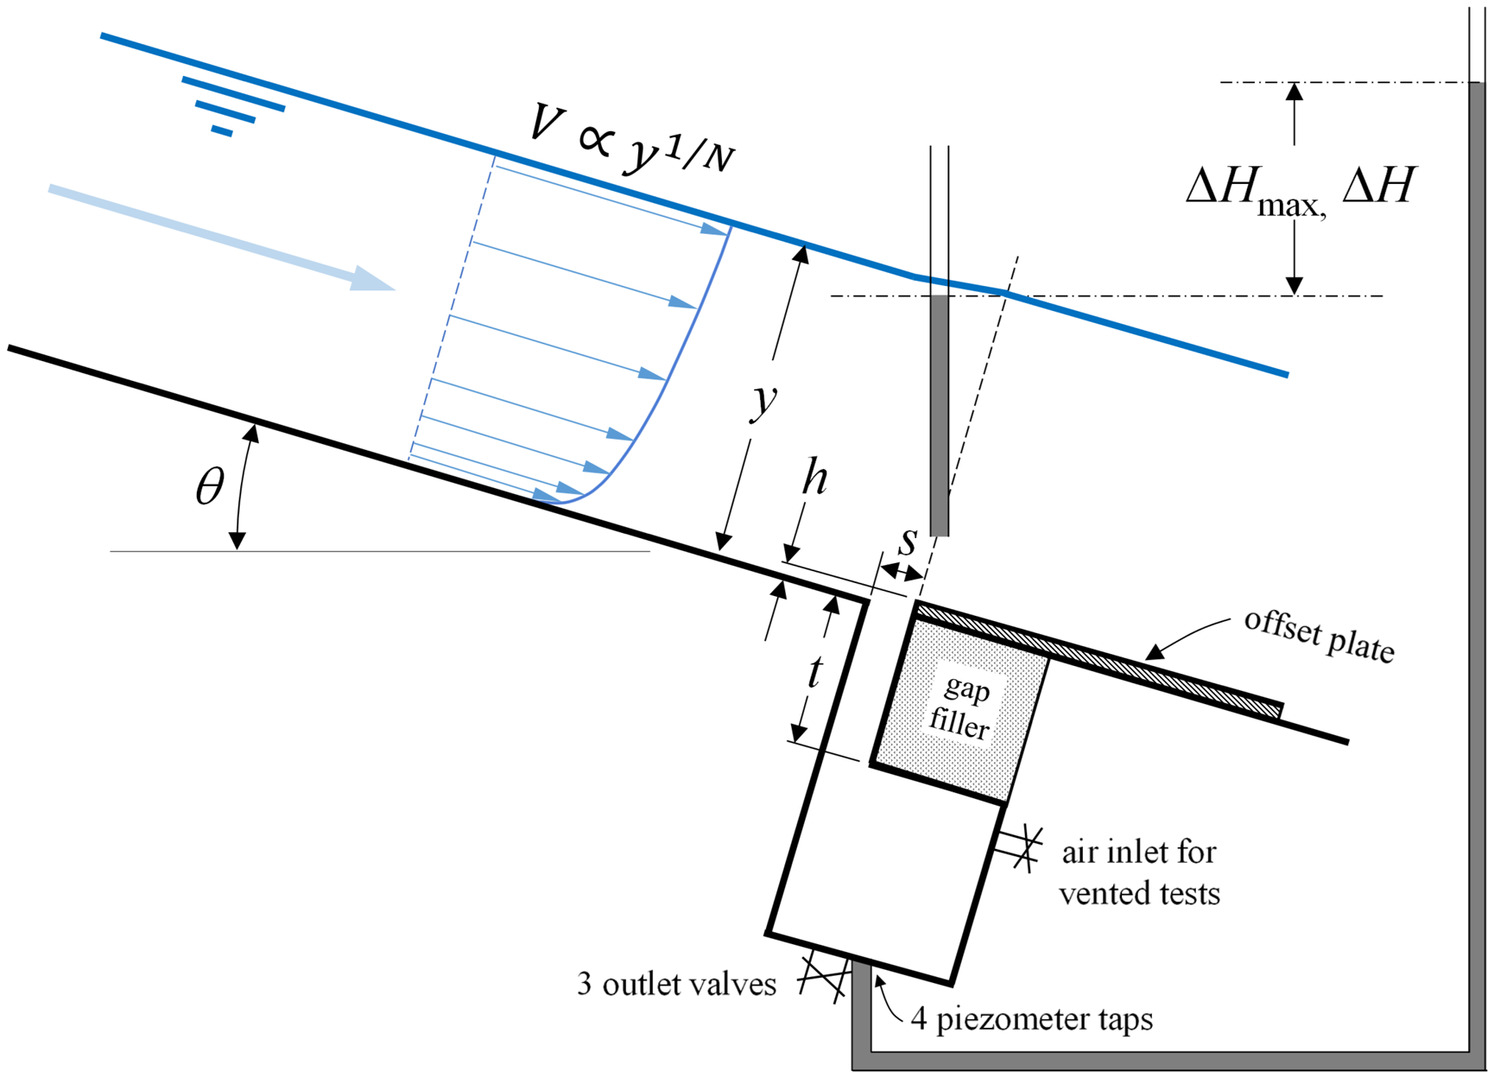
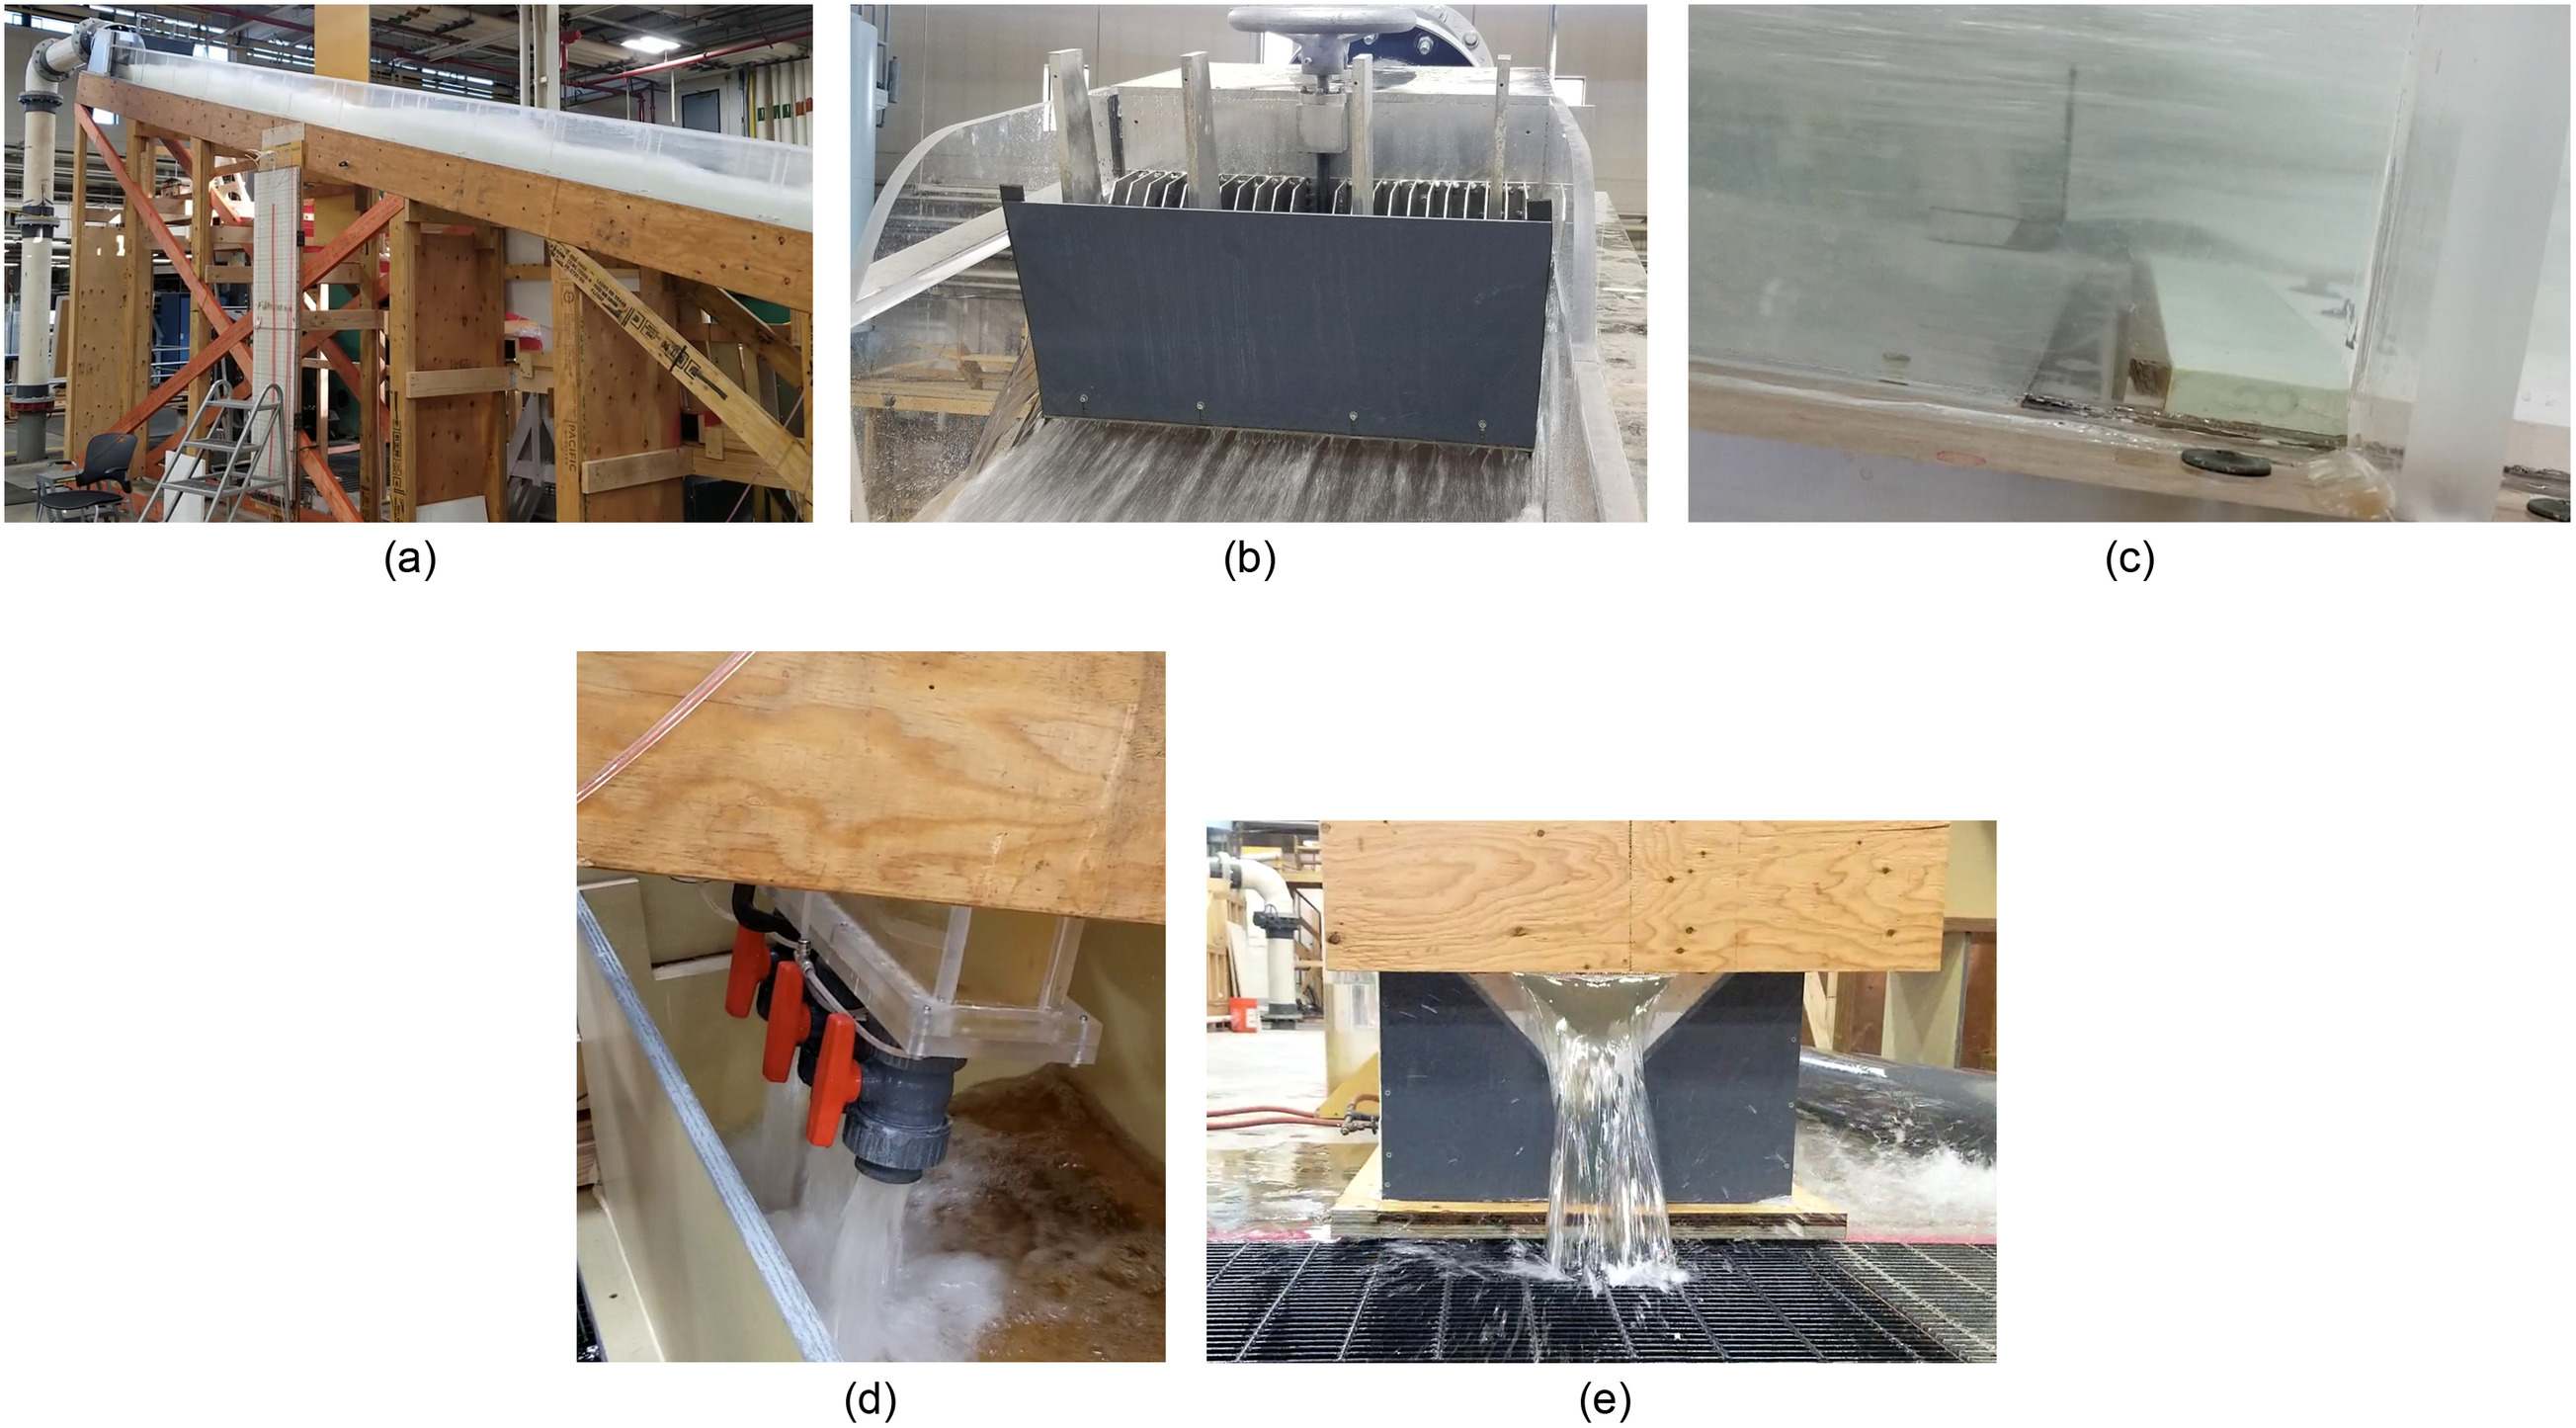
For uniform or gradually varied flows of known depth and velocity, the velocity profile approaching an offset can be defined by a power curve equation , in which can be estimated aswhere = Darcy–Weisbach friction factor; and is the von Kármán constant, assumed to have a value of 0.4. Eq. (1) was developed with data collected in this study (Wahl and Heiner 2024) as an adjustment of the relation (Chen 1991). With known, the velocity head of the boundary layer flow striking an offset can be computed from (Wahl and Heiner 2024)where = acceleration due to gravity; ; and is the familiar energy coefficient (Chow 1959) used to compute the mean channel velocity head . The uplift pressure at an offset into the flow is then given by (Wahl and Heiner 2024)where = base of natural logarithms. It must be emphasized that the experiments used to develop Eqs. (1)–(5) were limited to primarily nonaerated flows due to the moderate 15° slope of the test flume [Fig. 2(a)]. In the aerated flow conditions that could occur in very steep chutes, these relations could vary significantly. There is still a need for study of hydraulic jacking phenomena in aerated conditions, as discussed by Wahl and Heiner (2024).
(1)
(2)
(3)
(4a)
(4b)
(5)
Two previous experimental studies of hydraulic jacking provided some information about generated uplift pressures but did not successfully address the question of flow through joints. Johnson (1976) used a small open-channel facility with velocities up to () but only measured uplift pressures in a sealed joint with no net flow through the joint. Frizell (2007) measured uplift pressures using a water tunnel facility with flow velocities up to (), and joint flow rates were estimated indirectly from pressures measured within the experimental apparatus. Unfortunately, these data indicated for constant offset heights that there was an increasing flow rate through joints with decreasing gap width; this trend continued to the smallest tested gap widths () but was unsustainable to the limit of zero gap width. It is believed now that the reported flow rates were incorrect due to unknown backpressure conditions below the joints, so these data are considered unreliable with no predictive value.
There have been limited previous studies of flow through bottom racks and screens and transverse slots spanning the bottom of subcritical and supercritical channels. The discharge through these bottom outlets has generally been into a space that is vented to the atmosphere, as opposed to the spillway chute application where the foundation beneath the slab may pressurize. Many of the studies of bottom racks have considered bars aligned with the flow direction, but Wahl (2001) and Wahl et al. (2021) studied Coanda-effect screens in which a wedge-wire panel with an array of transverse wires tilted on their axes creates small shearing offsets that divert flow from the bottom of the water column through slots between 0.5 and 2 mm wide. Discharge coefficients of these slots were shown to depend on both the Froude number and the Weber number, with the narrow slots and small offset heights creating a surface tension dependence. Venkataraman (1977) used the momentum equation to develop a mathematical relation for flow through a single, flush transverse slot spanning a channel; this arrangement did not involve any offset of the bottom profile of the channel into the flow at the downstream edge of the slot. Nasser et al. (1980) developed a theoretical expression for the discharge coefficient of such a slot and collected subcritical and supercritical experimental data that supported the theoretical expression. Notably, this relation was dependent on only the Froude number approaching the slot. Subsequent studies (Ramamurthy and Satish 1986; Ramamurthy et al. 1989, 1994) showed the diverted flow in different situations to depend on the ratio of slot width to approach flow depth, the Froude number downstream from the slot, and the ratio of diverted flow to total flow. However, none of these studies considered backpressure beneath the opening or how the stagnation pressure that develops at offsets into the flow could serve as a driving mechanism for flow through bottom slots.
The Oroville spillway failure was investigated by an Independent Forensic Team (IFT 2018). Their report estimated potential flow rates (described as “leakage rates”) through open joints using the energy equation applied to open gaps between two slabs. The driving head was the hydrostatic pressure in the chute due to the flow depth calculated at a location of interest using a water surface profile analysis. Atmospheric pressure was assumed beneath the joint to evaluate the maximum flow rate that could occur if the drainage system was sufficient to convey all admitted flow. The driving head was balanced against inlet and exit losses and friction losses through the slot. The increased driving head created by an offset into the flow was not considered. Even with these assumptions, the estimated flow rates were large enough to cause the forensic team to conclude that the drainage system was inadequate.
Objectives and Approach
Eqs. (1)–(5) provide a basis for estimating the stagnation pressure generated at an offset within a spillway due to either a displaced joint or crack. This serves as the boundary condition or driving head to force flow into the joint or crack, assuming that there is some drainage of the foundation beneath the chute floor or behind the chute walls so that a differential pressure exists across the opening. Information still lacking is an estimate of the pressure outside of the chute and a discharge relation for the opening. This article presents the experimental work performed to develop that discharge relationship and appropriate discharge coefficients for it. The estimation of pressure outside of the chute is primarily a problem of geotechnical engineering and flow through porous media, or flow within a drainage pipe network when such a system has been provided for the spillway. These are separate analyses that will not be addressed specifically in this article, but, in calculated examples, assumptions of partial drainage (i.e., a percentage of the maximum flow that could occur through the opening) are made, and the residual backpressure within the foundation is estimated.
Experimental Facility
An experimental facility was constructed in early 2021 at Reclamation’s hydraulics laboratory in Denver, Colorado, to measure uplift pressures within sealed joints and flow rates at partially vented offset joints. Wahl and Heiner (2024) give a detailed description of the facility; an overview is given here, focusing on aspects relevant to the measurements of joint discharge.
The 0.61-m-wide (2-ft) smooth acrylic flume on a fixed 15° slope is equipped with an adjustable spillway joint located near the downstream end [Fig. 2(c)]. The approach distance to the joint is 8.76 m (28.75 ft), producing well-developed, uniform, or gradually varied flow profiles, depending on discharge. The chute includes several tight joints at 2.44 m (8 ft) intervals within the reach approaching the adjustable joint; although well-constructed and smooth, these joints, like those in a prototype chute, may temporarily reset boundary layer development, but the measured velocity profiles and boundary layer conditions at the test location were consistent and well represented by Eq. (1) (Wahl and Heiner 2024). Flow enters the flume through a jet box [Fig. 2(b)] that can be used to adjust the incoming Froude number. Water supply comes from the laboratory’s fixed pumps and venturi meter flow measurement systems, which include meters from 76-mm (3-in.) to 356-mm (14-in.) diameter calibrated against a weight-based tank. The uncertainty of discharge measurements from this system is generally or better.
The model spillway joint consists of a 57-cm by 7.62-cm (22.5-in. by 3-in.) chamber in the flume floor that spans most of the channel width. The chamber extends 44 cm (17.25 in.) below the flume floor and is equipped with three 50-mm (2-in.) diameter outlet valves at the bottom and a 19-mm [.] diameter air inlet valve near the top of the chamber. Plates installed on the flume floor downstream from the joint (Fig. 1) create offsets into the flow, , to simulate a displaced spillway slab, and a portion of the chamber can also be filled with solid materials to vary the width of the gap, , and the thickness of the joint, . Tested offsets were constructed from a variety of materials, including brass, aluminum, high density foam, expanded PVC panels, and marine plywood. Care was taken to ensure that materials were water resistant and suitably rigid to avoid deformation during tests in which large uplift forces were generated. Gap widths and offset heights were measured for each configuration using digital calipers or feeler gauges and a machinist’s height gauge. Control of the gap width was less precise within the joints than at the chute surface where the gap widths were measured. The reason for this is that the floor of the flume was constructed from 19-mm (.) thick acrylic and there was a slight overhang (mismatch) of the flume floor over the upstream wall of the chamber below the flume (about ). This caused the effective gap width to be slightly greater below the flume floor; the significance of this issue was greater for very narrow gap widths.
For vented testing, joint discharge from the chamber was measured with a 90-deg V-notch weir installed in a 0.61-m (2-ft) wide, 1.52-m (5-ft) long weir box. The weir operates in a partially contracted flow condition for most flow rates. The weir box is equipped with a stilling well and Lory Type-A hook gage with vernier scale measurement precision of 0.0003 m (0.001 ft). Flow calibration of the weir is based on the Kindsvater–Carter weir equations as described in the Water Measurement Manual (Bureau of Reclamation 2001).
Tests have been performed at chute discharges from 0.01 to (0.35 to ), producing unit discharges up to () and mean chute velocities at the tested joint up to about (), adjusted to represent wide-channel conditions. Froude numbers at the joint location have ranged from about 6.7 to 13. Reynolds numbers have ranged from to , where is the hydraulic radius and is the kinematic viscosity. This puts all tests at the edge of or within the zone of fully turbulent flow.
Joints have been tested with offsets () ranging from 0.75 mm () up to 12.6 mm () and gap widths () ranging from about 0.45 mm (0.018 in.) up to 76.2 mm (3 in.). Tests have spanned ratios of 0.044 to 32—a ratio of , or almost three orders of magnitude. The thickness of joints (i.e., length of the flow path through the joint) has been varied from about 5 to 28 cm (2 to 11 in.). Tests have included square-edged joints, chamfers, and radius edges; the data reported in this article were collected from square-edged joints offset perpendicularly into the flow, as shown in Fig. 1. Most tests were conducted with the smooth acrylic approach flow surface of the constructed flume, and a few have been performed with a range of roughened floor overlays that significantly change the boundary layer velocity profile. Even the tests performed with the smooth floor have produced a wide range of boundary layer profiles due to the wide range of discharges, depths, and relative roughness conditions.
Velocity profiles have been measured just upstream from the offsets using a 1.32-mm-diameter (0.052-in.) stainless steel Pitot tube installed with its inlet port 70 mm (2.75 in.) upstream from the edge of the chamber. Flow depths were determined by continuity from the integrated velocity profiles and verified against approximate flow depths determined from an acoustic water level sensor mounted above the water surface. Pressures within the spillway joint were sensed via four manifolded piezometer taps equally spaced along the centerline of the bottom of the chamber, with the outlet valves centered between the taps. All Pitot tube measurements and uplift pressure measurements from the model spillway joint were obtained visually from a nearby manometer board. Pitot tube measurements were made at the centerline of the channel for all tests, and lateral surveys of velocity were made early in the study to develop correction factors to convert centerline velocities to width-averaged mean velocities.
Test Procedure and Measurements
For each test condition, the velocity profile above the spillway chute surface (Fig. 1) was measured from the floor to near the water surface using the Pitot tube, and the mean uplift pressures within the modeled joint were recorded from the manometer board. The uplift pressure head in the sealed chamber below the joint was measured with the outlet valves closed so that there was no net flow through the joint. This was designated as . This uplift head was referenced to the piezometric head associated with the flow depth in the chute, as illustrated in Fig. 1. Next, the valves on the bottom of the chamber were incrementally opened to permit flow through the joint, and the reduced uplift pressure and associated flow rate through the joint were measured [Figs. 2(d and e)]. The value of was also referenced to the flow depth; in a handful of tests where the chamber was fully vented to the atmosphere, this yields , where is the chute slope (assuming pressurized flow through the full thickness of the joint). To verify no hysteresis, tests were also performed in reverse, with high flow established through the joint at the start of the test and the joint flow rate incrementally reduced to zero. Estimated uncertainties for the measured data are shown in Table 1.
| Parameter | Estimated uncertainty | Measurement method |
|---|---|---|
| Chute discharge, | Laboratory venturi meters | |
| Chute velocity, | Pitot tube | |
| Chute velocity near bed (below ) | Pitot tube | |
| Chute velocity above | Pitot tube | |
| Flow depth | Continuity equation using , | |
| Uplift pressure | () | Manometer board |
| Joint discharge | Sharp-crested V-notch weir | |
| Gap width | () | Calipers or feeler gage |
| Offset height | () | Machinist’s height gage |
Wahl and Heiner (2024) discussed how the chute flow can detach from the floor at the leading edge of the offset plate for the combination of large offsets and small flow depths [see Fig. 4 and Appendix S2 of Wahl and Heiner (2024)]. The majority of the joint flow testing was conducted with flow attached to the chute floor, but a few tests were also conducted for detached conditions. Detachment increases the uplift pressure generated at the offset but had no measurable effect on the discharge coefficients for flow through the modeled joints.
Analysis and Results
For each test, a discharge coefficient was computed for the joint acting as an orifice:where = width of the joint across the chute, perpendicular to the chute flow. The boundary conditions or driving head across the orifice are defined by , the stagnation pressure head corresponding to the no-flow condition, and , the backpressure within the joint as the outlet valves are incrementally opened. The test data and computed values of are provided in supplemental Table S1 .
(6)
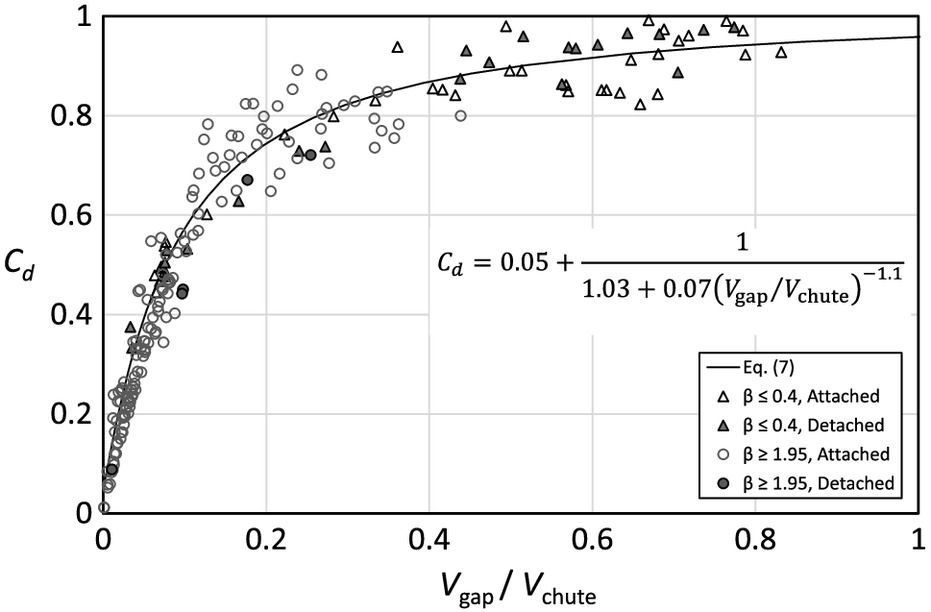
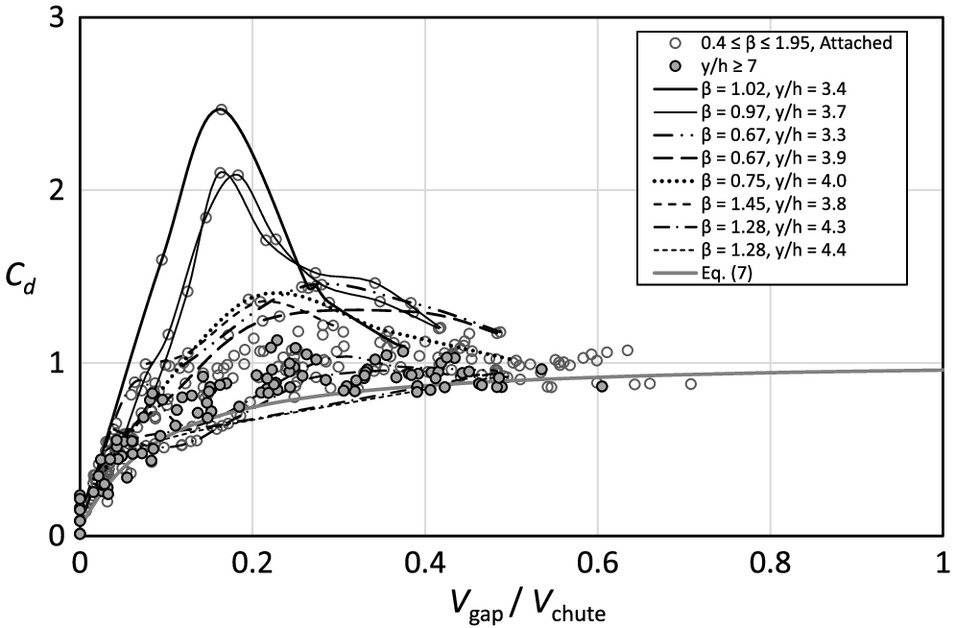
Values of varied with the ratio of mean flow velocity through the joint to mean flow velocity down the chute, . increases from 0 toward 1.0 as varies from 0 to 1 (Fig. 3). This is similar to the observation by Ramamurthy et al. (1994) that of a slot with no offset into the flow varied from 0 toward 0.6 as the diverted flow ratio increased from 0 toward 1. Relations to the boundary layer velocity in the chute were also examined (i.e., akin to the boundary layer velocity head used for uplift pressure prediction), but no significant advantage was seen. The relations between and the gap-to-chute velocity ratio were independent of the attached or detached flow condition, but they were , as shown by Figs. 3–5. For small and large the discharge coefficient data are well represented by
(7)
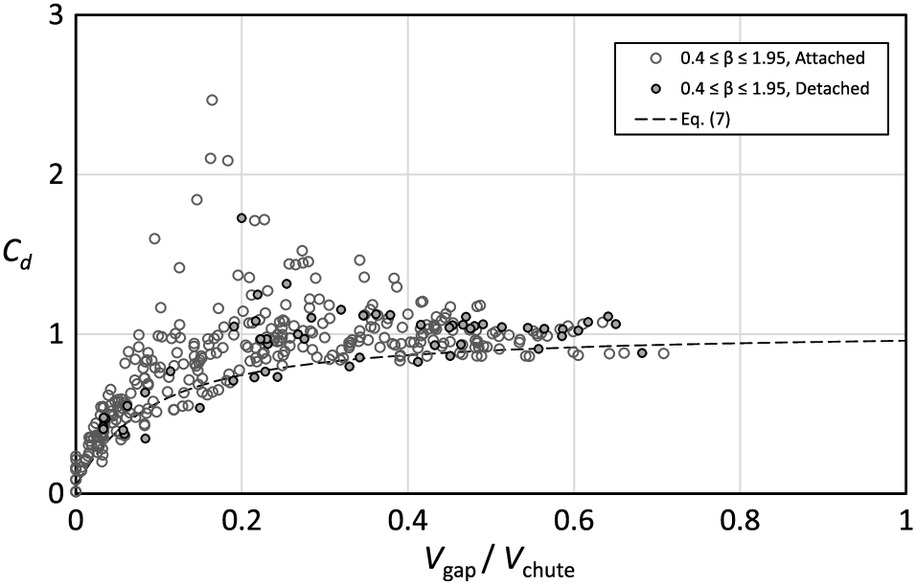
For middle values of from about 0.4 to 1.95, the lower bound of values is also represented well by Eq. (7), but there are also much larger values of and large scatter, especially within the range of to 0.5. Fig. 5 shows additional detail for the middle range, focusing just on the attached-flow data for clarity. The greatest deviations from Eq. (7) occur for low values of less than about 4.0, in the velocity ratio range centered around . Several data sets collected at constant chute discharge with incremental changes of joint flow are highlighted by curves included in the plot. At larger , the discharge coefficients are near or somewhat above those predicted by Eq. (7). The behavior was somewhat inconsistent, with some tests at relatively low values (e.g., the curves highlighted for ) only departing significantly from Eq. (7) at very low values of . No mathematical relation could be determined to accurately represent this variety of behaviors.
Discussion
The unusual behavior of in the middle range can be explained by the fact that the driving head in Eq. (6) is somewhat “virtual.” The head at the entrance to the orifice, , is measured when there is no net flow into the joint, but the head on the downstream side of the orifice, , is measured with flow occurring through the joint. The assumption in Eq. (6) is that the driving head during joint flow can still be determined using . For small and large this appears to be a reasonable assumption; the withdrawal of flow through joints with either very wide gaps or very tall offsets apparently does little to disrupt the pressure field over the joint. For small , Fig. 3 shows that values follow Eq. (7) from to nearly 1.0. For these relatively narrow gaps, the withdrawal of a small flow through the slot has minimal impact on the chute flow still stagnating against the tall offset, so the pressure head driving flow into the joint remains about the same. For large , the data are also faithful to the curve from near 0 to almost 0.6; there are no data available for higher velocity ratios because the capacity of the outlet valves limited the ability to obtain higher velocities through the joint. For these wide gaps, the pressure field over the top of the joint is composed of a high stagnation pressure near the face of the offset and a lower pressure probably associated mostly with the flow depth in the chute that extends to the upstream edge of the opening. Withdrawing flow through the joint may reduce the stagnation of the chute flow against the face of the offset but probably does little to change the pressure field over the upstream portion of the gap, so again the driving pressure remains about the same.
For values around 1.0, the assumption is probably inaccurate that the orifice flow is still being driven by the measured . The withdrawal of flow through the joint seems likely to alter the flow and pressure field approaching and interacting with the joint; perhaps additional boundary layer flow from higher in the water column is drawn toward the floor and brought close to a stagnation condition, with a resulting increase in pressure head at the entrance to the joint. Because the discharge coefficient is being calculated with an effective head that is too small, the computed value is higher than would be obtained if the “correct” head could be used. However, without an ability to measure and know the driving head during joint flow, this is the best result that can be obtained. The effect is largest for cases of small and (Fig. 5).
The use of Eq. (7) for joints with will tend on average to cause underestimation of joint flow. However, errors should be small for large values of where there is less deviation from Eq. (7), so it is unlikely that this will be a serious problem for analyses that are aimed at determining maximum discharge through joints, which will tend to occur at larger chute discharges. Also, efforts to determine maximum possible joint flow may be focused on large gap widths with consequently large values.
Discharge coefficients were computed using a simple orifice equation and primarily represent entry and exit losses from the gap (i.e., an entrance loss and the velocity head within the joint, assuming that all velocity head is lost when the flow exits the joint), with any contribution of friction included within . The correlation of with suggests that the entrance loss is the dominant factor. Tests were conducted with joint thicknesses ranging from to 280 mm and gap widths to 76 mm, but results did not correlate with , , or the ratio , which suggests minor influence of fluid friction through the slot. Data shown in Fig. 3 were limited to tests with gap widths greater than 1.5 mm. Tests with gap widths of 0.45 and 0.8 mm produced large scatter, both higher and lower than the values predicted by Eq. (7). These data were omitted from the figure and the data set used to develop Eq. (7) because of the concern discussed earlier about the exact dimension of the gap below the slight overhang of the chute floor.
Rearrangement of the orifice equation [Eq. (6)] can be used to express the total driving head in terms of the velocity head within the jointwhere . The right side of this equation represents the total head loss through the joint, which is the sum of an entrance loss, any friction losses, and the exit loss, taken to be the full velocity head. This can be written as
(8)
(9)
The entrance loss coefficient is then given by
(10)
This relation can be used to determine the entrance loss separately when considering a case that includes significant friction losses through the joint.
General Application
To determine the discharge through a joint of known dimensions, the flow conditions in the chute at the joint position must first be estimated. A water surface profile program such as SpillwayPro (Wahl and Falvey 2022) can be used to determine the flow depth, mean velocity, and friction factor at the station of the joint. Eqs. (1)–(5) can then be used to determine the uplift pressure head for undrained conditions (no joint flow), which will be the driving head applied to the joint. Eq. (7) must be solved iteratively to determine the discharge coefficient, since the velocity through the gap cannot be determined until the flow rate is known. This can be readily accomplished by starting with a trial value in the range to 0.8. The discharge is then computed as
(12)
In a fully vented situation with sufficient drain capacity to convey all joint flow freely out of the foundation, , since atmospheric pressure exists at the bottom of the joint and is referenced to the piezometric level in the chute. Iterating on Eqs. (7) and (12) will quickly lead to convergence. If the resulting flow rate is not consistent with original assumptions about the capacity of the drain system, it may be necessary to adjust the estimate of and repeat the process.
An analysis could also be made to determine the residual uplift pressure head in the drainage system for a given set of chute flow conditions and a prescribed discharge through a joint, such as a predetermined maximum drain system capacity. The discharge coefficient is determined from Eq. (7), and the uplift pressure head is computed directly from
(13)
Case Study Calculation
The independent forensic team that investigated the hydraulic jacking failure of the spillway at Oroville Dam made estimates of potential seepage flows into open joints with gap widths of 3.2 to 25 mm ( to 1 in.). These estimates used only the flow depth in the chute as the driving head to cause seepage; they did not consider the role of offsets into the flow, which create stagnation head that can greatly increase discharge into the joints. Still, the IFT (2018) analysis led to a conclusion that the drainage system was probably unable to keep up with potential seepage flows and was a contributing factor in the failure.
For comparison, the equations developed in this article and the previous paper (Wahl and Heiner 2024) were used to make estimates of flow into joints for the same assumed flow conditions and gap widths; these estimates considered offsets into the flow ranging from 3.2 to 25 mm (Table 2). An example of the calculations is provided in the Appendix. The calculated unit discharges into joints are much larger than the IFT (2018) estimates, by multiples ranging from about 1.7 to 8.6. As expected, the greatest relative differences are for tall offsets and narrow gaps, i.e., small values of . In a real spillway it is unlikely that joints will be open along their full length, but the magnitude of these estimated flows means that even if joints were open for only part of their length, the forensic study’s conclusion of inadequate drainage would still be supported.
| Gap width, [mm (in.)] | Discharge into fully vented open joint per unit width, , for different offset heights, | Forensic estimate of seepage flow per unit width, (IFT 2018) | |||
|---|---|---|---|---|---|
| () | () | () | () | ||
| 3.2 () | 0.017 (0.19) | 0.021 (0.23) | 0.026 (0.28) | 0.032 (0.34) | 0.004 (0.04) |
| 6.4 () | 0.034 (0.36) | 0.042 (0.45) | 0.052 (0.56) | 0.064 (0.69) | 0.010 (0.11) |
| 13 () | 0.063 (0.68) | 0.080 (0.86) | 0.102 (1.09) | 0.127 (1.36) | 0.028 (0.30) |
| 25 (1.0) | 0.113 (1.21) | 0.147 (1.58) | 0.192 (2.07) | 0.246 (2.65) | 0.065 (0.70) |
Note: Flow conditions at the joint are (); (3.09 ft); and (), at reservoir elevation 262.56 m (861.4 ft). Values of vary from 0.54 to 0.81. Values of vary from 0.12 to 0.32. The cases highlighted in bold are also illustrated in Fig. 6.
A set of calculations was also performed using Eqs. (7) and (13) to investigate the residual uplift pressure for different degrees of drainage. For drainage capacity equal to different percentages of the maximum joint flow for each joint geometry, Fig. 6 shows the percentage of residual pressure head below the chute floor compared to the no-drainage case. Each curve begins at 100% uplift for zero drainage and diminishes toward zero with increasing drainage. All curves reach zero uplift at less than 100% drainage because the uplift pressure head is determined relative to the piezometric head (i.e., flow depth) in the chute; 100% drainage would reduce pressure below the slab to atmospheric pressure, which is below the chute water surface and thus negative relative to the chute flow depth. The condition of zero uplift pressure in the figure is actually an equilibrium condition for which positive pressure beneath the slab matches the pressure applied by the chute flow above the slab. It should be noted that the maximum flow rates through the joint for the depicted cases vary dramatically, as highlighted in Table 2, but for a convenient visual comparison the figure shows the variation of uplift pressure relative to the percentage of drainage provided. Although some of the curves have similar appearance, the drainage flow requirements are much different. For example, both cases with 25 mm offsets require drainage equal to about 90% of the maximum joint flow to achieve zero uplift. For the 3.2 mm gap width this would be drainage of about per meter of joint length, while the 25 mm gap width would require about per meter. As expected, the difference is approximately proportional to the ratio of the gap widths.
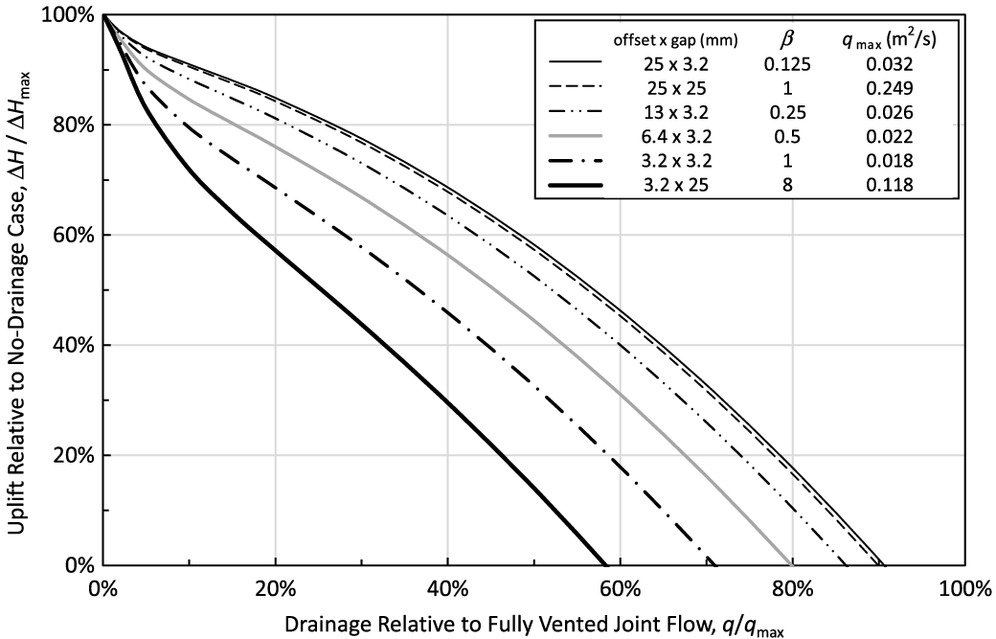
The behavior for different joint geometries varies significantly depending on the portion of the discharge coefficient curve (Fig. 3) that applies to each case. The unusual form of the curves in Fig. 6 is due to the varying sensitivity of to changes in . There is more variability for the small offset cases, since they generate less stagnation pressure head and smaller ratios of , which puts them in the high-gradient section of Fig. 3.
Conclusions
The first successful laboratory measurements of flow through simulated open offset joints and cracks in a spillway chute have been completed, and the discharge has been represented by a simple orifice equation with a discharge coefficient that varies with the ratio of flow velocity through the joint to that in the chute. For gap widths as small as 1.5 mm there was no significant influence of friction through the joint, although this could change for joints with irregular internal profiles or significant plugging by debris.
For small and large values of the aspect ratio of joint offset height and gap width, , the discharge coefficient was only a function of the gap-to-chute velocity ratio, but for intermediate values of about , was inversely sensitive to the flow depth to offset height ratio, , and the degree of sensitivity was maximum for values very near 1.0 and values in the range of 0.05 to 0.5, centered around . No mathematical model to represent this sensitivity was developed, since the behavior was somewhat inconsistent and probably has little impact on practical evaluation or design of under-slab drainage systems. Eq. (7) represents the general relation between and and is suggested for practical use in all situations, with recognition that it can significantly underestimate for cases that satisfy all of the conditions , , and . Fig. 5 shows that one measured value of was about 3.5 times greater than Eq. (7) for close to 1.0 and . However, with significantly different from 1.0 and/or with , the differences were significantly smaller, on the order of 2 times greater or less. Since the largest driving heads for joint flow will occur when flow depths are large and chute velocities are high, the case of low is unlikely to be the worst-case condition.
The driving head for flow through a joint is the stagnation pressure against the offset, which is taken to be the uplift pressure measured in the joint when no drainage is allowed. This uplift pressure can be predicted for given flow conditions with joints of known geometry using Eqs. (1)–(5) developed previously by Wahl and Heiner (2024). Using the predicted uplift pressure, the discharge through a joint can be calculated using Eqs. (7) and (8), which must be solved iteratively in combination. If the calculated joint discharge exceeds the capacity of the drainage system or the natural drainage capacity of foundation soils, the pressure head beneath the chute can be estimated for a given amount of drainage using Eqs. (7) and (13). To size a drainage system to achieve a given backpressure within the foundation (or no backpressure at all), iterative analysis of the uplift pressure and joint flows combined with the drainage system performance would be needed.
An example application to the Oroville spillway hydraulic jacking failure showed that joint discharges driven by stagnation pressure head are up to eight times larger than the seepage flow estimates computed during the forensic investigation (IFT 2018). This result occurred even though reduced boundary layer velocities cause uplift pressure estimates to be significantly lower than the forensic analysis estimates (Wahl and Heiner 2024). Example calculations of estimated residual pressure when drainage is provided showed that drainage capacities somewhat below the maximum possible joint flow rates can produce substantial uplift reduction, but the magnitude of estimated flow rates means that the total drainage capacity needs may still be very large. This emphasizes the importance of addressing the uplift problem at its source by using defensive design measures to prevent the development of offsets into the flow, performing maintenance to remediate offsets in existing chutes, and providing waterstops to prevent water intrusion.
The present study was limited to uniform and gradually varied nonaerated flow conditions, which are typical of the moderate slopes on which spillway chutes are constructed over soil or rock foundations that make them susceptible to hydraulic jacking failure. There is still a need for research in aerated flow conditions that might occur on steep slopes, although steep spillways are commonly constructed in a monolithic manner that makes them less prone to jacking failures.
Notation
The following symbols are used in this paper:
- curve-fitted parameter;
- curve-fitted parameter;
- base of natural logarithms, approximately 2.7183;
- Darcy–Weisbach friction factor;
- acceleration due to gravity on Earth, ();
- head loss at entrance to joint;
- head loss at exit of joint;
- offset height;
- velocity head computed from the mean channel velocity, ;
- velocity head of the boundary layer flow between the chute floor and the tip of an offset;
- head loss coefficient for joint entrance;
- exponent in velocity profile equation, ;
- total discharge in chute;
- discharge through joint or crack;
- discharge per unit width;
- gap width;
- joint or slab thickness, or flow path length through the joint;
- average velocity in spillway chute;
- average velocity in spillway chute;
- average velocity through open joint or crack;
- velocity through spillway joint;
- width of open joint across width of chute, perpendicular to flow direction;
- flow depth;
- energy coefficient relating true velocity head to ;
- energy coefficient relating to ;
- joint gap width to offset height aspect ratio, ;
- uplift pressure head within simulated joint during joint flow;
- uplift pressure head within sealed (nondrained) joint;
- angle of chute slope below horizontal; and
- von Kármán .
Supplemental Materials
File (supplemental materials_jhend8.hyeng-13898_wahl.pdf)
- Download
- 351.43 KB
Appendix. Example Calculation
Given conditions for this example match those used for one of the cases calculated in the Oroville forensic report (IFT 2018) and highlighted in Table 2. Discharge () in the 54.46-m (178.67-ft) wide spillway chute operating at reservoir elevation 262.56 m (861.4 ft). The chute slope at this location is 13.77° (24.5% slope). From water surface profile calculations the forensic team determined, depth (3.088 ft), velocity (), and Darcy–Weisbach friction factor . The slab is 178 mm thick (7 in.), and the joint has with offset height (0.5 in.) and gap width (0.5 in.). The foundation beneath the chute floor is first assumed to be fully vented (drained) with no backpressure. In the final step, partial drainage is assumed, and calculations are made to estimate the residual backpressure in the foundation.
Solution:
| 1. Eq. (1) is used to compute . |
| 2. |
| 3. |
| 4. Eqs. (3) and (4b) are used to compute the inputs to Eq. (5). |
| 5. The value of and the normalized uplift is computed with Eq. (5): |
| 6. |
| 7. To compute flow through the joint for fully vented conditions, adopt the previously calculated as , and set the pressure head below the joint to |
| 8. Initially assume |
| 9. Use a variation of Eq. (12) to compute the discharge per unit width: |
| 10. Now compute the velocity through the joint and revise using Eq. (7): |
| 11. Iterate on steps 9 and 10 until the flow rate converges. |
| Trial 2: ; ; |
| … |
| Final Result: ; ; |
| 12. If the drainage system can convey only 50% of the maximum discharge that could be delivered through the joint, the residual pressure can be determined by calculating , and then using Eqs. (7) and (13). |
| Eq. (7): |
| Eq. (13): |
| In this case, the residual pressure for 50% drainage is about half of the maximum uplift, but this approximate proportionality will not always hold true, as shown in Fig. 6. |
Data Availability Statement
All data that support the findings of this study are available from the corresponding author upon reasonable request.
Acknowledgments
This work was jointly funded by the Bureau of Reclamation Dam Safety Office (Technology Development Program) and Research Office (Science and Technology Program). Model makers Jimmy Hastings, Jason Black, Jeffrey Falkenstine, and Dane Cheek constructed many of the unique test facility components. Joshua Mortensen provided internal peer review.
References
Bureau of Reclamation. 2001. Water measurement manual. 3rd ed. Washington, DC: US Government Printing Office.
Chen, C. L. 1991. “Unified theory on power laws for flow resistance.” J. Hydraul. Eng. 117 (3): 371–389. https://doi.org/10.1061/(ASCE)0733-9429(1991)117:3(371).
Chow, V. T. 1959. Open-channel hydraulics, 28–29. New York: McGraw-Hill.
Foster, P., B. Wark, D. Ryan, and J. Richardson. 2016. “Damage to the Fairbairn Dam spillway and subsequent analyses and design of the remedial works.” In Dams: A lasting legacy. Tasmania, Australia: Australian National Committee on Large Dams/New Zealand Society on Large Dams.
Frizell, K. W. 2007. Uplift and crack flow resulting from high velocity discharges over open offset joints. Denver: Bureau of Reclamation.
Hutsell, S. S., C. E. Cepero, and T. N. Loar. n.d. “Case study: Guajataca Dam (Puerto Rico, 2017).” Accessed November 3, 2023. https://damfailures.org/case-study/guajataca-dam-puerto-rico-2017/.
IFT (Independent Forensic Team). 2018. “Independent forensic team report: Oroville Dam spillway incident.” Accessed January 9, 2018. https://damsafety.org/sites/default/files/files/Independent.
Johnson, P. L. 1976. “Research into uplift on steep chute lateral linings.” Memorandum to the Open and Closed Conduit Systems Committee, Bureau of Reclamation, Denver, CO. Accessed November 2, 2018. https://www.usbr.gov/tsc/techreferences/hydraulics_lab/pubs/PAP/PAP-1163.pdf.
Nasser, M. S., P. Venkataraman, and A. S. Ramamurthy. 1980. “Flow in a channel with a slot in the bed.” J. Hydraul. Res. 18 (4): 359–367. https://doi.org/10.1080/00221688009499541.
Ramamurthy, A. S., and M. G. Satish. 1986. “Discharge characteristics of flow past a floor slot.” J. Irrig. Drain. Eng. 112 (1): 20–27. https://doi.org/10.1061/(ASCE)0733-9437(1986)112:1(20).
Ramamurthy, A. S., D. M. Tran, and L. B. Carballada. 1989. “Open channel flow through transverse floor outlets.” J. Irrig. Drain. Eng. 115 (2): 248–254. https://doi.org/10.1061/(ASCE)0733-9437(1989)115:2(248).
Ramamurthy, A. S., W. Zhu, and B. L. Carballada. 1994. “Flow past two-dimensional lateral slot.” J. Environ. Eng. 120 (6): 1632–1638. https://doi.org/10.1061/(ASCE)0733-9372(1994)120:6(1632).
Trojanowski, J. 2004. “Assessing failure potential of spillways on soil foundation.” In Proc., Annual Conf, Lexington, KY: Association of State Dam Safety Officials.
Trojanowski, J. 2008. “DAM SAFETY: Evaluating spillway condition.” Accessed October 1, 2018. https://www.hydroworld.com/articles/hr/print/volume-27/issue-2/technical-articles/dam-safety-evaluating-spillway-condition.html.
Venkataraman, P. 1977. “Divided flow in channels with bottom openings.” J. Hydraul. Eng. 103 (2): 190–194. https://doi.org/10.1061/JYCEAJ.0004703.
Wahl, T. L. 2001. “Hydraulic performance of Coanda-effect screens.” J. Hydraul. Eng. 127 (6): 480–488. https://doi.org/10.1061/(ASCE)0733-9429(2001)127:6(480).
Wahl, T. L., and H. T. Falvey. 2022. “SpillwayPro: Integrated water surface profile, cavitation, and aerated flow analysis for smooth and stepped chutes.” Water 14 (8): 1256. https://doi.org/10.3390/w14081256.
Wahl, T. L., K. W. Frizell, and H. T. Falvey. 2019. “Uplift pressures below spillway chute slabs at unvented open offset joints.” J. Hydraul. Eng. 145 (11): 04019039. https://doi.org/10.1061/(ASCE)HY.1943-7900.0001637.
Wahl, T. L., and B. J. Heiner. 2024. “Laboratory measurements of hydraulic jacking uplift pressure at offset joints and cracks.” J. Hydraul. Eng. 150 (4): 04024016. https://doi.org/10.1061/JHEND8.HYENG-13871.
Wahl, T. L., C. C. Shupe, H. Dzafo, and E. Dzaferovic. 2021. “Surface tension effects on discharge capacity of Coanda-effect screens.” J. Hydraul. Eng. 2021 (147): 04021026. https://doi.org/10.1061/(ASCE)HY.1943-7900.0001902.
Information & Authors
Information
Published In

Journal of Hydraulic Engineering
Volume 150 • Issue 5 • September 2024
Copyright
This work is made available under the terms of the Creative Commons Attribution 4.0 International license, https://creativecommons.org/licenses/by/4.0/.
History
Received: Sep 5, 2023
Accepted: Apr 23, 2024
Published online: Jul 8, 2024
Published in print: Sep 1, 2024
Discussion open until: Dec 8, 2024
ASCE Technical Topics:
- Bodies of water (by type)
- Channels (waterway)
- Coasts, oceans, ports, and waterways engineering
- Continuum mechanics
- Cracking
- Drainage
- Drainage systems
- Engineering mechanics
- Foundations
- Fracture mechanics
- Geotechnical engineering
- Hydraulic engineering
- Hydraulic structures
- Hydrologic engineering
- Irrigation engineering
- River engineering
- Solid mechanics
- Spillways
- Stream channels
- Structural engineering
- Structures (by type)
- Water and water resources
- Water discharge
- Water management
- Waterways
Authors
Metrics & Citations
Metrics
Citations
Download citation
If you have the appropriate software installed, you can download article citation data to the citation manager of your choice. Simply select your manager software from the list below and click Download.