Spatiotemporal Dynamics of Regional Development in the Jiangxi Province of China from 2003 to 2022: A Data-Driven Exploration Using NPP-VIIRS-Like Night Light Data
Publication: Journal of Urban Planning and Development
Volume 150, Issue 4
Abstract
The study of the spatiotemporal evolution of regional development plays a vital role in regional coordination and sustainable development, and analyzing the characteristics of the spatiotemporal evolution of regional development in Jiangxi Province is of great significance for its deep integration into the Yangtze River Delta, the Pearl River Delta, and Fujian, and its active undertaking of industries in developed regions. Based on the National Polar-orbiting Partnership–Visible Infrared Imaging Radiometer Suite (NPP-VIIRS)-like nighttime lighting data from 2003 to 2022, this paper explores and discusses the nighttime lighting data as an effective indicator of regional development from the perspective of Jiangxi Province as a whole, using correlation analysis and multiple linear regression. Meanwhile, the spatial and temporal evolution characteristics of regional development in Jiangxi Province are explored by using spatial autocorrelation, hotspot analysis, standard deviation ellipse, and other research methods in 100 counties in Jiangxi Province. The results show the following: (1) The nighttime lighting data in Jiangxi Province shows a strong positive correlation with gross domestic product (GDP) and total population data, with correlation coefficients R2 of 0.957 and 0.896, respectively. (2) The GDP and total population of Jiangxi Province significantly impact nighttime lighting, and the regression model R2 reaches 0.983, indicating that the class NPP-VIIRS nighttime lighting data has an excellent explanatory ability for the regional development of Jiangxi Province. (3) The global autocorrelation index of nighttime lighting in each county in Jiangxi Province shows a significant positive correlation level. However, the value of this index still shows a gradually decreasing trend, indicating that the spatial heterogeneity is gradually increasing. As a whole, the hotspots in Jiangxi Province are mainly dominated by the city of Nanchang and supplemented by Ganzhou city, showing the development of two centers in the north and south. (4) The change in the trajectory of the center of gravity migration from 2003 to 2011 is also more apparent, with greater changes in the direction of regional development in Jiangxi Province. In the period 2012–2022, the direction of regional development is more stable, and the change in the migration of the center of gravity tends to be stable, indicating that the direction of regional development is clear at this stage, and there is little change in the overall direction of the economy and centripetal force. The study results provide important clues for an in-depth understanding of the regional development law in Jiangxi Province and are of some reference significance for relevant decision-making and planning.
Introduction
Regional development includes both economic development and social development. Economic development is the backbone of a region, and statistics such as GDP have long been collected and analyzed using the central administrative units (Jiang et al. 2002). People are the central factor in social development, and population is the most basic and central starting point in the social system (Xu 2023). Understanding the spatiotemporal evolution of regional development is not only a core issue of regional sustainable development but also a core issue of geography research (Wang et al. 2012; Zhang 2012; Zhang et al. 2023c). Studying regional development with the county as a unit can show the changes in regional development more finely and help grasp the characteristics of regional evolution (Zhang et al. 2023a).
With the development of science and technology, satellite sensors can capture the nighttime lighting (NTL) data of the Earth; compared with the traditional visible light, near-infrared, and synthetic aperture radar (SAR) remote sensing data, the night light data reflect more of the population dynamics and socioeconomic growth and other information that is closely related to human activities. Due to the availability and reliability of nighttime lighting data, spatial data mining can be used for a variety of purposes, such as estimating the spatial distribution of natural environmental elements (e.g., CO2 emissions and PM2.5) (Chen et al. 2020, 2023; Zhang et al. 2023b) researching urbanization and urban sprawl (He and Qiao 2018; Kamarajugedda et al. 2017; Ma et al. 2015), and developing, monitoring, and forecasting social and economic elements (Fu et al. 2017; Liu et al. 2023; Xiaobo et al. 2017; Yuke et al. 2015; Zhu et al. 2022).
The feasibility of nighttime lighting data for studying social and economic factors has been demonstrated in several places (Elvidge et al. 2012, 2013; Ghosh et al. 2013; Zhao et al. 2016). In using nighttime lighting indexes instead of social and economic factor studies, Zhao et al. (2018) used the corrected defense meteorological satellite program (DMSP)-operational linescan system (OLS) nighttime lighting indexes over time and illuminated regions to track urbanization in Southeast Asia. Li et al. (2022) used the spatial and temporal distribution and evolution of DMSP-OLS and National Polar-orbiting Partnership–Visible Infrared Imaging Radiometer Suite (NPP-VIIRS) nighttime lighting data to make a study of Xi'an metropolitan area's regional development. The correlation analysis of the total nighttime lighting with social and economic factors reveals the driving force of regional development, and the standard deviation ellipse and center of gravity migration of nighttime lighting data reflect the speed and direction of urban development (Du et al. 2024). Spatial autocorrelation is used to reflect the economic development and spatial distribution characteristics of the county for the total nighttime lighting data; hotspot analysis is used to reveal the spatial and neighborhood aggregation status and hotspot areas within the region (Kuang et al. 2023). Regression analysis was used to investigate the effects of population, GDP, and regional development intensity on county lights (Zhao et al. 2018, 2023; Zhou et al. 2023). However, due to the problems of incomparability and temporal discontinuity of nighttime lighting data from multiple sources, most of the studies are limited for this purpose and can only be monitored for a short period of time for the region.
The NPP-VIIRS-like nighttime lighting data is a cross-sensor corrected data based on a self-coder model. This data set is derived from the Harvard Dataverse platform, which is from 2000 to 2022 in terms of time length, which is suitable for monitoring the state of demographic and socioeconomic activities for a more extended period and has similar characteristics to the NPP-VIIRS nighttime lighting data. This data set has been widely used. Du et al. (2024) used this data set as a basis to reflect the direction and change of urbanization in Gansu Province. Zhang (2012) used this data set to analyze the spatiotemporal evolution of Henan Province by comparing the GDP data with a variety of regression models and discussing the accuracy of the NPP-VIIRS-like data set for the study area with good temporal consistency. Ao et al. (2022) used this data set to study the spatiotemporal development of urbanization in Guangdong, Hong Kong, and Macao. Chen et al. discussed that this new data set has a similar quality to the NPP-VIIRS nighttime lighting data and can clearly reflect the detailed information of the inner-city and its temporal changes, and provide a valuable way to detect the dynamics of population and socioeconomic activities (Chen et al. 2021).
This paper uses NPP-VIIRS-like nighttime lighting data to explore the evolution of spatiotemporal patterns of regional development in Jiangxi Province from 2003 to 2022 and to investigate the influencing factors and their correlations with nighttime lighting data. The research is carried out in the following three aspects: (1) study the correlation between the total population, GDP, and nighttime lighting data and the degree of influence on them; (2) study the spatial distribution characteristics of the regions in Jiangxi Province in a long time series and the distribution of hotspots in its regions by using the nighttime lighting data based on counties; and (3) describe the characteristics of the regional development by using the standard deviation ellipse and center of gravity analysis as well as the center of gravity migration paths to describe the direction of the regional development in Jiangxi Province.
Study Area and Data
Study Area
As shown in Fig. 1, Jiangxi Province is located in the southeastern part of the People's Republic of China and is abbreviated as “Gan.” The province covers a total area of 166,900 km2 and is geographically located between latitude 24°29′14″ and 30°04′43″ north and longitude 113°34′18″ and 118°28′56″ east. It is located in the central region of the Yangtze River Delta, the Pearl River Delta, and the West Coast of the Taiwan Strait, bordered by Zhejiang and Fujian Provinces to the east, Guangdong Province to the south, Hunan Province to the west, and the Yangtze River to the north, adjacent to Hubei and Anhui Provinces. Jiangxi's Gross Regional Product (GRP) is 3,207.47 billion yuan (as of 2022), showing a year-on-year increase of 4.7%. The province is divided into 11 prefecture-level cities, 27 municipal districts, 12 county-level cities, and 61 counties, totaling 100 county-level divisions. The topography is dominated by the hills and mountains of Jiangnan, with extensive basins and valleys, and with the Poyang Lake Plain and the Middle and Lower Yangtze River Plains. The climate belongs to the subtropical monsoon climate, with the average annual temperature ranging from 16.3℃ to 25℃, showing an increasing trend from north to south.
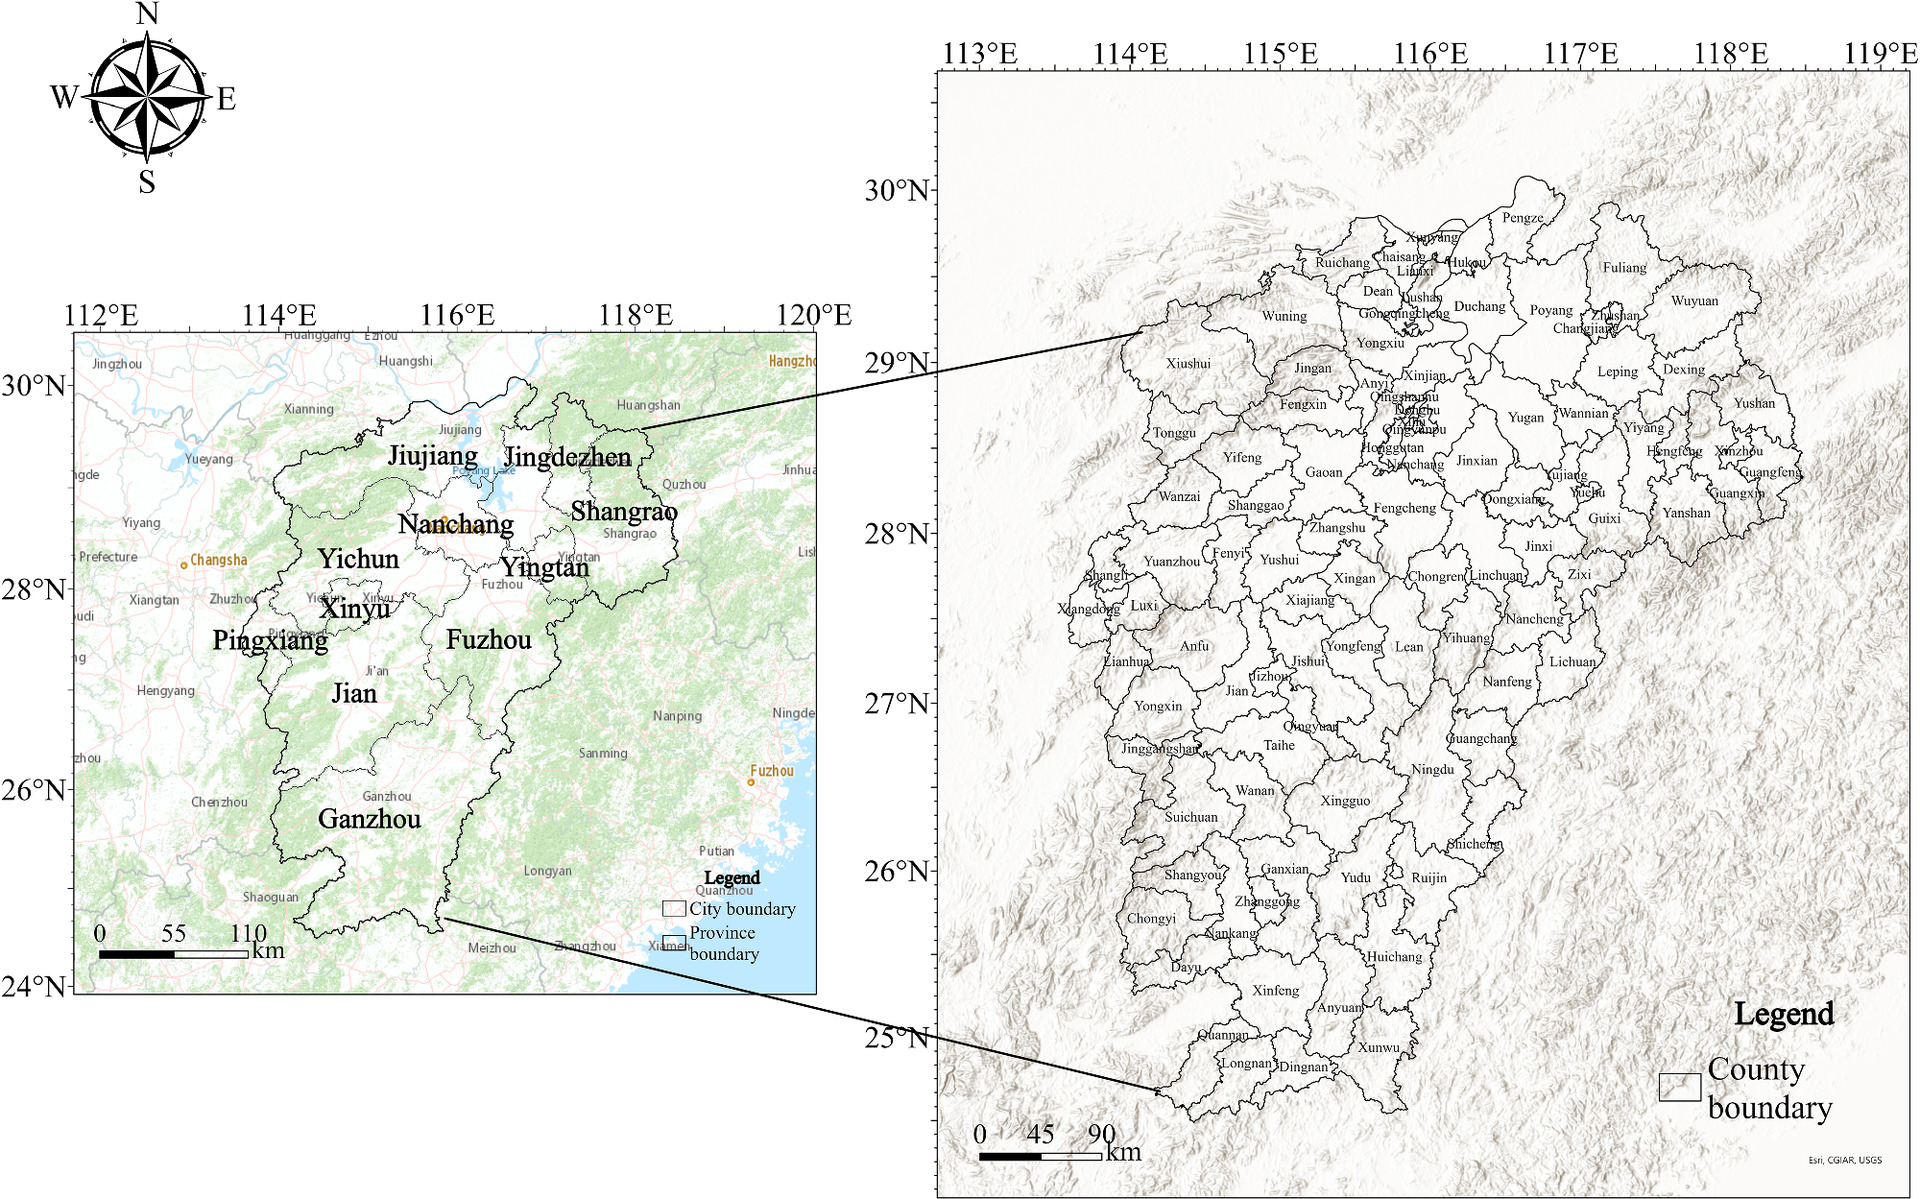
Fig. 1. Study area: Jiangxi Province, China.
[Map reprinted from Tianditu (www.tianditu.gov.cn).]
Data Sources and Preprocessing
NPP-VIIRS-Like Data
NTL data are remote sensing image data. Information such as on the lights of the Earth at night detected by satellite sensors can characterize human social activities, so NTL data have been widely used in research on the urbanization process and economic development. Nowadays, the common nighttime light product is DMSP-OLS nighttime light remote sensing data, which is the most extended time-series data (from 1992 to 2013). The second is the NPP-VIIRS data, produced from April 2012 to the present. The NTL data from the two different channels have resolution, data vintage, and sensor incompatibility, hence limiting the observational studies for a long time series. The NPP-VIIRS-like nighttime light data used in this paper are worldwide 500 m resolution nighttime light data from 2000 to 2022 obtained from a cross-sensor correction scheme based on a self-coder model.
The data for this experiment use the NPP-VIIRS-like NTL data set from 2003 to 2022 sourced from the Harvard Dataverse platform, and the data storage format is Geotiff. After obtaining the NPP-VIIRS-like data set, the 2003–2012 data are extracted by removing the mask of the watershed following the 2022 data, and finally, the NTL data of the global mask range from 2003 to 2022 are obtained. After obtaining the NTL data without water, the NTL data were image cropped with the boundary of Jiangxi Province using tools such as ArcGIS Pro, after which the image was subjected to Lambertian projection.
The total amount of lights in the whole region of Jiangxi Province was calculated according to the year, as well as the attribute values of the total amount of lights in the region based on the 100 counties assigned to the administrative divisions of Jiangxi based on the sampling every four years (2003, 2007, 2011, 2015, 2019, 2022):where DNi = pixel value of each raster cell in the region; n = number of rasters in the region; and TNTL = total nighttime lighting index of the region.
(1)
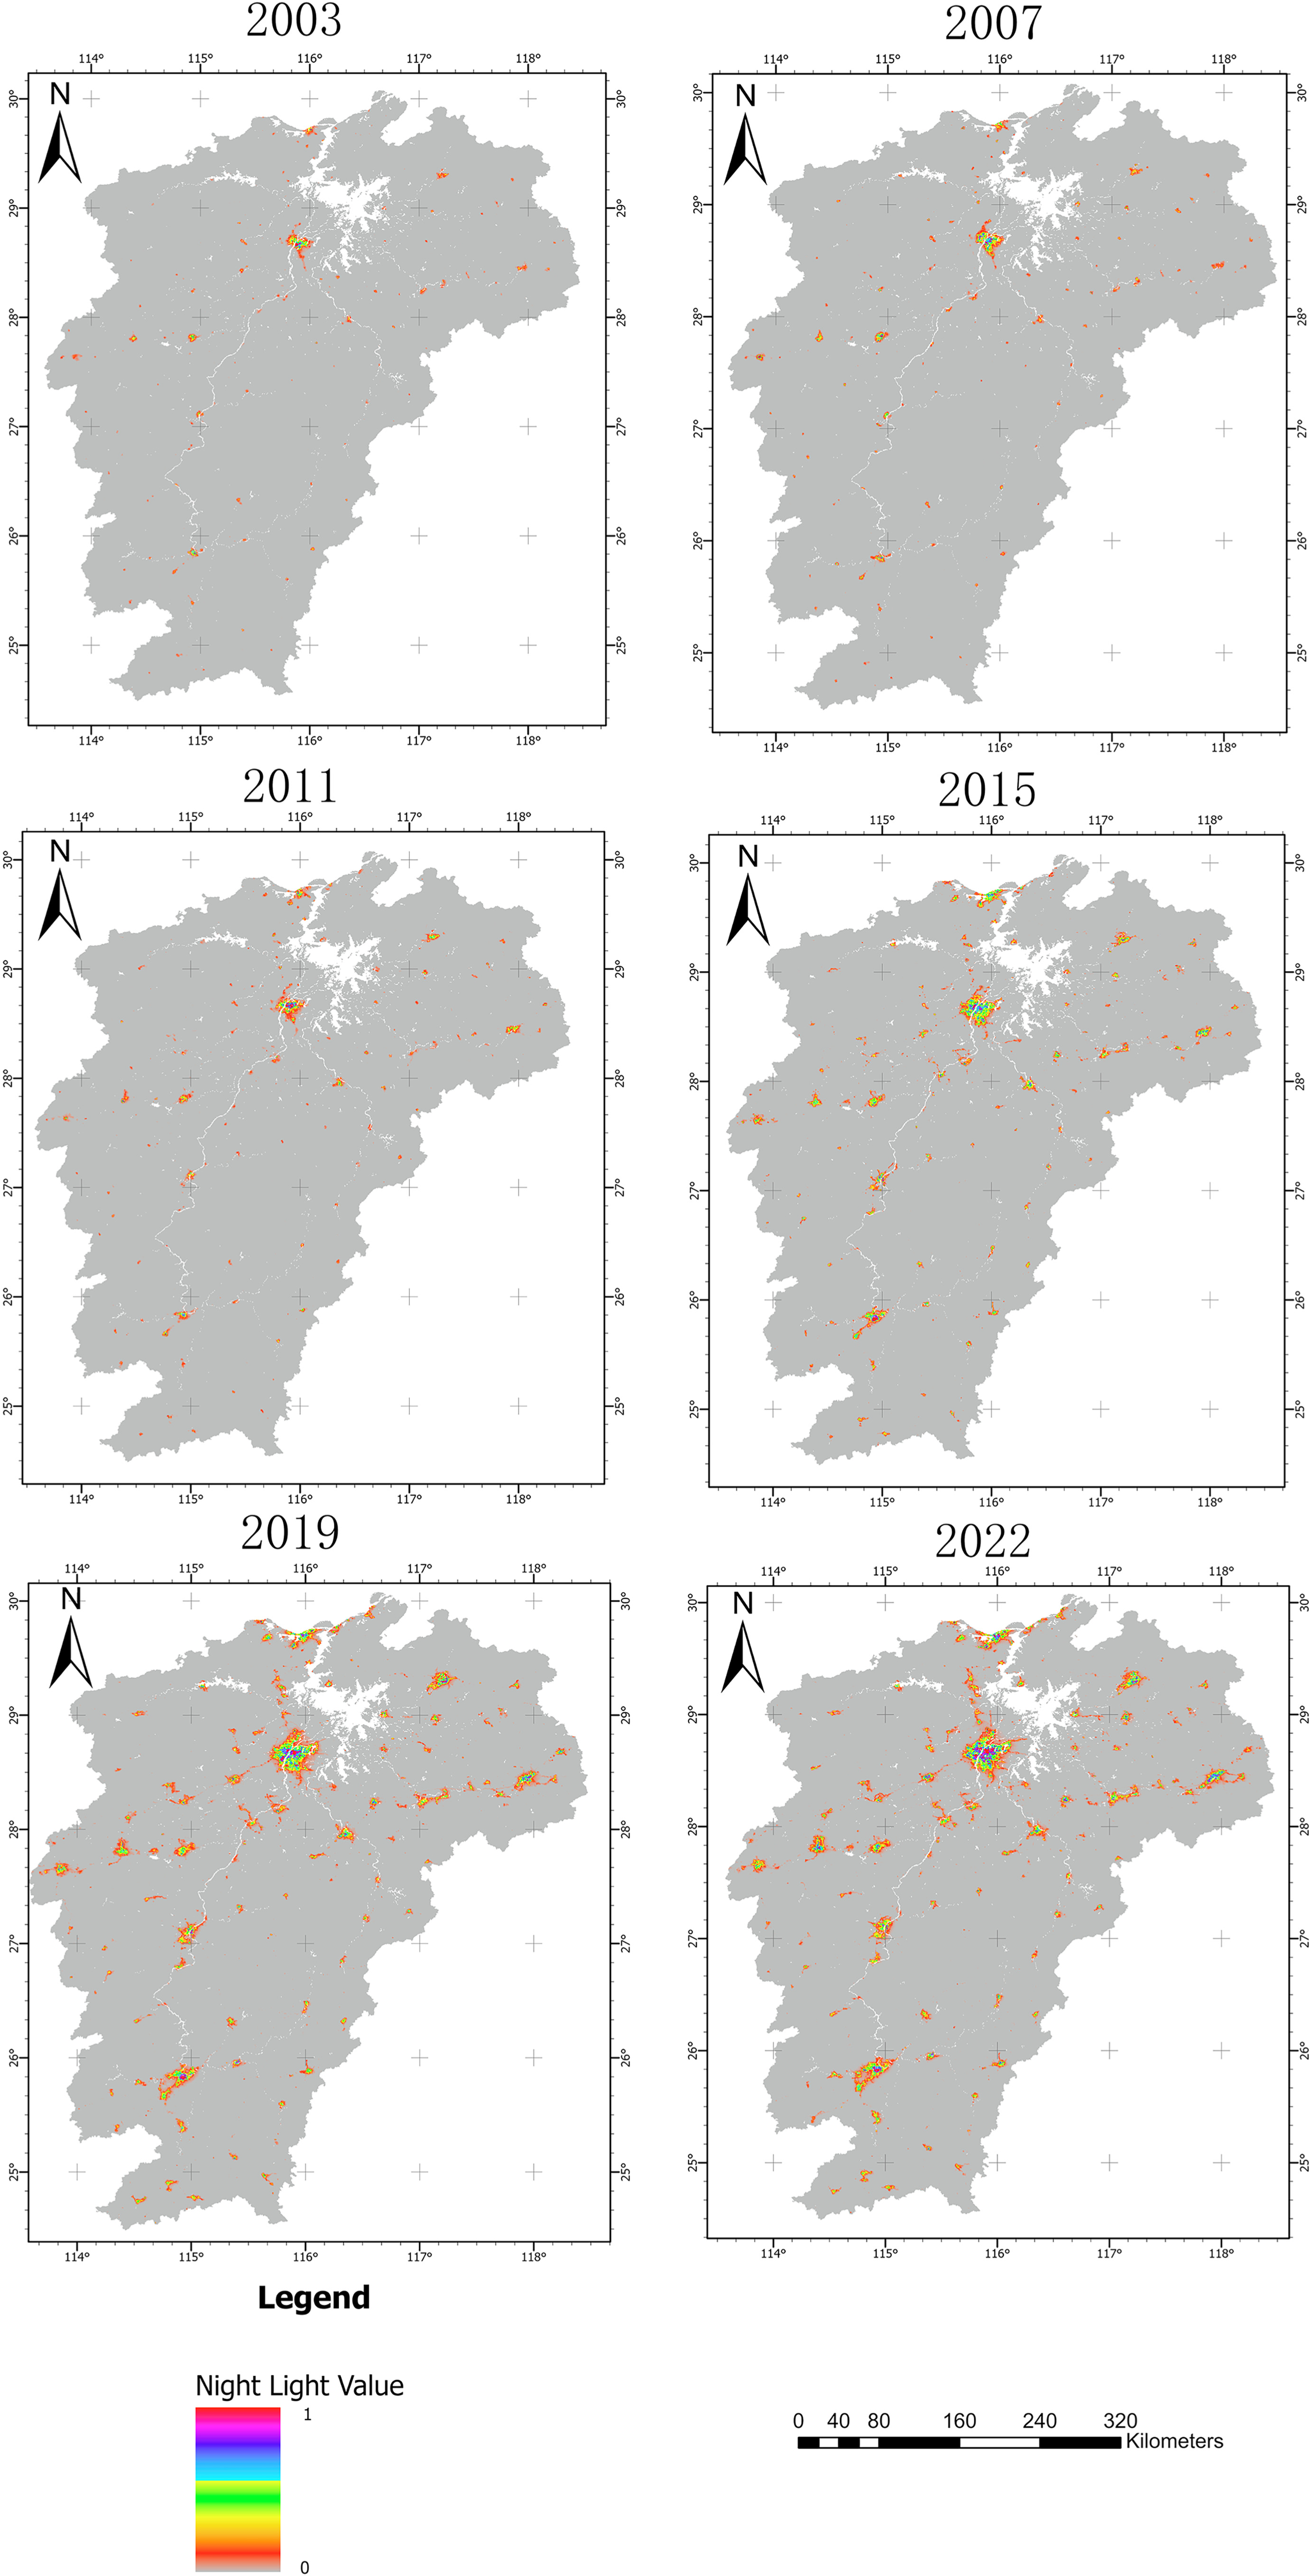
Afterward, the image data can be homogenized, as in Eq. (2), to be able to observe better the changes and developments in the region, the results of which are shown in Fig. 2:
(2)
GDP and Population
GDP serves as the cornerstone in national economic accounting and plays a pivotal role as an indicator reflecting the economic status and social development of a country or region. The GDP level of a specific developed country or region, as a primary indicator system of national economic development, can be a good measure of the employment capacity of the people in that developed country or region.
The GDP and population data for this experiment were obtained from the platform of the National Bureau of Statistics of China (NBSC) (stats.gov.cn), selecting the data of Jiangxi Province region from 2003 to 2022, and exporting and saving the data in the format of Excel. In addition, it is necessary to obtain data on the administrative divisions of Jiangxi Province.
Methodology
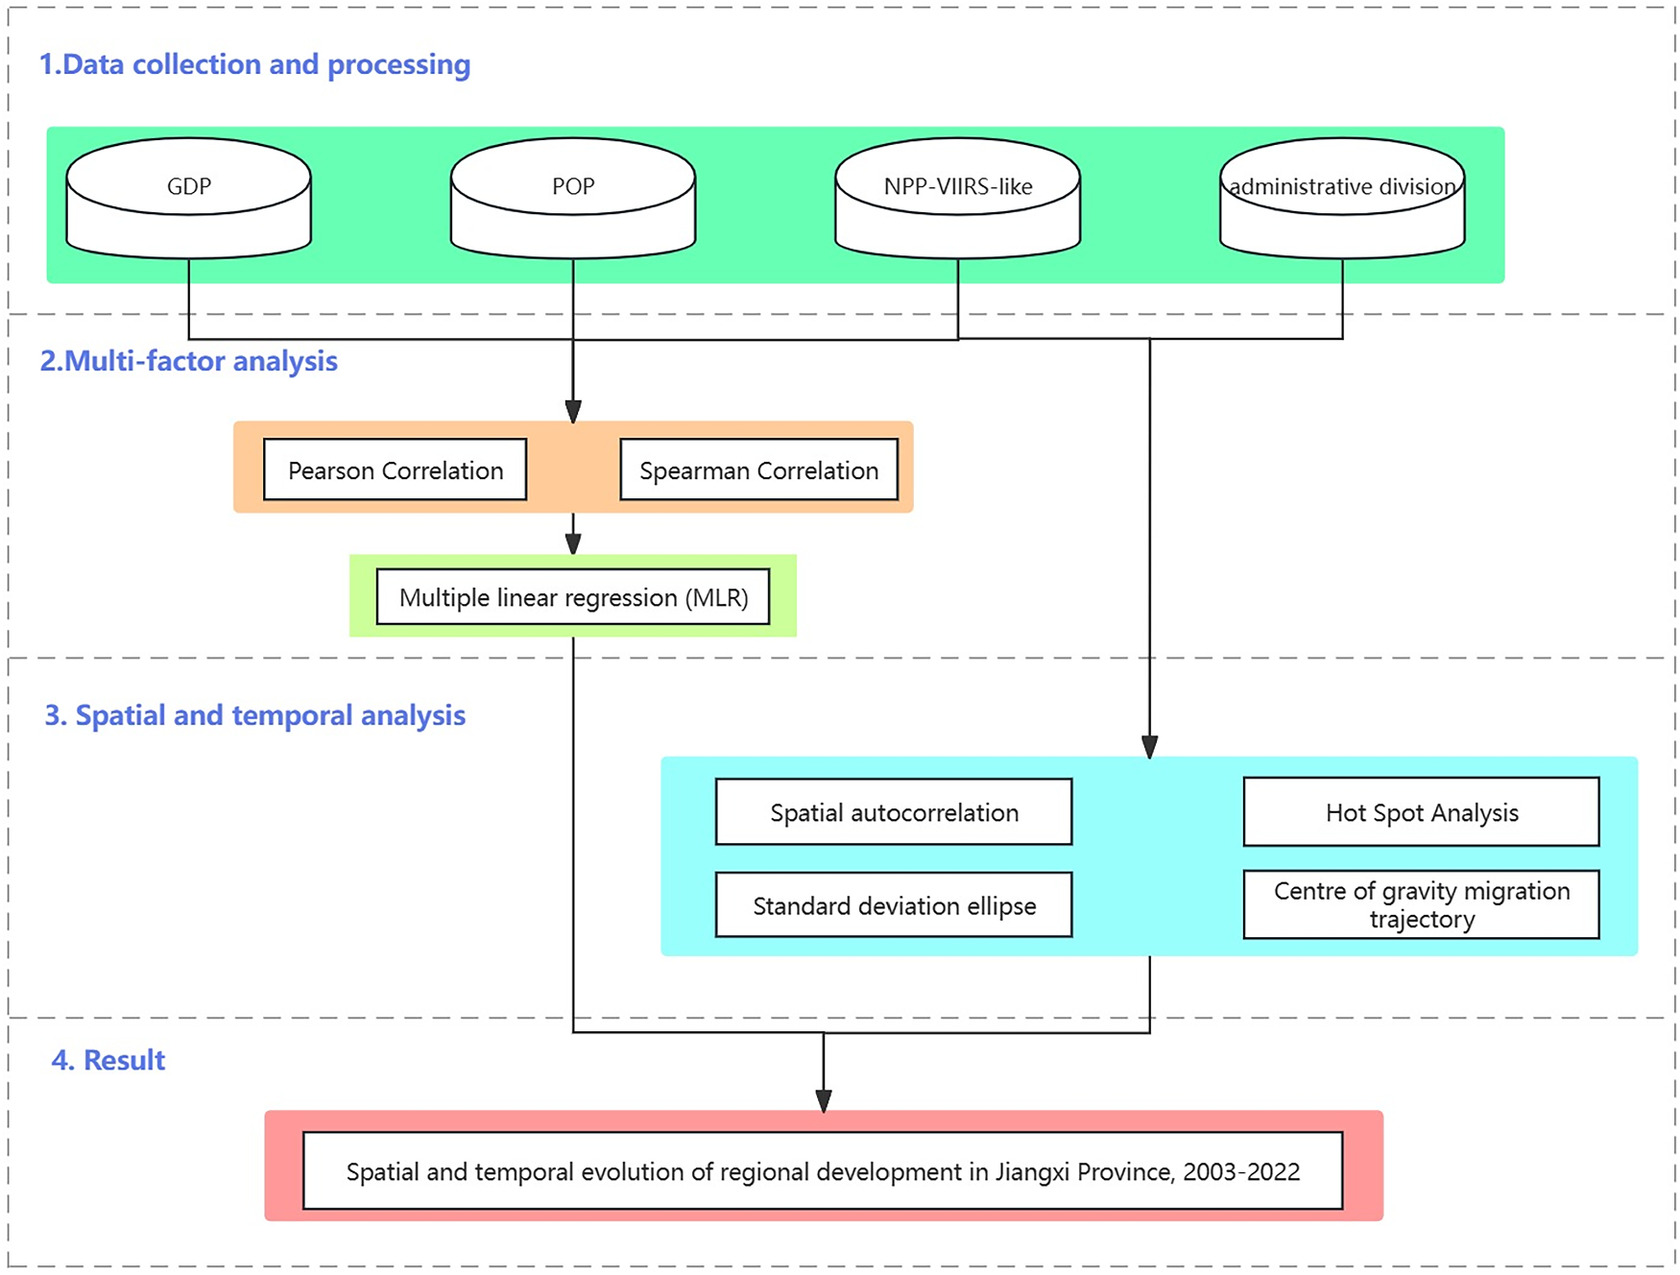
The workflow of this research is shown in Fig. 3. The first part is the collection and processing of data for each factor. The second part explores the relationship between nighttime lighting data and social and economic factors. The third part is a study of the spatiotemporal evolutionary characteristics of regional development in Jiangxi Province on a county-by-county basis. Finally, the aforementioned studies are summarized to derive the spatiotemporal evolution of regional development in Jiangxi Province from 2003 to 2022 and the feasibility of using the NPP-VIIRS-like nighttime lighting data as an indicator of regional development.
Correlation Analysis of Variables
Correlation analysis is a method used to describe the strength of the correlation between variables and to measure the relationship between quantitative data. The direction of correlation (positive/negative) is determined, and the magnitude of the correlation coefficient is calculated. The correlation coefficient, ranging from [−1, +1], is instrumental in determining the strength and direction of a correlation. The sign of the coefficient (positive or negative) indicates the direction, while the absolute value of the coefficient falls into specific ranges. A correlation coefficient in the range of [0.8–1] denotes a robust correlation, [0.6–0.8] signifies a strong correlation, [0.4–0.6] suggests a medium correlation, [0.2–0.4] indicates a weak correlation, and [0–0.2] implies a very weak correlation or no correlation at all. For this reason, the correlation between NTL and GDP and population (POP) is measured.
Pearson Correlation
The Pearson correlation coefficient, denoted by R, measures the degree of linear association between random variables. This correlation coefficient is defined as the quotient of the product of the covariance and the standard deviation between two variables. This method is calculated based on the linear relationship between the variables, as in the following equation:
(3)
The Pearson correlation coefficient R can be obtained by estimating the covariance and standard deviation of the sample, as in the following equation:
(4)
Spearman Correlation
Spearman correlation coefficient, also known as Spearman's rank correlation coefficient, is a type of rank correlation coefficient. It is calculated based on the position of the variable within the data. In contrast to the Pearson correlation coefficient, there are no limitations, such as the normal distribution of the sample, and it is not affected by outliers. The coefficient applies to nonlinear relationships between variables, i.e., monotonic relationships, as in the following equation:where R(x) and R(y) = rank of x and y, respectively; and and = average rank of x and y, respectively.
(5)
Multivariable Linear Regression Model
Multiple regression analysis uses regression equations to quantitatively portray the linear correlation between dependent and multiple independent variables. The basic idea of regression analysis is to find mathematical expressions between independent and dependent variables that did not initially have a strict, defined functional relationship. To be able to achieve a higher degree of explanation in a parsimonious model, it is essential to focus not only on the fit (R2) and significance of the model but also to calculate the covariance between samples (VIF), the independence of errors (Durbin–Watson), and the analysis of residual plots. From 2003 to 2022, the functional relationship between NTL, GDP, and POP can be derived from the total value of NTL, GDP, and POP in the Jiangxi Province region.
The equation is a binary linear regression equation because two independent variables are introduced:where the parameters β0, β1, β2 = coefficients to be determined; and μi = random variables.
(6)
Spatial Autocorrelation Analysis and Hotspot Analysis
Spatial Autocorrelation Analysis
Spatial autocorrelation is a spatial distribution feature that reveals the presence of spatial data. It is usually divided into global spatial autocorrelation and local spatial autocorrelation. Because the spatial autocorrelation model can observe whether there are spatial aggregation features in the regional development of Jiangxi Province, the global Moran index is used to judge and measure the spatial autocorrelation and whether there is spatial aggregation, respectively.
The Global Moran Index is as follows:where N = number of counties studied in this paper; Di and Dj = observed values of the target attribute features on the study objects i and j; and wi,j = spatial weight. Moran's I index is in the range of [−1, 1], Moran's I > 0 indicates a positive spatial correlation, Moran's I < 0 indicates negative spatial correlation, and Moran's I = 0 indicates uncorrelated data, presenting a random distribution.
(7)
Hotspot Analysis
The Getis-OrdGi* statistic identifies the spatial distribution characteristics of spatial high-value aggregations (i.e., hotspots) and spatial low-value aggregations (i.e., cold spots) in a certain spatial region, as in the following equation:wherewhere the attribute value of element j, denoted as xj, represents the total amount of regional lighting data. Meanwhile, wij corresponds to the spatial weight between elements i and j, and n signifies the total number of elements.
(8)
The statistic for the calculated elements is the Z score, so no next calculation is needed. For a positively significant Z-score, a higher score indicates a closer clustering of higher values. The reverse is also true. Based on the Z-scores, hot and cold spots with different significance levels can be identified with confidence intervals of 99%, 95%, and 90%.
Standard Deviation Ellipse and Center of Gravity Migration Trajectory
The standard deviation ellipse measures the trend of a set of data or regions. In this paper, the standard deviation ellipse and the center of gravity migration trajectory are mainly used to describe the spatial distribution characteristics between counties within the region of Jiangxi Province and to understand the trend of its center of gravity displacement, as in the following equations:where G(X, Y) = coordinates of the center of gravity of the regional development in Jiangxi Province; n = number of county-level regions; and = coordinate deviation of the study object to the center, respectively; ∂x and ∂y = standard deviation along the x-axis and the y-axis, respectively; xi and yi = spatial regions of the distribution; wi = weight; and θ = azimuthal angle of the standard deviation ellipse.
(9)
(10)
(11)
(12)
Results
Analyzing Correlation and Multiple Linear Regression of Variables
Correlation
The TNTL data of Jiangxi Province from 2003 to 2022 is made a scatter plot with the GDP data, as shown in Fig. 4, showing a linear distribution, i.e. Pearson correlation is used to measure the correlation between the two variables. Subsequently, TNTL data and population data are made a scatter plot, as shown in Fig. 5, which is not linear but presents some monotonicity, i.e., Spearman correlation is used to measure the correlation between the two of them. The results of the calculated correlation coefficients are shown in Figs. 6 and 7.
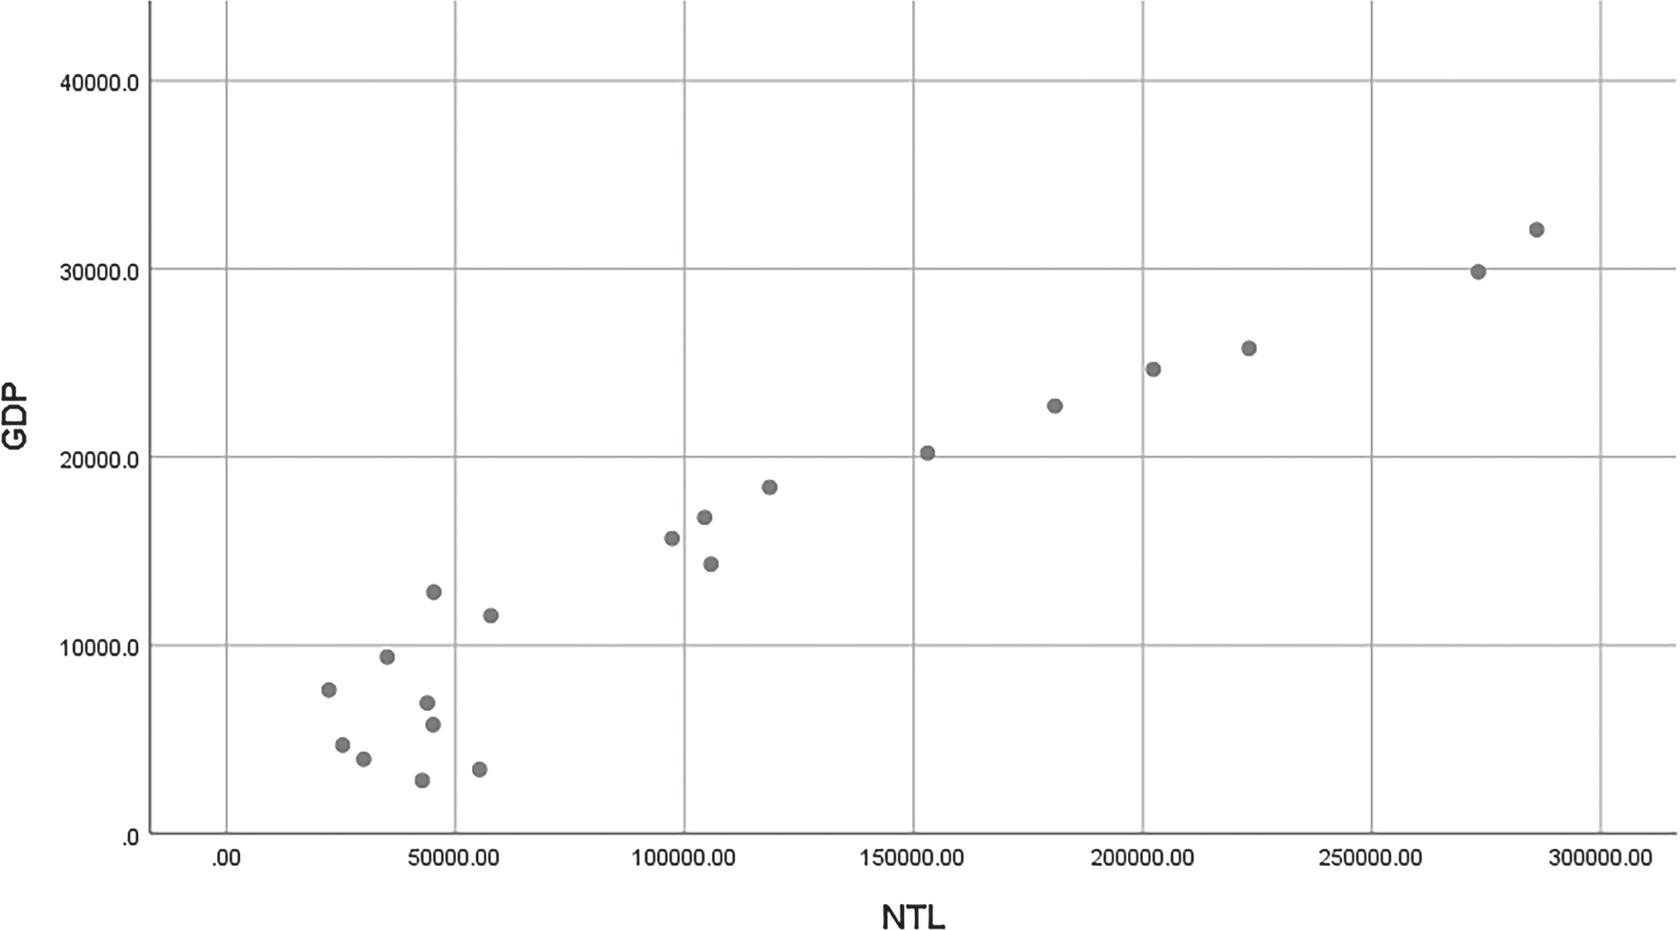
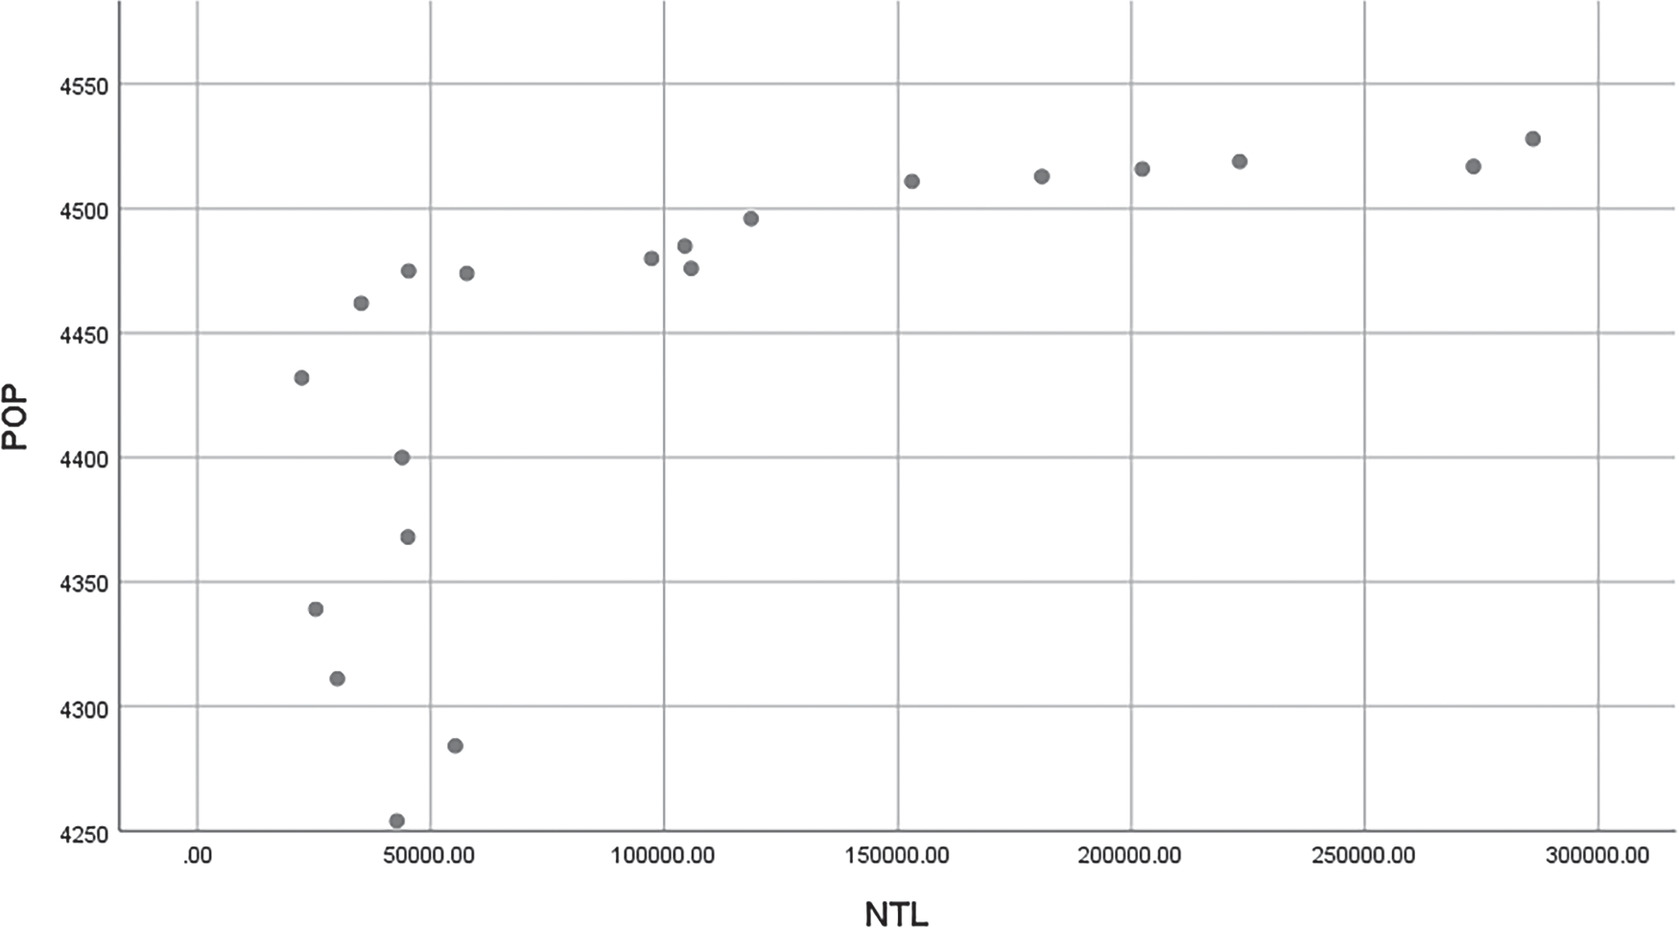
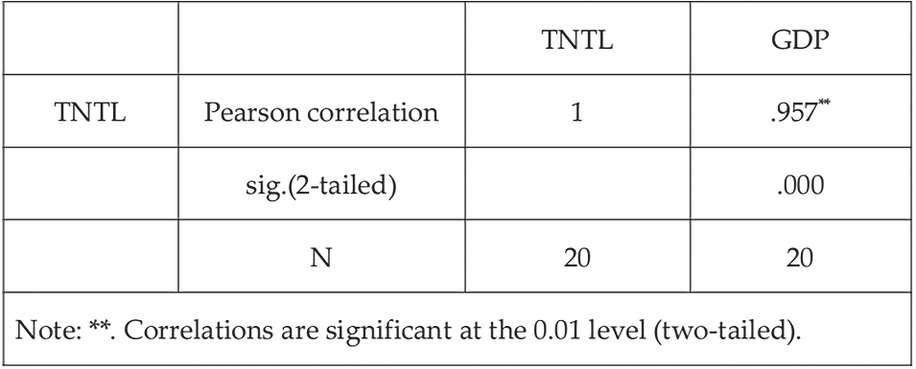
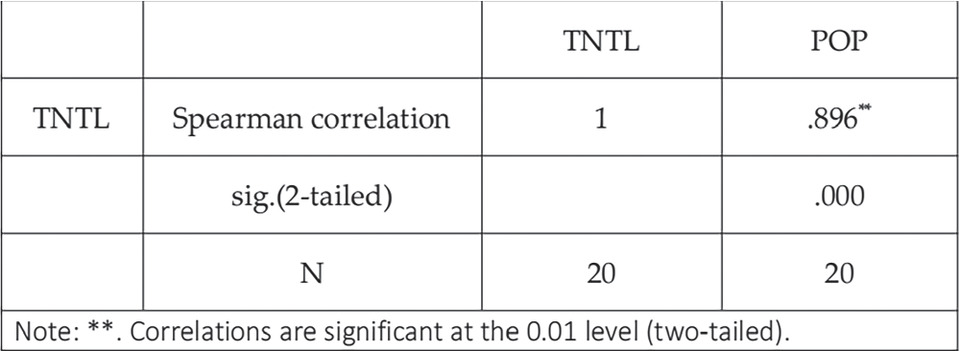
It can be seen that NTL data has a correlation coefficient of 0.957 with GDP data, which has a robust positive correlation and is statistically significant at the P < 0.01 level of significance. Meanwhile, the correlation coefficient between NTL data and POP data is 0.896, which also has a powerful positive correlation and is significant at the P < 0.01 level, which is statistically significant. It proves the strong positive correlation of TNTL data for GDP and POP data in Jiangxi Province, which can also indirectly illustrate the continuity of TNTL data over the period 2003–2022.
Multiple Linear Regression
After examining the correlation between the variables, there is a prerequisite for examining the regression analysis. There is a correlation between the data, but there is also not necessarily a regression impact relationship. In order to measure the role of these two important factors of regional development (GDP and POP) in influencing nighttime lighting, we performed multiple linear regressions (MLRs) on these three variables.
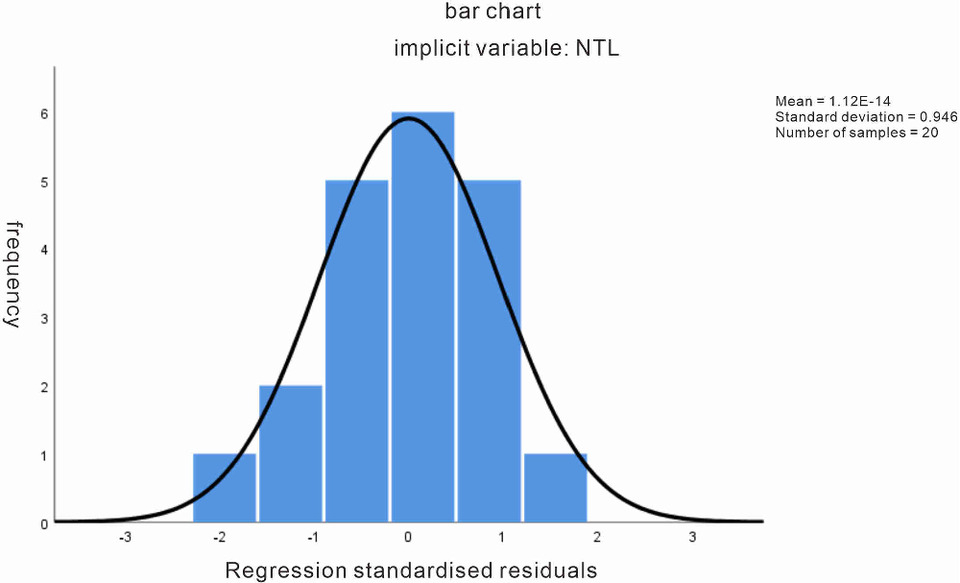
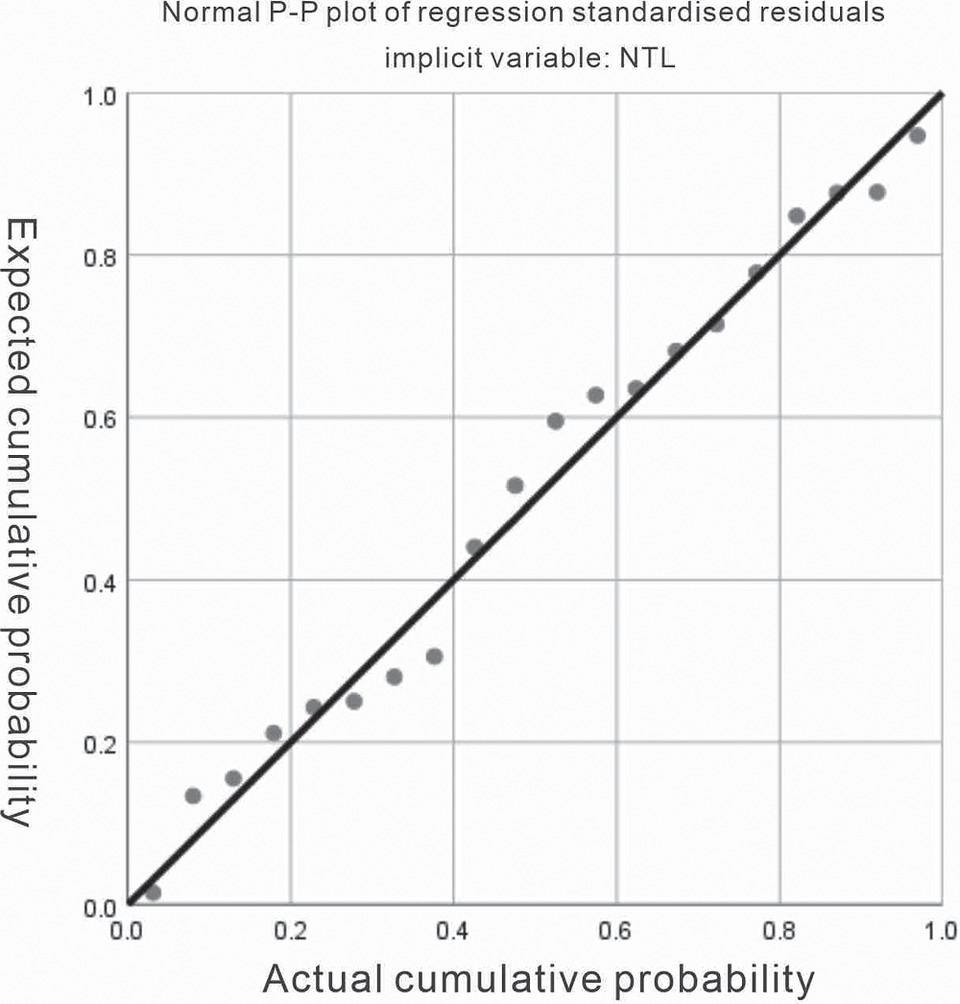
The results show that the regression equation of this experiment is significant, F = 554.762, P < 0.001. The linear regression model of NPP-VIIRS-like NTL data with GDP and POP data in Jiangxi Province is exceptionally well fitted. The adjusted R2 = 0.983, i.e., it shows that the GDP and POP data can explain 98.3% of the variation in NTL. The result of the Durbin–Watson test is 2.473, which is within the range of 1.5–2.5, which is consistent with the independence between the data. The result of VIF is 3.763, which is less than 10, and the multiple covariance of independent variables needs to be more serious. The histogram of residuals obeys normal distribution with a standard deviation of 0.946, as shown in Fig. 8; the residual P–P plots are all fitted, as shown in Fig. 9. It can be seen that the regression model was successfully established.
The equation is derived as in Eq. (13):
(13)
From this, it can be seen that the NPP-VIIRS-like TNTL data can be well explained by the GDP and POP data, that is to say, TNTL can replace the GDP and POP data as a good alternative data for the development of the study area.
Characteristics of the Spatial Distribution of Regions in Jiangxi Province
Global Spatial Autocorrelation Features
The total value index of nighttime lighting in each county was counted according to the administrative boundaries, and global Moran's I was applied to study the spatial distribution characteristics of NTL data, which can reveal the interrelationships and spatial aggregation degree of nighttime lighting among regions in Jiangxi Province, as presented in Table 1. After calculation, global Moran's I of nighttime lighting in the counties shows a significant positive correlation level (P < 0.01), but it can be seen that Moran's I is gradually decreasing but relatively stable, and it has been in the range of 0.2–0.4.
| Year | Moran's I | P-value |
|---|---|---|
| 2003 | 0.373 | <0.01 |
| 2007 | 0.325 | <0.01 |
| 2011 | 0.320 | <0.01 |
| 2015 | 0.210 | <0.01 |
| 2019 | 0.231 | <0.01 |
| 2022 | 0.211 | <0.01 |
According to global Moran's I of the counties, the spatial autocorrelation of the counties in Jiangxi Province is gradually weakening, indicating that the spatial heterogeneity among the counties is gradually increasing. The spatial aggregation of the region's development has weakened over time, but its spatial autocorrelation is also relatively stable in terms of the declining index.
Characteristics of Local Spatial Distribution
The Getis-Ord Gi* index is used to analyze areas where spatial clustering of high- or low-value characteristics of the level of regional development occurs in counties. Hotspot analysis is used to speculate on the hot and cold spots of regional development. The hotspot analysis mapping was obtained using Arc GIS Pro based on the total value of nighttime lights in each county in 2003, 2007, 2011, 2015, 2019, and 2022.
According to Fig. 10, it can be seen that the hotspots derived from the data of each county from 2003 to 2022 are continuously distributed in Nanchang city district and the counties belonging to it, and that Nanchang is the capital city and financial center of Jiangxi province is in line with the basic facts. According to the overall development, the regional development trend is dominated by Nanchang and supplemented by the development of the Ganzhou city district. In these 20 years, the hotspots other than Nanchang have changed less, basically focusing on the urban area of Ganzhou. In 2003, the Ganxian District of Ganzhou city was in the 90% confidence interval hotspot, and Yongxiu County of Jiujiang city was in the 95% confidence interval hotspot.
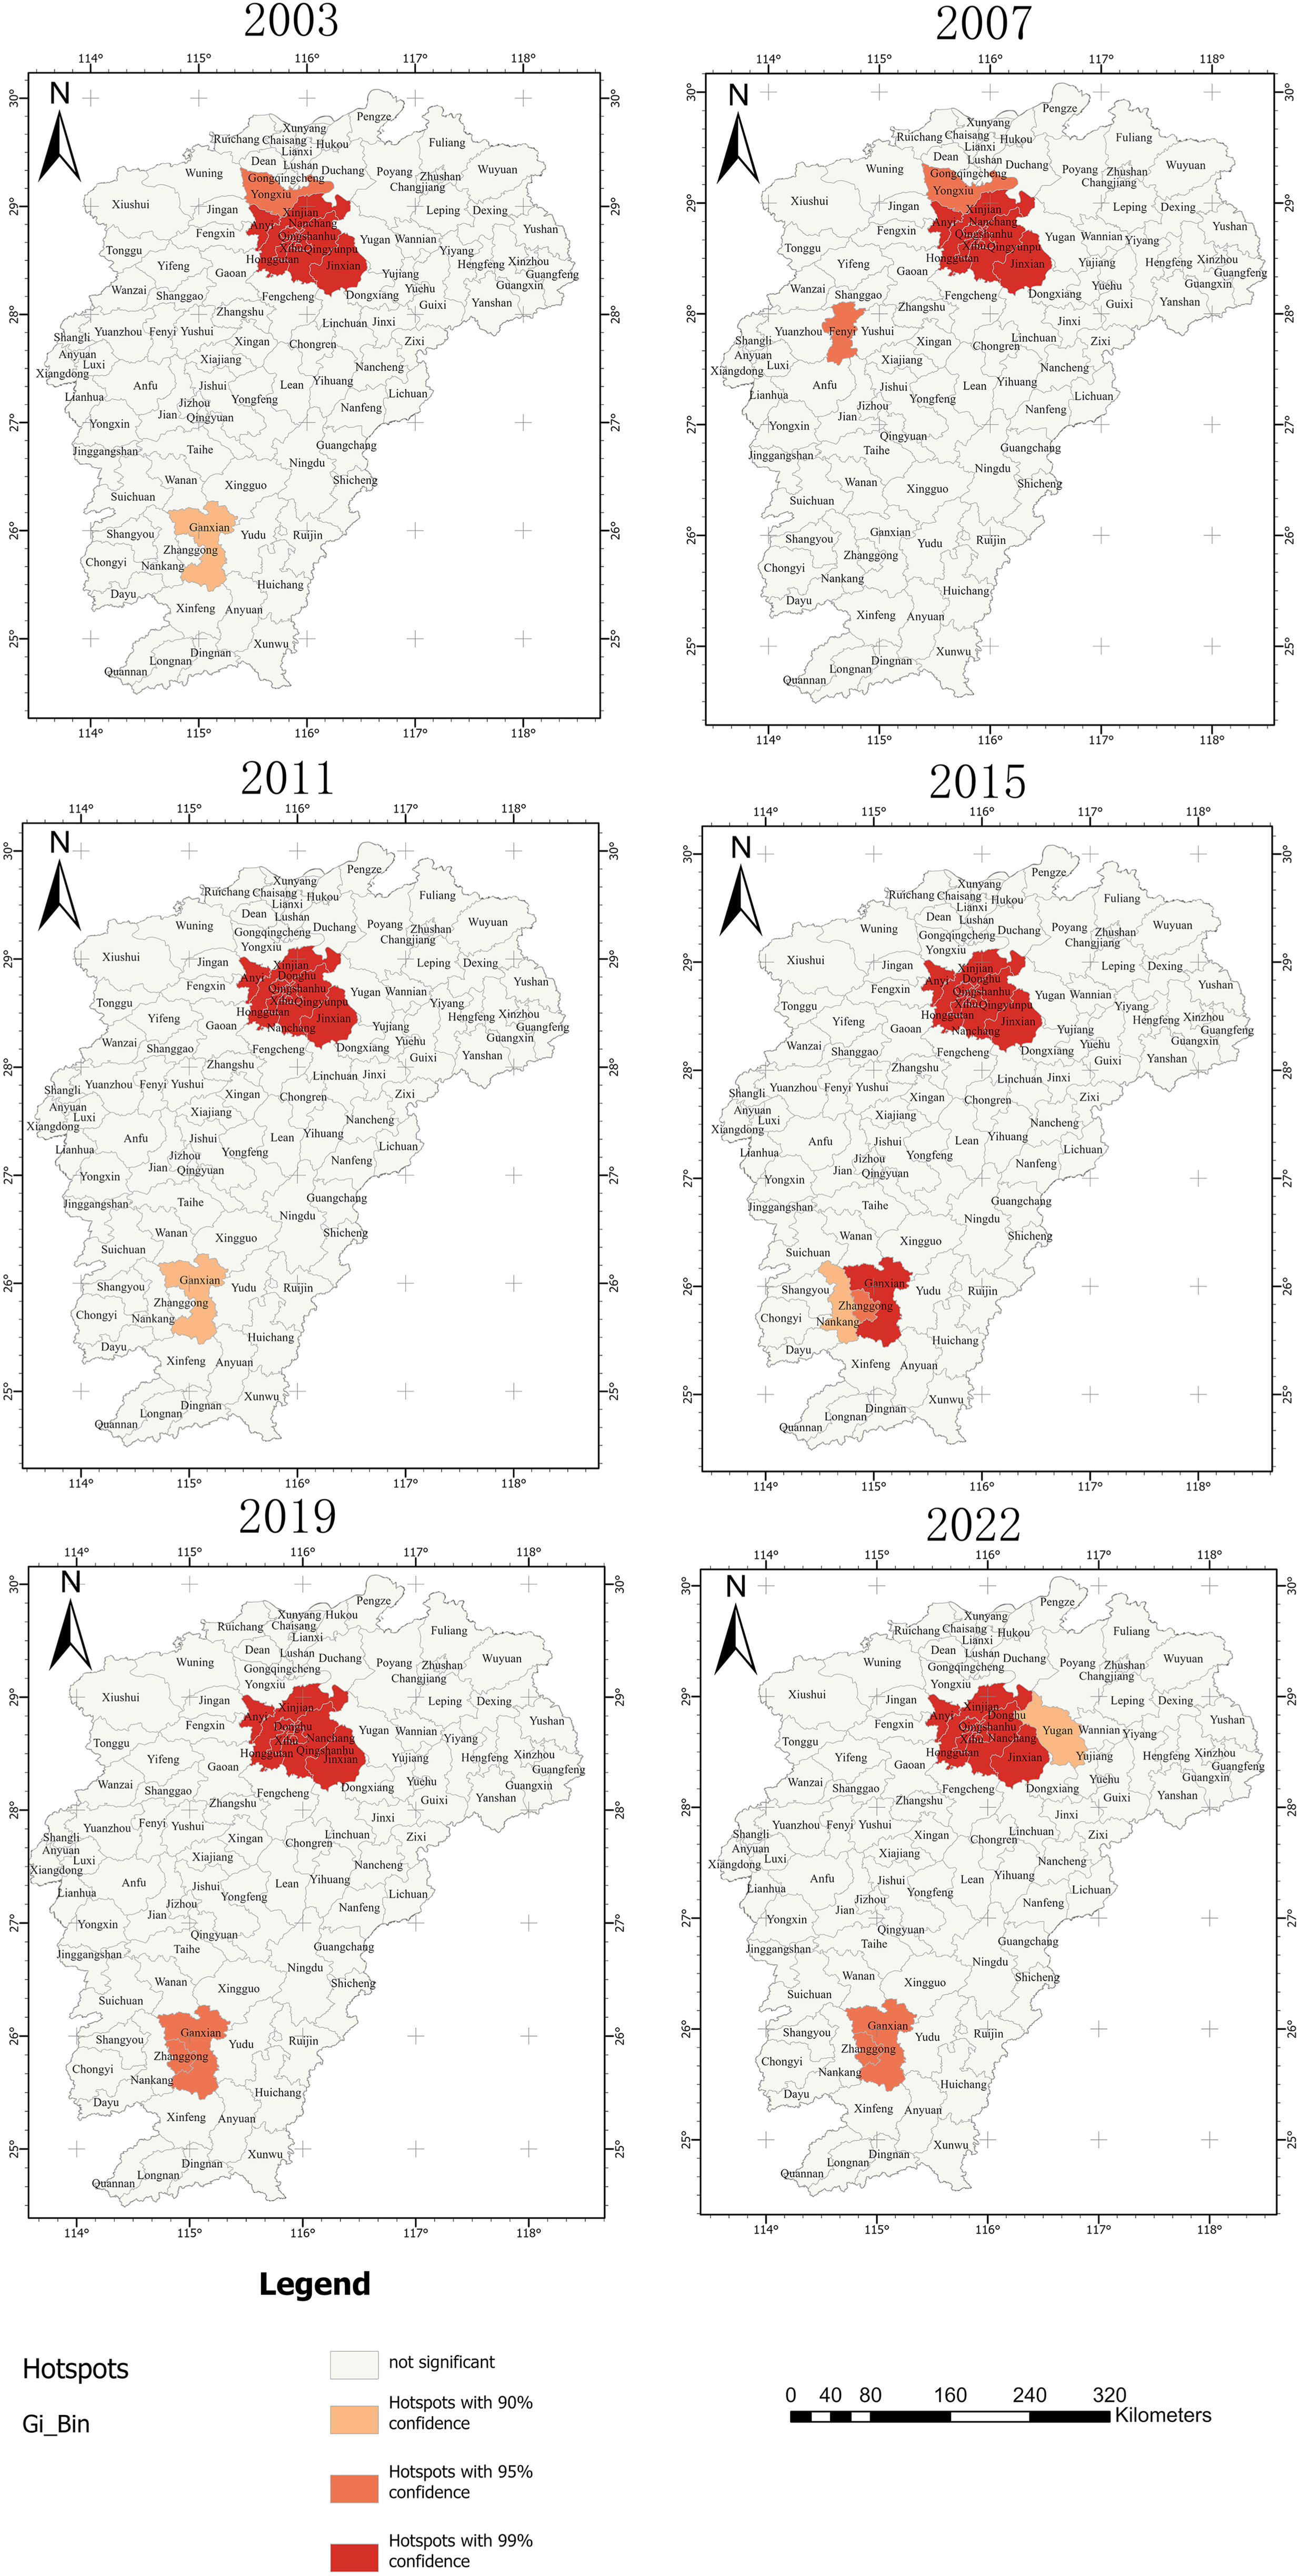
Fig. 10. Lighting index score hotspot analysis 2003–2022.
[Map data from Tianditu (www.tianditu.gov.cn).]
In 2007, the hotspot area was added to the hotspot of Xinyu city's Fenyi County, which is at the 95% confidence interval, because of the rapid industrial development during this period, and which was rated as the “province's comprehensive advanced county for economic development” for two consecutive years in 2005 and 2006, and among the province's “six advanced counties” under the “assessment system” in 2007, leading to the development of the surrounding areas, showing a trend of high-value aggregation. In 2007, it was rated as an advanced county in the province's “six evaluation systems,” which led to the development of the surrounding areas and showed a trend of high-value aggregation. After 2007, the reason why the region ceased to be a hotspot can be attributed to the change in its economic development trend. Specifically, according to the 2011 China Statistical Information Network (cnstats.org) Statistical Bulletin on the National Economic and Social Development of the Region, the development of the region and its surrounding areas belonged to the stage of “stable and sustained development” and did not show the phenomenon of high-value aggregation. By contrast, the 2007 bulletin describes a significant increase and new breakthroughs. The year-on-year growth rate of industrial development fell by more than 10%. Since then, development in and around Fenyi County has remained stable and therefore it does not appear on subsequent maps of regional hotspots in Jiangxi Province. This change can be interpreted as a result of adjustments in the region's economic development pattern as well as in the economic structure of the region as a whole. Although the development trend of the region is stable, it does not show the effect of high-value aggregation on a global scale, so the visualization effect on the hotspot map is weakened accordingly.
In 2015, the hotspot of the Ganzhou region gradually became significant, and the Ganzhou region was positioned as the vice-center city of Jiangxi province from 2012. Its hotspot degree declined in 2019–2022 owing to the impact of the epidemic. Its development gradually presents the development trend of two centers in the north and south, which is in line with the development trend of the policy and promotes the economic development and social development of the Jiangxi Province.
Standard Deviation Elliptic Analysis with the Center of Gravity Migration Trajectories
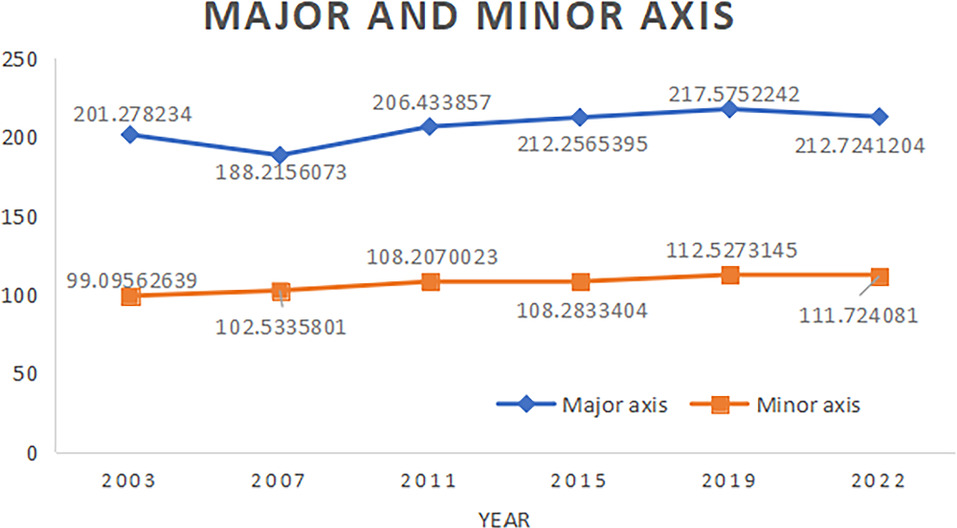
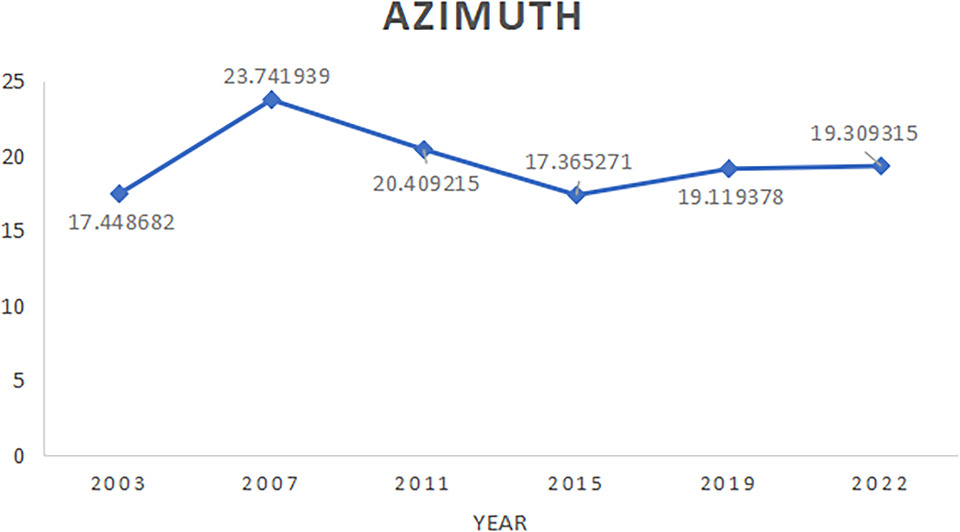
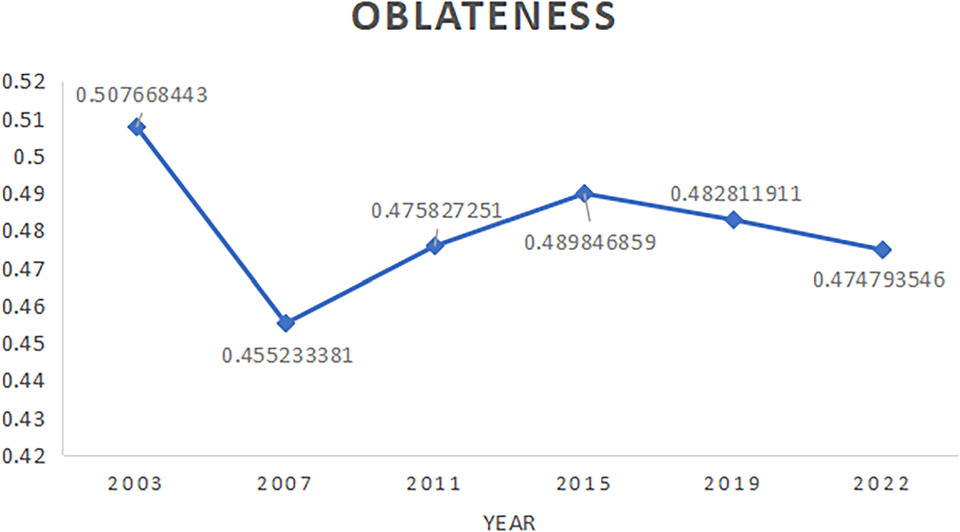
The standard deviation level is used to express the standard deviation ellipse included in the center of mass of 68% of the indicator elements to understand the spatiotemporal characteristics of regional development. As shown in Fig. 11, based on the weighted standard deviation ellipse, it is possible to derive the spatiotemporal evolution of the characteristics of regional development in Jiangxi Province from 2003 to 2022. The distribution direction of the standard deviation ellipse shows a northeast–southwest direction, which is administratively close to the administrative division of Jiangxi Province. Changes in the long and short axes were as shown in Fig. 12, the long axis in 2003–2011 appeared to decrease and then increase, indicating that the scope of regional development in Jiangxi Province in the direction of the longitudinal axis appeared to be in a short period of narrowing and then recovered; azimuthal changes were as shown in Fig. 13, the standard deviation ellipse of the azimuthal angle of the 17° increased to 23° after a gradual decrease in the convergence of a stable 19°; the ellipse flattening changes were as shown in Fig. 14, elliptic flatness decreases, then the closer the ellipse is to a circle, the better the balanced development of the region. The coordinates of the center of gravity and the trajectory parameters of the center of gravity migration are provided in Table 2. The migration of the center of gravity changed a lot from 2003 to 2015, and the change gradually converged to stability from 2015 to 2022. It can be seen that the rapid development of the western part of Jiangxi Province in 2003–2007 also led to the azimuthal shift of the ellipse by 6°. However, after 2007, the southern part of Jiangxi Province developed rapidly, which made the center of gravity and the azimuth of the ellipse shift to the south. It can be seen that the regional development of Jiangxi Province in 2003–2007 underwent are large changes, but 2008–2022 tends to be stable, indicating that the direction of regional development is clear, and the overall direction and centripetal change of the economy is not significant.
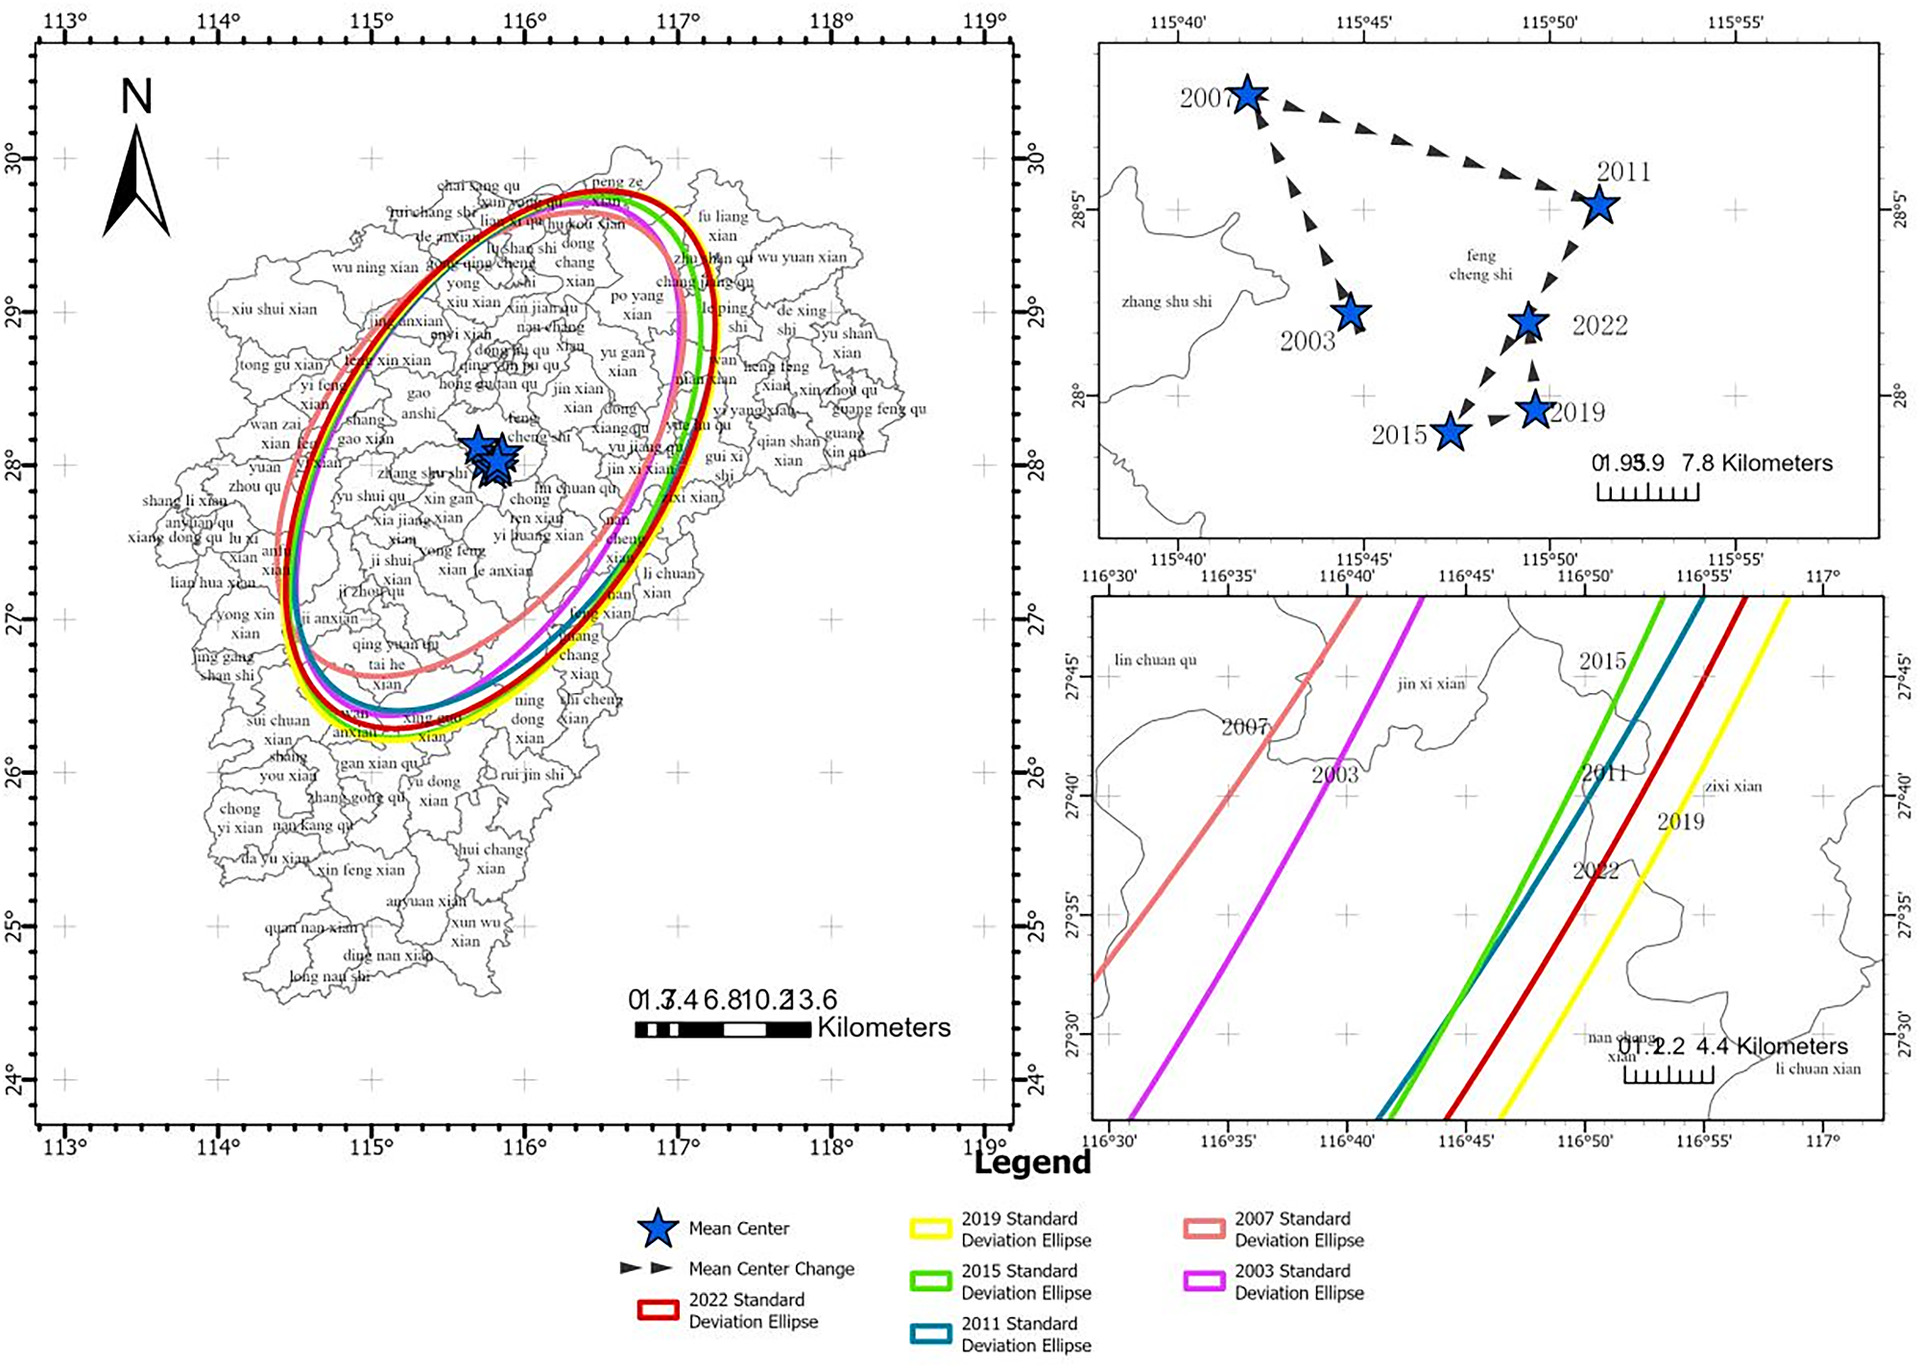
Fig. 11. Elliptic changes in the standard deviation of nighttime lighting and center of gravity migration trajectory in Jiangxi Province (2003–2022).
[Map data from Tianditu (www.tianditu.gov.cn).]
| Year | Barycentric coordinates | Center of gravity migration direction | ||
|---|---|---|---|---|
| Longitude (E) | Latitude (N) | Direction | Distance (km) | |
| 2003 | 115°44′39″ | 28°2′16″ | — | — |
| 2007 | 115°41′52″ | 28°8′7 | Northwest | 11.73 |
| 2011 | 115°51′20″ | 28°5′9″ | Southeast | 16.44 |
| 2015 | 115°47′20″ | 27°59′3″ | Southwest | 13.05 |
| 2019 | 115°49′37″ | 27°59′39″ | Northeast | 3.91 |
| 2022 | 115°49′26″ | 28°2′ | Northwest | 4.36 |
Discussion
As a dynamic indicator reflecting the intensity of human activities, nighttime lighting data finds diverse applications in social and economic research. Li et al. and Chen et al. used two types of NTL data, DMSP/OLS and NPP/VIIRS, to conduct long time-series regional analyses of the study area (Chen Jizhen and Liang 2022; Elvidge et al. 1999; Li et al. 2022). Unlike this experiment, NPP-VIIRS-like NTL data were used, and VIIRS significantly improves the accuracy of population and economic activity estimation in developing countries compared to OLS (Bennett and Smith 2017). Elvidge et al. (2012) also compared the two sensors for nighttime light data depicting that VIIRS outperforms DMSP. This not only solves the problem in the data from different sensors, but also continues the temporal nature of the nighttime lighting data, and has similar data quality to NPP-VIIRS.
Feasibility of NPP-VIIRS-Like NTL Data as a Regional Development Indicator
First, the correlation between NPP-VIIRS-like NTL and GDP and POP of the same year from 2003 to 2022 and the continuity of the data in time series were analyzed. According to the correlation coefficient, a strong positive correlation was found between NTL and GDP, with a correlation coefficient as high as 0.957. This implies that nighttime lighting primarily reflects the level of economic activity in Jiangxi Province and is strongly correlated with the trend of GDP growth. In addition, there is also a strong positive correlation between NTL and POP, with a correlation coefficient of 0.896. This suggests that nighttime lighting can, to some extent, reflect the population density and urbanization level, i.e., there is a strong link between the brightness of nighttime lighting and the population size. This finding highlights the potential use of nighttime lighting data in the study of population distribution and urban development. Further, through regression analysis, GDP and POP data were able to explain 98.6% of the variation in NTL data, i.e., they can be used as a proxy indicator for assessing and predicting the development status of a region without the need to rely on traditional GDP and population statistics.
Use of NPP-VIIRS-Like NTL Data
Based on the expansion or contraction of NTL data, the expansion or contraction of urbanization of an area can be easily identified, which has a significant effect on observing the sustainable urbanization process. In the spatial and temporal light growth map, the light areas in each county in Jiangxi Province are expanding year by year from 2003 to 2022, but the expansion speed of each node is also fast and slow. This reflects the development of each region in the temporal sequence. In this regard, NTL is used as an indicator to propose management policies that address the differences in urbanization development in different regions. For example, in regions with faster urbanization, land-use planning and resource allocation can be strengthened to promote sustainable development; in regions with slower urbanization, infrastructure construction and industrial layout can be promoted to boost economic growth. In addition, by analyzing the changing trends in nighttime lighting in different regions, potential directions of urban expansion and development hotspots can be identified, providing guidance for future urban development and helping decision makers to formulate more precise and effective regional planning and management policies.
Directions for Further Research
Although this study demonstrates the potential of NTL in regional development analysis, many further research directions can be explored. Future research could expand the scope of regression analyses to consider more factors, such as education level and infrastructure, to enhance our understanding of the relationship between NTL and regional development. In addition, NTL data can be applied to other regions to verify their applicability in different contexts. The drivers of regional development in Jiangxi Province can also be further explored, as well as how nighttime lighting data can be used to predict economic growth and demographic changes. Consideration could also be given to incorporating other factors (e.g., transport and education) into the analyses to gain a more comprehensive understanding of the complexity of regional development. These in-depth studies will help to better utilize NTL data to parse the complexity of regional development and provide more useful information to governments and policymakers.
Conclusion
1.
Through in-depth analysis of the NPP-VIIRS-like nighttime lighting data from 2003 to 2022 in Jiangxi Province, the study shows that this data source exhibits a significant positive correlation with regional GDP and population data. The correlation coefficients, R2, are 0.957 and 0.896, respectively, showing that nighttime lighting data can be used as a valid indicator of regional economic activity and population distribution. The multivariate linear regression further verifies the good explanatory ability of NPP-VIIRS-like nighttime lighting data for regional development in Jiangxi Province, and the adjusted R2 reaches 0.983, i.e., it shows that the GDP and POP data can explain 98.3% of the variance of NTL.
2.
As a whole, the global spatial autocorrelation index is used to dig out the positive correlation between the development of each county in Jiangxi Province; however, the value of the index shows a gradual downward trend, which indicates that the spatial heterogeneity is gradually increasing, and the trend of regional coordinated development is weakening. From a local point of view, through the visualization and analysis of the time-series map of light development, it can be noted that the light area of each county has expanded and changed. Through the hotspot analysis to study the situation of high-value aggregation in each county in Jiangxi Province, from a macroscopic point of view, the high-value aggregation area in Jiangxi Province is mainly dominated by Nanchang, supplemented by Ganzhou, presenting the development trend of two centers in the north and south. It is in line with the transport corridor built through various means of transport such as the Beijing–Kowloon Corridor, and also in line with the national policy of provincial capital cities and provincial subcenter cities.
3.
From the point of view of the spatial and temporal evolution of regional development in Jiangxi Province, the standard deviation ellipse direction is the northeast–southwest direction, and the administrative division of Jiangxi Province is administratively close. Now, during the period from 2003 to 2011, the direction of regional development in Jiangxi Province has changed a lot, and the azimuth of the ellipse and the long and short axes have also changed a lot. From 2003 to 2007, due to the rapid development of the northwestern part of Jiangxi Province during this period, there was a high-value gathering area in the region of Fenyi County, which made the movement of the center of gravity larger. From 2007 to 2011, there is faster development of the southeastern part of Jiangxi Province, and there is a high-value gathering area in the city of Ganzhou, which makes the movement of the center of gravity larger. From 2011 to 2022, the direction of regional development is more stable, and the change of center of gravity migration also tends to be stable. In addition, the change of the ellipse is relatively small, which indicates that the direction of regional development is clear in this period, and the overall direction and centripetal change of the economy is not significant.
Data Availability Statement
Some or all data, models, or codes generated or used during the study are available in a repository online in accordance with funder data retention policies. The NPP-VIIRS-like NTL data set is from the Harvard Dataverse platform (https://dataverse.harvard.edu/dataset.xhtml?persistentId=doi:10.7910/DVN/YGIVCD). The GDP and population data of this experiment were obtained from the platform of the National Bureau of Statistics of China (NBSC) (stats.gov.cn).The Map data are from “TIAN DI TU” (www.tianditu.gov.cn)
Acknowledgments
This research was funded by the National Natural Science Foundations of China (Nos. 41861052 and 42161060), Jiangxi Provincial Science, and Technology Plan Talent Project (No. 20232BCJ22002).
Author contributions: Xiaoye You: Conceptualization, Methodology, Software, Resources, Writing—Original Draft Preparation; Jianeng Fu: Validation, Formal Analysis, Writing—Review and Editing; Guanyu Tu: Formal Analysis; Penggen Cheng: Writing—Review and Editing, Supervision, Funding Acquisition.
References
Ao, Y., B. Wu, Z. Bai, and X. Wang. 2022. “Spatial and temporal dynamic characteristics of urban built-up areas in Guangdong–Hong Kong–Macao Greater Bay Area based on NPP-VIIRS-like night light data.” J. Earth Sci. Environ. 44 (3): 11.
Bennett, M. M., and L. C. Smith. 2017. “Advances in using multitemporal night-time lights satellite imagery to detect, estimate, and monitor socioeconomic dynamics.” Remote Sens. Environ. 192: 176–197. https://doi.org/10.1016/j.rse.2017.01.005.
Chen, H., Y. Xu, S. Zhong, Y. Mo, and S. Zhu. 2023. “Mapping nighttime PM2.5 concentrations in Nanjing, China based on NPP/VIIRS nighttime light data.” Atmos. Environ. 303: 119767. https://doi.org/10.1016/j.atmosenv.2023.119767.
Chen, H., X. Zhang, R. Wu, and T. Cai. 2020. “Revisiting the environmental Kuznets curve for city-level CO2 emissions: Based on corrected NPP-VIIRS nighttime light data in China.” J. Cleaner Prod. 268: 121575. https://doi.org/10.1016/j.jclepro.2020.121575.
Chen, Z., B. Yu, C. Yang, Y. Zhou, S. Yao, X. Qian, C. Wang, B. Wu, and J. Wu. 2021. “An extended time series (2000–2018) of global NPP-VIIRS-like nighttime light data from a cross-sensor calibration.” Earth Syst. Sci. Data 13(3): 889–906. https://doi.org/10.5194/essd-13-889-2021.
Chen J., J. Zhang, and X. Liang. 2022. “Spatial and temporal difference analysis of county relative poverty level in Shaanxi Province based on night light data.” Remote Sens. Technol. Appl. 37 (4): 908–918.
Du, W., R. Wang, W. Yu, X. Liu, Y. Zhang, and Y. Nian. 2024. “Gansu province urban expansion model based on the sequential night light data research.” Remote Sens. Technol. Appl. 39 (3): 659–668.
Elvidge, C. D., K. E. Baugh, S. J. Anderson, P. C. Sutton, and T. Ghosh. 2012. “The Night Light Development Index (NLDI): A spatially explicit measure of human development from satellite data.” Soc. Geogr. Discuss. 7 (1): 23–35. https://doi.org/10.5194/sg-7-23-2012.
Elvidge, C. D., K. E. Baugh, J. B. Dietz, T., Bland, P. C. Sutton, and H. W. Kroehl. 1999. “Radiance calibration of DMSP-OLS low-light imaging data of human settlements.” Remote Sens. Environ. 68 (1): 77–88. https://doi.org/10.1016/S0034-4257(98)00098-4.
Elvidge, C. D., K. E. Baugh, M. Zhizhin, and F.-C. Hsu. 2013. “Why VIIRS data are superior to DMSP for mapping nighttime lights.” Proc. Asia Pacific Adv. Netw. 35: 62. https://doi.org/10.7125/APAN.35.7.
Fu, H., Z. Shao, P. Fu, and Q. Cheng. 2017. “The dynamic analysis between urban nighttime economy and urbanization using the DMSP/OLS nighttime light data in China from 1992 to 2012.” Remote Sens. 9 (5): 416. https://doi.org/10.3390/rs9050416.
Ghosh, T., S. Anderson, C. Elvidge, and P. Sutton. 2013. “Using nighttime satellite imagery as a proxy measure of human well-being.” Sustainability 5 (12): 4988–5019. https://doi.org/10.3390/su5124988.
He, X., and M. Qiao. 2018. “Research on coordination of urbanization and driving forces of urban agglomeration in China based on nighttime light data.” In Proc., 2018 7th Int. Conf. on Agro-Geoinformatics (Agro-Geoinformatics). Piscataway, NJ: IEEE.
Jiang, D., N. Wang, and H. Liu. 2002. “Processing methods for spatialisation of population data.” J. Geogr. 57 (B12): 6.
Kamarajugedda, S. A., P. V. Mandapaka, and E. Y. M. Lo. 2017. “Assessing urban growth dynamics of major Southeast Asian cities using night-time light data.” Int. J. Remote Sens. 38 (21): 6073–6093. https://doi.org/10.1080/01431161.2017.1346846.
Kuang, K., K. Zheng, R. Chen, B. Chen, Y. Hong, and J. Liu. 2023. “Spatio-temporal evolution of county economic development in Fujian Province based on NPP-VIIRS nighttime light data.” Areal Res. Dev. 42 (4): 29–35. https://doi.org/10.3969/j.issn.1003-2363.2023.04.005.
Li, S., X. Li, and M. Zhang. 2022. “Spatial-temporal pattern evolution of Xi’an metropolitan area using DMSP/OLS and NPP/VIIRS nighttime light data.” Sustainability 14 (15): 9747. https://doi.org/10.3390/su14159747.
Liu, S., Y. Yan, and B. Hu. 2023. “Satellite monitoring of the urban expansion in the Pearl River–Xijiang economic belt and the progress towards SDG11.3.1.” Remote Sens. 15 (21): 5209. https://doi.org/10.3390/rs15215209.
Ma, T., Y. Zhou, C. Zhou, S. Haynie, and T. Pei. 2015. “Night-time light derived estimation of spatio-temporal characteristics of urbanization dynamics using DMSP/OLS satellite data.” Remote Sens. Environ. 158: 563–464. https://doi.org/10.1016/j.rse.2014.11.022.
Wang, Y., C. Fang, and C. Xiu, and D. Liu. 2012. “A New approach to measurement of regional inequality in particular directions.” Chin. Geogr. Sci. 22: 705–717. https://doi.org/10.1007/s11769-012-0556-7.
Xiaobo, Z., M. Mingguo, Y. Hong, and G. Wei. 2017. “Modeling the spatiotemporal dynamics of gross domestic product in China using extended temporal coverage nighttime light data.” Remote Sens. 9 (6): 626. https://doi.org/10.3390/rs9060626.
Xu, Y. 2023. “Comprehensive evaluation of regional development resilience and analysis of influencing factors in Chongqing municipality.” Master’s thesis, School of Economics, Yunnan Univ. of Finance and Economics.
Yuke, Z., M. Ting, Z. Chenghu, and X. Tao. 2015. “Nighttime light derived assessment of regional inequality of socioeconomic development in China.” Remote Sens. 7 (2): 1242–1262. https://doi.org/10.3390/rs70201242.
Zhang, B., C. Miao, Z. Ran, J. Zhang, and H. Zhang. 2023a. “A study on the economic differences of counties in the Yellow River Basin under the core-edge perspective.” J. Geogr. 78 (6): 1355–1375.
Zhang, H. 2012. “Analysis of the geographical pattern of population distribution and changes in agglomeration in Shandong Province since the founding of the People’s Republic of China.” Econ. Geogr. 32 (10): 8.
Zhang, X., Y. Xie, J. Jiao, W. Zhu, Z. Guo, X. Cao, J. Liu, G., Xi, and W. Wei. 2023b. “How to accurately assess the spatial distribution of energy CO2 emissions? Based on POI and NPP-VIIRS comparison.” J. Cleaner Prod. 402: 136656. https://doi.org/10.1016/j.jclepro.2023.136656.
Zhang, X., L. Yang, and L. Jia. 2023c. “Study on spatio-temporal evolution and regional differences of population and economic development in Hebei Province.” J. Xingtai Univ. 38 (2): 77–83.
Zhao, M., W. Cheng, Q. Liu, and N. Wang. 2016. “Spatiotemporal measurement of urbanization levels based on multiscale units: A case study of the Bohai Rim Region in China.” J. Geogr. Sci. 26 (5): 531–548. https://doi.org/10.1007/s11442-016-1284-1.
Zhao, M., W. Cheng, C. Zhou, M. Li, K. Huang, and N. Wang. 2018. “Assessing spatiotemporal characteristics of urbanization dynamics in Southeast Asia using time series of DMSP/OLS nighttime light data.” Remote Sens. 10 (1): 47. https://doi.org/10.3390/rs10010047.
Zhao, Z., X. Tang, C. Wang, G. Cheng, C. Ma, H. Wang, and B. Sun. 2023. “Analysis of the spatial and temporal evolution of the GDP in Henan province based on nighttime light data.” Remote Sens. 15(3): 716. https://doi.org/10.3390/rs15030716.
Zhou, Q., M. Yan, and Y. Wang. 2023. “Study on the influence and regional difference of NPP/VIIRS night light information in county.” Remote Sens. Inf. 38 (1): 70–77.
Zhu, C., X. Li, and Y. Ru. 2022. “Assessment of socioeconomic dynamics and electrification progress in Tanzania using VIIRS nighttime light images.” Remote Sens. 14 (17): 4240. https://doi.org/10.3390/rs14174240.
Information & Authors
Information
Published In
Journal of Urban Planning and Development
Volume 150 • Issue 4 • December 2024
Copyright
This work is made available under the terms of the Creative Commons Attribution 4.0 International license, https://creativecommons.org/licenses/by/4.0/.
History
Received: Dec 15, 2023
Accepted: Jun 20, 2024
Published online: Aug 19, 2024
Published in print: Dec 1, 2024
Discussion open until: Jan 19, 2025
Authors
Metrics & Citations
Metrics
Citations
Download citation
If you have the appropriate software installed, you can download article citation data to the citation manager of your choice. Simply select your manager software from the list below and click Download.