Abstract
Culvert blockage is a recognized problem known to increase the risk of cross-drainage failure. Presently, the effects of bottom-up inlet blockage can be estimated using the theoretically derived energy loss method (ELM) and reduced area method (RAM). Both methods imply that hydraulically efficient inlets are more resilient to blockage effects but have not been verified experimentally for bottom-up blockages. In this study, a physical culvert model was used to determine the entrance loss coefficients and head-discharge relationships for commonly used pipe culvert inlets under different combinations of bottom-up blockage ratio, shape, and roughness. The experimental results confirm that hydraulically efficient inlets are more resilient to bottom-up blockage. Under submerged outlet control conditions, it was found that both blockage ratio and shape significantly influence the entrance loss coefficient and that ELM overestimated the entrance loss coefficient by up to 124%. Under inlet control conditions, it was found that only the blockage ratio significantly influenced the head-discharge relationship and that RAM underestimated the blockage discharge ratio by up to 38%. Comparisons to the experimental results show that ELM and RAM do not account for the increased efficiency of the unblocked part of the inlet under conditions of bottom-up blockage. Comparison to embedded inlets shows that they result in significantly lower entrance loss coefficients than partially blocked inlets under outlet control but yield similar discharge capacity ratios under inlet control. Uncertainties and estimation errors are given for the results, and validity for use in minimum performance design frameworks is evaluated for the different flow types used in hydraulic culvert design.
Practical Applications
The results show the importance of evaluating blockage effects as part of hydraulic culvert design and verify the general predictions of the energy loss method and reduced area method; that hydraulically efficient inlets are more resilient against blockage effects. The results are valid for type 1 and 5 (inlet control) and 4, 6, and 7 (outlet control) flows and can be used with existing design methods in the following ways: (1) informing the choice of inlet design, for both unblocked and blocked conditions; (2) including a blockage ratio in the design of culverts, based on registered blockage data or risk assessments; (3) evaluating necessary maintenance regimes based on acceptable blockage ratios; and (4) evaluating the effects of blockage on stream continuity. Given the large variation in in situ inlet blockage conditions, it is recommended to use the maximum values of entrance loss coefficients () and the minimum discharge ratio () as a conservative approach for bottom-up blockage effects. Recommended design blockage ratios given in design manuals should be supplemented with registered data on blockage history for specific locations. For data registration and monitoring, the blockage ratio () should be recorded.
Introduction
Culverts constrict flow and are therefore prone to blockage by debris, increasing the risk of cross-drainage failure (Rigby et al. 2002; Cafferata et al. 2004; Bradley et al. 2005; Ho 2010; Schall et al. 2012; Weeks and Rigby 2016). The causes and effects of culvert blockage have been studied in the field (Rigby et al. 2002; Cafferata et al. 2004; Ho 2010; Weeks and Rigby 2016) using physical scale models (Goodridge 2009; Ho 2010; Sorourian et al. 2015; Kramer et al. 2016; Taha et al. 2020) and numerical simulations (Ho 2010; Rowley 2014; Günal et al. 2019). In situ blockage conditions have been found to depend on many factors, such as the amount and type of available material, flood magnitude, and interactions between the stream, catchment, mobilized materials, and the drainage structure (Bradley et al. 2005; Ho 2010; Kramer et al. 2016; Jaeger and Lucke 2016; Iqbal et al. 2021; Miranzadeh et al. 2022). For this reason, methods for estimating the volume of blockage material and blockage ratios are associated with significant uncertainty (Bradley et al. 2005; Ho 2010; Jaeger and Lucke 2016; Weeks and Rigby 2016). Examples of recommended design blockage ratios can be found in Weeks and Rigby (2016), and examples of implementation in hydraulic culvert design are described in Ollett et al. (2017).
To include blockage effects in hydraulic culvert design, Bradley et al. (2005) recommend modifying existing hydraulic design methods, accounting for changes to the inlet geometry, surface roughness, and cross section shape and area. While roughness and cross section parameters for the culvert barrel can be modified using existing methods, empirical entrance loss coefficients and head-discharge relationships for partially blocked culvert inlets are limited. Inlet blockage conditions can be classified into bottom-up, top-down, and porous plug blockage conditions (Weeks and Rigby 2016; Ollett et al. 2017). Several studies have determined the entrance loss coefficients and head-discharge relationships for gated culverts, representative of top-down blockage of the inlet (Horowitz and Matys 2015; Zeng et al. 2020; Cantero-Chinchilla et al. 2023). Kranc et al. (1990) tested the effects of culvert inlet grate blockage, and Tullis et al. (2008) tested the effects of pipe culvert embedment using physical model experiments. Empirical design values accounting for bottom-up blockage effects are presently not available, but the theoretically derived ELM and RAM have been proposed for estimating inlet blockage effects and imply that are more resilient to blockage effects (Weeks et al. 2009; Witheridge 2009).
Under outlet control conditions, the entrance loss coefficients for circular inlets are reported to be Reynolds invariant for (Idelchik 1986) and scale invariant for pipe diameters over 300 mm (Tullis et al. 2008). Under submerged inlet control conditions, the use of vented inlets has been shown to reduce subatmospheric air pressure in the culvert barrel, thereby ensuring significant scale invariance for culvert diameters larger than 140 mm (French 1957, 1961). Kolerski and Wielgat (2014) used scale model experiments to show that the approach flow velocity is significantly unaffected by the local inlet flow field upstream from the inlet for pipe culverts.
Research Objectives
As ELM and RAM are theoretically derived, the objective of this study has been to determine the effects of bottom-up blockage ratio, shape, and roughness on the entrance loss coefficients and head-discharge relationships of commonly used pipe culvert inlets, and to compare these results to ELM, RAM, and experimental results for embedded culverts. Classification of flow types specific to bottom-up blockage conditions, sensitivity analysis, and potential hysteretic effects have not been investigated. The present study is based on the methods described in Schall et al. (2012).
Culvert Hydraulics
Culvert Flow Classification
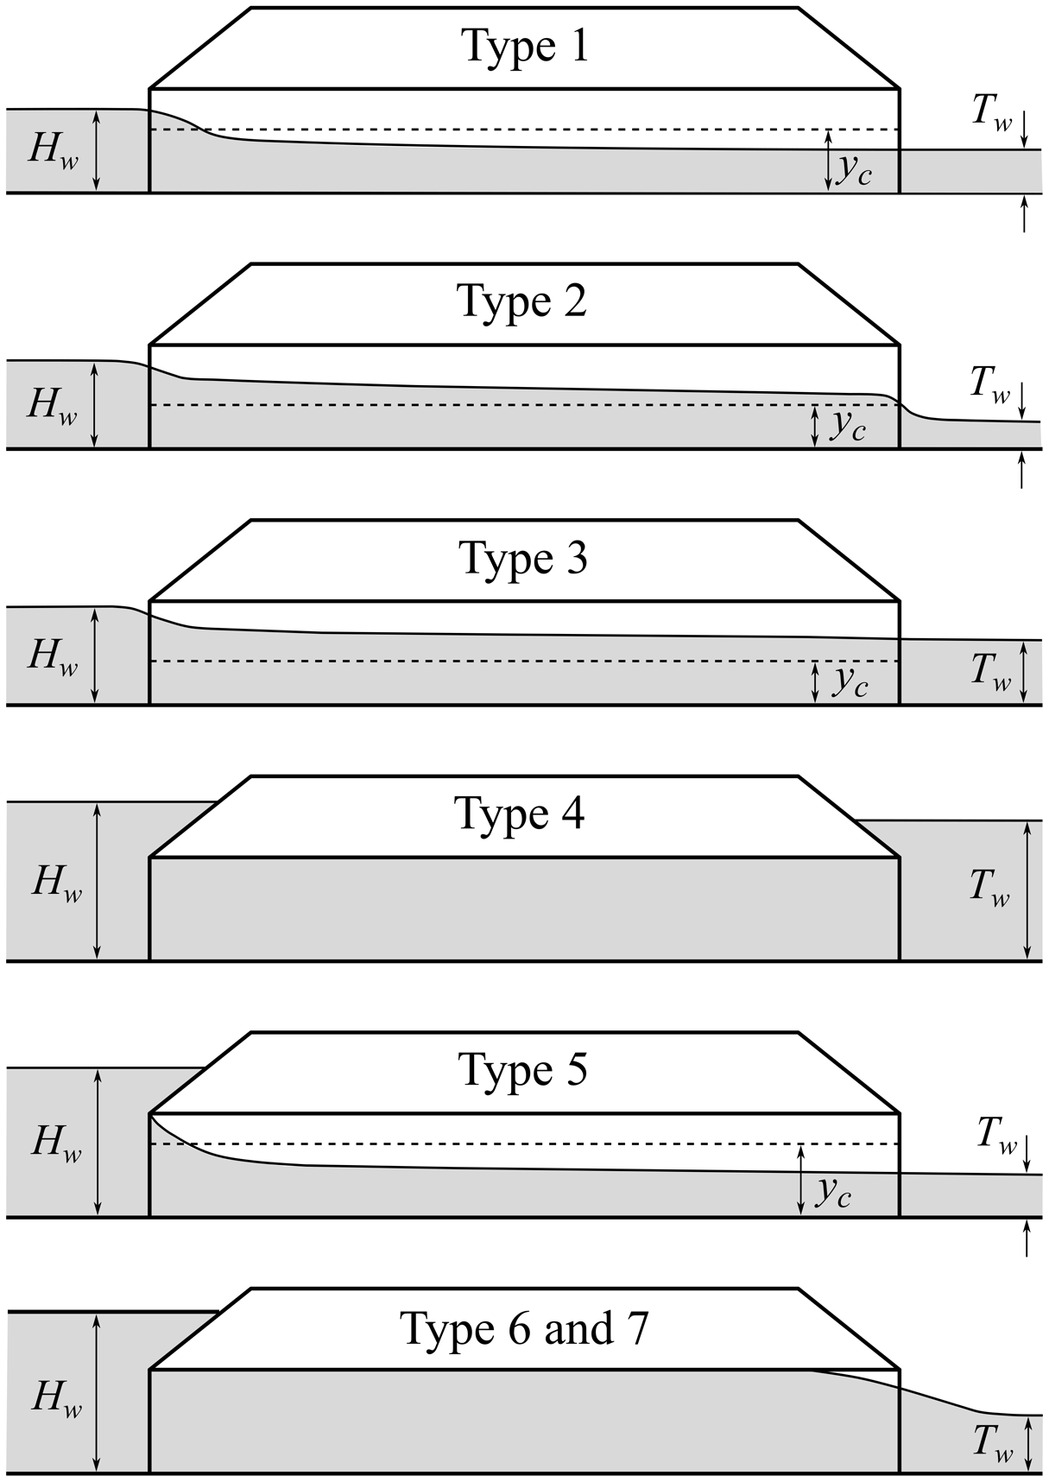
Flow through unblocked culverts is commonly classified using the USGS system, which distinguishes between six or seven flow types, based on the location of the control section, and the relative submergence of the inlet and outlet. Descriptions of the flow types and corresponding design equations can be found in publications such as Bodhaine (1968), Schall et al. (2012), and Chin (2013). Flow types 1–3 occur when the inlet is unsubmerged, and types 4–7 occur when the inlet is submerged (Fig. 1). For gated culverts, additional flow types can occur based on the relative inlet blockage caused by the gate (Cantero-Chinchilla et al. 2023).
Outlet Control
Under outlet control conditions, energy is lost due to the contraction and expansion of the flow field near the inlet, and the resulting entrance head loss () can be calculated as follows (Schall et al. 2012):
(1)
All variables are defined at the end of the paper. Here, the entrance loss coefficient “” is used to indicate that is calculated using the average culvert barrel velocity (). For the purpose of this study, the hydraulic efficiency of an inlet was defined by , with a low value indicating high efficiency. Values for are commonly given as a single, constant value for each inlet configuration (inlet type, cross section shape, and edge geometry) for type 4, 6, and 7 flow (Schall et al. 2012). is also known to vary with the approach-to-culvert contraction ratio (Idelchik 1986; Tullis et al. 2008) and the entrance length (French 1956; White 2016). For type 2 and 3 flow, has been found to depend on the relative headwater elevation (Smith and Oak 1995; Tullis et al. 2005, 2008).
For pressure flow in a circular pipe, the friction slope through the culvert barrel can be estimated using the method of Swamee and Jain (1976) and the Darcy–Weisbach equation (White 2016):
(2)
(3)
For a culvert inlet with a given blockage ratio (), the ratio of the average velocity in the blocked section () to the average velocity in the full cross section area of the pipe () can be found through continuity
(4)
To indicate entrance loss coefficients for partially blocked inlets, “” is used. It follows from Eqs. (1) and (4) that for the same energy loss, will have different values depending on if or is used. For reasons of clarity, “” and “” will therefore be used to indicate which velocity is used. The relationship between the two loss coefficients can be found as follows:
(5)
Eq. (5) allows for comparison of entrance loss coefficients that use different velocities to determine .
ELM accounts for the effects of the inlet blockage ratio () under outlet control conditions (Weeks et al. 2009; Witheridge 2009)
(6)
ELM assumes that the inlet is blocked by a thin-walled orifice plate with a circular opening concentric with the inlet and that the flow contraction is constant with increasing blockage ratio (Witheridge 2009). can be substituted for in Eq. (1) to determine the entrance loss under blockage conditions. Idelchik (1986) gives a modified version of ELM where the value of is given as a function of the edge size relative to the hydraulic diameter of the unblocked part of the inlet.
Inlet Control
For inlet control conditions, the semidimensionless head-discharge relationship depends on the inlet configuration, inlet cross section rise, and the barrel slope and can be accurately estimated using a continuous 5th-degree polynomial equation, covering both unsubmerged (type 1) and submerged (type 5) inlet control conditions (Schall et al. 2012)
(7)
The effective head () is calculated as , using for nonmitered inlets, and for the mitered inlet, consistent with French (1955, 1961) and Schall et al. (2012). For the purpose of this study, efficiency was defined by the ratio, with a low ratio indicating high efficiency.
RAM calculates the ratio of discharge capacities for blocked () and unblocked () conditions (Weeks et al. 2009)
(8)
RAM was derived using dimensional analysis and assumes that the efficiency is constant with increasing blockage ratio (Witheridge 2009). The ratio is mathematically identical to for given values of the diameter and cross section area . It should be noted that the ratio is not used in Eq. (7) or in other commonly used design equations for type 1 and 5 flow, but that RAM can be included in the head-discharge relationship using the relationship .
Uncertainty of Single Sample Measurements
Due to the large number of experiments, the present study mainly used single sample measurements, and the method of Kline and McClintock (1953) was therefore used to estimate the uncertainty of the results. For a model parameter , dependent on variables with corresponding uncertainty , the method estimates the uncertainty interval of () as follows:
(9)
Experimental Setup
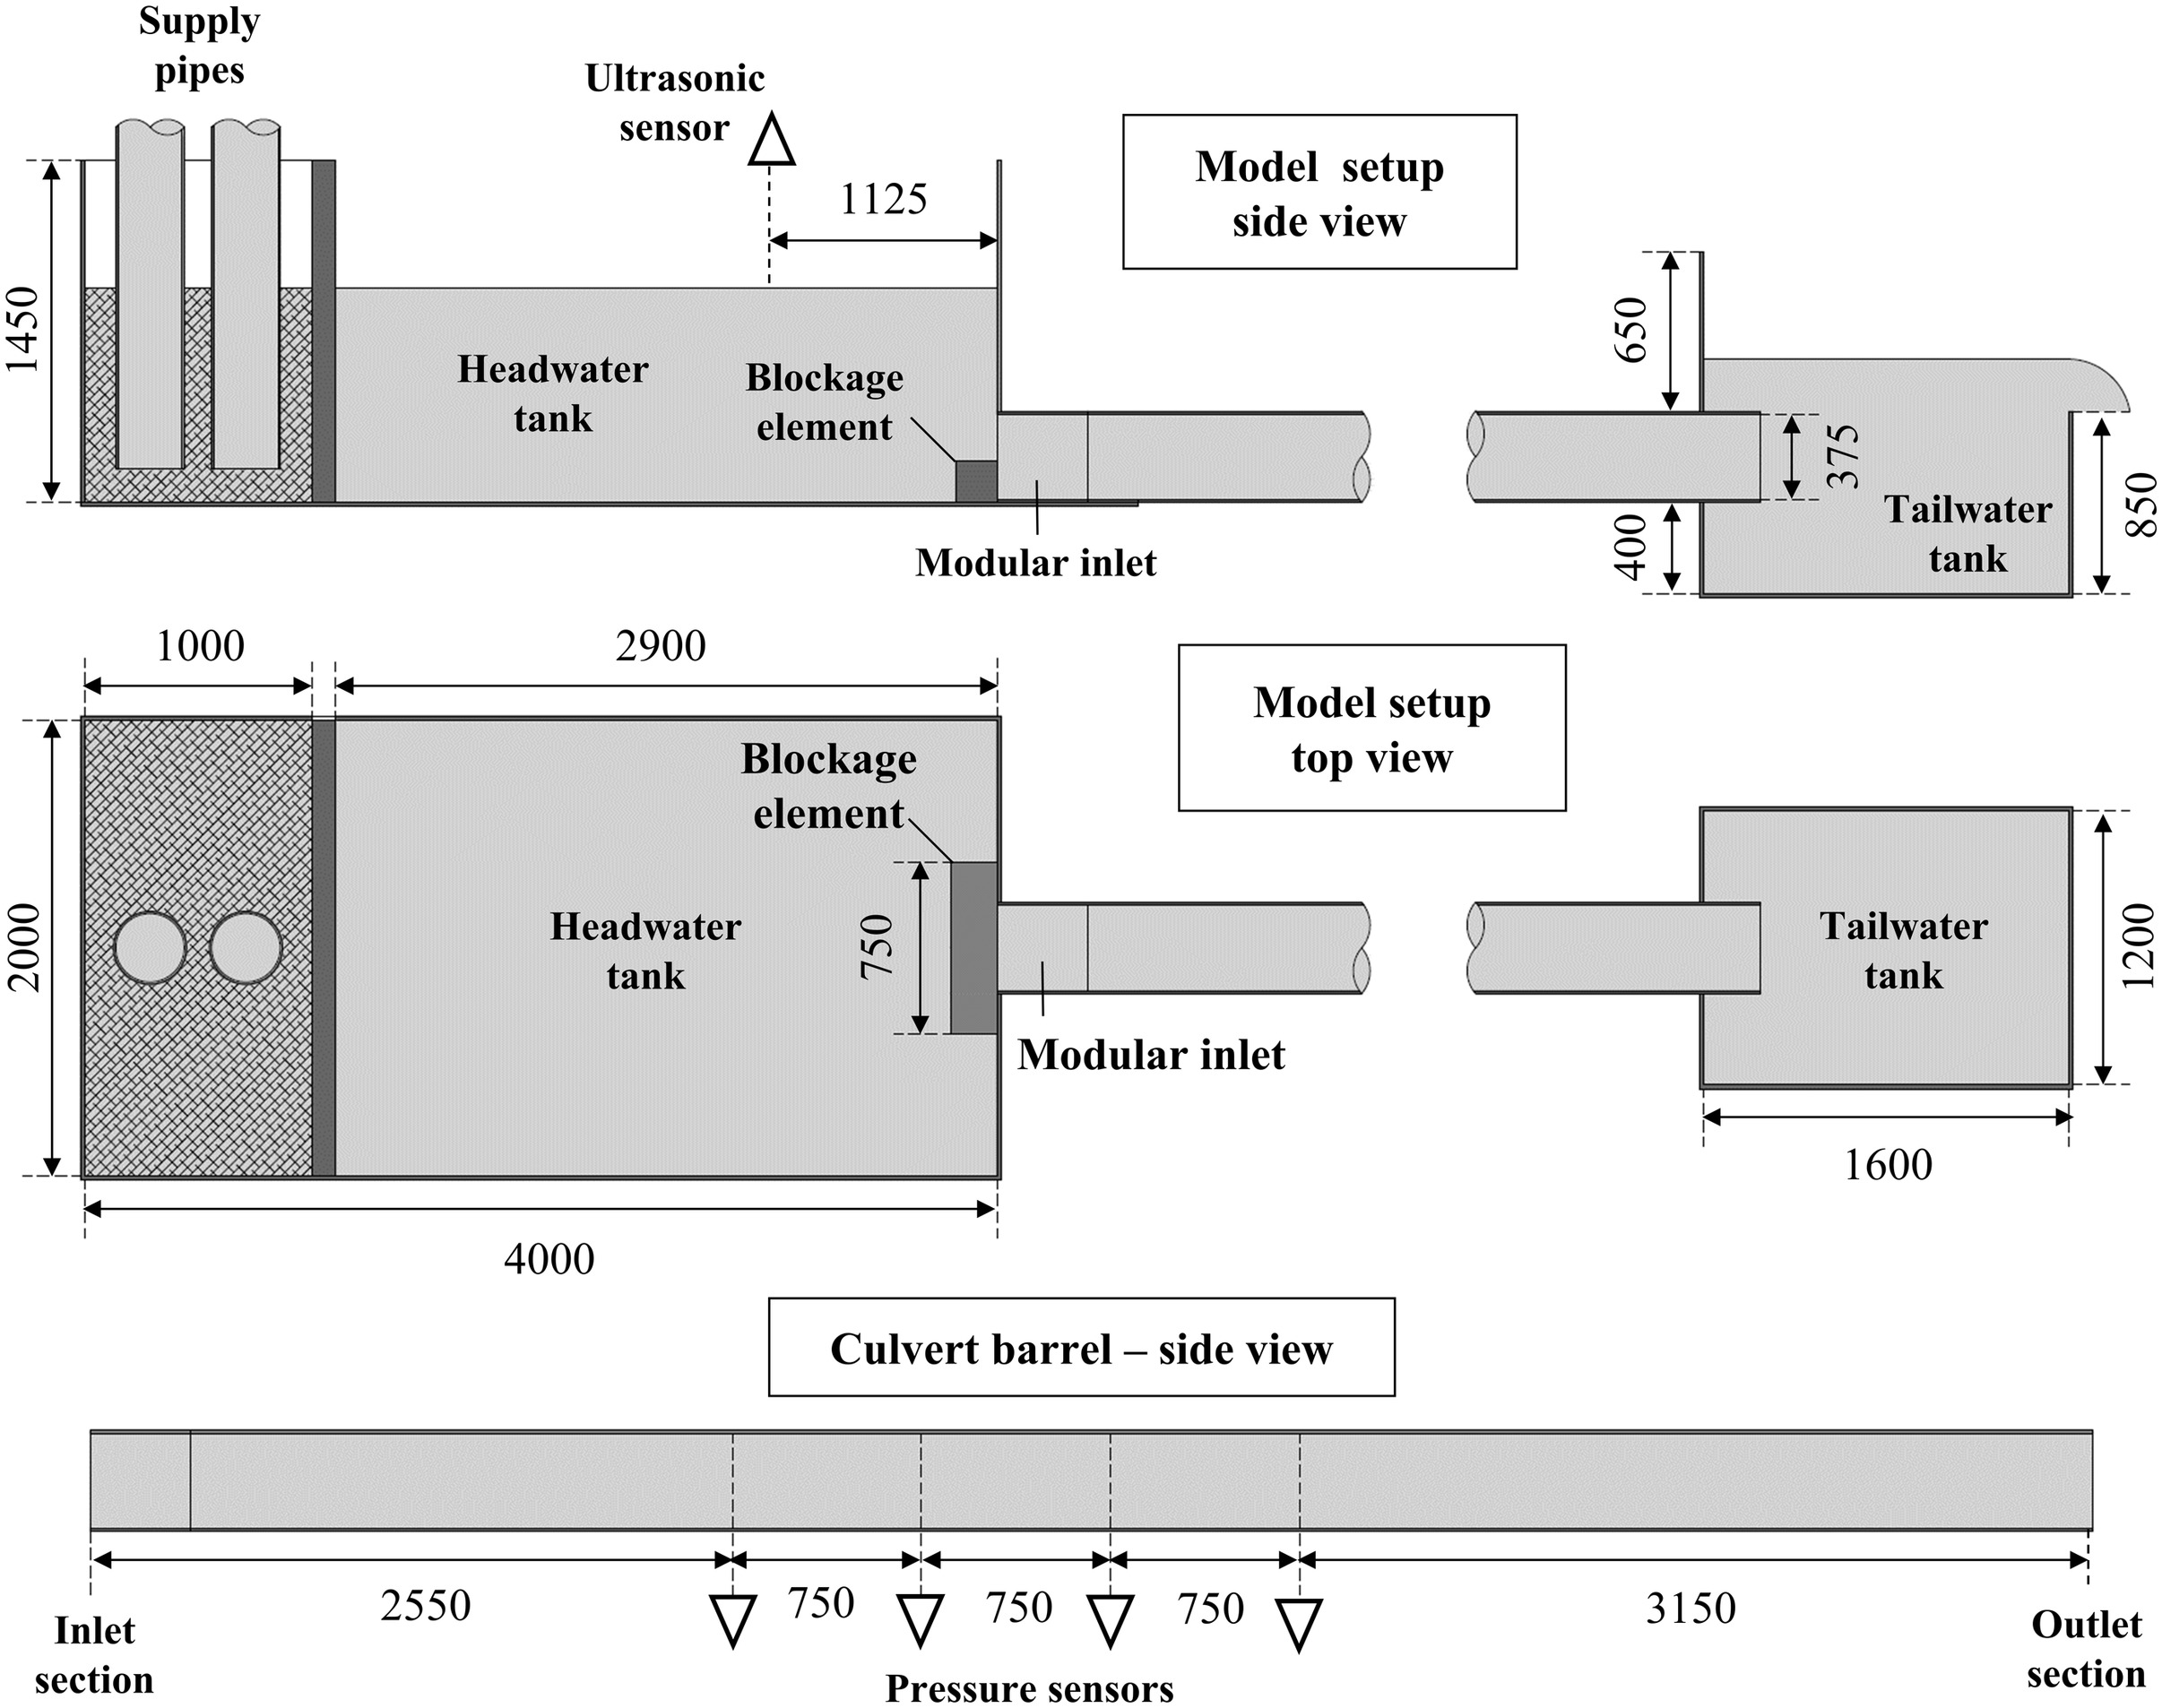
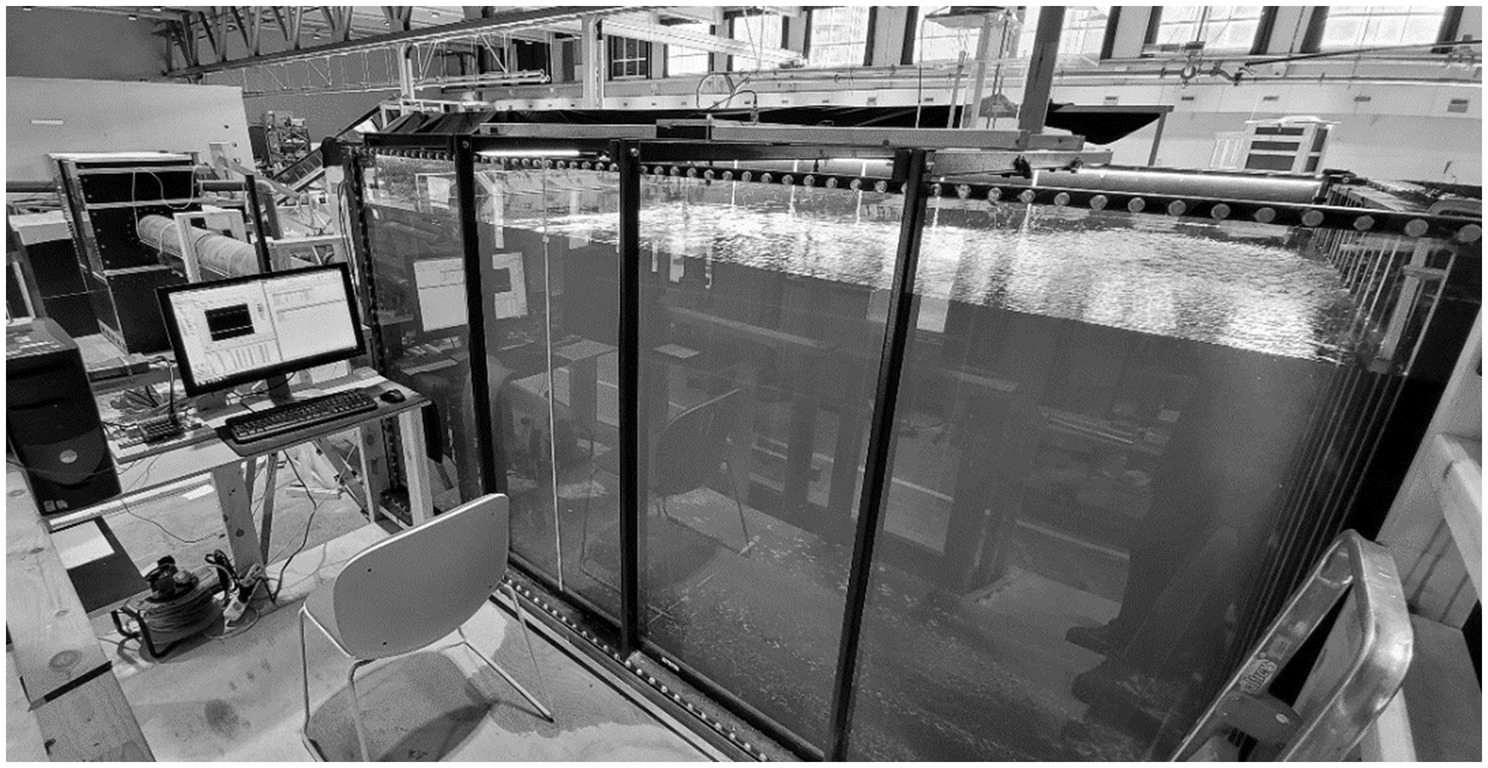
A physical culvert model was built in the hydraulic laboratory at the Norwegian University of Science and Technology (NTNU) (Fig. 2). Water was supplied through two 300 mm pipes, with built-in Siemens SITRANS FM MAG 5000 flow meters. The flow entered the head tank through a plastic mesh diffusion chamber, and the approach headwater elevation was measured relative to the inlet section invert using a millimeter scale located 1,125 mm upstream from the inlet face section where the approach flow was assumed unaffected by the local flow field near the inlet (Kolerski and Wielgat 2014). The culvert barrel was constructed from a circular PVC pipe of internal diameter and length . For the outlet control (type 4 flow) conditions, a nominal zero slope was used for the culvert barrel, and the tailwater level was controlled using a weir placed at the downstream end of the tailwater tank to ensure a submerged outlet. For inlet control (type 1 and 5 flow), a nominal slope of and a 400 mm vertical drop downstream from the outlet were used to ensure supercritical flow conditions in the culvert barrel and a free outlet. To avoid scale effects related to subatmospheric air pressure in the barrel and approach flow conditions, a 70 mm PVC pipe was installed into the inlet crown, 300 mm downstream of the headwall (French 1961). Seven commonly used pipe culvert inlets were tested and installed with exposed inlet invert edges (Fig. 3 and Table 1). The culvert barrel was supported by beams and vertical columns in order to ensure a constant barrel slope, and four WIKA S-11 pressure sensors were mounted along the culvert barrel invert in order to determine the piezometric grade line through the culvert barrel (Fig. 2).
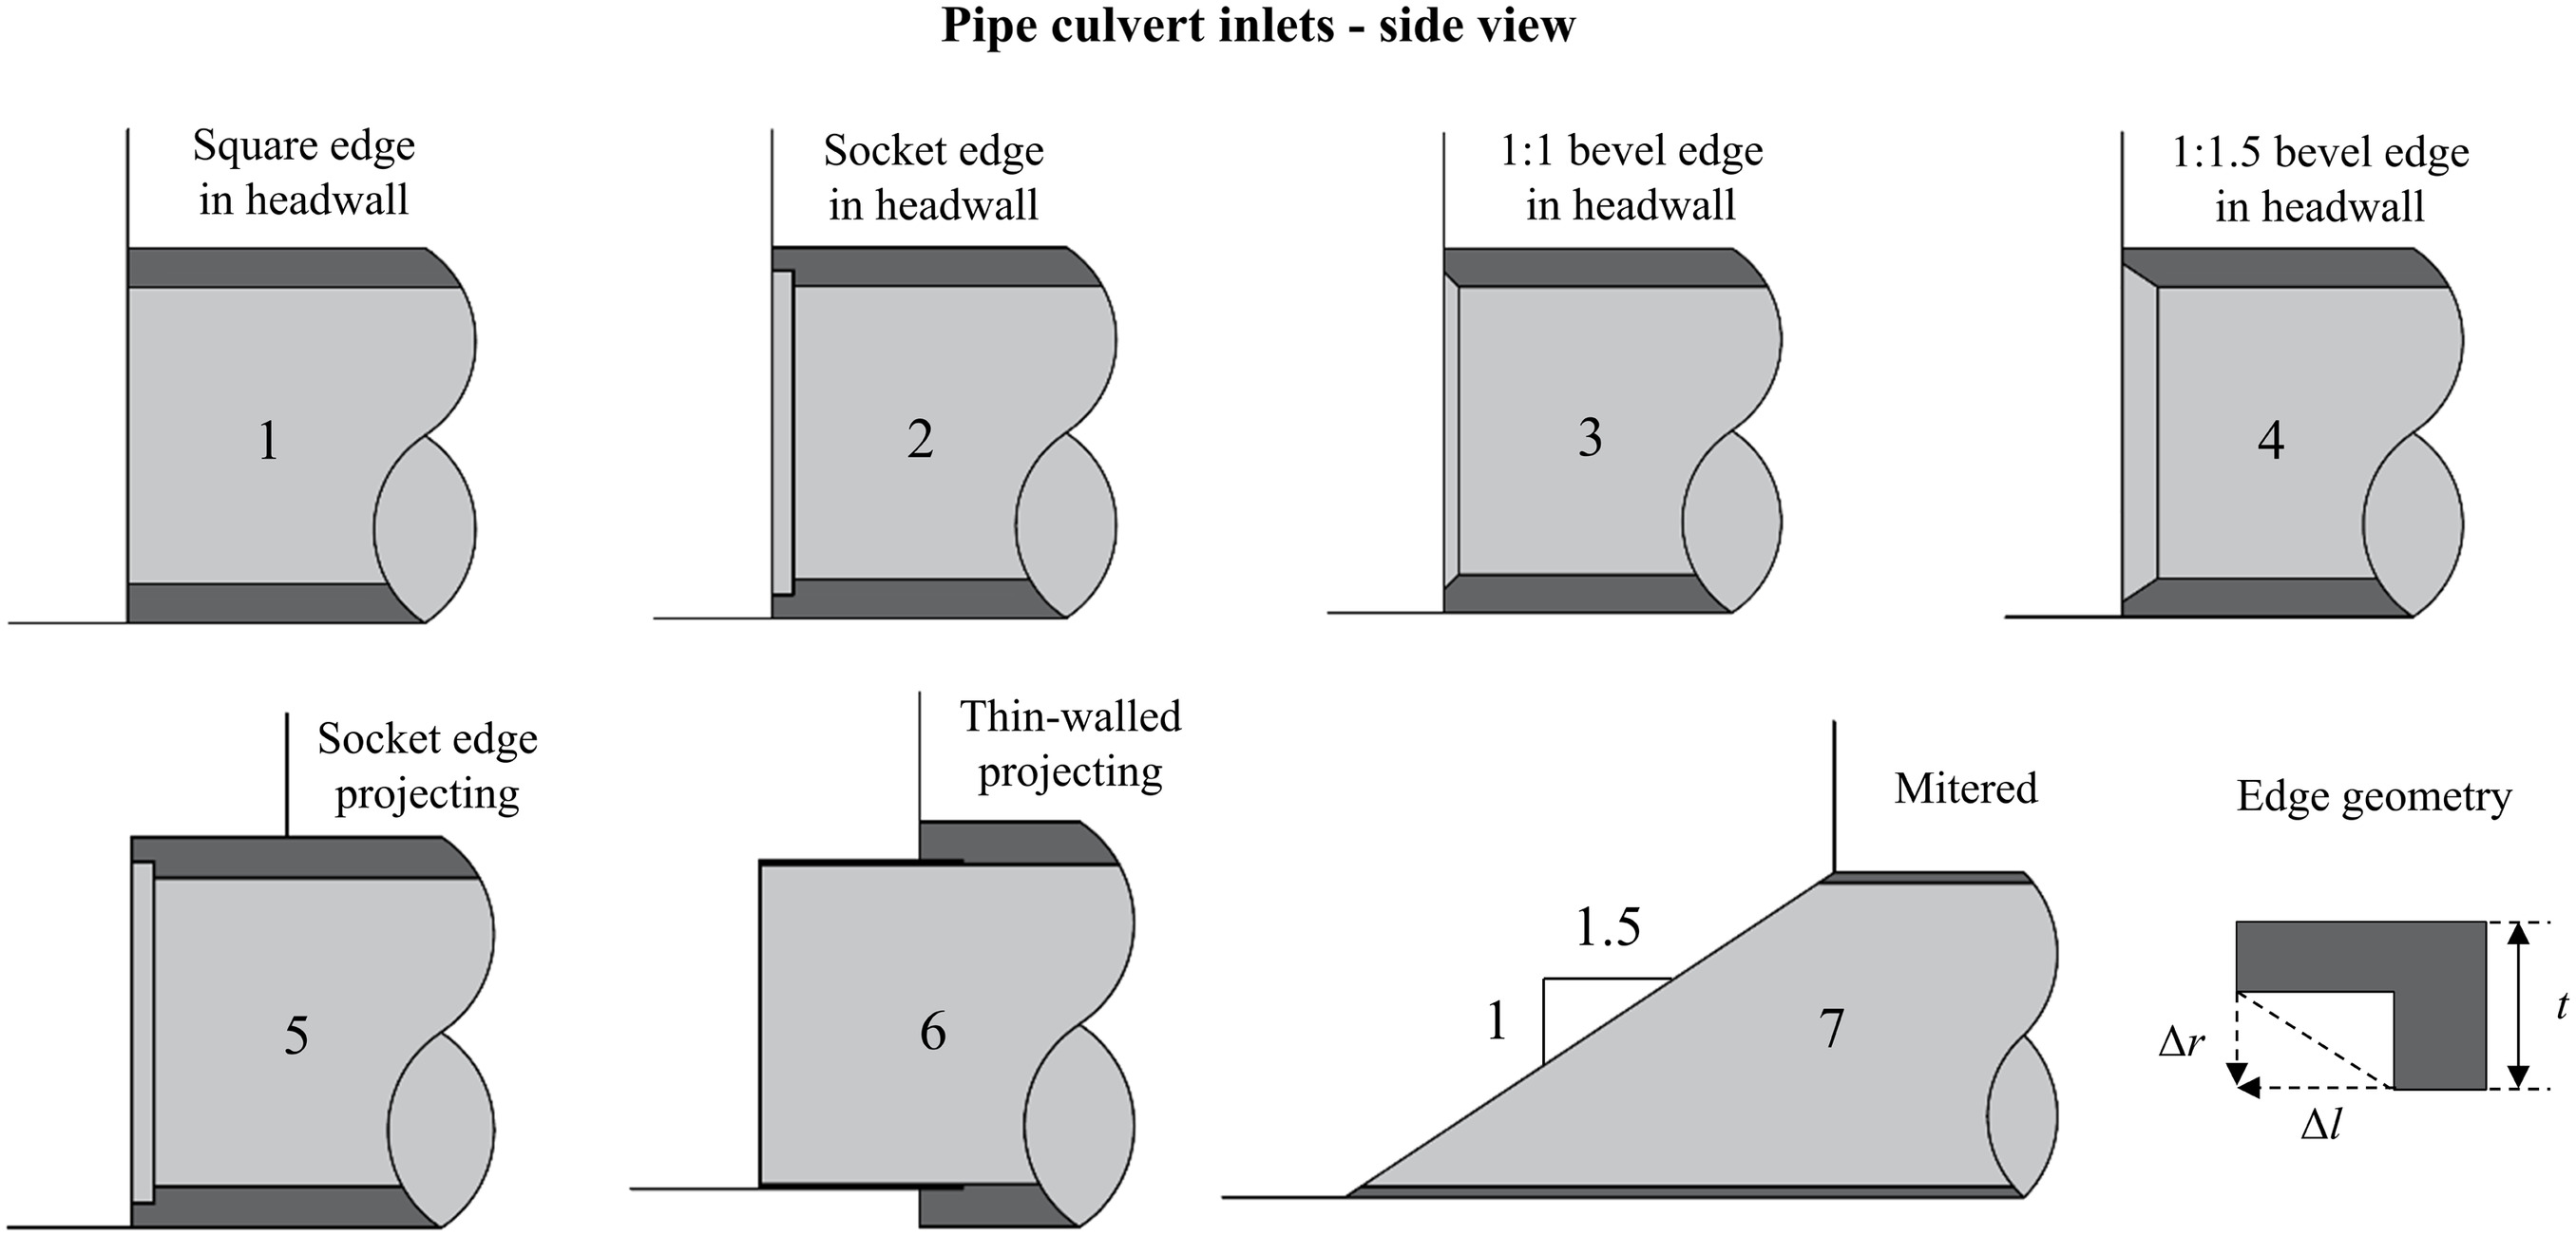
| Inlet | Edge geometry (Fig. 2) | Upstream projection length |
|---|---|---|
| 1. Square edge in headwall | Square edge | 0 |
| 2. Socket edge in headwall | (): () | 0 |
| 3. bevel in headwall | (): () | 0 |
| 4. bevel in headwall | (): () | 0 |
| 5. Socket edge projecting | (): () | |
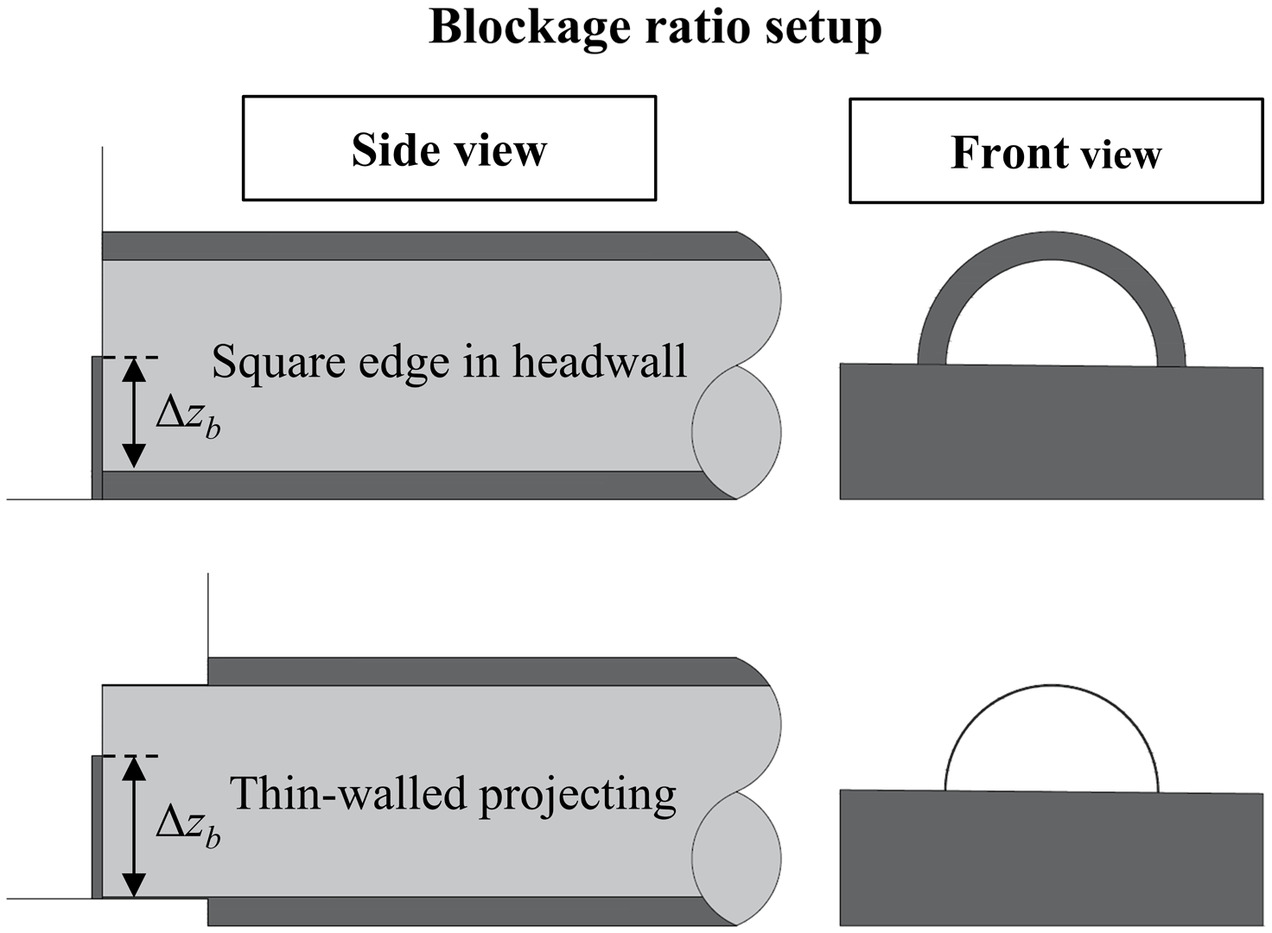
| 6. Thin-walled projecting | ||
| 7. Mitered | Miter slope = 1 (vertical): 1.5 (horizontal) |
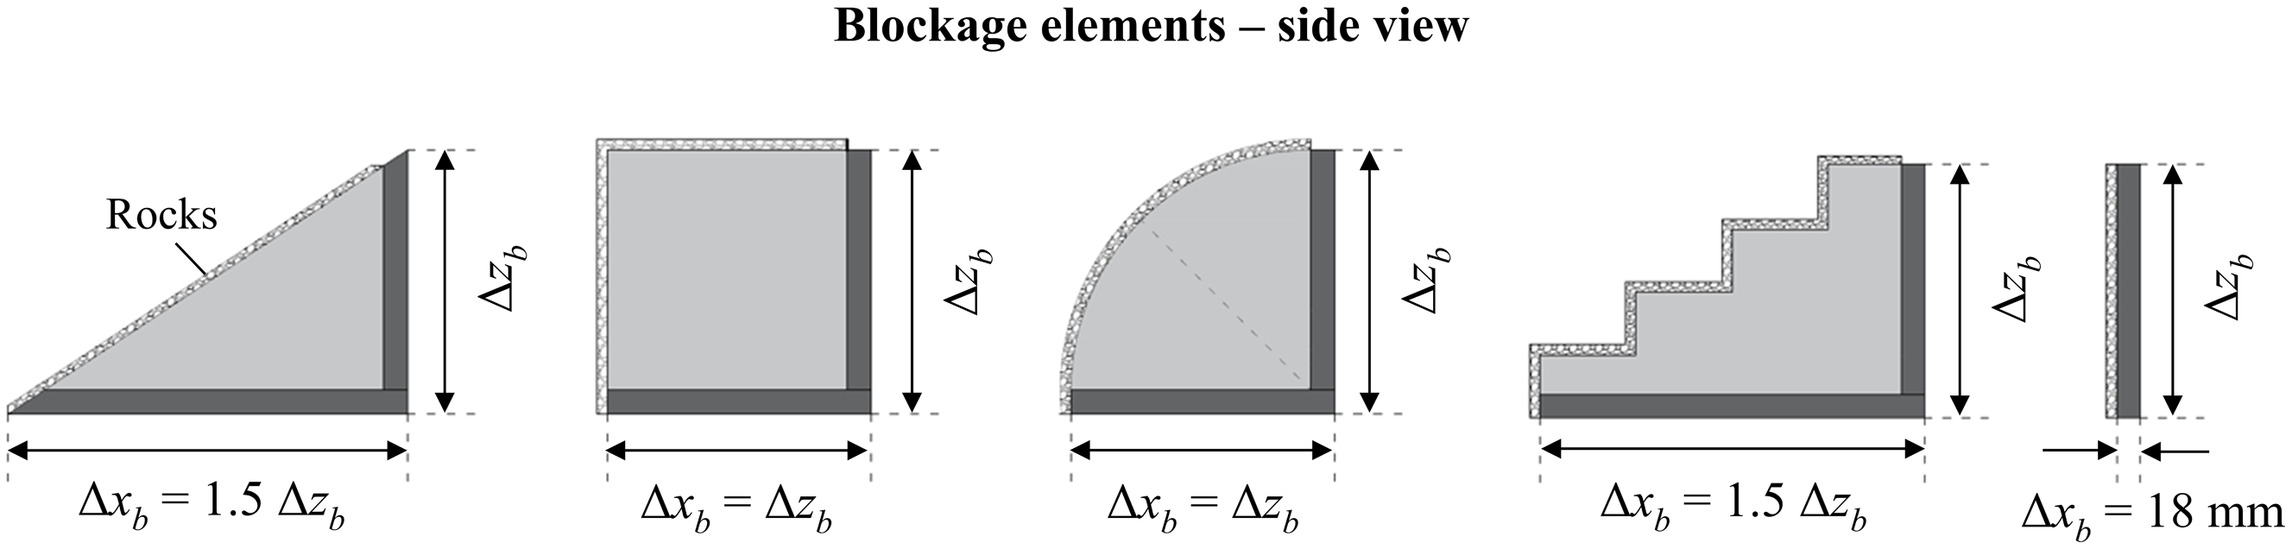
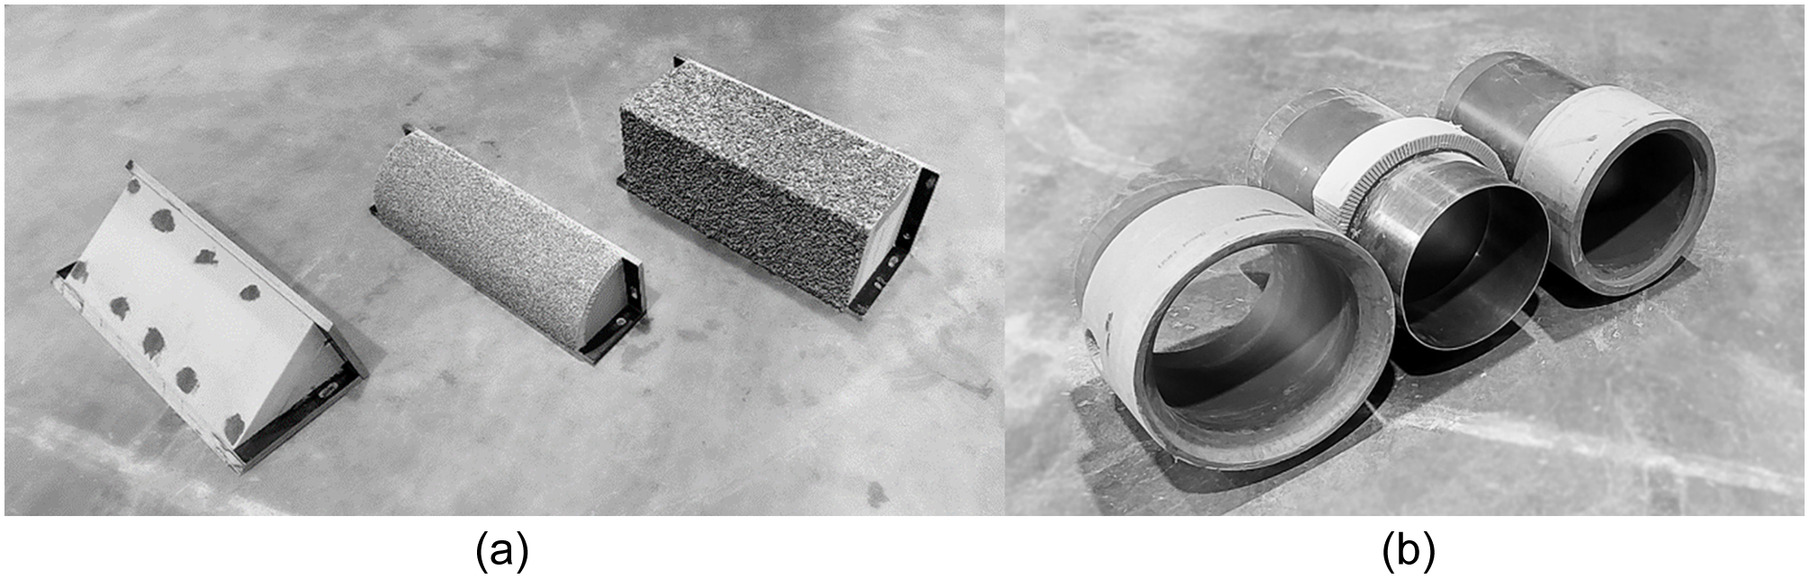
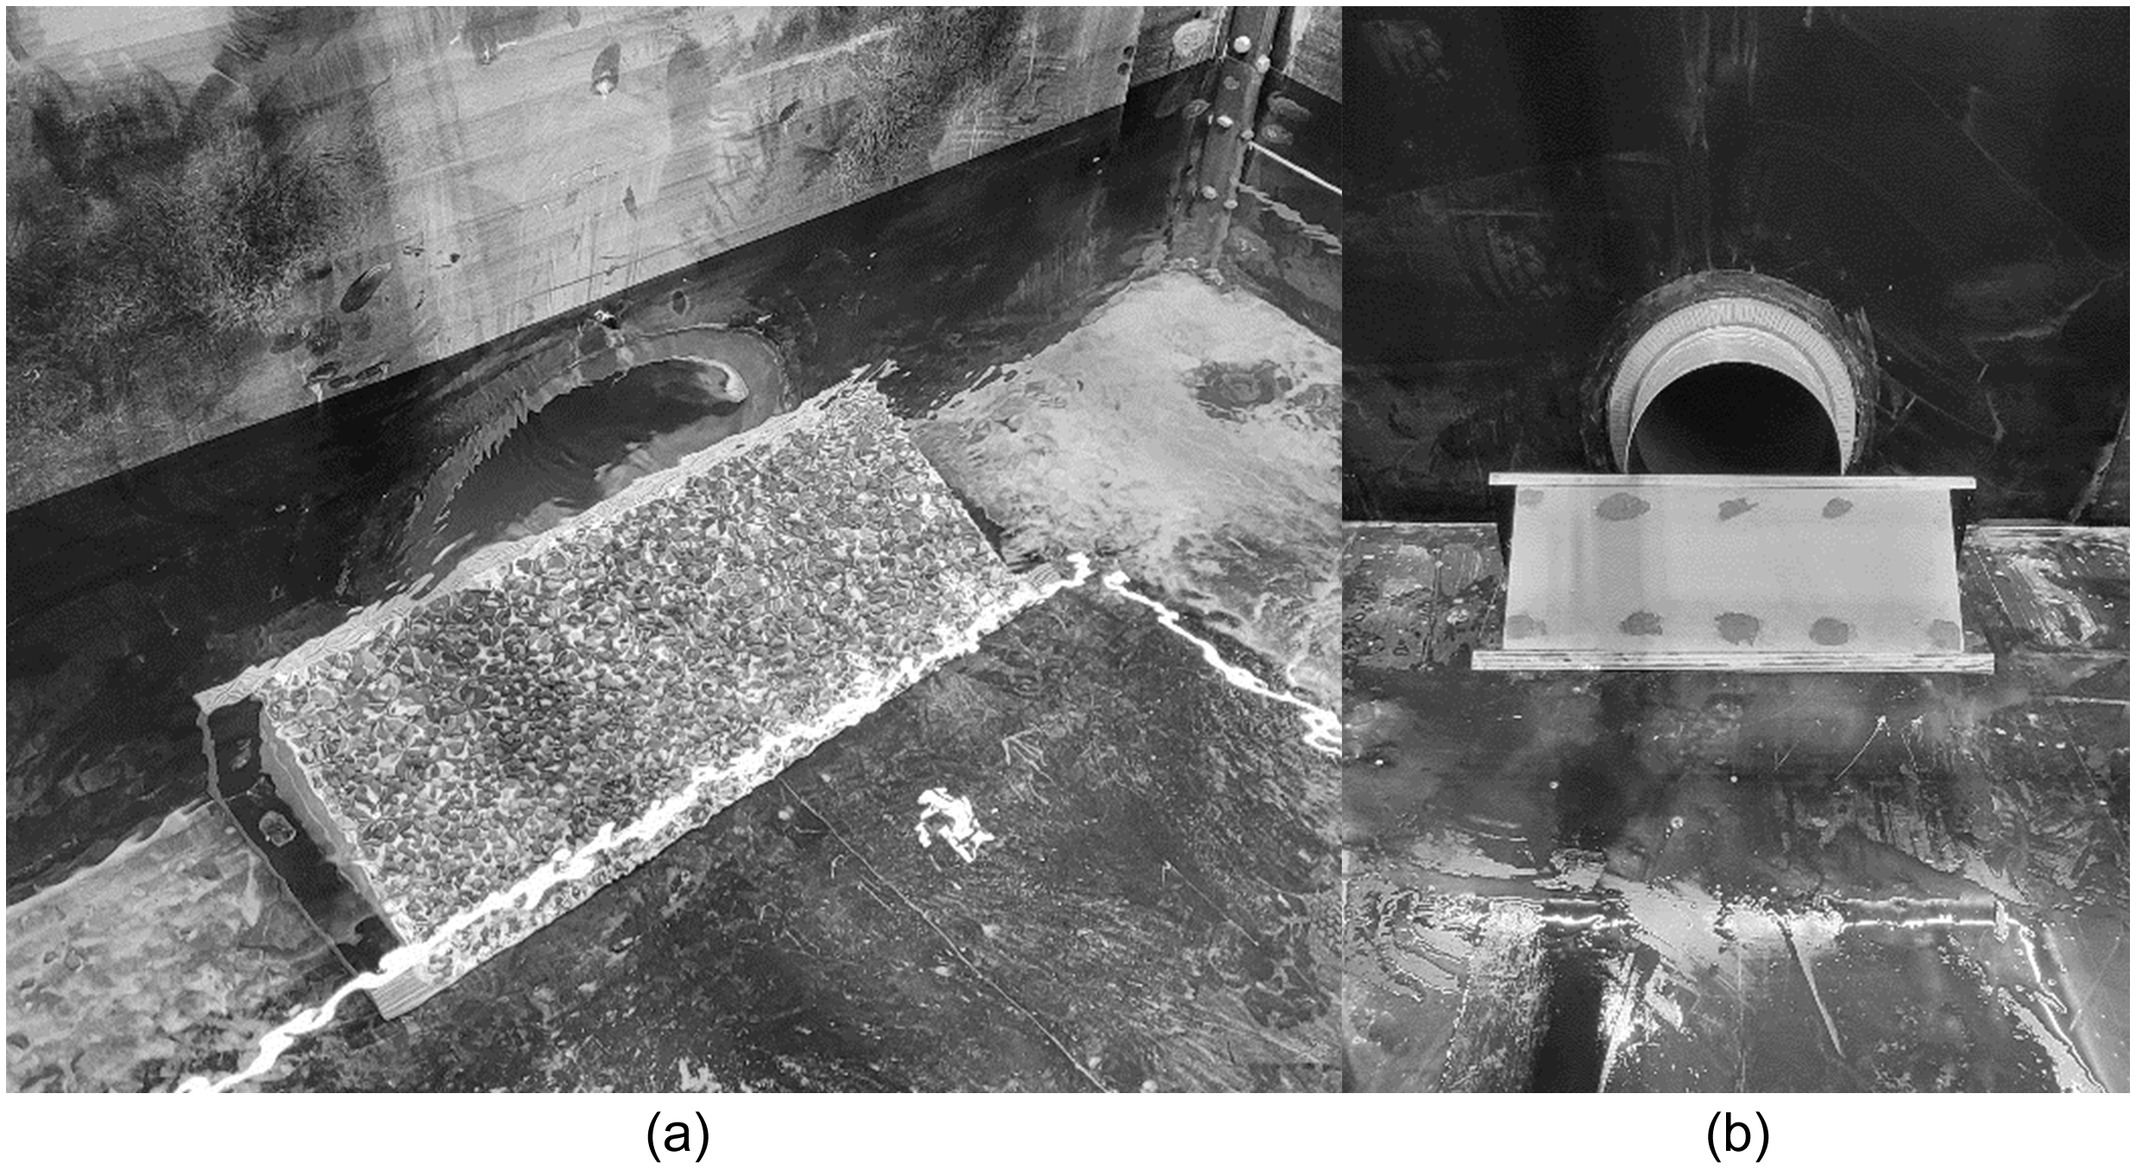
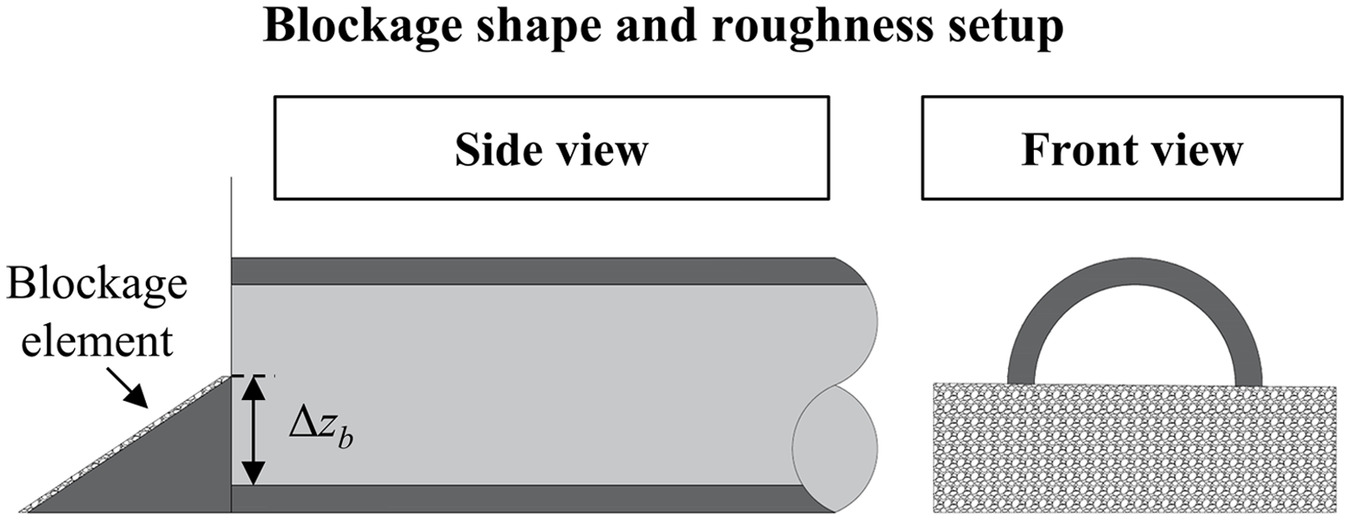
The different blockage elements used are shown in Fig. 4 and represent a span of idealized versions of bottom-up blockage conditions observed by the corresponding author during culvert inspections during and after floods. The blockage elements were made from plywood and PVC foam, with either untreated foam surfaces or rocks of or 8 mm glued to the top and upstream sides. The rock sizes were chosen so that the blockage shape was not significantly altered, allowing for evaluation of both shape and roughness effects. No rocks were used within 18 mm upstream of the inlet face to ensure that the blockage ratio could be accurately determined. Photos of the model setup are shown in Figs. 5–7.
Experimental Procedure
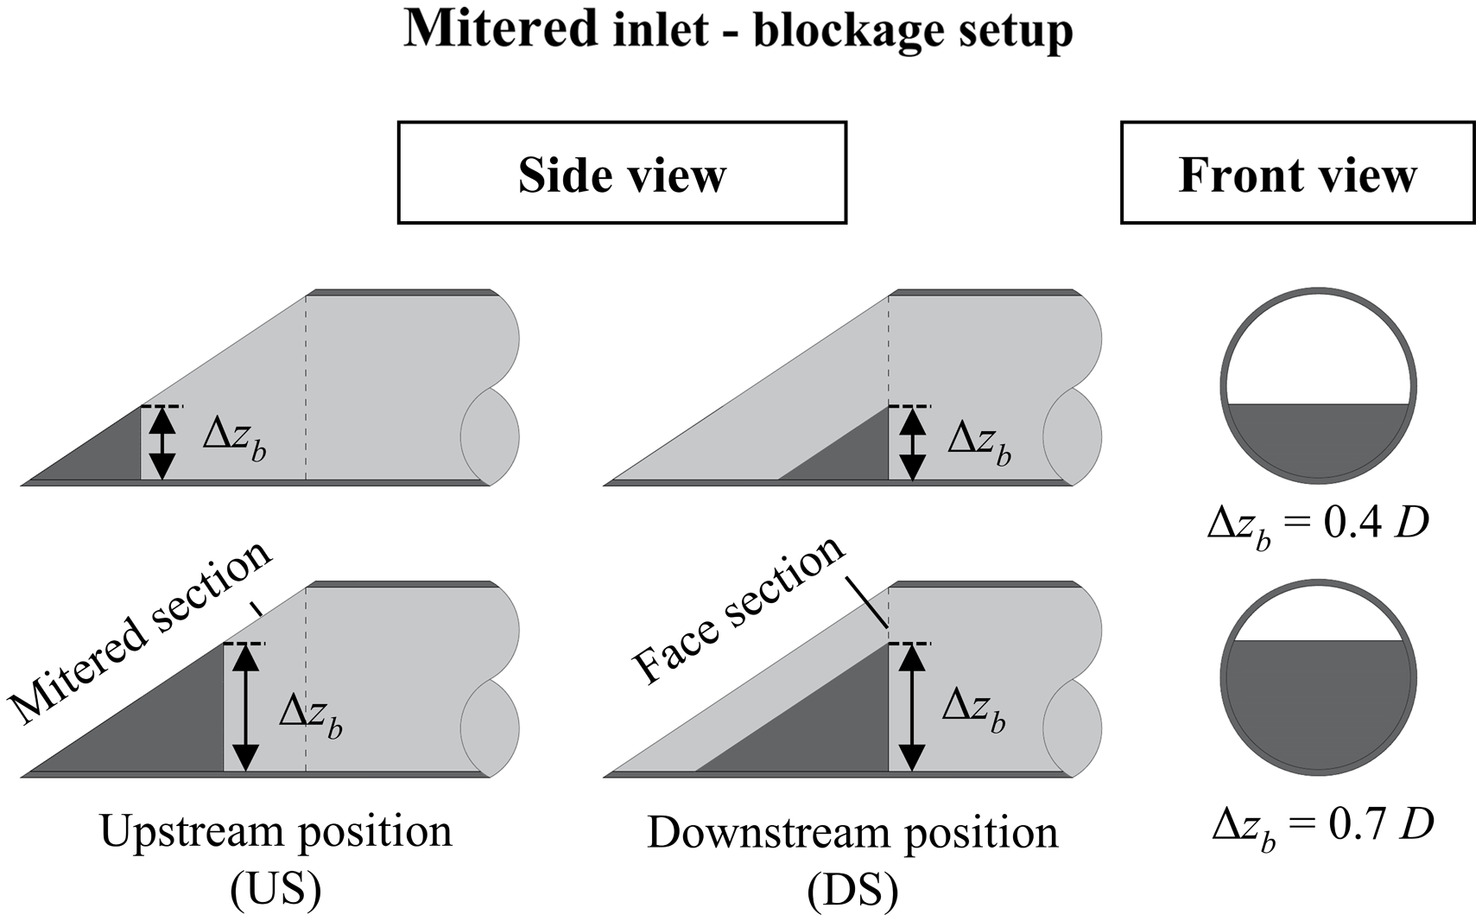
For each experiment, a single blockage element was used, and measurements were taken at different headwater elevations on a rising stage. The headwater was allowed to stabilize before measurements were taken over 60 s, at 100 Hz. The total head () was calculated based on the measured piezometric head () and the average velocity (). The headwater elevation () was determined using the inlet invert as a datum, assuming no friction losses between the measurement section and the inlet. Three different sets of experiments were conducted for both outlet control (type 4 flow) and inlet control (type 1 and 5 flow) conditions. First, the unblocked inlets were tested in order to compare the experimental results to previous studies (French 1955, 1961; Idelchik 1986) and to determine the unblocked discharge () used in the ratio. The effect of the blockage ratio was then tested using 18 mm smooth blockage plates and varying blockage ratios (Fig. 8). Finally, the effects of blockage shape and roughness were tested using the blockage elements shown in Fig. 4 (Fig. 9). Blockage elements of () and () were used to evaluate shape and roughness effects over a span of blockage ratios. For the nonmitered inlets, blockage elements of width 750 mm (2) were placed in front of the inlet section. For mitered inlets of nonconstant cross section areas (such as partial blockage), the inlet section cannot be uniquely defined (French 1961). The blockage elements were therefore fitted inside the mitered part of the inlet and tested both at the upstream mitered edge (US) and the downstream crown edge (DS) of the inlet (Fig. 10). Due to the large number of blockage conditions tested, only smooth blockage surfaces were used for the mitered inlet. In all cases, the blockage ratio was calculated based on the blockage and culvert barrel area perpendicular to the culvert barrel axis.
Outlet control conditions were tested using type 4 flow. The piezometric grade line was evaluated to confirm that it was located above the barrel crown and that the inlet and outlet were submerged for the lowest discharge for each experiment, indicating pressure flow conditions. The entrance head loss was calculated as the difference between the total approach head in the head tank, and the average total head at the inlet section projected from the location of the four pressure sensors in the pipe, accounting for friction losses. The friction slope was determined using Eqs. (2) and (3) and a culvert barrel roughness height of (Rocha et al. 2017). The entrance loss coefficient was calculated for 5–7 values of in the range , and the average entrance loss coefficient was calculated as the simple average for each experiment. Eq. (5) and regression analysis were used to determine the relationship between the blockage ratio and the entrance loss coefficient, and these relationships were then compared to ELM and the experimental results for embedded culverts given in Tullis et al. (2008). The results are given as the average entrance loss coefficient for the unblocked and blockage ratio experiments. Due to the large number of experiments, only the average, maximum, and minimum entrance loss coefficients were evaluated for the blockage shape and roughness experiments. Finally, the maximum values were compared to ELM and embedded culverts. The full set of entrance loss coefficients is included in Table S1 .
Inlet control conditions were tested using type 1 and 5 flow. The Froude number was evaluated to confirm supercritical flow in the culvert barrel using the piezometric head as the characteristic length and the average flow velocity as the characteristic velocity. Inlet submergence was determined based on the semidimensionless discharge for the unblocked part of the inlet (), using as the criterion for type 1 flow and for type 5 flow (Schall et al. 2012). For each experiment, eight measurements of and were taken in the range . Different head-discharge equations were tested, and it was found that Eq. (7) gave the lowest estimation errors. The head-discharge relationship was determined based on the full cross section of the barrel for direct comparison between the unblocked and blocked conditions, and was calculated for corresponding inlets and values of . The resulting ratios were compared to RAM and the experimental results for embedded culverts from (Tullis et al. 2008). The results from the unblocked inlet control experiments are given as comparisons of to the results of French (1961) and as ratios for the blockage ratio experiments. Due to the large number of experiments, only the average, maximum, and minimum ratios were evaluated for the blockage shape and roughness experiments. Finally, the minimum values were compared to RAM and embedded culverts. The full set of head-discharge equations is included in Table S2 .
To adjust for small differences in blockage height () between experiments, the entrance loss coefficients and head-discharge relationships for the shape and roughness experiments were adjusted based on , for direct comparison using and 0.748. For both inlet and outlet control conditions, repeatability was tested for the bevel inlet, which due to the high efficiency gave the largest relative errors based on differences between experiments. Due to the large number of experiments, repeatability was not tested further, but the uncertainty was estimated using Eq. (9) and compared to the estimation errors for the complete set of entrance loss coefficients and head-discharge relationships. The accuracy of the measurement equipment and uncertainty of all model parameters are given in Table 12 in the Appendix. To evaluate the validity of the results, the Reynolds number for the culvert barrel was evaluated for the outlet control (type 4 flow) experiments. The barrel diameter was used as the characteristic length, and the dynamic viscosity was determined based on the measured water temperature (White 2016).
Experimental Results for Outlet Control (Type 4 Flow)
Unblocked Inlets
The entrance loss coefficients for the unblocked inlets were found to be in agreement with those of both Schall et al. (2012) and Idelchik (1986) within uncertainty for all inlets, except the bevel edge, which was in better agreement with Idelchik (1986) (Table 2). While varied with , the average value of could be determined within the uncertainty of all values for each experiment. The results show repeatability within uncertainty for the three experiments using the bevel inlet (Table 2).
| Inlet configuration | Schall et al. (2012) | Idelchik (1986) | Present study | |
|---|---|---|---|---|
| Avg. | Avg. estimation error | |||
| Square edge in headwall | 0.50 | 0.02 | ||
| Socket edge in headwall | 0.20 | — | 0.04 | |
| bevel in headwall | 0.20 | 0.04 | ||
| Socket edge projecting | 0.20 | — | 0.02 | |
| Thin wall projecting | 0.90 | 0.03 | ||
| Mitered inlet | 0.70 | — | 0.02 | |
| bevel in headwall (repeatability) | 0.20 | 0.04 | ||
| 0.04 | ||||
| 0.04 | ||||
Blockage Ratio Effects
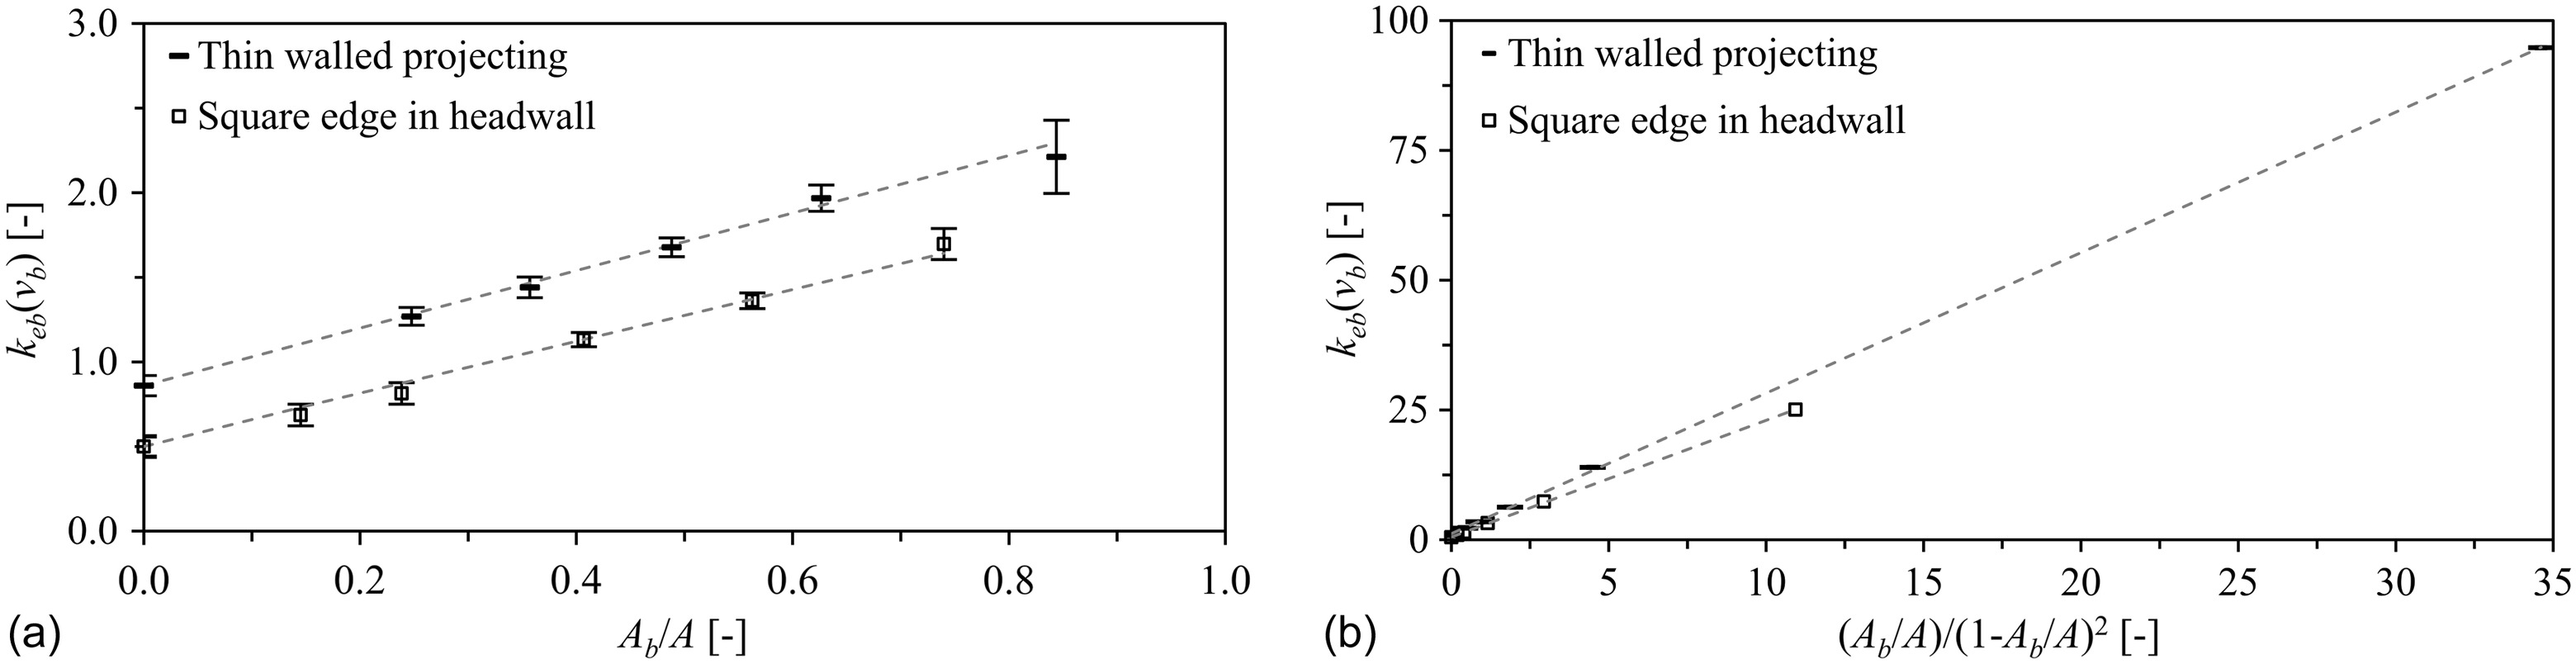
For the blockage ratio experiments, the relationships between , , and for the square edge in headwall and thin-walled projecting inlets were analyzed, and it was found that could be expressed as a linear function of within uncertainty [Fig. 11(a)]. From Eq. (5), it follows that is a linear function of [Fig. 11(b)]. The following results are in the form of , as it is more easily expressed as a function of the blockage ratio, but values of used in Eq. (1) can be calculated using Eq. (5).
Blockage Shape and Roughness Effects
For the blockage shape and roughness experiments, the results showed a significant variation in with blockage shape for all inlets (Table 3). The maximum difference in between blockage shapes varied between the different inlets; 14%–37% for , and 19%–56% for , indicating that blockage shape effects increased with the blockage ratio. The highest values of were generally found for the square or plate blockage elements (blunt bodies), and the lowest loss coefficients were found for the triangular or curved blockage elements (streamlined bodies). No significant differences were found between blockage elements of similar shape but different roughness. It should be noted that the roughness was limited to and that there were significant differences between the triangular and stepped blockage elements. The difference varied between the different inlets; 2%–28% for and 9%–43% for , indicating significant effects of larger blockage element surface structures. These findings are in general agreement with the theory of hydrodynamic drag, where form drag is large compared to friction drag (White 2016). To the degree that is a function of the drag of the blockage element, the effects can be expected to vary with the approach flow Reynolds number (White 2016). However, the variation in with the Reynolds number was found to be within the estimated uncertainty for each experiment. For the mitered inlet, varied significantly with both blockage shape and location, indicating a change in the zone of flow separation from the US to the DS blockage position. As noted, the blockage ratio was calculated perpendicular to the culvert barrel axis, giving the same value of for the two cases, but this difference indicates a dependence of on the unblocked cross section area perpendicular to the mitered section (Fig. 10). However, determination of the cross section area perpendicular to the culvert barrel axis is consistent with existing design methods and allowed for direct comparison of the mitered and nonmitered inlets, and this effect was therefore not investigated further. It was found that the average, minimum, and maximum values could be expressed as linear functions of for the nonmitered inlets, while the mitered inlet gave a non-linear relationship with
(10)
(11)
| Inlet | Avg. | Max. | Min. | |||
|---|---|---|---|---|---|---|
| Sq. edge headwall | ||||||
| Socket edge headwall | ||||||
| bevel headwall | ||||||
| bevel headwall | ||||||
| Socket edge projecting | ||||||
| Thin-walled projecting | ||||||
| Mitered (DS) | ||||||
The blockage regression coefficient accounts for the differences between the inlets and blockage shapes. Values of , , and for the average, maximum, and minimum and values of are given in Table 4.
| Inlet | ||||||
|---|---|---|---|---|---|---|
| Square edge headwall | 1.439 | 1.695 | 1.062 | |||
| Socket edge headwall | 0.671 | 0.814 | 0.455 | |||
| bevel edge headwall | 0.688 | 0.778 | 0.595 | |||
| bevel edge headwall | 0.415 | 0.561 | 0.331 | |||
| Socket edge projecting | 0.725 | 0.867 | 0.643 | |||
| Thin-walled projecting | 1.729 | 2.011 | 1.064 | |||
| Mitered (DS) | ||||||
| 1.587 | 0.382 | 1.330 | 0.047 | 1.200 | ||
Comparison to ELM and Embedded Culverts
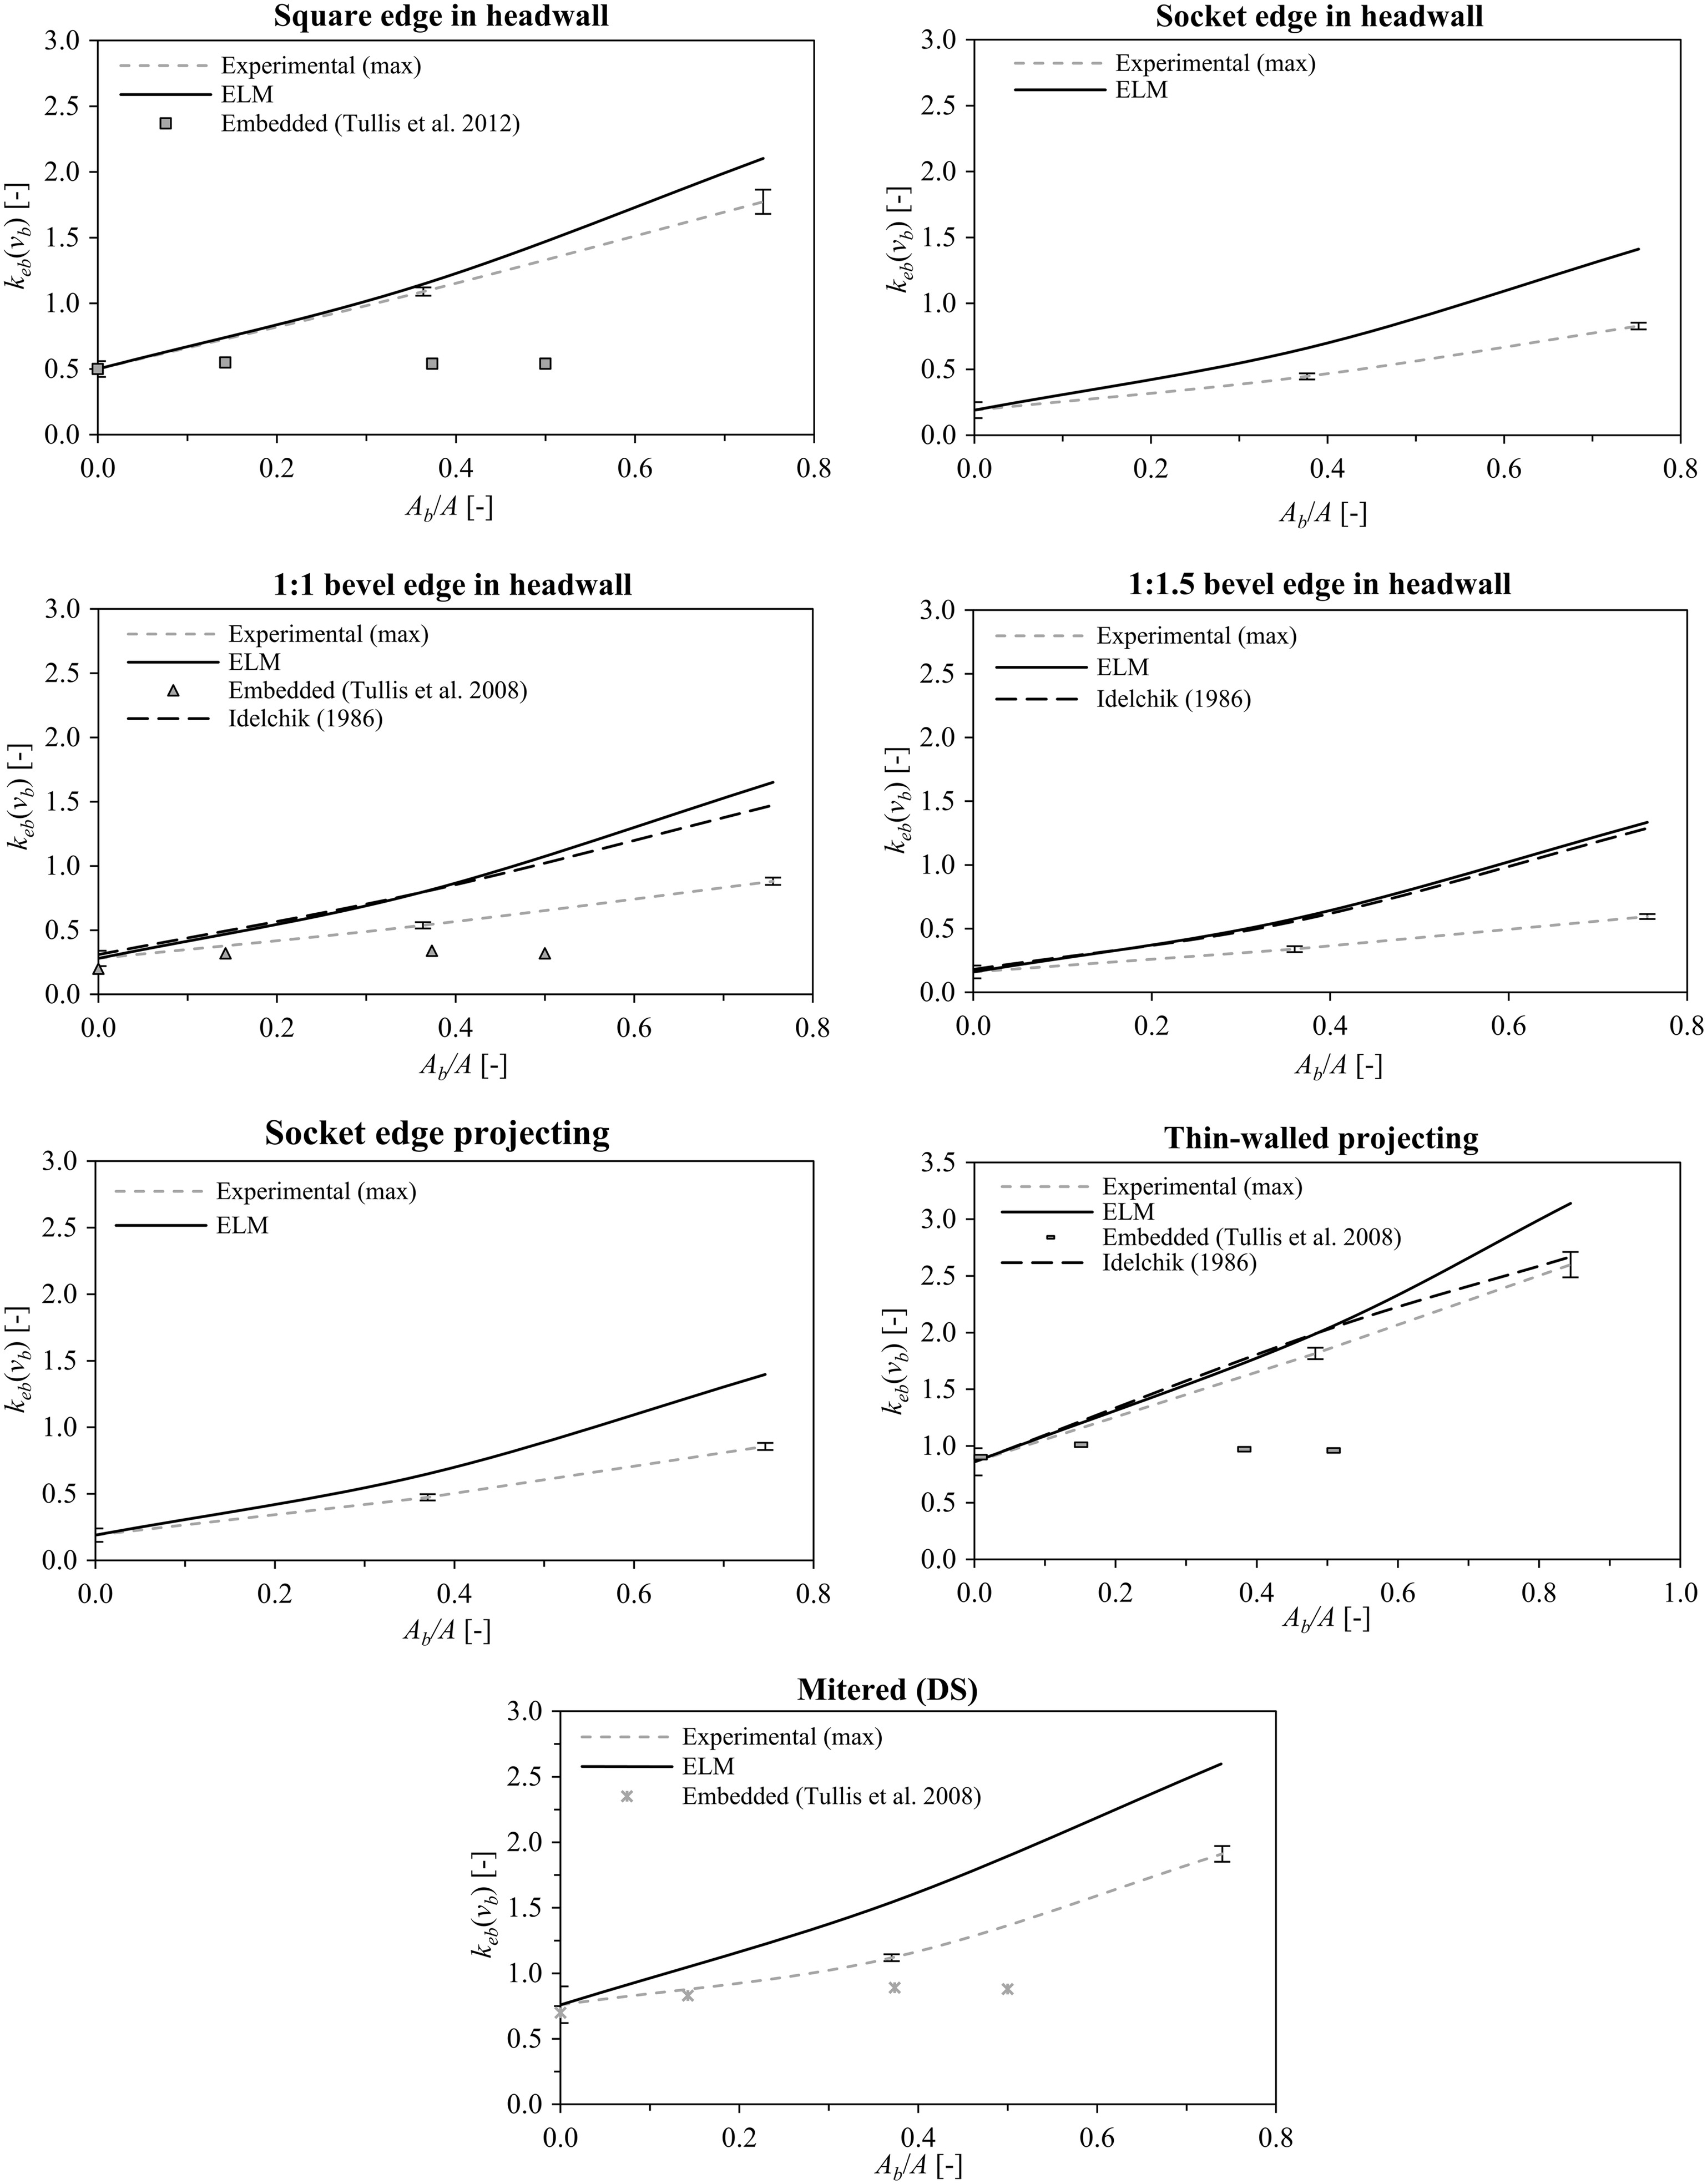
Eqs. (10) and (11) were compared to ELM using the formulations given in Idelchik (1986) and Witheridge (2009) and the embedded culverts of Tullis et al. (2008), using as the most conservative estimate of blockage effects. For the mitered inlet, the DS position was used for comparison. The results for the different inlets are plotted in Fig. 12, and estimation errors and uncertainty are given in Table 5. The results show that ELM significantly overestimates the experimental values for inlets with higher hydraulic efficiency, indicating that flow contraction is significantly reduced with increasing blockage ratio. This is in agreement with Idelchik (1986), where is reported to decrease as the size of the edge or socket increases relative to the hydraulic diameter. However, using values of based on the relative inlet edge size yielded values of close to those of ELM, except for the thin-walled projecting inlet, indicating that bottom-up blockage conditions differ fundamentally from the concentric blockage assumptions of ELM (Fig. 12). For embedded culverts, , as the barrel and inlet cross sections are identical. For this condition, remained largely constant with increasing blockage ratio, indicating that is dependent on the abrupt expansion of the flow field downstream of the blocked inlet section for bottom-up blockage conditions (Fig. 12).
| Inlet | Equations | Estimation error Eqs. (10) and (11) (%) | Estimation error ELM (%) | Uncertainty, (%) | |||
|---|---|---|---|---|---|---|---|
| Square edge in headwall | Eq. (10) | 2.7 | 5.2 | 18.6 | 2.9 | 5.3 | |
| Socket edge in headwall | Eq. (10) | 5.6 | 48.1 | 70.6 | 4.9 | 3.2 | |
| bevel in headwall | Eq. (10) | 2.3 | 48.3 | 87.5 | 4.5 | 3.3 | |
| bevel in headwall | Eq. (10) | 2.6 | 70.3 | 124.4 | 6.4 | 3.4 | |
| Socket edge projecting | Eq. (10) | 3.7 | 37.2 | 63.2 | 4.7 | 3.2 | |
| Thin-walled projecting | Eq. (10) | 1.6 | 9.6 | 20.8 | 3.1 | 5.5 | |
| Mitered inlet | Eq. (11) | 0.0 | 0.0 | 37.9 | 35.9 | 2.4 | 3.1 |
Note: Estimation error was calculated as the percentage difference between the estimated and experimental values.
Experimental Results for Inlet Control (Type 1 and 5 Flow)
Unblocked Inlets
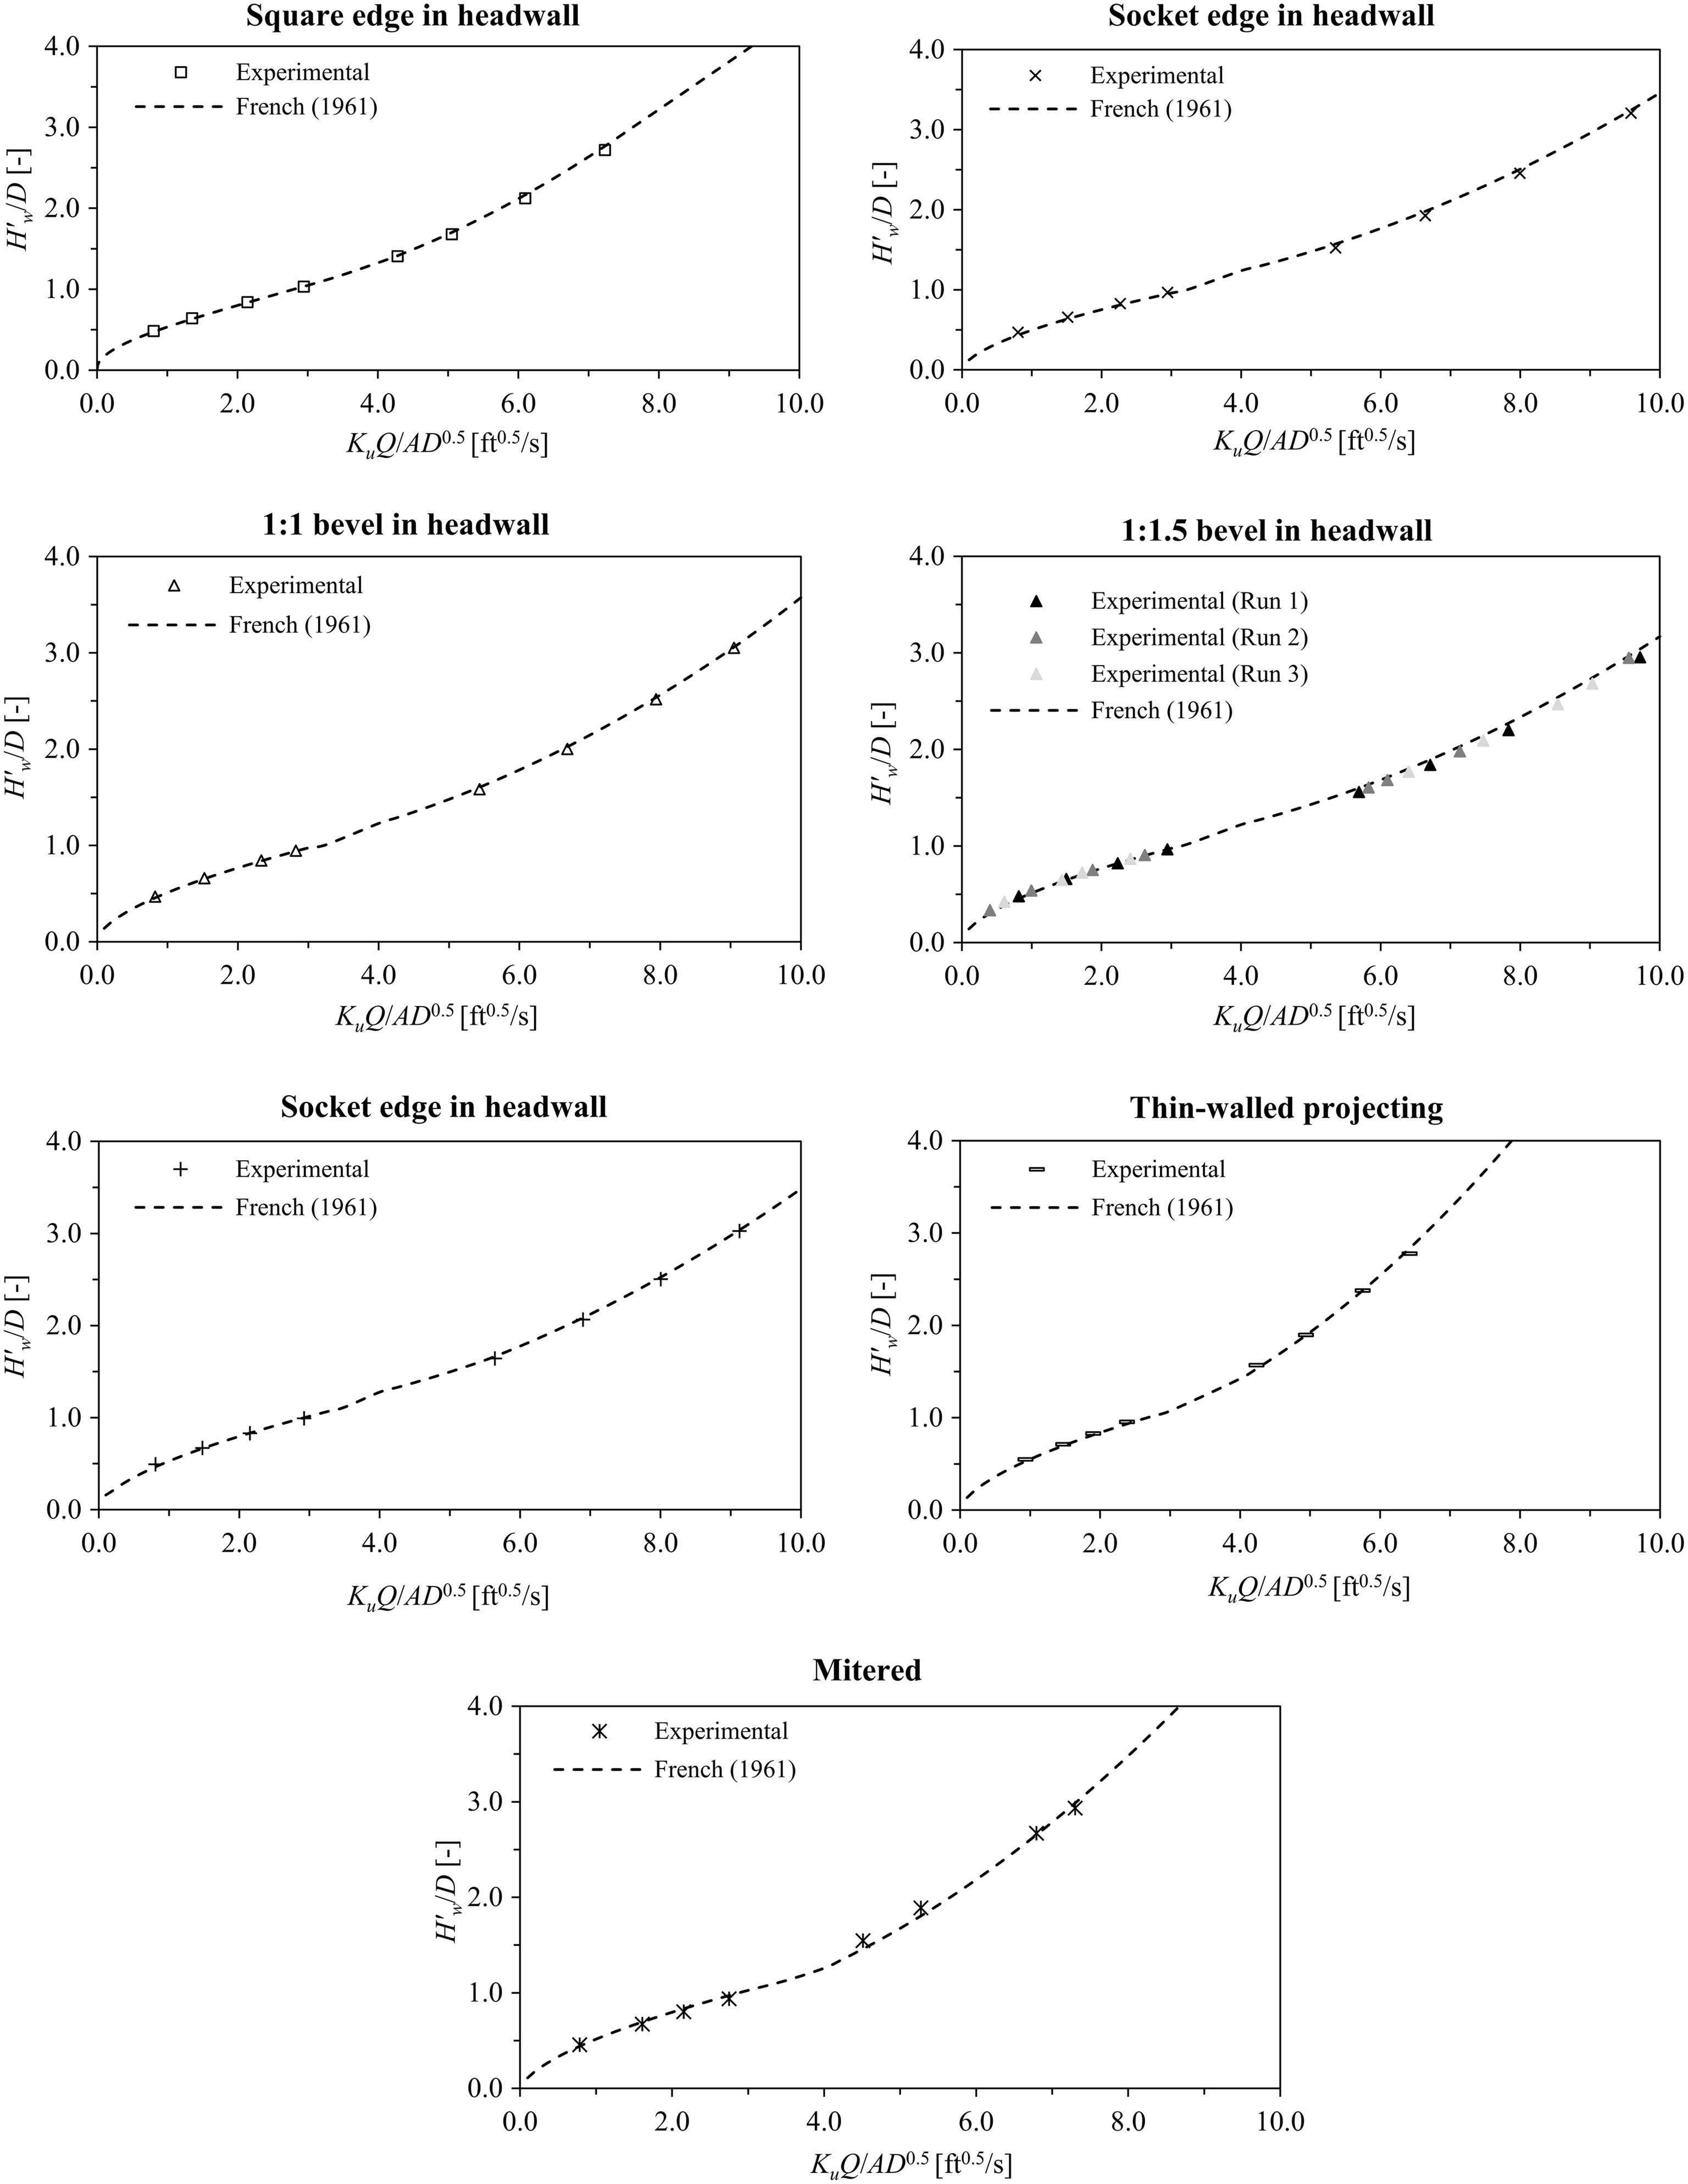
The head-discharge relationships for the unblocked inlets were estimated using Eq. (7), resulting in estimation errors no larger than 0.5% (Table 6). The experimental values were compared to those of French (1961), and it was found that the results agreed within uncertainty for , but gave larger estimation errors for lower relative headwater elevations (Table 7). This difference was attributed to the differences between the inlet invert edges in the two studies, which is consistent with French (1961) where it is reported that flow separation is suppressed in the region around the inlet invert at higher relative headwater elevations. The repeatability tests showed that the regression curves from all three runs using the bevel edge inlet were within the uncertainty of the average regression curve for (Fig. 13).
| Inlet | Avg. estimation error (%) | Max. estimation error (%) | Avg. uncertainty (%) | Max. uncertainty (%) |
|---|---|---|---|---|
| Square edge in headwall | 0.0 | 0.1 | 1.8 | 4.7 |
| Socket edge in headwall | 0.0 | 0.1 | 3.4 | 4.4 |
| bevel in headwall | 0.1 | 0.1 | 3.3 | 4.3 |
| bevel in headwall | 0.0 | 0.0 | 3.7 | 4.6 |
| Socket edge projecting | 0.1 | 0.3 | 3.3 | 4.2 |
| Thin-walled projecting | 0.2 | 0.4 | 2.7 | 3.4 |
| Mitered | 0.2 | 0.5 | 2.7 | 3.7 |
Note: Estimation error was calculated as the percentage difference in between experimental measurement and Eq. (7).
| Inlet | Avg. estimation error (%) | Max. estimation error (%) | Avg. uncertainty (%) | Max. uncertainty (%) |
|---|---|---|---|---|
| Square edge in headwall | 0.5 | 1.7 | 2.7 | 4.6 |
| Socket edge in headwall | 0.2 | 4.0 | 2.7 | 4.7 |
| bevel in headwall | 0.1 | 2.7 | 2.7 | 4.6 |
| bevel in headwall | 0.7 | 5.1 | 2.6 | 4.5 |
| Socket edge projecting | 0.9 | 5.7 | 2.7 | 4.6 |
| Thin-walled projecting | 0.2 | 1.3 | 2.8 | 4.7 |
| Mitered | 1.0 | 9.6 | 4.9 | 8.9 |
Blockage Ratio Effects
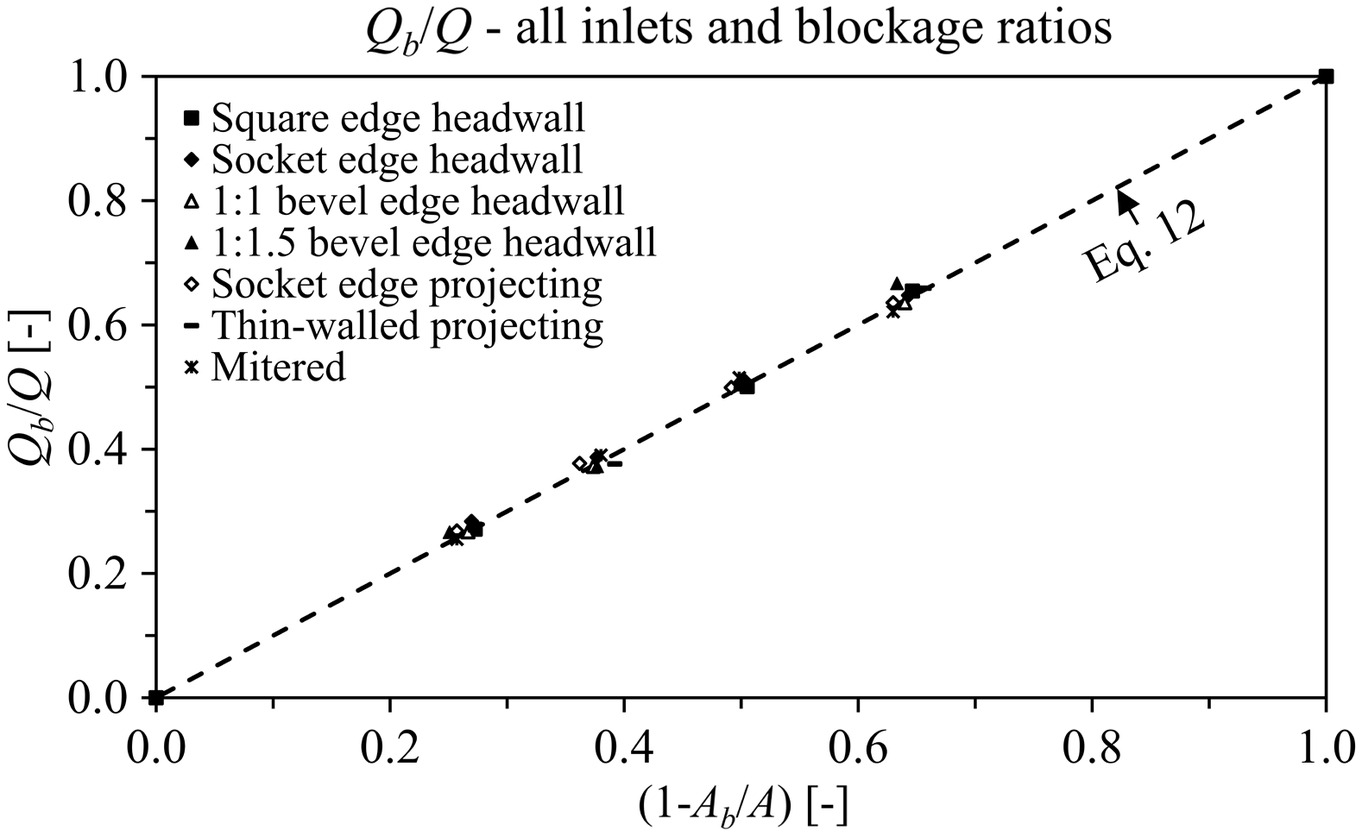
For the blockage ratio experiments, it was found that increased rapidly from and converged to an approximately constant value for for all inlets, showing a clear difference between unsubmerged (type 1) and submerged (type 5) inlet conditions. Analysis of the results showed that the average submerged (type 5) ratio could be expressed as a linear function of (), within uncertainty. The results are shown in Fig. 14 and Table 8
(12)
| Inlet | Avg. [Eq. (12)] estimation error (%) | Max. [Eq. (12)] estimation error (%) | Avg. uncertainty (%) | Max. uncertainty (%) |
|---|---|---|---|---|
| Square edge headwall | 0.5 | 1.3 | 6.5 | 6.6 |
| Socket edge headwall | 1.4 | 5.3 | 7.9 | 8.5 |
| bevel headwall | 0.6 | 1.4 | 7.2 | 8.4 |
| bevel headwall | 2.1 | 6.2 | 8.4 | 9.0 |
| Socket edge projecting | 1.7 | 4.5 | 7.5 | 8.2 |
| Thin-walled projecting | 1.2 | 4.0 | 6.1 | 6.5 |
| Mitered (DS) | 1.8 | 3.3 | 4.5 | 4.8 |
Note: Estimation error was calculated as the absolute percentage difference between the estimated and experimental ratios.
Blockage Shape and Roughness Effects
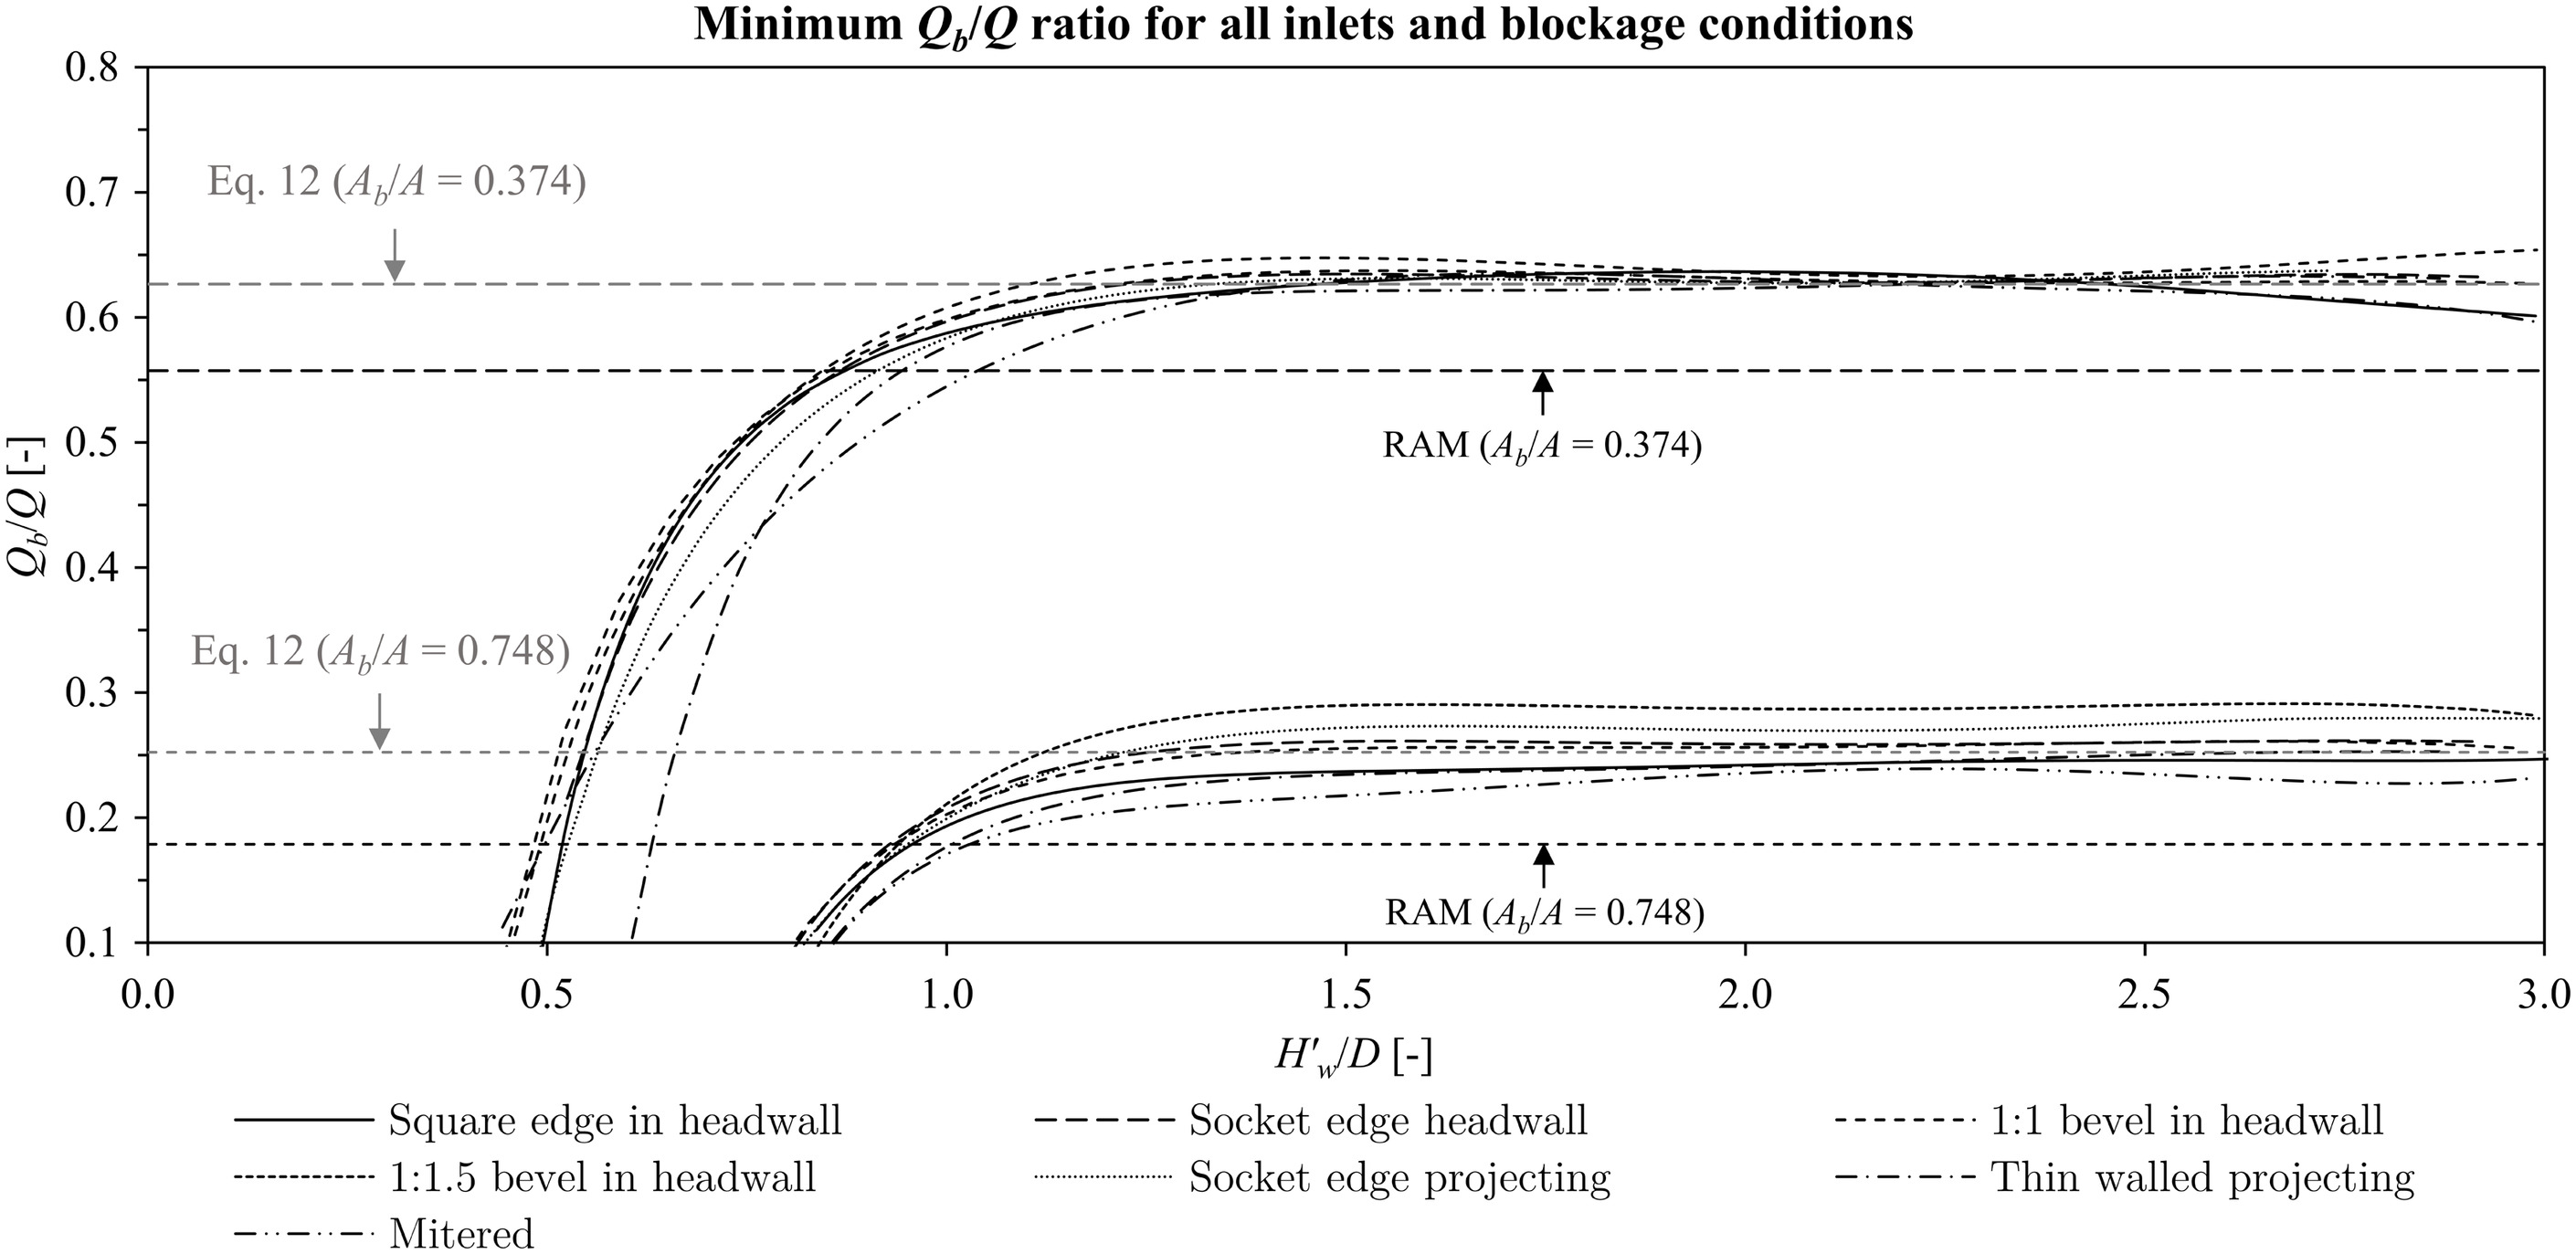
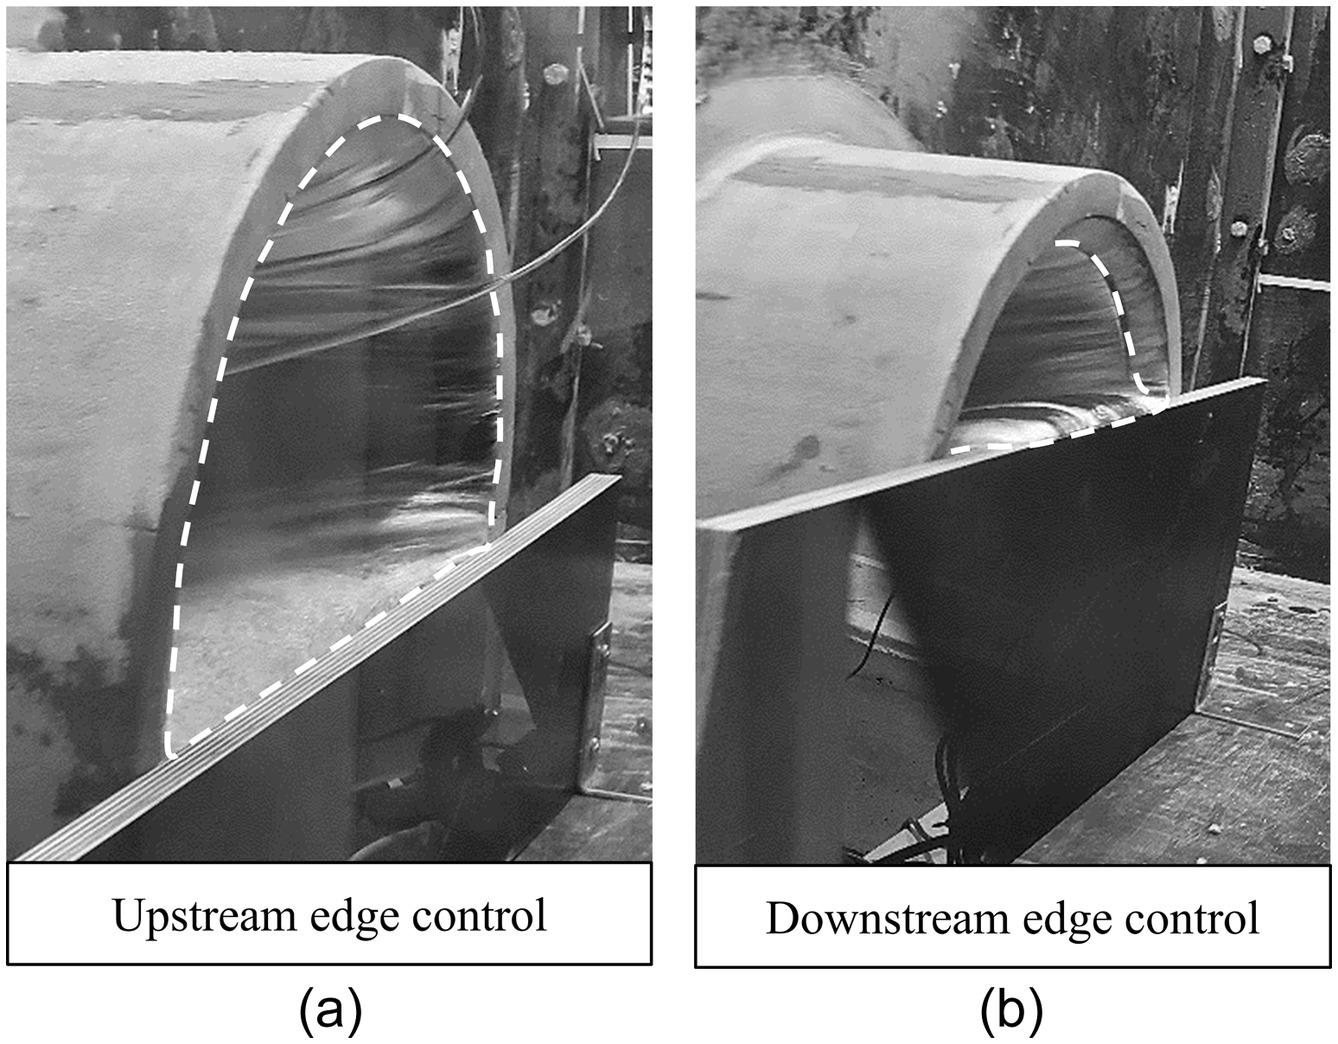
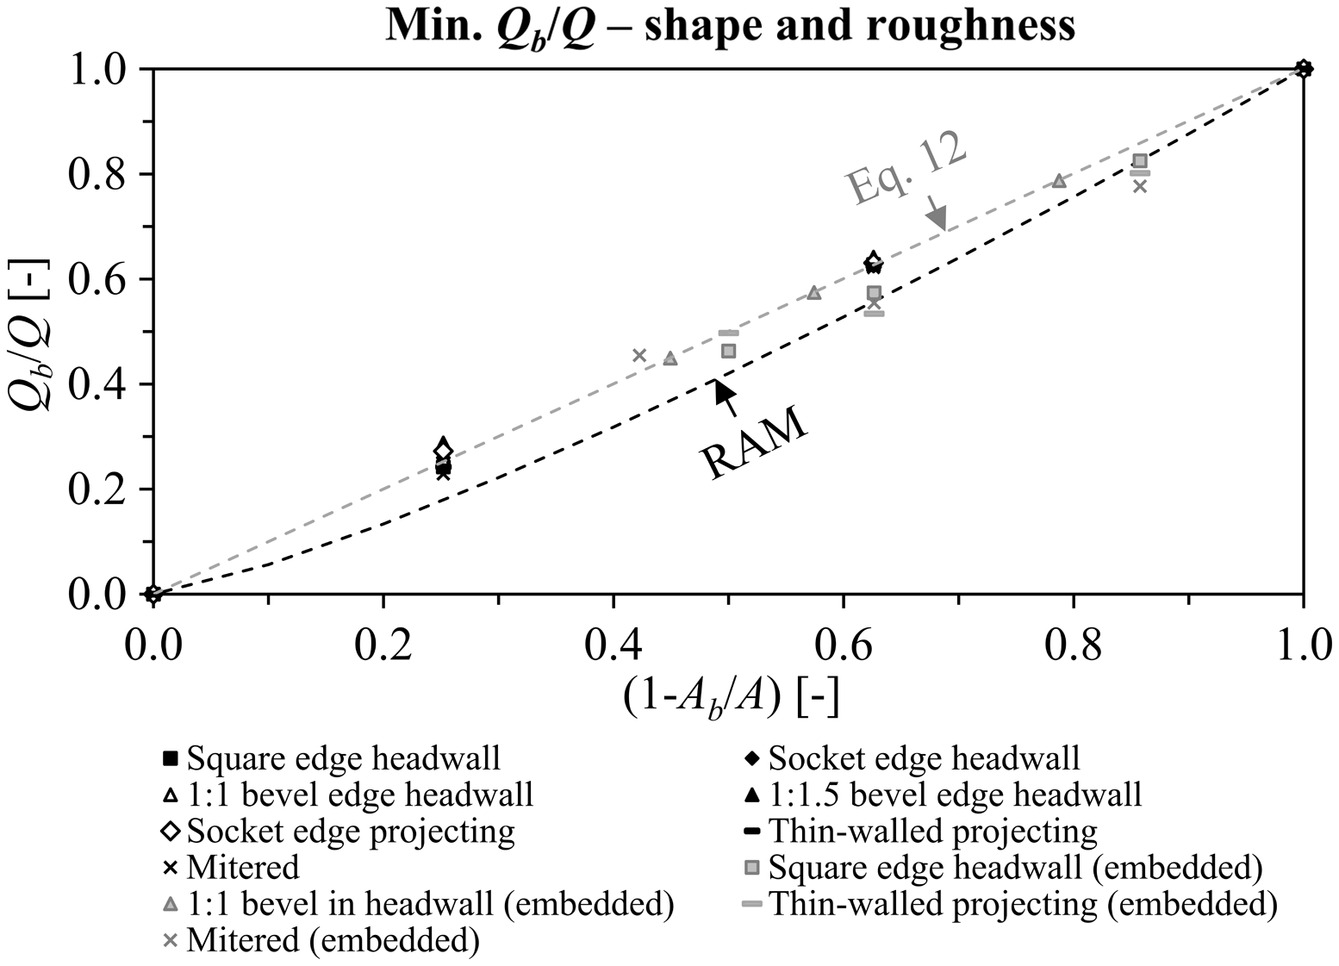
For the blockage shape and roughness experiments, it was found that the more efficient inlets yielded higher ratios for both the average, minimum, and maximum ratios, but this trend was only significant for . Fig. 15 shows the minimum ratio for all inlets and blockage conditions. During the experiments, it was observed that for the socket and bevel inlets, the control section moved from the upstream edge for to the downstream inlet edge for , consistent with increased efficiency (French 1961). The two conditions are shown in Fig. 16. However, the experimental data are not sufficient to accurately determine the blockage ratio required for control edge change. No significant differences were found between the maximum, minimum, and average ratios for any of the tested inlets, indicating insignificant shape and roughness effects (Table 9). These findings are in general agreement with the results of French (1961) where the head-discharge relationship is reported to be mainly influenced by the orientation of the control surface relative to the culvert barrel axis, showing limited variation with upstream factors when using vented inlets. For the mitered inlet, it was found that the DS blockage position yielded the lowest efficiency, indicating a dependency on the location of the blockage element and the cross section area perpendicular to the mitered face, similar to the results for outlet control (type 4 flow).
| Inlet | Avg. | Max. | Min. | |||
|---|---|---|---|---|---|---|
| Square edge headwall | ||||||
| Socket edge headwall | ||||||
| bevel headwall | ||||||
| bevel headwall | ||||||
| Socket edge projecting | ||||||
| Thin-walled projecting | ||||||
| Mitered (DS) | ||||||
Comparison to RAM and Embedded Culverts
The minimum ratios from Table 9 were compared to RAM and the embedded culverts of Tullis et al. (2008). For the mitered inlet, the ratio for the DS position was used. The results are plotted in Figs. 15 and 17, and uncertainty and estimation errors are given in Table 10. The comparison shows that RAM underestimates the experimental ratios, indicating that the method does not account for the increased efficiency associated with changes in cross section shape and control edge location caused by partial blockage (French 1961). The constant value of for the square edge in the headwall inlet in Table 9 also supports this finding since this inlet configuration only has one potential control surface oriented 90° to the culvert barrel axis (French 1961). Eq. (12) significantly underestimates for the bevel and projecting socket edge inlet and overestimates for the mitered inlet for . It should also be noted that only the blockage plates allowed for a blockage element control surface perpendicular to the culvert axis, consistent with the higher ratios found for the shape and roughness experiments, compared to the blockage ratio experiments for (Figs. 14 and 17).
| Inlet | [Eq. (12)] estimation error (%) | (RAM) estimation error (%) | uncertainty (%) | |||
|---|---|---|---|---|---|---|
| Square edge headwall | 3.9 | 11.2 | 26.9 | 4.5 | 5.2 | |
| Socket edge headwall | 14.4 | 35.6 | 5.5 | 5.5 | ||
| bevel headwall | 11.7 | 30.6 | 5.9 | 5.1 | ||
| bevel headwall | 13.2 | 38.0 | 5.5 | 5.7 | ||
| Socket edge projecting | 11.5 | 34.5 | 5.1 | 5.2 | ||
| Thin-walled projecting | 0.1 | 3.9 | 9.2 | 26.5 | 4.4 | 4.1 |
| Mitered (DS) | 0.7 | 9.1 | 10.3 | 22.3 | 4.1 | 4.9 |
| Average (all inlets) | 0.8 | 11.5 | 30.3 | 5.0 | 5.1 | |
Note: Estimation error was calculated as the percentage difference between the estimated and experimental ratios.
The comparisons to embedded culverts show differences from the relationship of Eq. (12) and are generally closer to RAM (Fig. 17). Tullis et al. (2008) did not test the unblocked case, and so the values for embedded culverts were compared to the values from the present study for corresponding inlet configurations. Differences in the experimental setup between the present study and Tullis et al. (2008), such as small differences in inlet edge geometry and the use of vented inlets in the present study are therefore sources of uncertainty. However, it should be noted that the differences between inlet blockage and embedment are small under inlet control (type 1 and 5 flow) compared to under outlet control (type 4 flow) (Figs. 12 and 17).
Uncertainty, Estimation Error, and Scale Effects
Due to the large number of measurements, a full analysis of the relationship between the uncertainties used to determine the uncertainty of the entrance loss coefficients and head-discharge relationships was not included in this study. However, it was generally found that for and , the absolute uncertainty decreased with increasing discharge, leading to higher uncertainty for combinations of less efficient inlets, and higher blockage ratios. For inlet control, it was found that the absolute uncertainty of decreased with increasing blockage ratio. Previous studies have generally not included the uncertainty of the results (French 1955, 1961; Idelchik 1986), and further work on the application of the method of Kline and McClintock (1953) or similar methods to the different USGS flow types is therefore warranted.
The relative estimation error and experimental uncertainty were compared for the full sets of entrance loss coefficients and the head-discharge relationships, and it was found that 56 of the 1,272 entrance loss coefficients (4.4%) and 5 of the 1,760 measurements (0.3%) had estimation errors larger than the estimated uncertainty. The larger errors were generally found for single datapoints in each experiment and at different values of and . It was therefore assumed that these errors were related to transient flow conditions and/or errors with the measurement or data registration equipment. These datapoints were therefore removed from the data sets before the analysis. For the reduced data set, the estimated uncertainty accounted for the observed variations in entrance loss coefficients and head-discharge relationships (Table 11). While the unblocked inlet control experiments showed significant deviation from French (1961) at low headwater elevations (type 1 flow), only data in the range were used to determine the ratio. It is therefore argued that the results of the present study are of similar validity to those that form the basis for the existing minimum performance methods (French 1955, 1961; Schall et al. 2012).
| Inlet | Avg. estimation errora, b (%) | Max. estimation errora, b (%) | Avg. uncertainty (%) | Max. uncertainty (%) |
|---|---|---|---|---|
| Outlet control (type 4 flow) (1,272 measurements) | ||||
| Square edge in headwall | 1.1 | 6.1 | 4.3 | 7.5 |
| Socket edge in headwall | 1.7 | 4.0 | 6.1 | 9.3 |
| bevel in headwall | 2.3 | 4.4 | 5.3 | 6.0 |
| bevel in headwall | 3.1 | 5.3 | 7.2 | 10.4 |
| Socket edge projecting | 1.0 | 3.0 | 5.6 | 9.0 |
| Thin-walled projecting | 1.8 | 3.7 | 6.1 | 9.5 |
| Mitered | 2.5 | 4.9 | 5.2 | 10.1 |
| Inlet control (type 1 and 5 flow) (1,760 measurements) | ||||
| Square edge in headwall | 0.0 | 0.7 | 1.9 | 4.7 |
| Socket edge in headwall | 0.1 | 1.4 | 2.0 | 4.4 |
| bevel in headwall | 0.1 | 0.9 | 2.0 | 4.3 |
| bevel in headwall | 0.1 | 0.6 | 2.0 | 4.6 |
| Socket edge projecting | 0.1 | 1.3 | 1.9 | 4.2 |
| Thin-walled projecting | 0.1 | 0.6 | 1.8 | 3.3 |
| Mitered | 0.2 | 0.4 | 1.9 | 2.5 |
a
For outlet control (USGS type 4 flow), the estimation error was calculated as the average and maximum percentage difference between all measurements and the average or value for each experiment.
b
For inlet control (USGS type 1 and 5 flow) the estimation error was calculated as the average and maximum percentage difference between the measured value of and the value estimated using Eq. (7).
For the outlet control (type 4 flow) experiments, the minimum culvert barrel Reynolds number was found to be , indicating Reynolds invariance of and for all experiments (Idelchik 1986). Other potential scale effects were not evaluated, but since the average and could be determined within the uncertainty for each measurement for the reduced data set, it is argued that effects of approach flow conditions, entrance length, and scale effects were not significant. For the inlet control experiments, the use of vented inlets is consistent with previous experimental setups that form the basis of existing minimum performance methods (French 1955, 1961; Schall et al. 2012). While scale effects and effects of the approach-to-culvert contraction ratio and entrance length cannot be ruled out completely, it is argued that the results are of similar validity to those used in existing design frameworks.
Application of Results for Different USGS Flow Types
Given the variation in in-situ blockage conditions, it is recommended to use the maximum values, and minimum values as a conservative estimate of blockage effects. For outlet control conditions, the present study has covered outlet control with submerged inlet and outlet (type 4 flow), and the values are valid for pressure flow conditions (type 4, 6, and 7 flow) (Schall et al. 2012). For these flow conditions, bottom-up blockage conditions can be estimated similarly as for ELM, using values of and Eq. (5). As has been shown to vary considerably for , the values are not valid for outlet control flow with an unsubmerged inlet (type 2 and 3 flow) (Smith and Oak 1995; Tullis et al. 2008), and further study of blockage effects for these flow types is warranted. For inlet control, the present study has covered both unsubmerged and submerged conditions (type 1 and 5 flow), and bottom-up blockage effects can be estimated similarly to RAM.
In this study, the blockage element was treated as part of the inlet, and it was found that the results could be accurately described using a constant value for the entrance loss coefficient and 5th-degree polynomial equations for the head-discharge relationship, similar to existing design methods for unblocked culverts. The present study has therefore not investigated the classification of novel flow types specific to culverts with bottom-up inlet blockages, but the large number of flow types identified for gated culverts in Cantero-Chinchilla et al. (2023) indicates that there may also exist flow types beyond type 1–7 for this condition. In particular, unsubmerged outlet control (type 2 or 3 flow) for an unblocked culvert might change to inlet control (type 1 or 5) due to the presence of bottom-up blockage when the flow depth in the culvert barrel is lower than the blockage height. Further work on the classification of flow types for culverts with bottom-up blockage is therefore warranted.
The blocked entrance loss coefficients and discharge ratios were determined for comparison to ELM and RAM and affected the headwater elevation in different ways. Under outlet control conditions, the entrance head loss is one of several head losses that influence the headwater elevation. The effect of on the headwater elevation will therefore vary with the culvert design, but given that can approach values two to three orders of magnitude higher than for unblocked inlets, it can be expected that entrance losses will constitute a large fraction of the total head loss at higher blockage ratios. For inlet control (type 1 and 5 flow), the ratio modifies the head-discharge relationship directly, resulting in significantly higher headwater elevations for a given discharge.
Conclusion
This study provides empirical data for comparison to ELM and RAM and accounts for blockage ratio and shape effects for bottom-up inlet blockage conditions. Based on the results, the following conclusions are made:
Outlet Control (Type 4 Flow)
1.
Hydraulically efficient inlets retain lower entrance loss coefficients with increasing degree of blockage, and the blockage shape has a significant effect on the entrance head loss. No significant blockage roughness effects were found.
2.
ELM does not account for observed increases in efficiency with increasing blockage ratio and overestimates the experimental entrance loss coefficients by up to 124%. The differences are larger for efficient inlets and increase with the blockage ratio.
3.
Embedded culverts yield significantly lower entrance loss coefficients than partially blocked inlets for similar inlet configurations and blockage ratios.
4.
The entrance loss coefficients varied with the approach flow conditions, but it was found that the average value could generally be determined within the estimated uncertainty of all measurements. It was therefore concluded that the average loss coefficients were not significantly influenced by the approach-to-culvert contraction ratio, entrance length, or scale effects.
Inlet Control (Type 1 and 5 Flow)
1.
The ratio is largely similar for the tested inlets, but highly efficient inlets yield somewhat more efficient performance at higher blockage ratios. No significant blockage shape or roughness effects were found.
2.
RAM does not account for observed increases in efficiency with increasing blockage ratio, and underestimates the experimental ratios by up to 38% under type 5 flow conditions. The increase in efficiency is larger for hydraulically efficient inlets and increases with increasing blockage ratio.
3.
Under type 5 flow conditions, embedded culverts exhibit hydraulic performance largely similar to partially blocked culvert inlets.
4.
The use of exposed invert edges in the unblocked experiments resulted in higher values than in previous studies that used embedded invert edges for type 1 flow, but this effect did not significantly affect flow under partially blocked conditions.
The main finding of this study is the general verification of the ELM and RAM; that hydraulically efficient inlets are less affected by blockage, illustrating the importance of the inlet configuration and the evaluation of potential blockage effects in hydraulic culvert design. However, ELM and RAM do not account for observed increases in hydraulic efficiency with increased blockage ratio and are conservative for the range of idealized bottom-up blockage conditions used in this study. Due to the large variation in in situ blockage conditions, it is recommended to use the maximum estimates for and the minimum estimates for as a conservative approach. Application of the results of this study, as well as ELM, RAM, and top-down blockage effects estimated based on gated culverts depend on the ability to estimate the blockage ratio for a given design flood discharge. The results indicate that the blockage ratio is the most important blockage factor, and further research into the relationship between blockage ratio, catchment conditions, and flood magnitude is warranted. Further study into type 2 and 3 flow and flow classification for bottom-up blocked inlets, the uncertainty of the different USGS flow types, and the effects of porous plug blockage is also warranted.
Notation
The following symbols are used in this paper:
- cross section area ();
- cross section area of the unblocked part of the inlet ();
- subscript indicating blocked condition;
- inlet control regression coefficient;
- culvert rise/diameter (m);
- culvert rise for the unblocked part of the inlet (m);
- blockage element rock size (m);
- Froude number;
- Darcy friction factor;
- gravitational acceleration ();
- total head (m);
- headwater elevation relative to the inlet section invert (m);
- effective headwater elevation relative to the inlet section invert (m);
- unit conversion coefficient ();
- entrance loss coefficient;
- culvert length (m);
- downstream distance from inlet section to critical section (m);
- Manning’s roughness coefficient ();
- dependent model parameter;
- independent model parameter;
- discharge ();
- Reynolds number;
- culvert barrel slope ();
- tailwater elevation (m);
- culvert wall thickness (m);
- uncertainty interval;
- average flow velocity ();
- piezometric head (m);
- critical flow depth (m);
- blockage regression coefficient;
- entrance head loss (m);
- horizontal distance (m);
- vertical distance (m);
- radial inlet edge width (m);
- longitudinal inlet edge length (m); and
- culvert barrel roughness height (m).
Supplemental Materials
File (supplemental_materials_jidedh.ireng-10219_sellevold.pdf)
- Download
- 433.57 KB
Appendix. Uncertainty Intervals of Physical Model Parameters
The accuracy of the measuring equipment and uncertainty intervals for the model parameters used to calculate uncertainty for the entrance loss coefficients and head-discharge relationships are given in Table 12. Accuracies given as percentages indicate the percentage of the measured value, which varied between measurements.
| Parameter | Equipment | Location | Accuracy |
|---|---|---|---|
| Flow rate | Siemens SITRANS FM MAG 5000 | Water supply pipes | a |
| Headwater elevation | Millimeter scale | 1.125 m upstream from the inlet face | b |
| Piezometric head in the culvert barrel | WIKA S-11 pressure gauge | 2.55, 3.30, 4.05, and 4.80 m downstream from the inlet face | a |
| Pressure gauge vertical location | OnLine 3D G laser level and measuring tape | Culvert barrel | |
| Pressure gauge horizontal location | OnLine 3D G laser level and measuring tape | Culvert barrel | |
| Pipe diameter | Tape measurement | Inlet | |
| Assumed | Pressure gauge sections | ||
| Head tank width | Tape measurement | 1.125 m upstream from the inlet face | |
| Blockage height | Tape measurement | Inlet section | |
| Pipe roughness height | — | — | |
| Water temperature | Thermometer | Head tank |
a
The accuracy of the measurement equipment is given as the percentage of the measured values for each measurement.
b
The headwater elevation was measured using the inlet invert as a datum.
Data Availability Statement
Some or all data, models, or code that support the findings of this study are available from the corresponding author upon reasonable request: time-averaged data for all hydraulic parameters used to determine the entrance loss coefficients and head-discharge relationships of this study.
Acknowledgments
This research was funded in part by The Research Council of Norway Project 312001. The authors also want to thank the Norwegian Public Roads Administration E39 Coastal Highway Route project for partial funding of this study. For the purpose of open access, the author has applied a CC BY 4.0 copyright license to any Author Accepted Manuscript (AAM) version arising from this submission. Thanks are also extended to the technicians and research assistants Tobias Thorvaldsen, Madeley Guerrero, Sanyam Ghimire, and Jan Hřebřina who worked on the physical model and to Professor Blake Tullis, Associate Professor Valentin Heller, and Mr. Grant Witheridge, who provided necessary information and useful suggestions. The authors confirm that there are no conflicts of interest.
Author contributions: Joakim Sellevold designed the model and experimental procedures used in the present study, with contributions from Elena Pummer, Nils Rüther, and Oddbjørn Bruland. Elena Pummer also contributed with the supervision of the study and helped with data analysis. Joakim Sellevold conducted the experiments with the help of research assistants, conducted the data analysis, and wrote the initial manuscript, which was reviewed by Harald Norem, Oddbjørn Bruland, and Elena Pummer.
References
Bodhaine, G. L. 1968. “Measurement of peak discharge at culverts by indirect methods.” In Techniques of water-resources investigations of the United States geological survey. Washington, DC: USGS.
Bradley, J. B., D. L. Richards, and C. D. Bahner. 2005. Debris control structures, evaluation and countermeasures. 3rd ed. Washington, DC: DOT.
Cafferata, P., M. W. Spittler, G. Bundros, and S. Flanagan. 2004. Designing watercourse crossings for passage of 100-year flood flows, wood and sediment. Washington, DC: Dept. of Forestry & Fire Protection.
Cantero-Chinchilla, F. N., G. Belaud, O. Castro-Orgaz, and L. Mateos. 2023. “Steady flow through gated circular culverts: Hydraulic operation and experiments.” J. Irrig. Drain. Eng. 149 (7): 04023012. https://doi.org/10.1061/JIDEDH.IRENG-9974.
Chin, D. A. 2013. “Hydraulic analysis and design of pipe culverts: USGS versus FHWA.” J. Hydraul. Eng. 139 (8): 886–893. https://doi.org/10.1061/(ASCE)HY.1943-7900.0000748.
French, J. 1955. First progress report on hydraulics of short pipes—Hydraulic characteristics of commonly used pipe entrances. Washington, DC: US Department of Commerce.
French, J. 1956. Second progress report on hydraulics of culverts—Pressure and resistance characteristics of a model pipe culvert. Washington, DC: US Department of Commerce.
French, J. 1957. Third progress report on hydraulic of culverts—Effects of approach channel characteristics on model pipe culvert operation. Washington, DC: US Department of Commerce.
French, J. 1961. Fourth progress report on hydraulics of culverts—Hydraulics of improved inlet structures for pipe culverts. Washington, DC: US Department of Commerce.
Goodridge, W. H. 2009. “Sediment transport impacts upon culvert hydraulics.” Doctoral thesis, Dept. of Civil and Environmental Engineering, Utah State Univ. Merrill-Cazier Library.
Günal, M., A. Y. Günal, and K. Osman. 2019. “Simulation of blockage effects on scouring downstream of box culverts under unsteady flow conditions.” Int. J. Environ. Sci. Technol. 16 (Jan): 5305–5310. https://doi.org/10.1007/s13762-019-02461-w.
Ho, H.-C. 2010. “Investigation of unsteady and non-uniform flow and sediment transport characteristics at culvert sites.” Doctoral thesis, Dept. of Civil and Environmental Engineering, Univ. of Iowa.
Horowitz, M., and E. Matys. 2015. South Florida Water Management District dimensional analysis-based ratings for gated circular and box culverts. Holden, MA: Alden Research Laboratory.
Idelchik, I. E. 1986. Handbook of hydraulic resistance. 2nd ed. New York: Springer.
Iqbal, U., J. Barthelemy, P. Perez, J. Cooper, and W. Li. 2021. “A scaled physical model study of culvert blockage exploring complex relationships between influential factors.” Australas. J. Water Resour. 27 (1): 191–204. https://doi.org/10.1080/13241583.2021.1996679.
Jaeger, R., and T. Lucke. 2016. “Investigating the relationship between rainfall intensity, catchment vegetation and debris mobility.” Int. J. Geomate 12 (33): 22–29. https://doi.org/10.21660/2017.33.2543.
Kline, S. J., and F. A. McClintock. 1953. “Describing uncertainties in single-sample experiments.” Mech. Eng. 75 (Jun): 3–8.
Kolerski, T., and P. Wielgat. 2014. “Velocity field characteristics at the inlet to a pipe culvert.” Arch. Hydroeng. Environ. Mech. 61 (3–4): 127–140. https://doi.org/10.1515/heem-2015-0008.
Kramer, M., W. L. Peirson, R. French, and G. P. Smith. 2016. “A physical model study of culvert blockage by large urban debris.” Australas. J. Water Resour. 19 (2): 127–133. https://doi.org/10.1080/13241583.2015.1116184.
Kranc, S. C., M. W. Anderson, and A. A. Villalon. 1990. An investigation of the hydraulic performance of culvert grates. Tampa, FL: Univ. of South Florida.
Miranzadeh, A., A. Keshavarzi, and H. Hamidifar. 2022. “Blockage of box-shaped and circular culverts under flood event conditions: A laboratory investigation.” Int. J. River Basin Manage. 2022 (Apr): 1–10. https://doi.org/10.1080/15715124.2022.2064483.
Ollett, P., B. Syme, and P. Ryan. 2017. “Australian Rainfall and Runoff guidance on blockage of hydraulic structures: Numerical implementation and three case studies.” J. Hydrol. 56 (2): 109–122.
Rigby, E. H., M. J. Boyd, S. Roso, P. Silveri, and A. Davis. 2002. “Causes and effects of culvert blockage during large storms.” In Proc., 9th Int. Conf. on Urban Drainage. Reston, VA: ASCE. https://doi.org/10.1061/40644(2002)298.
Rocha, H. S., P. A. A. Marques, A. P. Camargo, J. A. Frizzone, and E. Saretta. 2017. “Internal surface roughness of plastic pipes for irrigation.” R. Bras. Eng. Agric. Ambiental 21 (3): 143–149. https://doi.org/10.1590/1807-1929/agriambi.v21n3p143-149.
Rowley, K. J. 2014. “Sediment transport conditions near culverts.” Master’s thesis, Dept. of Civil and Environmental Engineering, Brigham Young Univ.
Schall, J. D., P. L. Thompson, S. M. Zerges, R. T. Kilgore, and J. L. Morris. 2012. Hydraulic design of highway culverts. Washington, DC: Federal Highway Administration.
Smith, C. D., and A. G. Oak. 1995. “Culvert inlet efficiency.” Can. J. Civ. Eng. 22 (Jan): 611–616. https://doi.org/10.1139/l95-069.
Sorourian, S., A. Keshavarzi, and J. E. Ball. 2015. “Scour at partially blocked box-culverts under steady flow.” Water Manage. 169 (6): 247–259. https://doi.org/10.1680/jwama.15.00019.
Swamee, P. K., and A. K. Jain. 1976. “Explicit equations for pipe-flow problems.” J. Hydraul. Div. 102 (5): 657–664. https://doi.org/10.1061/JYCEAJ.0004542.
Taha, N., M. M. El-Feky, A. A. El-Saiad, M. Zelenakova, F. Vranay, and I. Fathy. 2020. “Study of scour characteristics downstream of partially-blocked circular culverts.” Water 12 (5): 2845. https://doi.org/10.3390/w12102845.
Tullis, B. P., D. S. Anderson, and S. C. Robinson. 2008. “Entrance loss coefficients and inlet control head-discharge relationships for buried-invert culverts.” J. Irrig. Drain. Eng. 134 (6): 831–839. https://doi.org/10.1061/(ASCE)0733-9437(2008)134:6(831).
Tullis, B. P., S. C. Robinson, and J. C. Young. 2005. Hydraulic characteristics of buried-invert elliptical culverts, 105–112. Washington, DC: Transportation Research Board.
Weeks, B., A. Barthelmess, E. Rigby, G. Witheridge, and R. Adamson. 2009. Project 11: Blockage of hydraulic structures. Stage 1 report. Barton, ACT, Australia: Engineers Australia.
Weeks, B., and T. Rigby. 2016. “Blockage of hydraulic structures.” In Australian rainfall & runoff—A guide to flood estimation, edited by J. E. Ball. Barton, ACT, Australia: Engineers Australia.
White, F. M. 2016. Fluid mechanics, eight edition in SI-units. 8th ed. New York: McGraw-Hill.
Witheridge, G. M. 2009. Hydraulic analysis of the debris blockage of culvert inlets. Ferny Hills, QLD, Australia: Catchments & Creek.
Zeng, J., Z. Rakib, M. Ansar, S. Hajimirzaie, and S. Chen. 2020. “Application of hybrid flow data and dimensional analysis to gated-culvert flow estimation.” J. Irrig. Drain. Eng. 146 (9): 04020026. https://doi.org/10.1061/(ASCE)IR.1943-4774.0001497.
Information & Authors
Information
Published In

Journal of Irrigation and Drainage Engineering
Volume 150 • Issue 2 • April 2024
Copyright
This work is made available under the terms of the Creative Commons Attribution 4.0 International license, https://creativecommons.org/licenses/by/4.0/.
History
Received: Jun 13, 2023
Accepted: Oct 30, 2023
Published online: Dec 20, 2023
Published in print: Apr 1, 2024
Discussion open until: May 20, 2024
Authors
Metrics & Citations
Metrics
Citations
Download citation
If you have the appropriate software installed, you can download article citation data to the citation manager of your choice. Simply select your manager software from the list below and click Download.